Article

A Building Energy Management System Based on an Equivalent Electric Circuit Model

1
Department of Naval, Electrical, Electronic and Telecommunication Engineering, University of Genoa, Savona Campus, Via Magliotto 2, 17100 Savona, Italy
2
Department of Informatics, Bioengineering, Robotics and Systems Engineering, University of Genoa, Savona Campus, Via Magliotto 2, 17100 Savona, Italy
*
Author to whom correspondence should be addressed.
Energies 2020, 13(7), 1689; https://doi.org/10.3390/en13071689
Submission received: 31 January 2020 / Revised: 29 March 2020 / Accepted: 31 March 2020 / Published: 3 April 2020
(This article belongs to the Special Issue Optimal Control of Hybrid Systems and Renewable Energies)

Abstract

:
In recent decades, many EU and national regulations have been issued in order to increase the energy efficiency in different sectors and, consequently, to reduce environmental pollution. In the building sector, energy efficiency interventions are usually based on the use of innovative insulated materials and on the installation of cogeneration and tri-generation units, as well as solar technologies. New and retrofitted buildings are more and more commonly being called “smart buildings”, since they are characterized by the installation of electric and thermal power generation units, energy storage systems, and flexible loads; the presence of such technologies determines the necessity of installing Building Energy Management Systems (BEMSs), which are used to optimally manage their operation. The present paper proposes a BEMS for a smart building, equipped with plants based on renewables (photovoltaics, solar thermal panels, and geothermal heat pump), where the heating and cooling demand are satisfied by a Heating, Ventilation and Air Conditioning System (HVAC) fed by a geothermal heat pump. The developed BEMS is composed of two different modules: an optimization tool used to optimally manage the HVAC plant, in order to guarantee a desired level of comfort inside rooms, and a simulation tool, based on an equivalent electric circuit model and used to evaluate the thermal dynamic behavior of the building. The paper describes the two modules and shows the main results of the validation phase that has been conducted on a real test-case represented by the Smart Energy Building (SEB) located at the Savona Campus of the University of Genoa, Italy.

1. Introduction

All over the world, several countries are introducing low carbon and energy-saving policies to reduce the impact of the greenhouse gas effect and to face the growing energy demand of end-users. This allows for the development of more efficient energy systems and the spread of Distributed Generation (DG) technologies. Renewables sources (RES), co(tri)generation plants, and energy storage units, both thermal and electrical, characterize DG installations [1]. Moreover, smart grid and microgrid projects arise to integrate sustainable energy generation units, flexible loads, smart mobility systems and complex ICT infrastructures in the industrial, tertiary, and residential sectors. However, the dissemination of non-programmable and small-size dynamic generators is leading to balance and operational issues for distribution grids [2]. Consequently, it becomes necessary to develop software tools, called “Energy Management Systems” (EMSs), which can be used to optimally operate the aforementioned infrastructures with the aim of satisfying the energy needs of end-users without compromising the safe operation of electric and thermal networks. In such a context, flexibility is a key factor that both generation and consumption units have to guarantee: first of all, this implies that dispatchable power plants have to be able to follow the demand profile of end-users and the aleatory production of non-programmable renewable sources; secondly, demand response strategies have to be investigated to manage flexible loads [3].
The implementation of energy efficiency interventions, also based on the installation of the aforesaid technologies, becomes a challenging solution in commercial and residential buildings, which are one of the most energy-consuming systems: for instance, in the US, Heating, Ventilation and Air Conditioning Systems (HVAC) represent 27% of the overall consumed energy [4], and contribute to 30% of the total global carbon dioxide emissions [5]. Consequently, buildings can play a key role, both as flexible loads and in the reduction of CO2 production, if sustainable and cost-effective technological solutions are taken into account during the design and construction phase, as well as in the case of retrofitting. Smart new-built or retrofitted buildings are operated daily by software tools called “Building Energy Management Systems” (BEMSs), which are based on optimization models characterized by different objectives: the minimization of operating costs and/or of carbon dioxide emissions, the maximization of self-consumption to take full advantage of local energy production from renewable sources, etc. [6]. One of the main goal of BEMSs is that of guaranteeing an acceptable comfort level to building occupants through a cost-effective management of HVAC plants and other equipment (lighting systems, waste disposal, rainwater harvesting, etc.) [7,8,9]. Moreover, it is important to note that nowadays a progressively higher number of buildings are assembled in clusters: in new residential and industrial districts, it is a good practice to install centralized heating and cooling systems based on high efficiency cogeneration and trigeneration technologies. By using this method, thermal and electrical networks, fed by the aforesaid systems, provide energy to the different buildings and, in many cases, renewable energy power plants (solar and wind) and storage systems are installed too. In these cases, the district becomes a “sustainable energy district” where each building is equipped with a BEMS and the whole energy infrastructure is managed by a centralized EMS; obviously, a close correlation among BEMSs and the EMS exists.
In literature, two main approaches are presented for the formalization of a BEMS: day-ahead and real-time management [10]. In the first case, the optimization tool determines the scheduling of dispatchable generation units and flexible loads for each hour of the following day on the basis of the forecast of loads (thermal and electrical) and renewable sources. In the second case, the optimization algorithms are often based on the model predictive control (MPC) technique [11,12,13,14].
Another important aspect is related to the energy analysis and thermal load simulation of a building. In fact, optimization models generally include the system model as a constraint; however, this should be accurate in order to represent the real system but also simple to be embedded in a decision problem. In literature, different approaches and tools are proposed to simulate a building in steady-state and dynamic conditions. In most cases, researchers use commercial software tools, which are complex environments able to model each space of a building in a very detailed way; the most used pieces of software are EnergyPlus, DesignBuilder, and IES. In [15], Ogunsola et al. use EnergyPlus to simulate a data-set in order to validate a reduced order thermal load model; in [16], the author estimate the overall thermal load of a Near to Zero Emissions Building (NZEB) in Lebanon for residential application using DesignBuilder; while the detailed thermal load of an educational building in the UK has been simulated by the authors with IES in [17]. Generally, the 3D model of the building is analyzed and each structural element (walls, ceilings, etc.) is modeled. A very detailed thermal analysis can be conducted but computational times become very long; consequently, these tools cannot be easily integrated within BEMSs, above all those which are real-time executed.
For the reasons explained above, many researchers prefer to develop tools which are usually based on the lumped-parameter theory, which permits to model a complex system, such as a building, as an “elementary system”, i.e., a spatial entity, contained within a control volume delimited by a control surface [18]. The elementary system can exchange mass and/or energy (heat and/or work) with the environment and is described by state variables that depend on both the time and only a spatial coordinate, if a one-dimensional flow modelling is chosen. In this way, a building can be modelled using different levels of detail, as a one equivalent room or as a set of equivalent rooms with each one representing similar spaces as a whole, [19,20], not considering each single room and its interaction with the near ones. These approaches avoid computational complexity issues but are less accurate for the comfort evaluation of every single ambient [21]; they are more suitable to compute the building flexibility in demand response applications [22], in which the evaluation of the state of comfort in each room is not so necessary with respect to other aspects, such as the management of flexible loads and power plants.
Other literature studies propose more complex and accurate simulation models that evaluate the thermal load profile of the building as a function of weather and occupancy level forecast. For instance, in [23], Park et al. use EnergyPlus to model two different residential buildings with a high accuracy level but a high computational cost; [24] provides an analysis of the different capabilities of the building energy performance of simulation programs and models. These models simulate all the rooms of the considered building and are validated through experimental data measured on field. In other words, the building is modeled as a group of interconnected elementary systems, each one representing a room. Most of the models use equivalent electric circuits to study the thermal dynamic behavior of buildings; for instance, walls are modeled as a combination of resistors and capacitors characterized by resistance and capacitance values depending on the geometry (thickness of different layers) and materials (masonry and insulation layers, etc.). Due to the complexity of these models, the estimation of resistance and capacitance values is not so simple, especially in the case of buildings characterized by a huge number of rooms with a complex space partition. Moreover, the inclusion of these very detailed simulators within BEMSs is a hard task and in some cases the simulation model needs to be simplified [25].
The present study aims at defining a BEMS able to optimally schedule the HVAC system of a smart building, of which both the thermal and cooling energy needs are satisfied by exploiting the on-site geothermal heat pump. The proposed optimization model can manage both the heat pump and the fan coils at the room level. Moreover, differently from other approaches proposed in literature (e.g. [26]), which assume that the building is a single zone to optimize, in this work, all the building rooms are taken into account.
As is well known, a ground-source heat pump is a system used to heat and/or cool a building transferring heat from or to the ground (characterized by a nearly constant temperature during the year), respectively during winter or summer months [18]. Consequently, ground-source heat pumps are more efficient than air-source heat pumps because they take advantage of the relatively constant ground temperature. Heat exchangers for specific applications with ground water or geothermal closed loops can be adopted in the aforesaid systems. In open loop systems, well or surface body water is used as the heat exchange fluid that circulates directly through the heat pump system; on the other hand, closed systems consist of underground continuous piping loops filled with a water and anti-freeze solution, which constitutes the working fluid that is used to transfer heat from/to the ground to/from the geothermal heat pump, and are typically installed inside the building. Closed loop systems can be horizontal, vertical, or pond/lake. Horizontal loops are a cost-effective solution for residential installations, particularly for new buildings where sufficient land is available; vertical loops are preferable for commercial buildings and schools, whereas pond/lake systems are installed when an adequate body of water is available.
The developed BEMS acts on the HVAC plant, sending operating commands to the heat pump and to the fan coils arranged in each room of the building. The BEMS is based on a multi-objective MILP (Mixed Integer Linear Programming) mathematical model. The objective function to be minimized takes into account both operating costs of the HVAC system and the discomfort cost. On the other hand, the constraints of the problem include the mathematical model developed to simulate the dynamic thermal behavior of the building, based on an equivalent electric circuit approach. The model has been validated on a smart building of the Savona Campus of the University of Genoa [27].
In summary, the novelty of the proposed BEMS is characterized by the following aspects with respect to the literature:
  • A detailed system model for the building, characterized by a control variable for each room associated to the different fan coils;
  • A detailed model for the overall heating cooling system characterized by a geothermal heat pump and a storage system;
  • A simulation model fitted with real data coming from a smart building connected to a smart Microgrid;
  • A model for the optimal scheduling of fan coil circuit operation considering the perceived comfort in each room of the building;
  • The possibility of being used in optimization applications due to its low computational cost, without losing the room level accuracy.
The remainder of the paper is organized as follows: in Section 2, the system’s architecture is presented and the main equations of the BEMS are described. In Section 3, the description of the case study is reported and the main validation results of the simulation model are highlighted. Section 4 is focused on the analysis of optimal results obtained by running the BEMS for a typical day, whereas Section 5 reports the main conclusions of the study.

2. The BEMS’s Architecture

The proposed BEMS is characterized by different modules (see Figure 1):
  • A forecasting module used to predict the energy production from renewable sources and ambient conditions (external and ground temperature and solar radiation);
  • An optimization module able to manage the Heating, Ventilation and Air Conditioning System (HVAC);
  • A simulation module able to evaluate the thermal dynamic behavior of the building through an equivalent electric circuit model.
The BEMS receives as input both the on-field measurements collected by the supervisory control and data acquisition (SCADA) and the output of the forecasting tool. Moreover, the simulation and the optimization tools are strictly related since the equations used to simulate the building thermal dynamics represent some of the constraints of the optimization model. In the following, the structure of the simulator and the optimization tool are described.

2.1. The Simulation Module

In this study, a grey-box modeling approach has been used to analyze the building thermal behavior. This kind of model is a reasonable tradeoff between purely physically based models, called white-box, which require many physical parameters, and black-box models, which need a large amount of data for the training phase to accurately represent the real physical behavior of the system [28]. In particular, an equivalent electric model is proposed here, using a well-known electric/thermal analogy where current represents heat flux and voltage indicates temperature. In literature, similar approaches are used to evaluate the thermal behavior of a building, but with different levels of complexity [21]. The majority of the models presented in the literature assume only one or a few temperature nodes to define the thermal behavior of the whole building and do not take into account temperature differences among the internal rooms; in other terms, they do not consider the presence of several internal walls and external walls characterized by different boundary conditions. On the other hand, the present model is more detailed since it can be used to evaluate the temperature profile, as a function of time, for each room of the building. The equivalent electric model is based on an Resistor Capacitor (RC) circuit, where resistors are used to model conductive and convective thermal resistances while capacitors are introduced to consider the accumulation of thermal energy inside the building.

2.1.1. Room Temperature Model

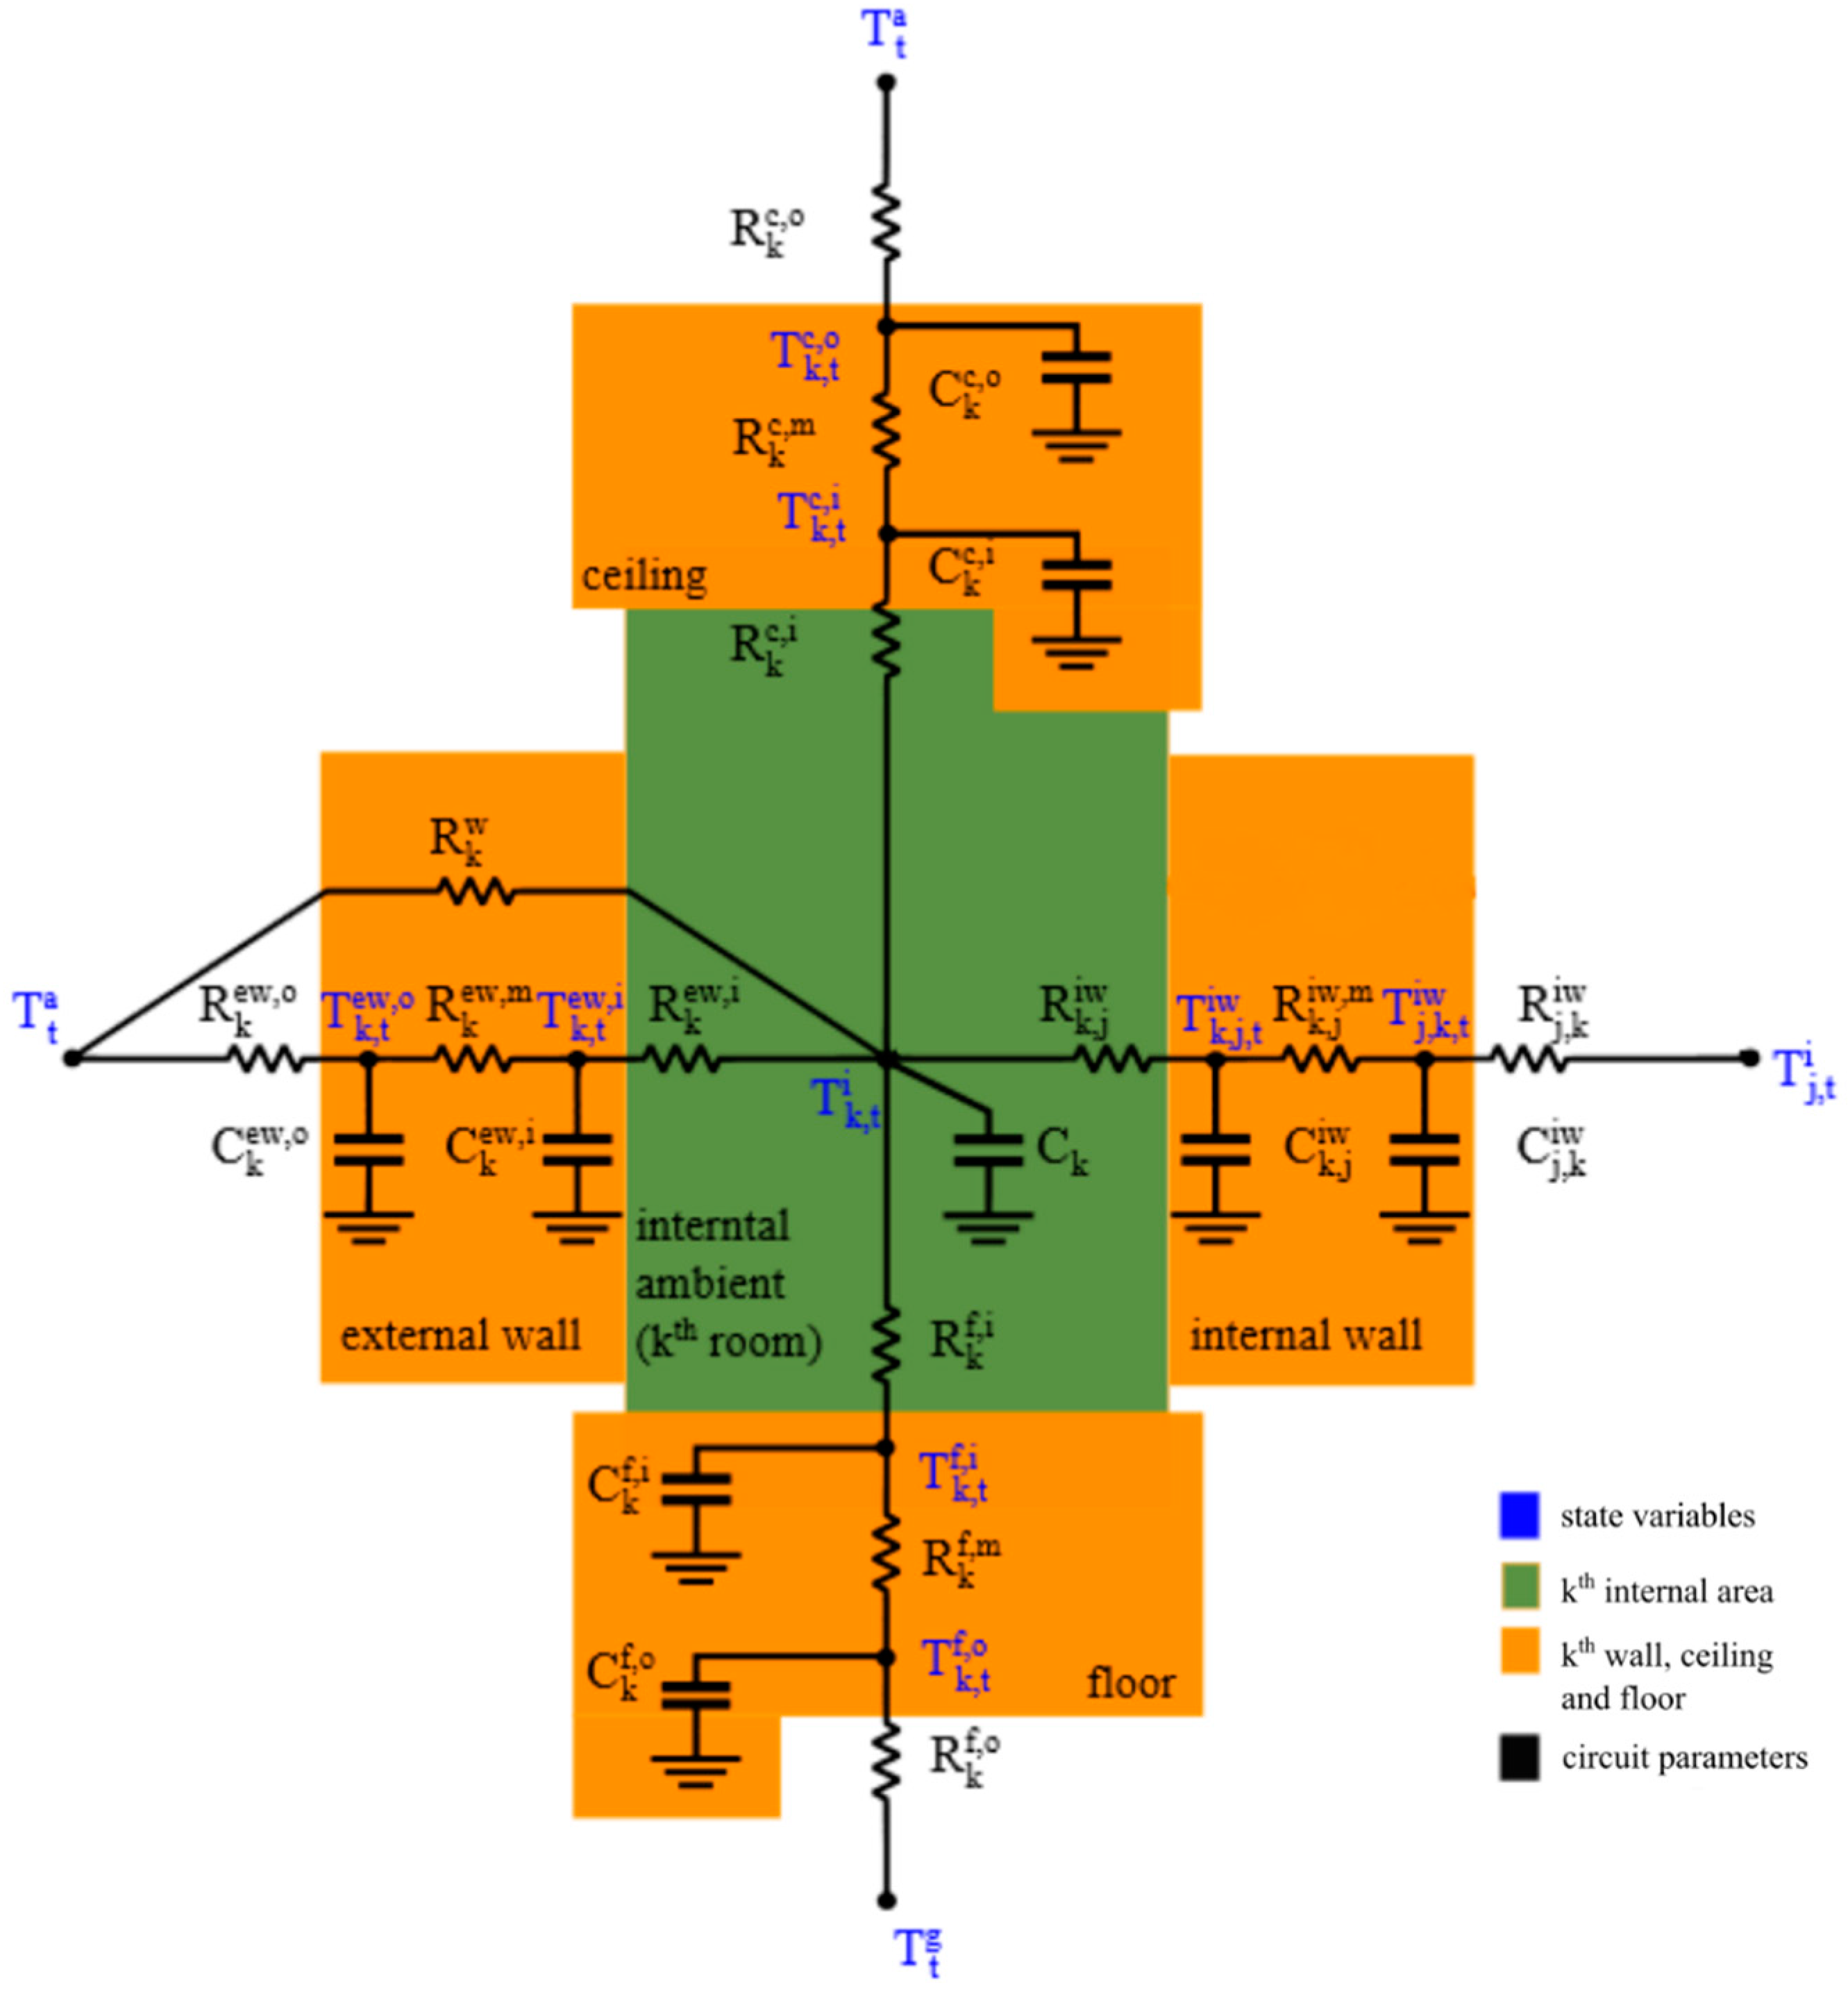
To determine the temperature inside each room, it is necessary to model all the thermal flows exchanged between the room and each adjacent space, which can be represented by another room, the ground or the outside. Dynamic energy balances have been written to model the thermal energy accumulation inside the rooms of the building, using first-order differential equations that have been discretized in order to insert them into the optimization model. In Figure 2, the equivalent electric circuit for the generic kth room is shown.
For the kth room of the building, the internal temperature T k , t + 1 i at time t + 1 can be evaluated through the following energy balance:
T k , t + 1 i = T k , t i + 1 C k i ( Q ˙ k , t e w , i + Q ˙ k , t c , i + Q ˙ k , t f , i + Q ˙ k , j , t i w , i + Q ˙ k , t w , i + Q ˙ k , t c o + Q ˙ k , t a c ) ·   Δ t k K , t = 0 , , N 1
where the thermal fluxes are computed by applying the Ohm’s law, which correlates heat fluxes (currents) and temperatures (voltages) through appropriate resistances. In particular, the considered thermal resistances are convective resistances ( R k e w , i , R k c , i , R k f , i , R k , j i w ) between the room temperature ( T k , t i ) and the temperature of the internal faces of the external walls ( R k e w , i , T k , t e w , i ), ceilings ( R k c , i , T k , t c , i ), floors ( R k f , i , T k , t f , i ), and separation walls with adjacent rooms ( R k , j i w , T k , j , t i w ). C k i indicates that the equivalent thermal capacity of room kth and Δt is the time interval. In particular, the thermal fluxes reported in (1) indicate the heat exchange between: external wall/room ( Q ˙ k , t e w , i ), ceiling/room ( Q ˙ k , t c , i ), floor/room ( Q ˙ k , t f , i ), adjacent rooms/room ( Q ˙ k , j , t i w ), and windows/room ( Q ˙ k , t w , i ). The windows are modeled through just one thermal resistance ( R k w ) since it is assumed that their thermal capacity can be considered negligible. So, the following thermal flux expressions derive:
Q ˙ k , t e w , i = T k , t e w , i T k , t i R k e w , i k K , t = 0 , , N 1
Q ˙ k , t c , i = T k , t c , i T k , t i R k c , i k K , t = 0 , , N 1
Q ˙ k , t f , i = T k , t f , i T k , t i R k f , i k K , t = 0 , , N 1
Q ˙ k , j , t i w = j = 1 J k T k , j , t i w T k , t i R k , j i w k K , j J k , t = 0 , , N 1
Q ˙ k , t w , i = T t a T k , t i R k w k K , t = 0 , , N 1
Finally, Q ˙ k , t c o is related to the convective fraction of the thermal flux provided by involuntary heat generators within the room (i.e., occupants or personal computers) [29], while Q ˙ k , t f c is the thermal power (19) supplied by fan coils of the HVAC system.

2.1.2. Wall, Ceiling, and Floor Temperature Model

In the model, each wall (internal and external) and each horizontal masonry element (slab, ceiling, floor) is modeled with a 3R2C thermal network, as shown in Figure 2. Each node of the network is characterized by a temperature, which represents a state variable of the whole system [30]. Due to the chosen electrical model, two nodes describe each structural part (wall or horizontal masonry) of the kth room: the first related to its external side (external walls T k , t e w , o , ceilings T k , t c , o , floors T k , t f , o , internal walls T j , k , t i w ) and the latter to its internal side (external walls T k , t e w , i , ceilings T k , t c , i , floors T k , t f , i , internal walls T k , j , t i w ).
The temperature T k , t + 1 e w , o and T k , t + 1 e w , i of the two nodes related to the external wall of the kth room can be evaluated as:
T k , t + 1 e w , o = T k , t e w , o + 1 C k e w , o ( T t a T k , t e w , o R k e w , o + T k , t e w , i T k , t e w , o R k e w , m + Q ˙ k , t e w , s o l ) Δ t   k K , t = 0 , , N 1
T k , t + 1 e w , i = T k , t e w , i + 1 C k e w , i ( T k , t i T k , t e w , i R k e w , i + T k , t e w , o T k , t e w , i R k e w , m + Q ˙ k , t e w , r a d ) Δ t k K , t = 0 , , N 1
where Q ˙ k , t e w , s o l represents the solar gain on the external wall, whereas Q ˙ k , t e w , r a d identifies the radiative gain on the internal face of the external wall due to involuntary heat generators [29]. The parameter R k e w , m is defined as the thermal conductive resistance of the external wall situated between the temperature of the internal side of the external wall ( T k , t e w , i ) and the temperature of the external side of the external wall ( T k , t e w , o ), whereas R k e w , o is the convective resistance between the outside temperature ( T t a ) and the external side of the external wall ( T k , t e w , o ); finally, C k e w , o and C k e w , i are defined as the thermal capacity values of the external wall, respectively located on the external side of the external wall ( C k e w , o ) and on the internal side of the external wall ( C k e w , i ). Similar equations are used to calculate the temperature values of the nodes that characterize the ceilings (9), (10), the floors (11), (12) and the internal walls (13), (14); note that for the evaluation of T k , t f , o no solar gains are considered.
T k , t + 1 c , o = T k , t c , o + 1 C k c , o ( T t a T k , t c , o R k c , o + T k , t c , i T k , t c , o R k c , m + Q ˙ k , t c , s o l ) Δ t    k K , t = 0 , , N 1
T k , t + 1 c , i = T k , t c , i + 1 C k c , i ( T k , t i T k , t c , i R k c , i + T k , t c , o T k , t c , i R k c , m + Q ˙ k , t c , r a d ) Δ t    k K , t = 0 , , N 1
T k , t + 1 f , o = T k , t f , o + 1 C k f , o ( T t g T k , t f , o R k f , o + T k , t f , i T k , t f , o R k f , m ) Δ t     k K , t = 0 , , N 1
T k , t + 1 f , i = T k , t f , i + 1 C k f , i ( T k , t i T k , t f , i R k f , i + T k , t f , o T k , t f , i R k f , m + Q ˙ k , t f , r a d ) Δ t    k K , t = 0 , , N 1
T j , k , t + 1 i w = T j , k , t i w + 1 C j , k i w ( T j , t i T j , k , t i w R j , k i w + T k , j , t i w T j , k , t i w R k , j i w , m + Q ˙ j , k , t i w , r a d ) Δ t k K , j = J k , t = 0 , , N 1
T k , j , t + 1 i w = T k , j , t i w + 1 C k , j i w ( T k , t i T k , j , t i w R k , j i w + T j , k , t i w T k , j , t i w R j , k i w , m + Q ˙ k , j , t i w , r a d ) Δ t k K , j = J k , t = 0 , , N 1

2.1.3. HVAC System Model

As shown in Figure 3, in the analyzed case, the HVAC system is composed of a geothermal heat pump (ghp) feeding a thermal storage (st) connected to a fan coil (fc) circuit. The geothermal heat pump has as primary source the heat extracted by the geothermal probes; the heat pump absorbs a constant active power ( P e l , g h p ) from the grid when it is in operation (binary variable δ t g h p equal to 1) and produces thermal power ( P t t h , g h p ). The coefficient of performance (COP) correlates the thermal power to the electrical one, as follows:
P t t h , g h p = δ t g h p C O P P e l , g h p     t = 0 , , N 1
The thermal storage is a water tank, used to store the thermal energy produced by the heat pump; as a consequence, the thermal power provided to the storage ( P t s t , i n ) is assumed to be equal to the thermal power produced by the heat pump:
P t s t , i n = P t t h , g h p     t = 0 , , N 1
The storage is a dynamic component that can be used to increase the thermal inertia of the overall system, playing a fundamental role in terms of load flexibility. It is described by its thermal capacity ( C s t ) and its temperature ( T t s t ), which can be calculated by means of the following energy balance equation:
T t + 1 s t = T t s t + 1 C s t ( P t s t , i n P t s t , o u t ) Δ t    t = 0 , , N 1
The thermal power output of the storage ( P t s t , o u t ) is equal to the sum of the thermal fluxes provided by fan coils installed inside the building:
P t s t , o u t = k = 1 K Q ˙ k , t f c      k K , t = 0 , , N 1
It is important to highlight that all the fan coils installed in the same room are considered as a single equivalent device, since they receive the same control signal from the BEMS. The thermal flux transferred to the room by the fan coils ( Q ˙ k , t f c ) is defined as proposed in [31]:
Q ˙ k , t f c = δ k , t f c ε f c m ˙ k a i r c p a i r ( T t s t T k , t i ) k K , t = 0 , , N 1
where ε f c is the fan coil efficiency and m ˙ k a i r is the air mass flow rate of the equivalent fan coil in the kth room. The binary variable δ k , t f c assumes a unit value when the fan coils are activated.

2.2. The Optimization Module

The main goal of the developed BEMS is that of optimizing the operation of the HVAC plant in order to guarantee the thermal comfort in each different room of the building. The objective function to be minimized (ObjF) is given by the sum of two terms: the total operating cost of the heat pump (due to the electricity absorbed from the grid) and the sum of square errors between the actual room temperature T k , t i and the optimal comfort temperature T k , t i . The latter of these two terms is calculated by applying the Fanger’s comfort model to each room [32]:
O b j F = t = 0 N 1 [ α Δ t P t e l , g h p p t e l + β μ t o c k = 1 K ( T k , t i T k , t i ) 2 ] k K , t = 0 , , N 1
where Δt indicates the time step of the optimization problem, whereas p t e l is the electricity price. The (20) is a multi-objective cost function. Since the optimal comfort temperature tracking cost and the electricity cost are not numerically commensurable, it introduced a numeric coefficient β to make the two different costs comparable. It might be also seen as a weight to the various objectives (i.e., the decision maker can give more importance to a specific objective or another one). The α parameter is always equal to 1 except for when one wants to evaluate only the comfort temperature tracking (α = 0), while μ t o c is the indicator of occupancy (equal to 1 from 8.00 a.m. to 6.00 p.m. and equal to 0 in the remaining hours).
The constraints of the optimization problem are described by the equations of the simulation model (1-19) together with the following ones, which fix lower and upper bounds for the storage temperature as a function of the adopted technology:
T s t , m i n T t s t T s t , m a x     t = 0 , , N 1
The problem is Mixed-Integer Non-Linear Programming (MINLP), since continuous and binary variables are present, and all the constraints are linear except for (19).
The constraints (19) have been modified in order to obtain a MILP problem. In particular, the aforementioned non-linearity has been solved with a big-M approach [33] rewriting the constraints (19) as follows:
Q ˙ k , t f c = ε f c m ˙ k a i r c p a i r ( z t 2 z k , t 1 )      k K , t = 0 , , N 1
z k , t 1 δ k , t f c T i , m a x      k K , t = 0 , , N 1
z k , t 1 T k , t i      k K , t = 0 , , N 1
z k , t 1 T k , t i ( 1 δ k , t f c ) T i , m a x      k K , t = 0 , , N 1
z k , t 1 0      k K , t = 0 , , N 1
z k , t 2 δ k , t f c T s t , m a x      k K , t = 0 , , N 1
z k , t 2 T t s t      k K , t = 0 , , N 1
z k , t 2 T t s t ( 1 δ k , t f c ) T s t , m a x      k K , t = 0 , , N 1
z k , t 2 0      k K , t = 0 , , N 1
where T i , m a x and T s t , m a x are the big-M values, representing the maximum values that T k , t i and T t s t can reach in real operation.
The decision variables of the optimization problem are:
  • Room, wall, ceiling, floor, storage temperatures ( T k , t i , T k , t e w , i , T k , t c , i , T k , t f , i , T k , j , t i w , T k , t e w , o , T k , t c , o , T k , t f , o , T t s t );
  • Storage thermal power input/output ( P t s t , i n , P t s t , o u t );
  • Exchanged thermal fluxes ( Q ˙ k , t e w , i , Q ˙ k , t c , i , Q ˙ k , t f , i , Q ˙ k , j , t i w , i , Q ˙ k , t w , i );
  • Heat pump thermal power ( P t t h , g h p );
  • Thermal power provided by fan coils ( Q ˙ k , t f c );
  • The binary variables ( δ t g h p , δ k , t f c ), which constitute the control variables related to the on/off operation of the heat pump and fan coils;
  • The auxiliary variables referred to the room temperature ( z k , t 1 ) and to the storage temperature ( z k , t 2 ) used to linearize the fan coil constraint (19).
The state variables are:
  • Rooms, walls, ceilings, floors and storage temperatures ( T k , t i , T k , t e w , i , T k , t c , i , T k , t f , i , T k , j , t i w , T k , t e w , o , T k , t c , o , T k , t f , o , T t s t ).
The main input data of the optimization model are the time profiles of:
  • The convective fraction of the thermal fluxes provided by involuntary heat generators within the room, radiative gains due to involuntary heat generators and the solar gains on the external walls ( Q ˙ k , t c o , Q ˙ k , t e w , s o l , Q ˙ k , t e w , r a d , Q ˙ k , t c , s o l , Q ˙ k , t c , r a d , Q ˙ k , t f , r a d , Q ˙ j , k , t i w , r a d );
  • The external ambient temperature ( T t a ) and the ground temperature ( T t g );
  • The optimal comfort temperature ( T k , t i ).

3. The Case Study

The developed BEMS is applied to a real case study represented by the Smart Energy Building (SEB) at the Savona Campus of the University of Genoa (Liguria Region, north-west Italy) [27]. This section reports the description of the building and the experimental validation of the simulation model.

3.1. The Smart Energy Building

The SEB, Figure 4, is an environmentally sustainable building connected to a microgrid (called Smart Polygeneration Microgrid [27]) as a “prosumer” and is equipped with renewable power plants and characterized by energy efficiency measures.
The building has two floors and 22 rooms, it is characterized by a floor area of 510 m2 (for each floor) and it is 10 m high. It is made of reinforced concrete with Predalles prestressed slabs and the ground floor elevation has been adopted to prevent flood water entering the building; high performance thermal insulation materials for building applications (ventilated facades and claddings) and acoustic insulation systems are applied. The building is certified as A4, which is the most efficient “energy class” in accordance with the Italian Classification of Building Energy Efficiency. Moreover, the SEB is a ZEB (Zero Emission Building) since its electrical loads are satisfied by a Photovoltaic (PV) field and the storage systems of the microgrid, while its thermal and cooling loads are covered by a geothermal heat pump. The SEB hosts: three laboratories, a gym, two classrooms, and some offices. The following technologies are installed in the SEB: a geothermal heat pump, a thermal storage system, an air handling unit, a PV field (21.25 kW peak power), extremely low consumption LED lamps, a rainwater harvesting system, and a hydroponic system.
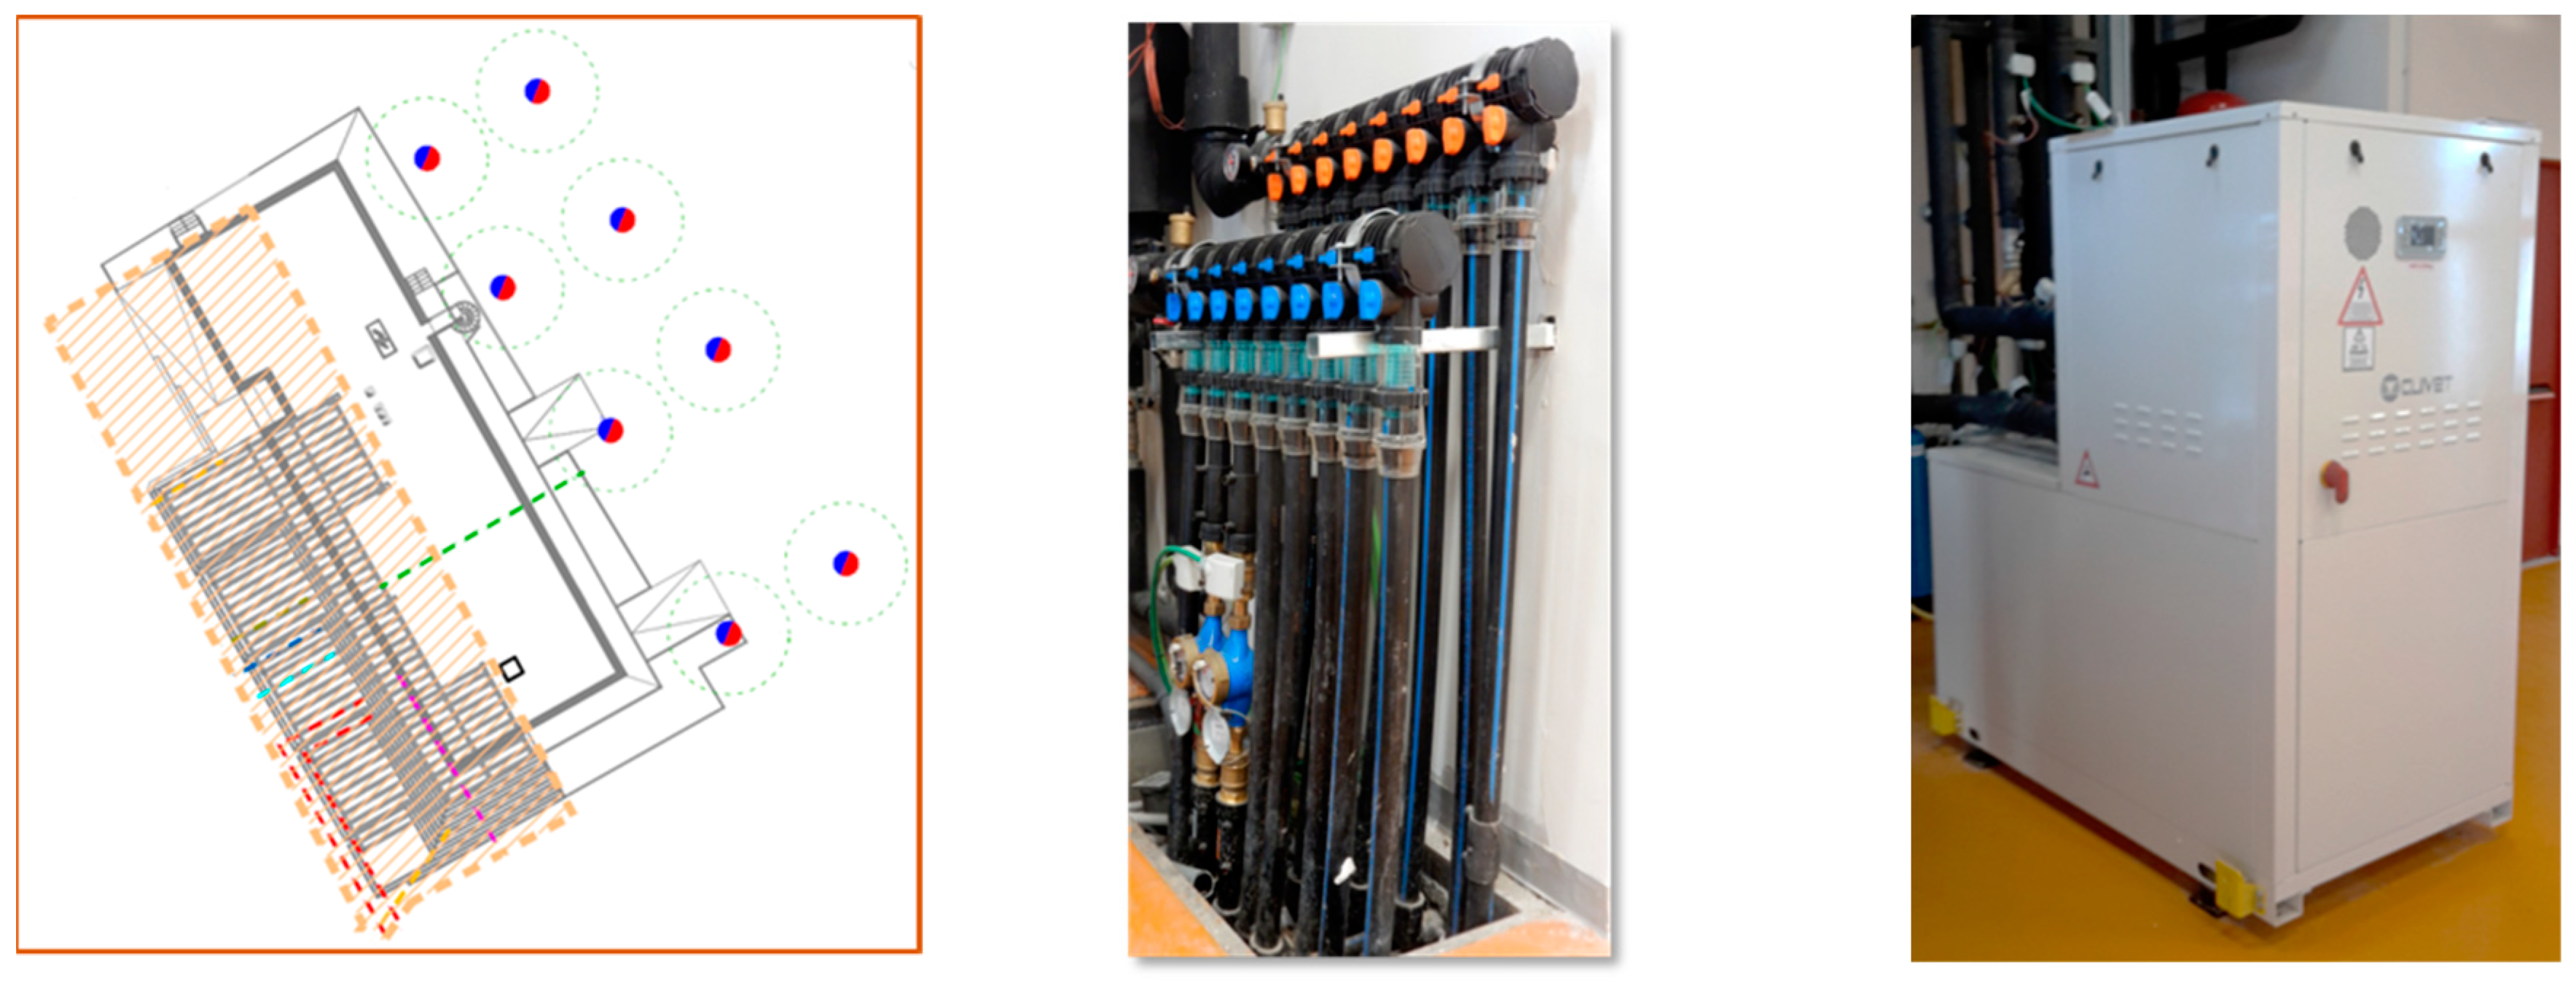
The geothermal plant installed in the SEB is characterized by a close-loop vertical configuration: eight borehole heat exchangers (Figure 5 left and center) are buried about 120 m deep in the soil. The geothermal heat pump (Figure 5 right) is a Clivet WSHN-XEE2 MF 14.2; it is hydraulically connected to a storage water tank having a volume of 500 liters.
The SEB is equipped with field sensors for measuring humidity and temperature in each room. The building has an embedded communication system and can be managed remotely by the control room of the Smart Polygeneration Microgrid.

3.2. The Validation of the Simulation Model

The accuracy of the simulation model has been evaluated by comparing the values obtained by the simulator and the actual data measured on the field at the Savona Campus. The availability of the measured values was guaranteed by the supervisory control and data acquisition (SCADA) system of the SEB. The variables measured by the SCADA system are as follows: the electric power absorbed by the heat pump, the air temperatures in all the rooms, and the on/off operation of fan coils. The sampling time of the electric power values has been 1 minute, whereas room temperature values have been collected every 15 minutes to avoid the overload of the SCADA system; nevertheless, a sample time of 15 minutes is acceptable to appreciate the thermal inertia of the building. Finally, the values of solar radiation and external ambient temperature derive from the measurements of a weather station located in the city of Savona and operated by the Regional Agency for the Protection of the Ligurian Environment (ARPAL).
The validation of the simulator has been performed by using data collected both during nighttime and daytime periods. Since during the night the HVAC plant is off, the experimental data referring to this period reflect only the thermal behaviour of the building without considering fan coil power injection, and so permit to better characterize the dynamics of the walls; on the other hand, daytime data have been used to evaluate how the simulation model is able to represent the HVAC operation. During the daytime, the HVAC system operates to maintain the desired indoor temperature within a slot of temperature-wide one degree. The mid temperature value of the slot is the optimal comfort temperature, and this value is set in each room by a central controller and can be modified by occupants within a range of two degrees depending on their personal feelings. The controller is governed by means an heuristic rule, this control logic operates turning on the HVAC plant until the internal rooms temperatures reach the high value of the slot and then it turns off the plant until the temperature values becomes smaller than the low limit of the slot, as an hysteresis cycle.
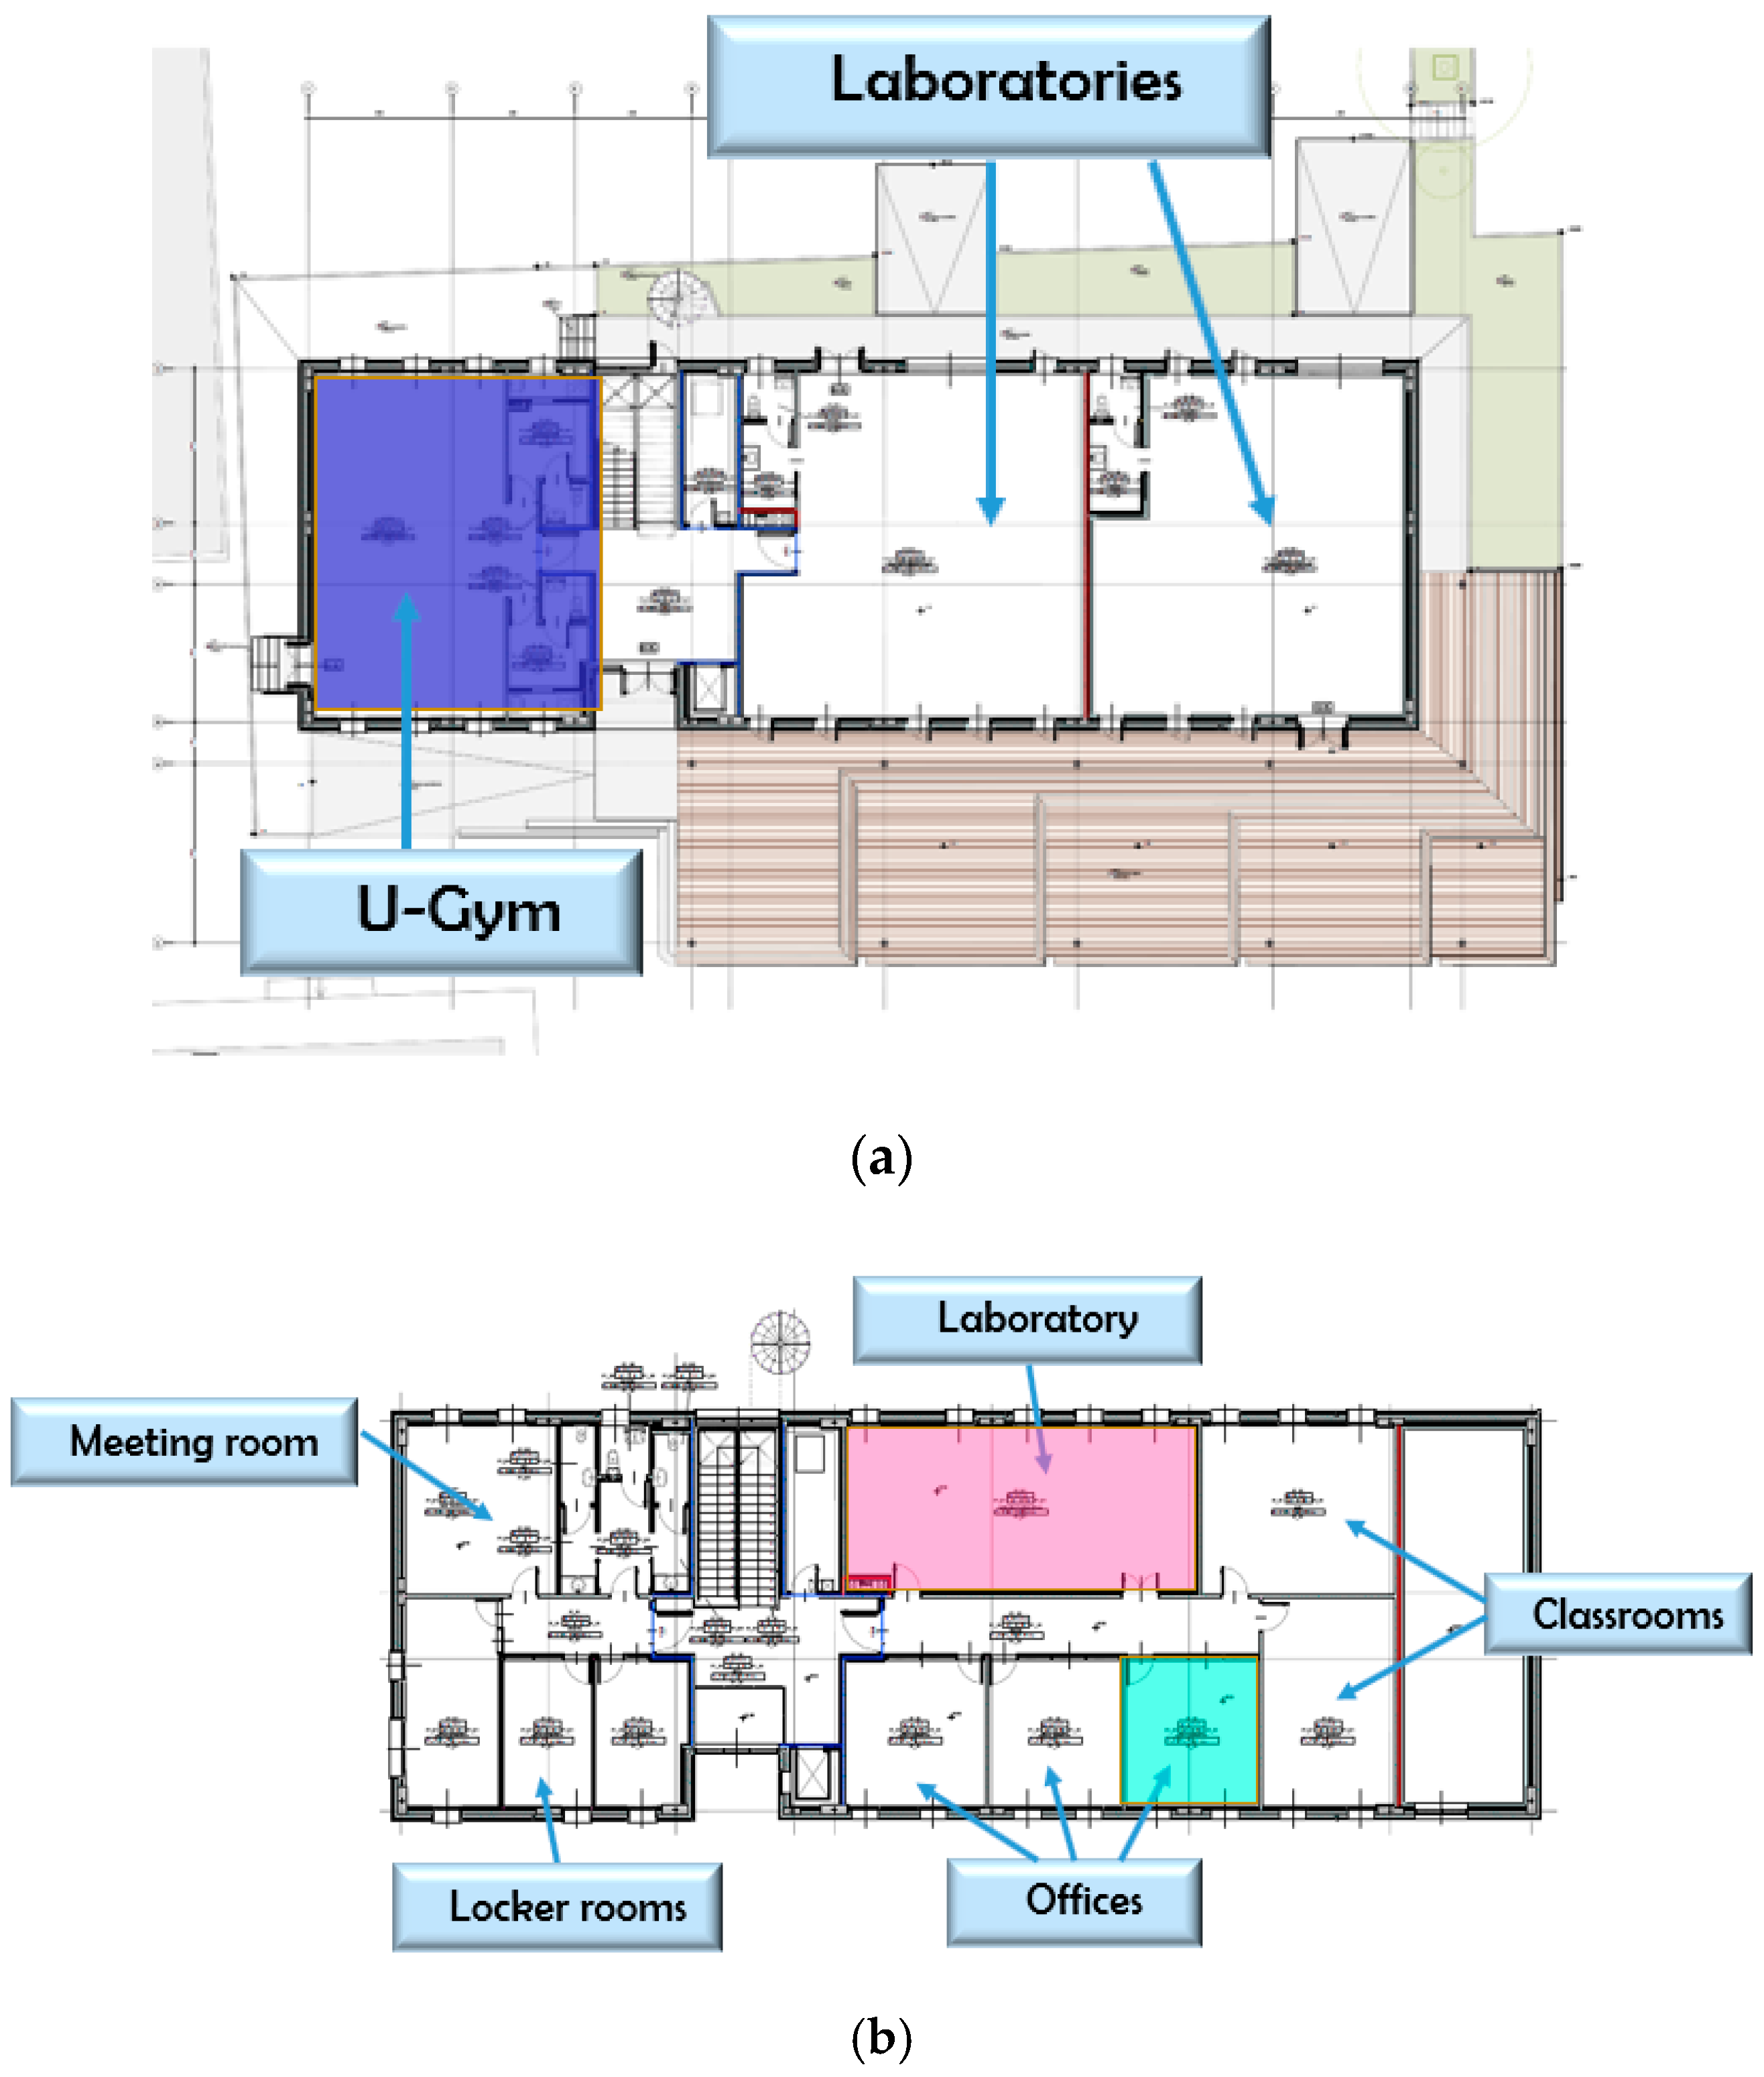
The validation of the simulator has been successfully conducted for each room of the building, but the results described in the following refer to three typical rooms, featured by different intended uses, which well characterize the whole building. The aforementioned rooms, depicted in Figure 6a,b, are as follows: the U-Gym (located on the ground floor and purple-colored in Figure 6a), one laboratory, and one office (located on the first floor and respectively pink and cyan-colored in Figure 6b).
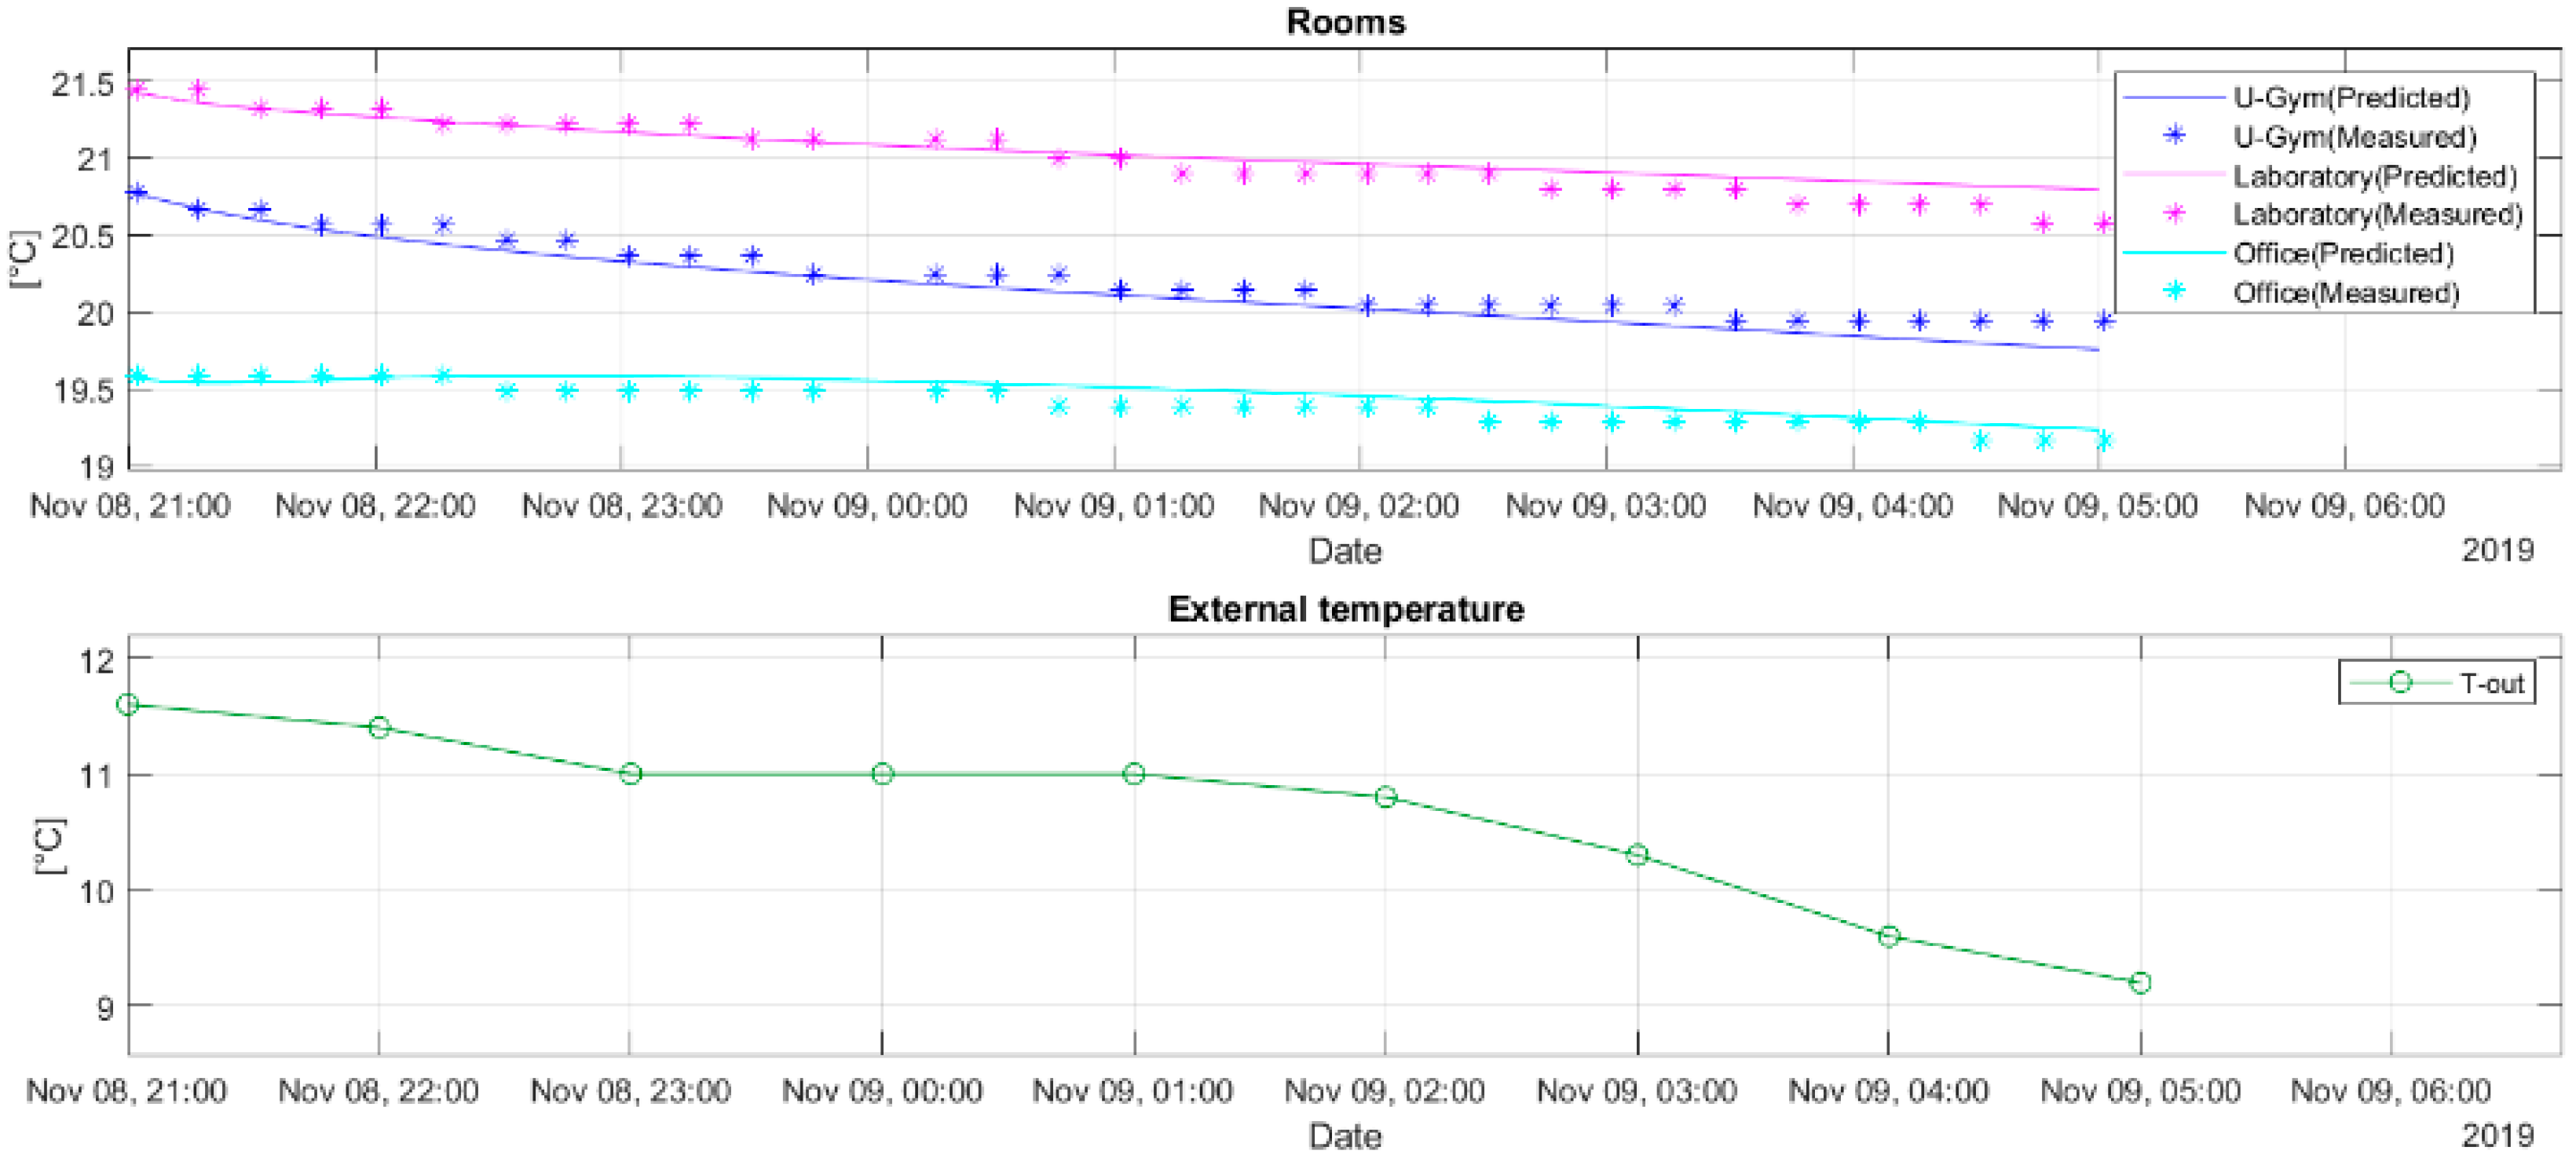
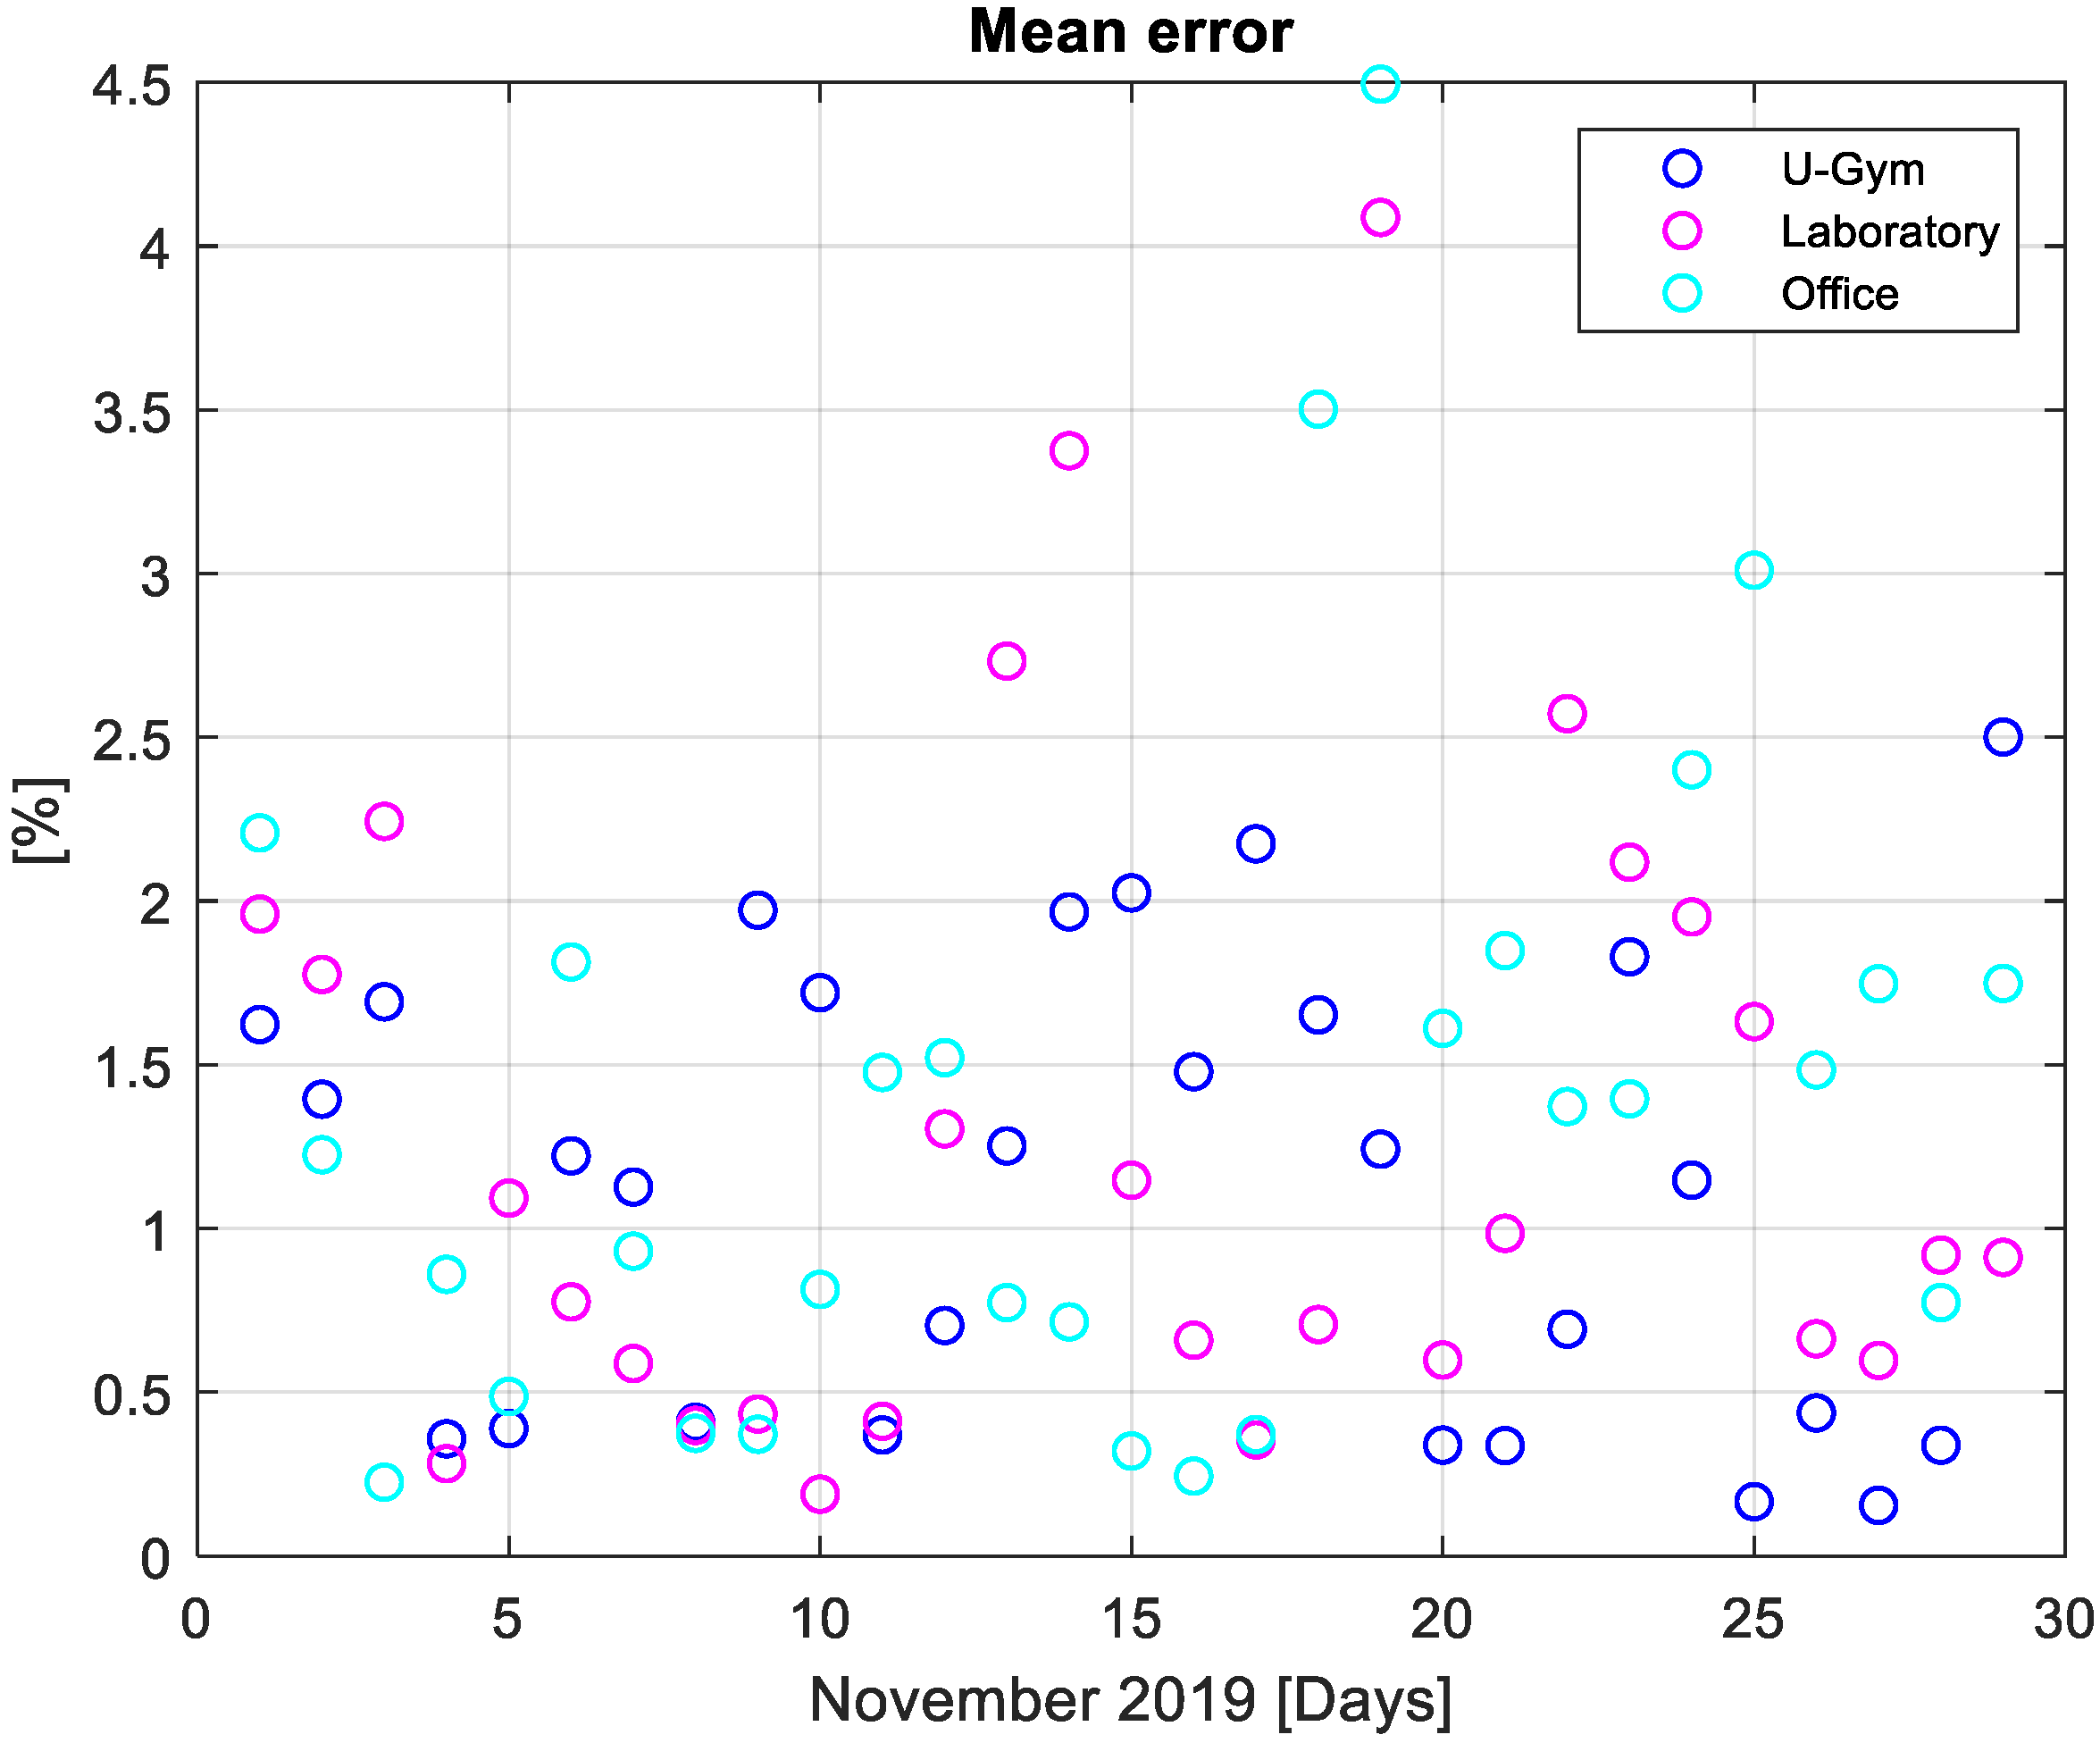
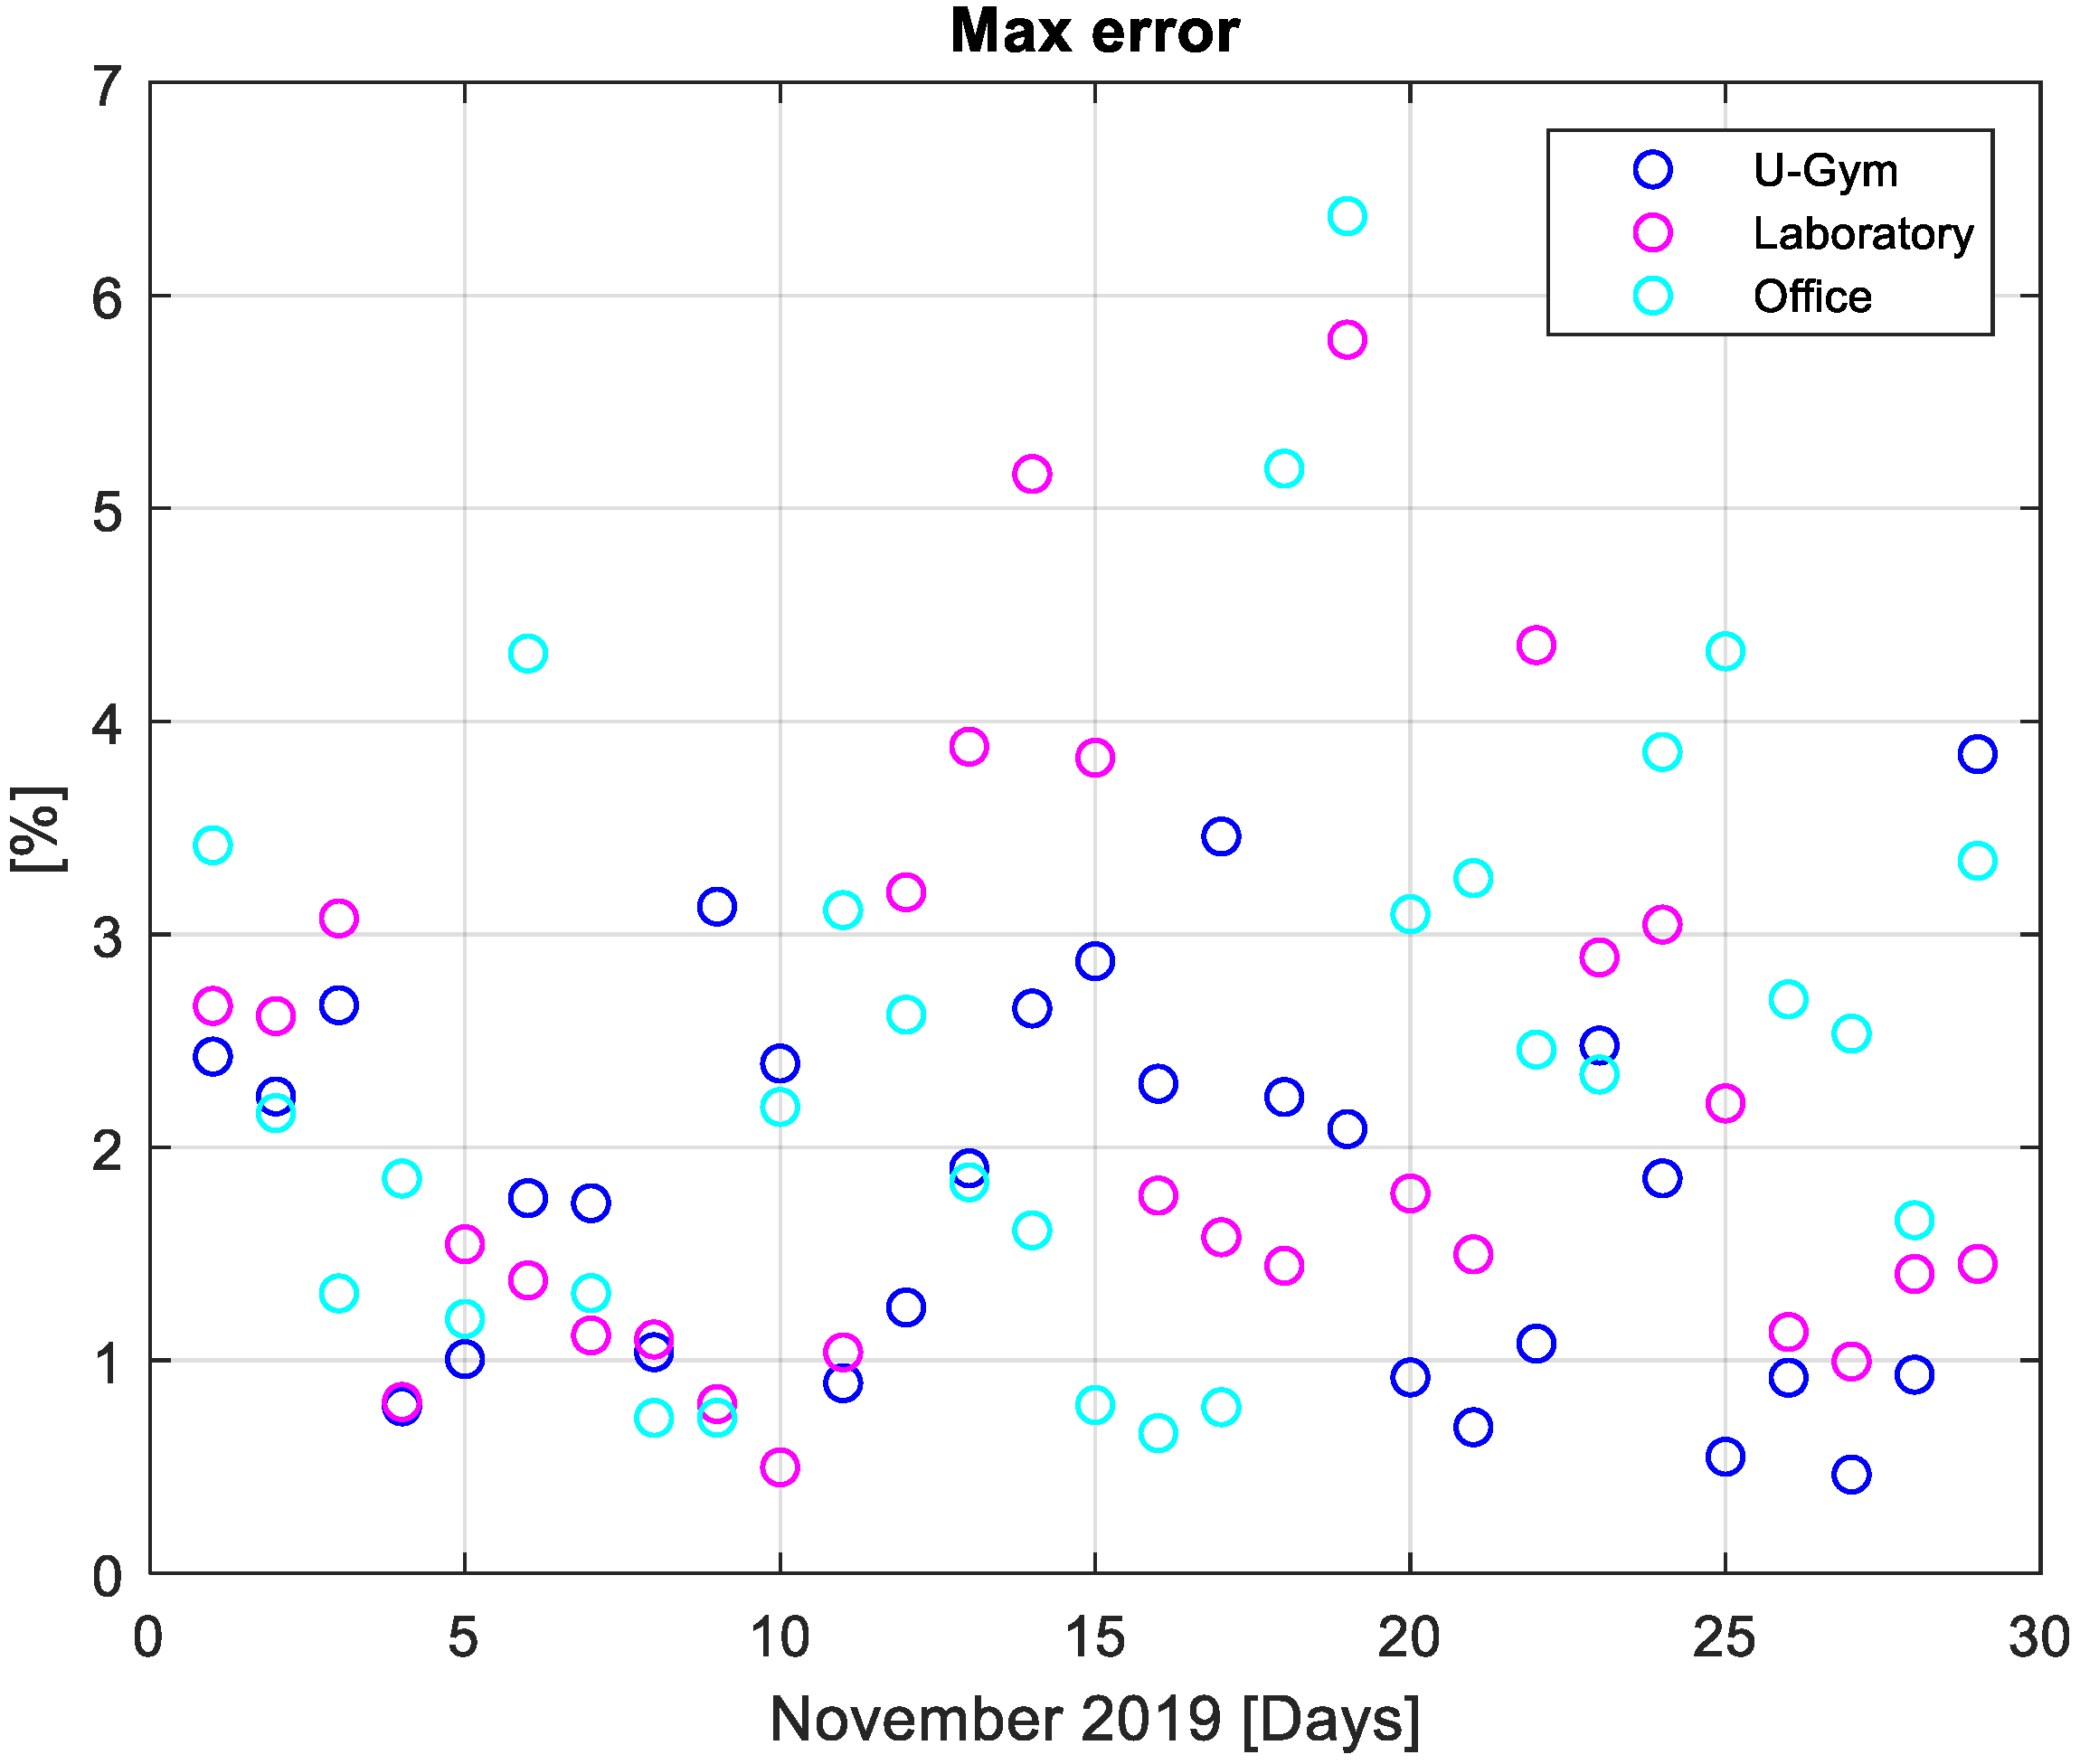
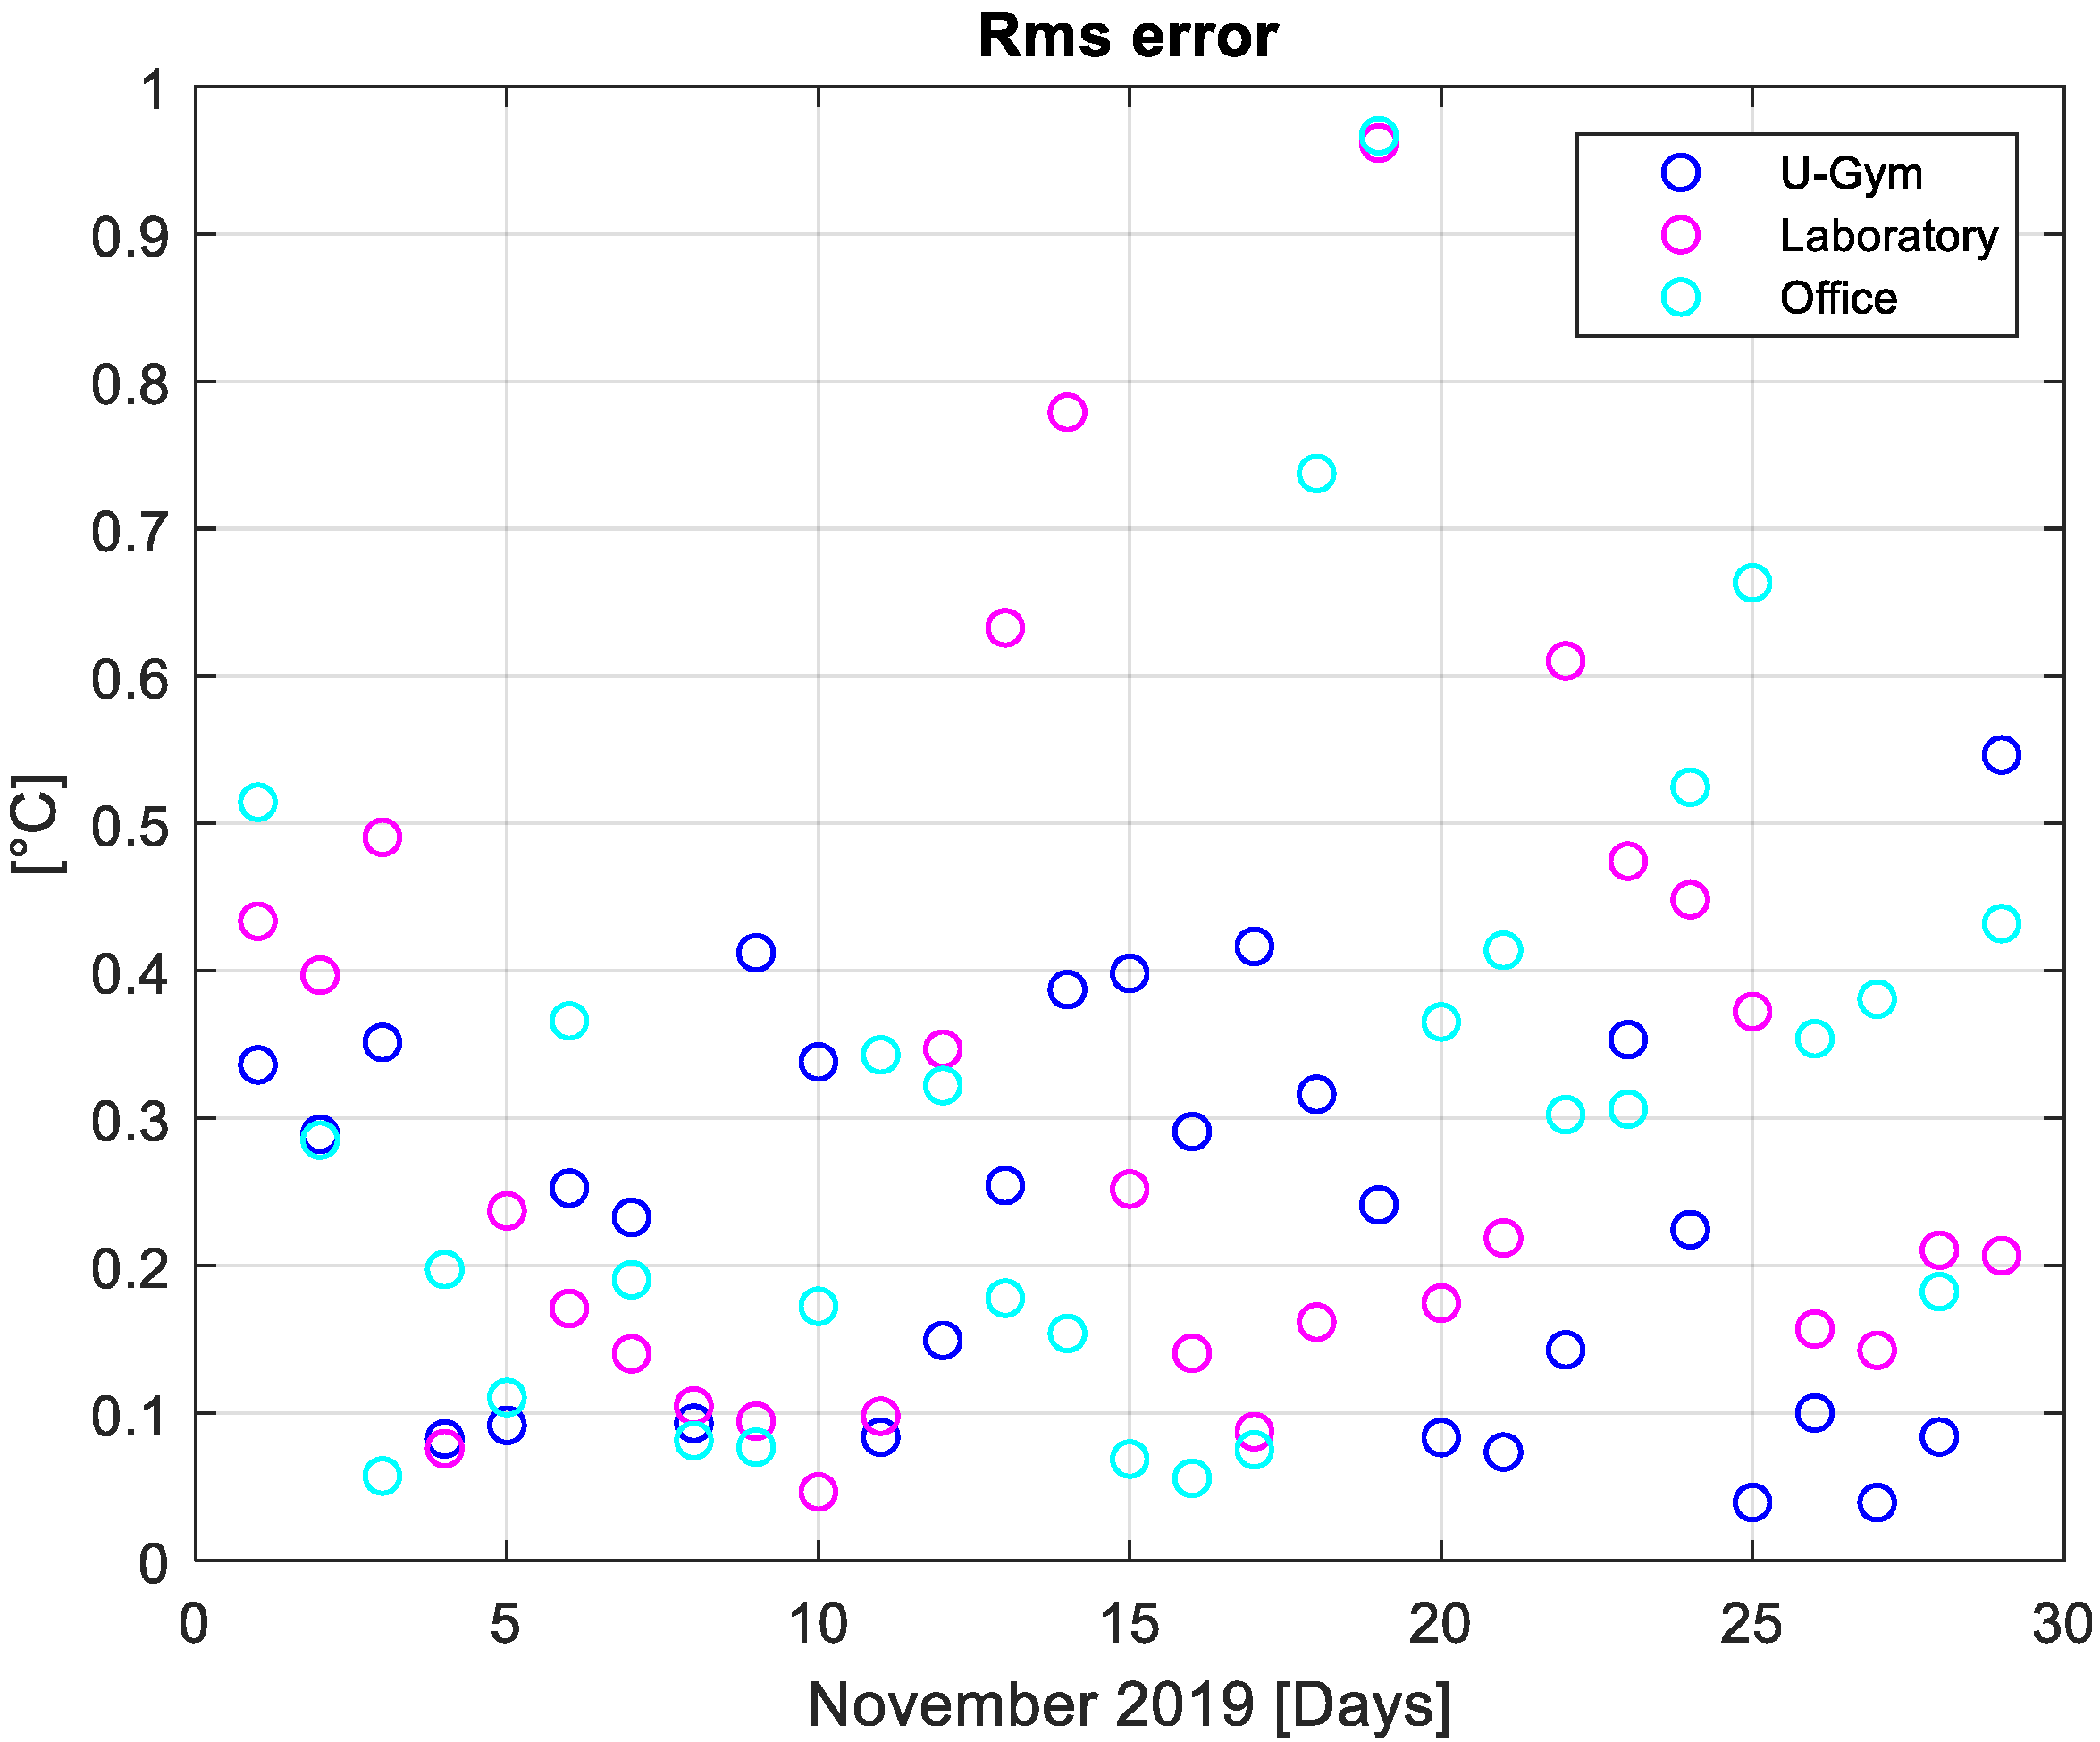
The nighttime temperature values have been measured between 9 p.m. and 6 a.m., when the HVAC system is off, during the month of November 2019. Figure 7 shows the comparison between the predicted and the measured temperature values for the examined three rooms, referring to one day. It is important to highlight that the stepped profile of measured temperatures is due to the sensitivity of the measurement sensors, which can only detect a temperature change of 0.2 °C. In order to quantify the accuracy of the simulation model, some statistical indicators have been calculated for each day of the analyzed month. In particular, in Figure 8, the values of the mean percentage error are reported, whereas Figure 9 and Figure 10 show, respectively, the maximum percentage error and the root mean square error. The results show that in 80% of cases the mean percentage error remains below 2.5% while the maximum error is below 4%.
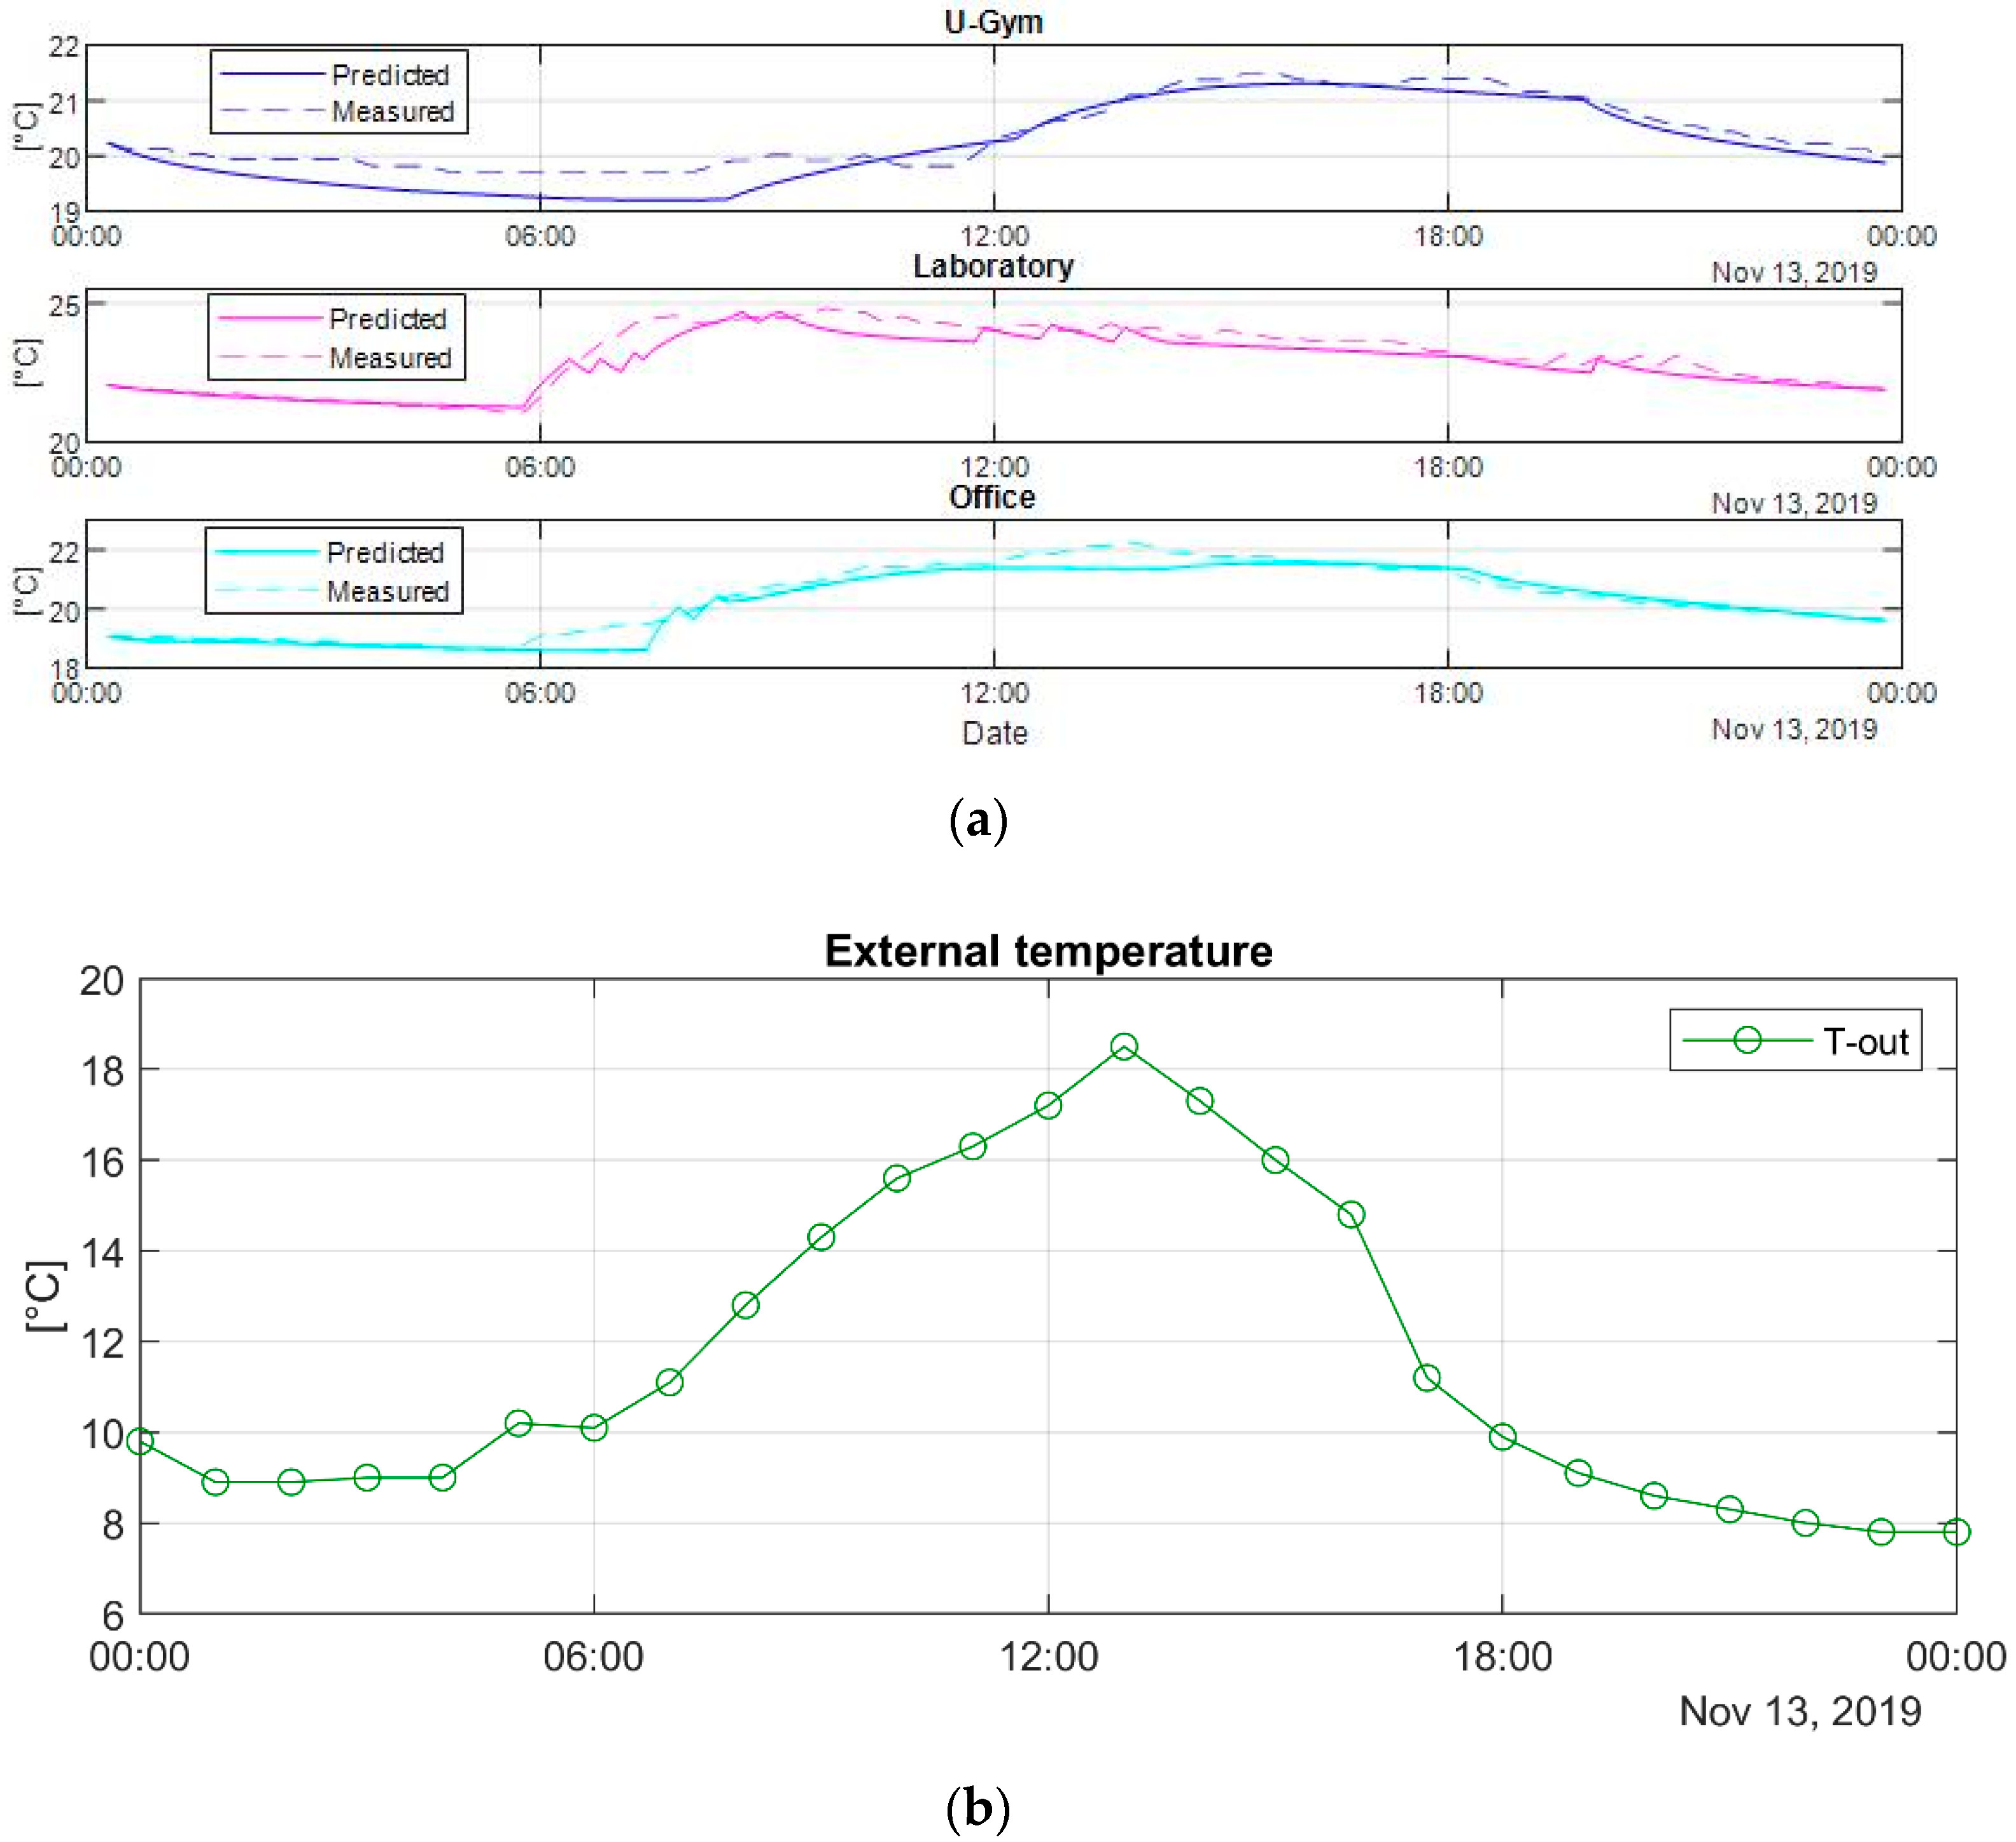
The second validation has been conducted considering data collected during daytime periods to evaluate the accuracy of the model during the operation of the fan coils system. The operation scheduling of the HVAC plant has been acquired through the SCADA system by using the operation setpoints as input for the simulator. Referring to a generic day, the resulting temperatures compared to the actual measured temperatures are plotted in Figure 11a, while Figure 11b depicts the external temperature referred to that day, which is possible to observe as the curve related to the typical on/off operation behavior of the fan coils.
In Table 1, some statistical indicators are calculated for each considered room referring to the analyzed day. In particular, the mean percentage error, the maximum percentage error, and the root mean square error.
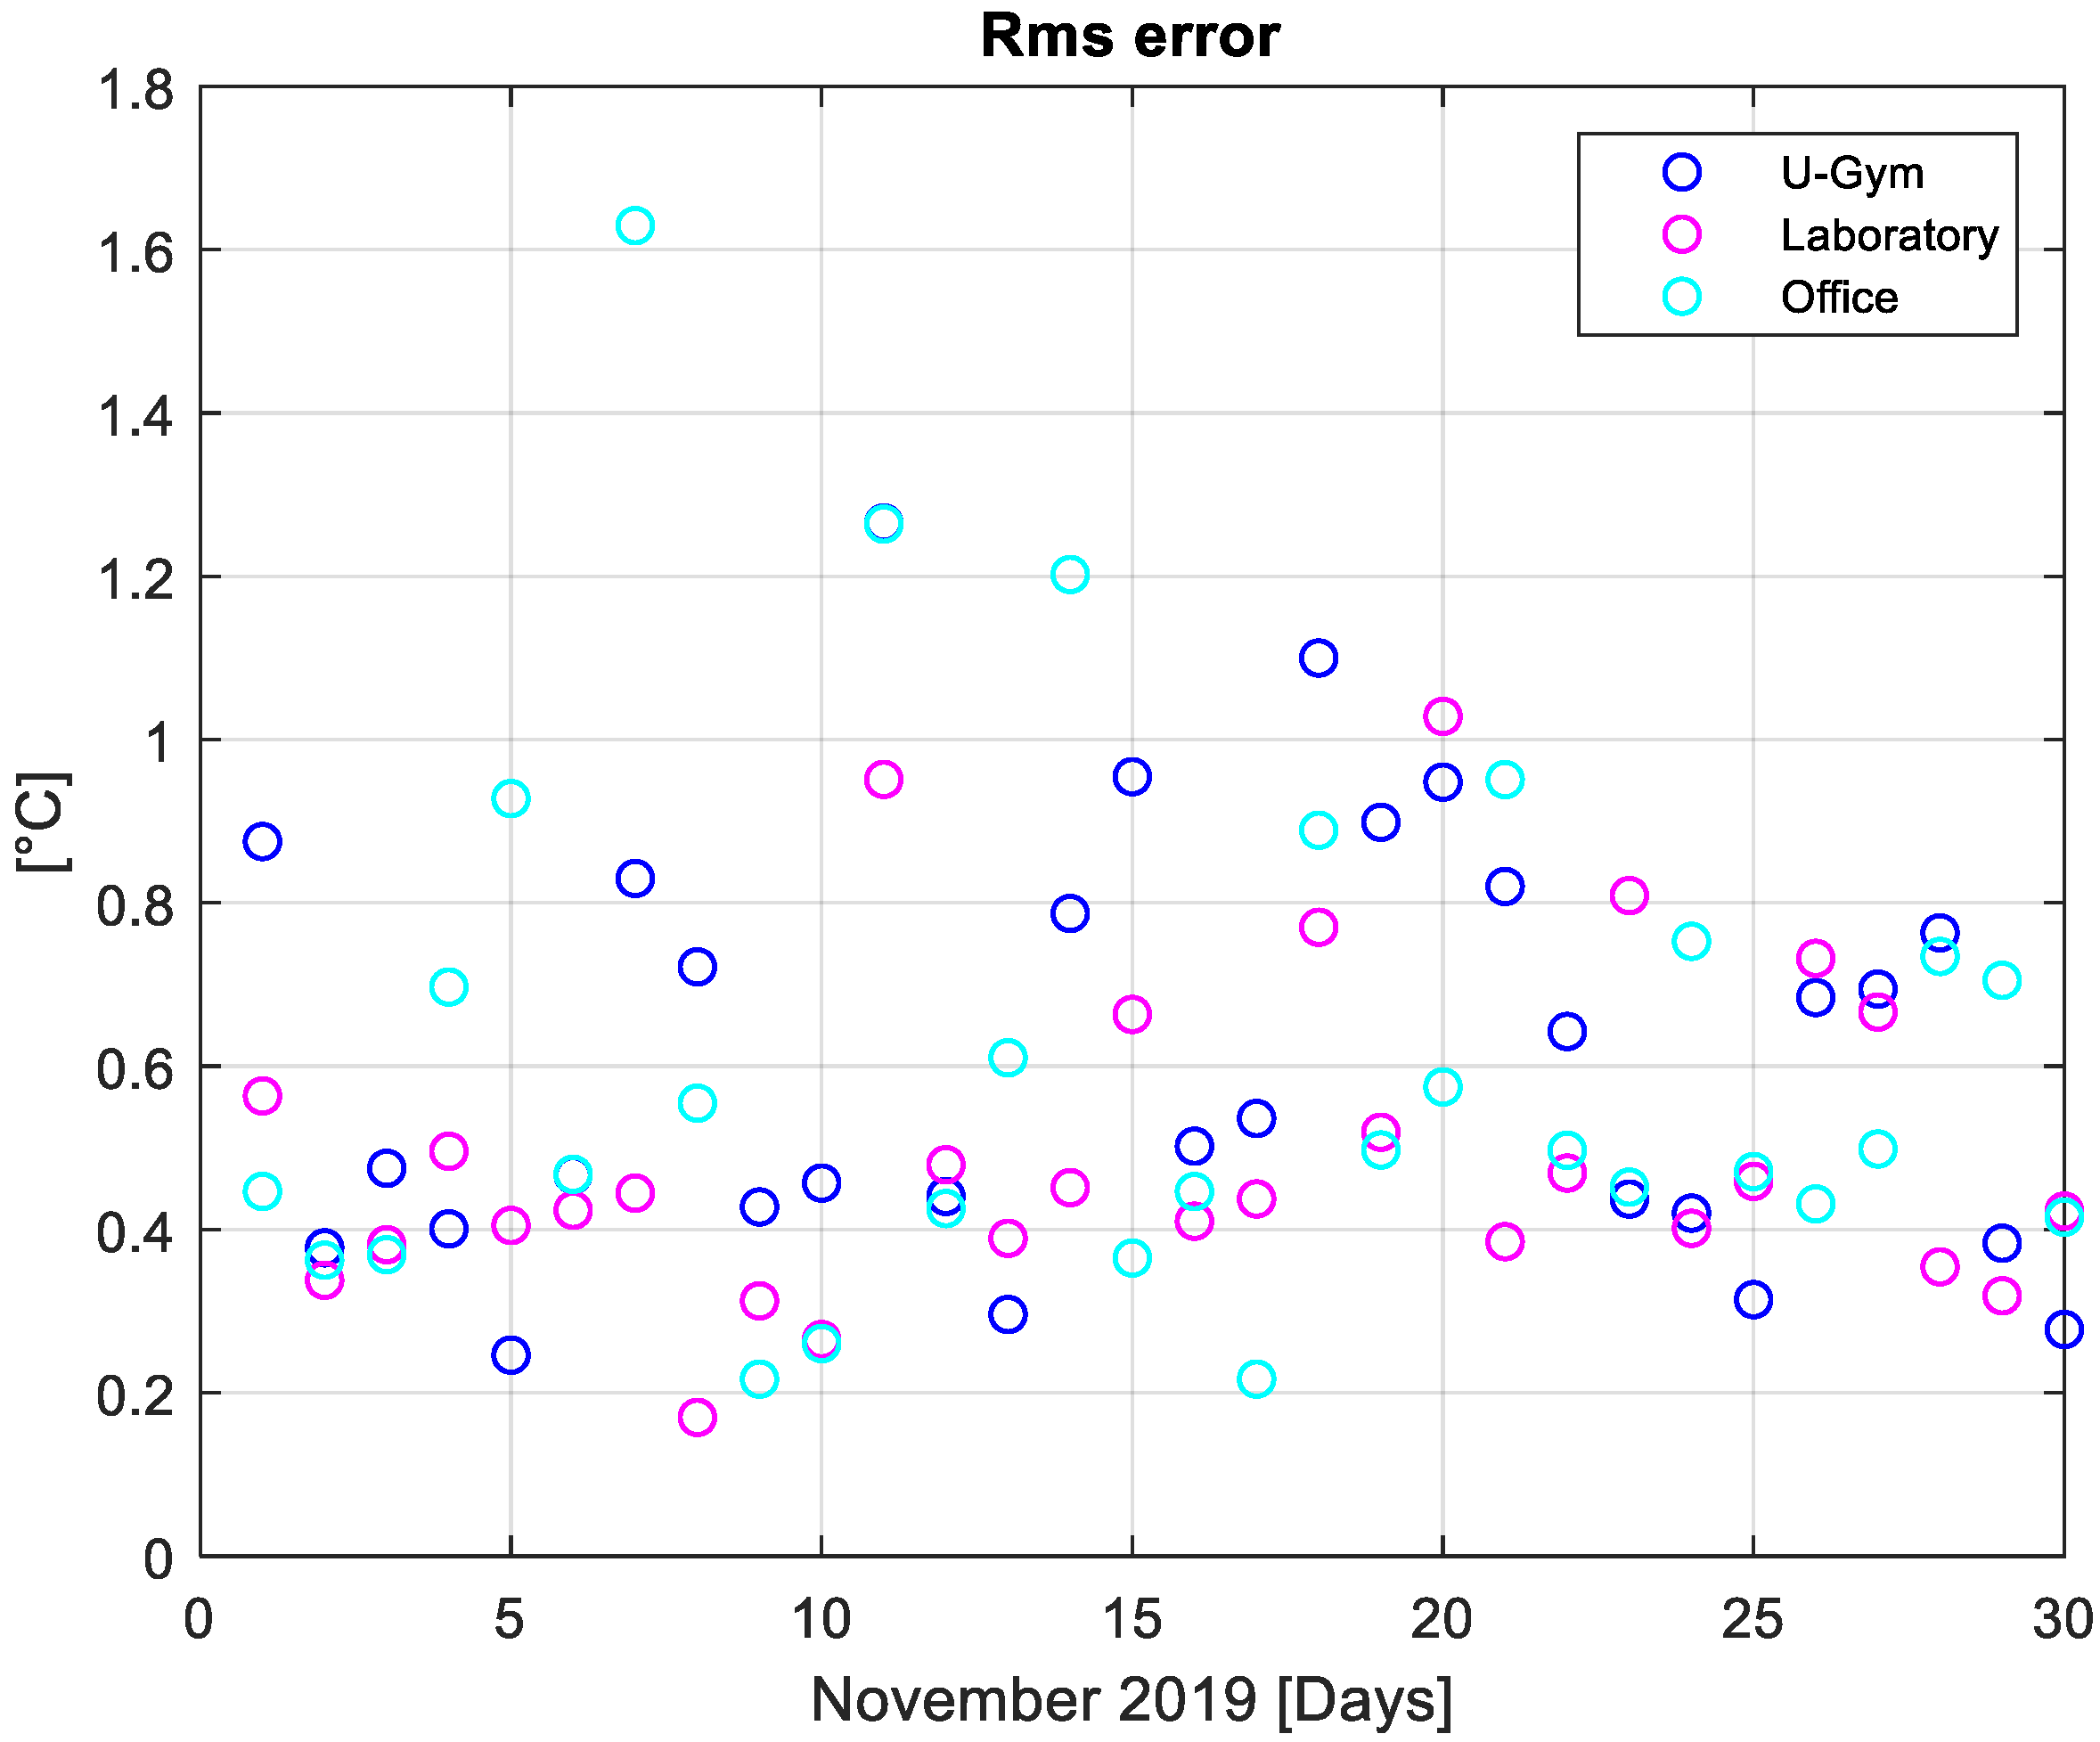
The mean percentage error and the root mean square error have also been calculated for the whole month and the results are depicted in Figure 12 and Figure 13.

4. Optimization Results

The BEMS described in Section 2 has been applied to the Smart Energy Building according to a day-ahead optimization logic. The aim is to optimally schedule the operation of the HVAC system to guarantee the thermal comfort of the occupants of each different room and at the same time to reduce the electrical energy consumption of the heat pump. The time step (Δt) of the optimization problem has been chosen equal to 15 minutes and the horizon of the optimization problem (N) is one day (N = 96); consequently, a whole day is analyzed starting from 12.00 a.m. until 12.00 a.m. of the following day. The optimal comfort temperature values ( T k , t i ) are tracked only between 8.00 a.m. and 6.00 p.m., particularly during the period of occupancy of the building. In these hours, the value of the optimal comfort temperature is assumed to be equal to 21 [°C], whereas the external ambient temperature is assumed to be constant and equal to 10 [°C] for all the following simulations.
The optimization problem has been formalized in the YALMIP environment [34], using CPLEX 12.7 as solver. The optimization has been computed on a PC Intel i7, 16 GB RAM. The average computation time was 434 seconds.

4.1. Optimization without Minimizing Heat Pump Operating Costs (Case 1)

The results here reported refer to the case of the objective function having α = 0 and μ t o c = 1. In this case, the BEMS controls the HVAC system with the only goal of tracking the comfort temperature inside the different rooms. In Figure 14, the temperature profiles of the three chosen rooms are shown. It is possible to highlight how the temperature profiles are tracking the setpoint of the temperature.
The level of comfort is evaluated, in accordance with Fanger’s model, by means of the predicted percent dissatisfied (PPD) indicator, which evaluates the percentage of thermally dissatisfied people who feel too cool or too warm [35]. The PPD values are depicted in Figure 15, whereas the mean PPD values are reported in Table 2.

4.2. Overall Optimization (Case 2)

The results described in the following refer to the case of the objective function having α = 1. In this case, the problem has a multi-objective function that presents a conflict between two opposite objectives: the tracking of the optimal comfort temperature and the reduction in the energy consumptions of the HVAC plant. Figure 16 depicts the temperature profiles of the three rooms.
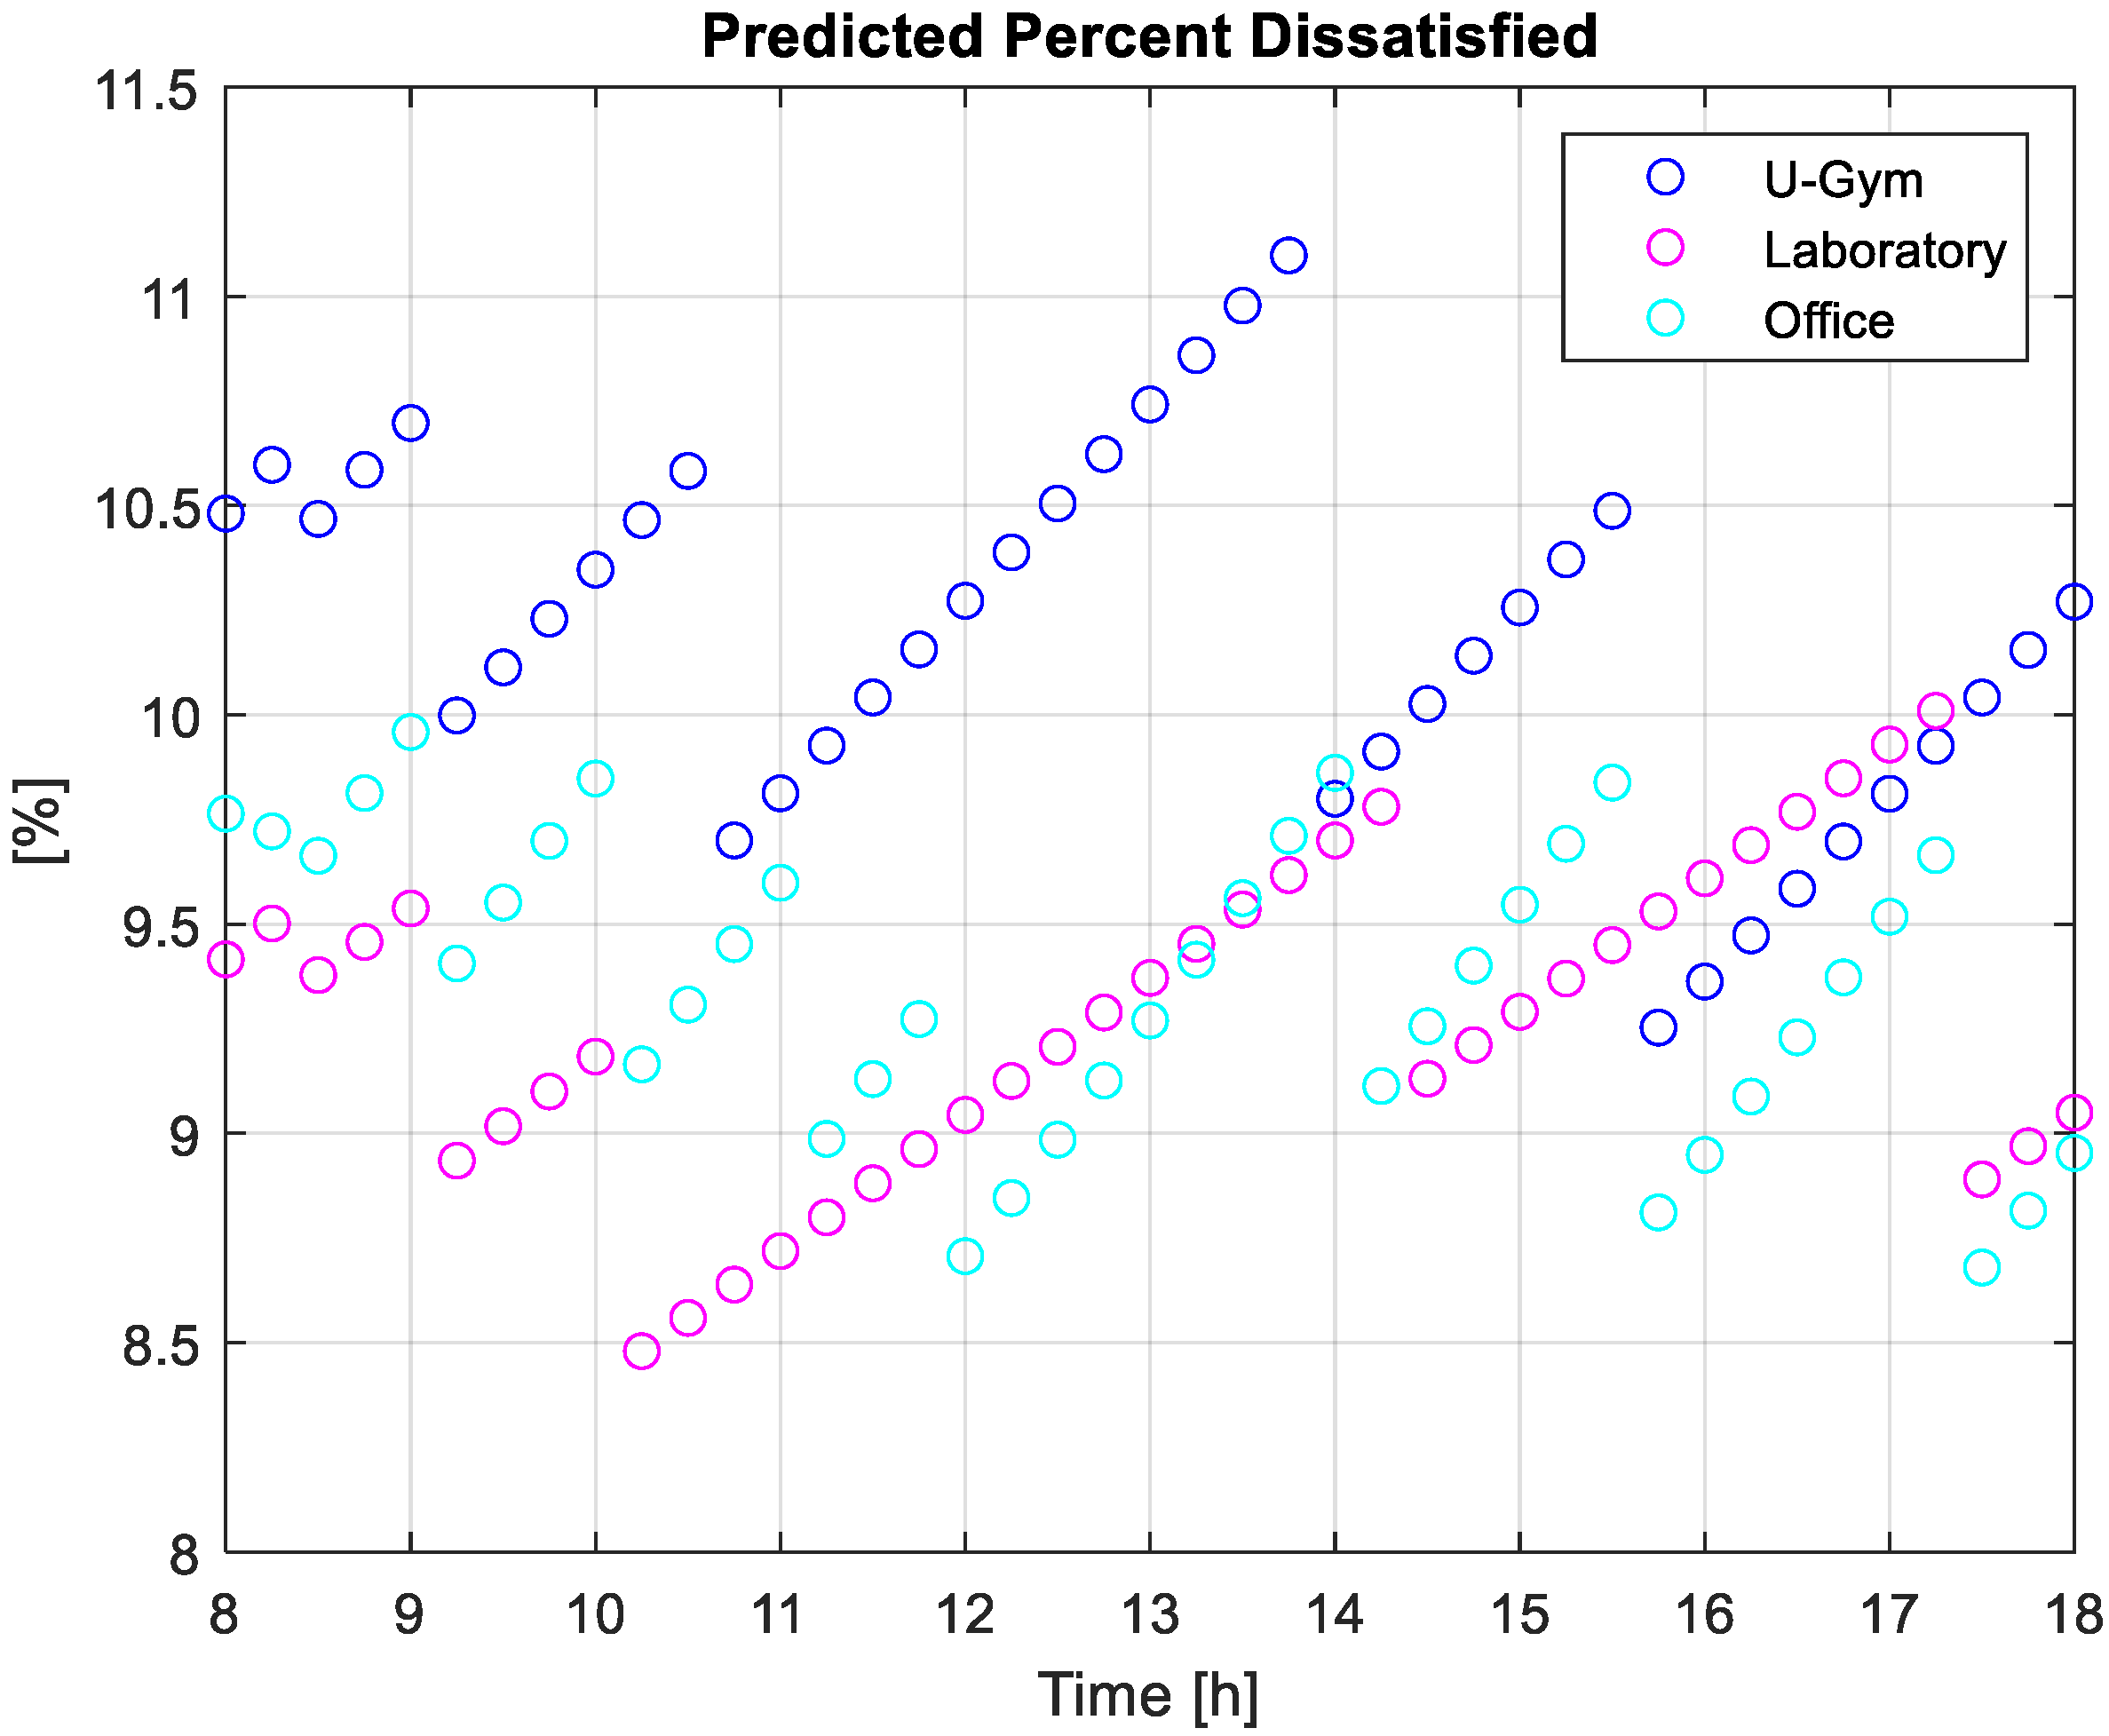
Figure 16 highlights how the room temperatures attempt to track the optimal comfort temperature during the period of occupancy of the building (8 a.m. – 6 p.m.); the temperature profiles follow the comfort temperature less effectively than in the previous case, because, in this case, the objective function has two conflictual goals, the comfort tracking and the minimization of HVAC operating costs. The average daily PPD values for the three rooms are reported in Table 3, whereas, in Figure 17, the profile of PPD is plotted during the occupancy period.
The mean values of PPD for the three rooms are within the acceptability limits imposed by the law, that is 20% [36]. Figure 17 shows how all the values of PPD never overcome 12%.
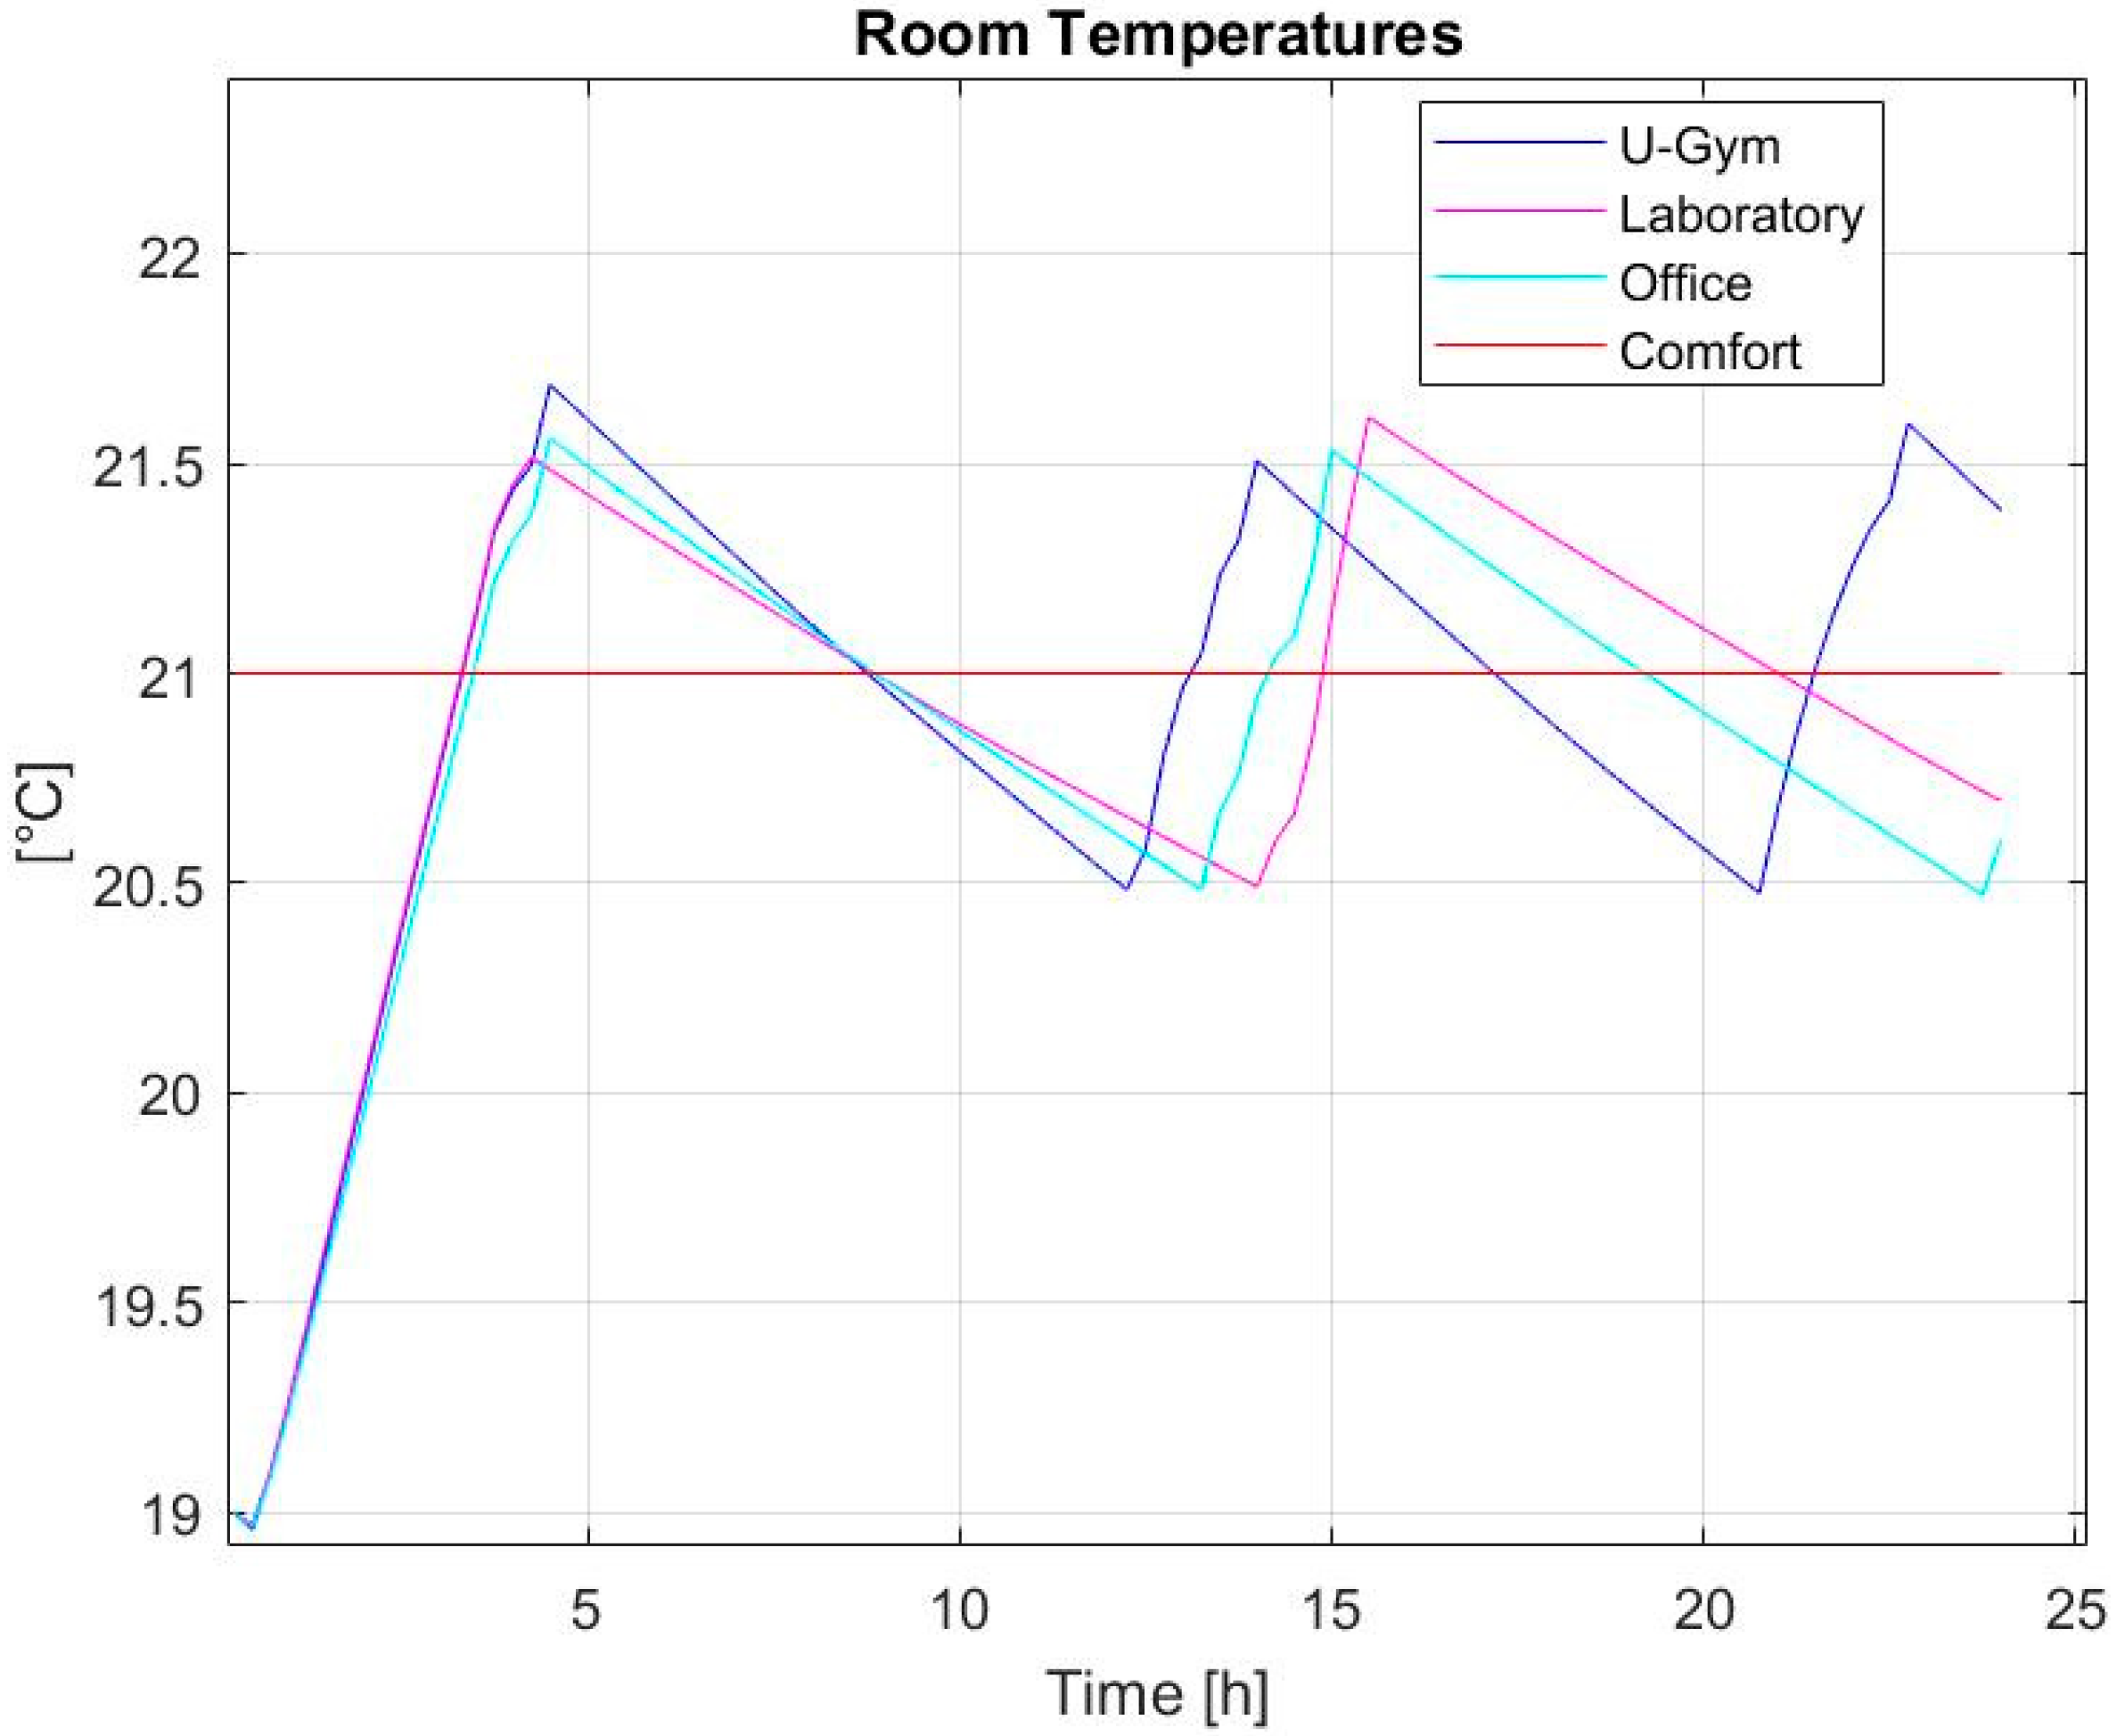
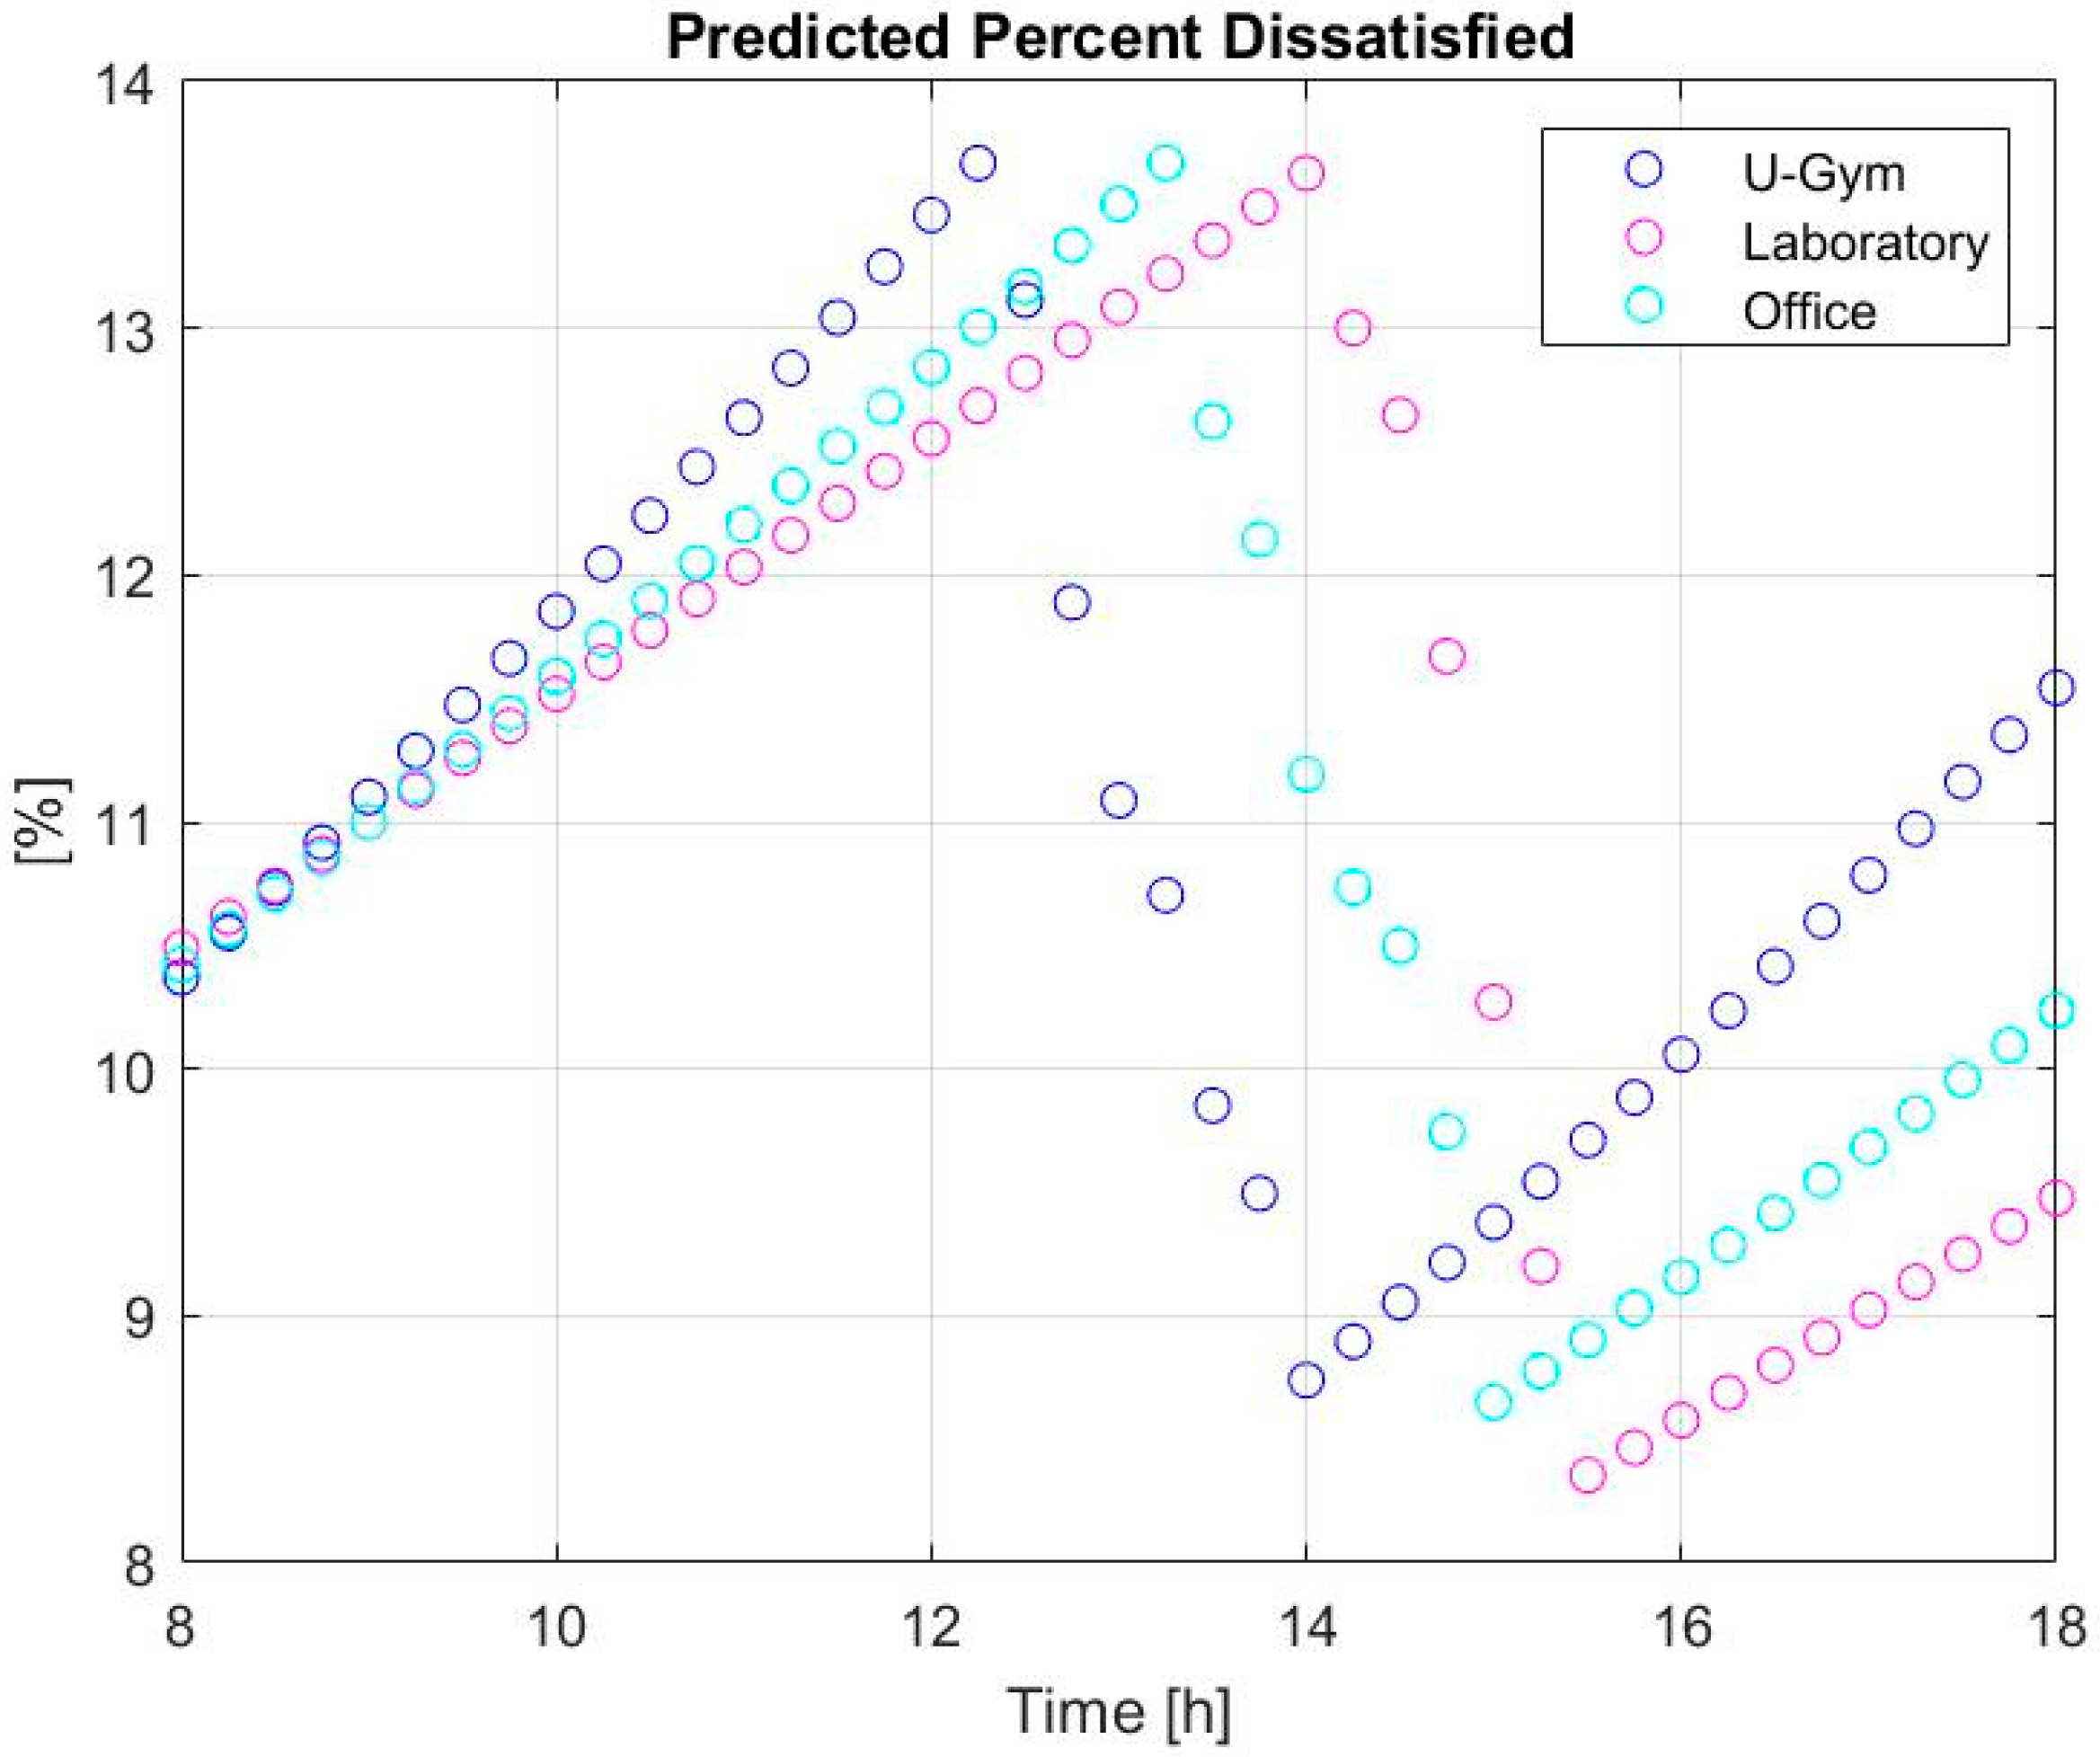
To compare the previously analyzed cases with the standard case in which the HVAC operation is not optimized by means of the BEMS tool, a case in which the proposed BEMS is not implemented within the control system of the thermal plant is simulated (case 0). In Figure 18, it is possible to see the temperature profiles of the three considered rooms.
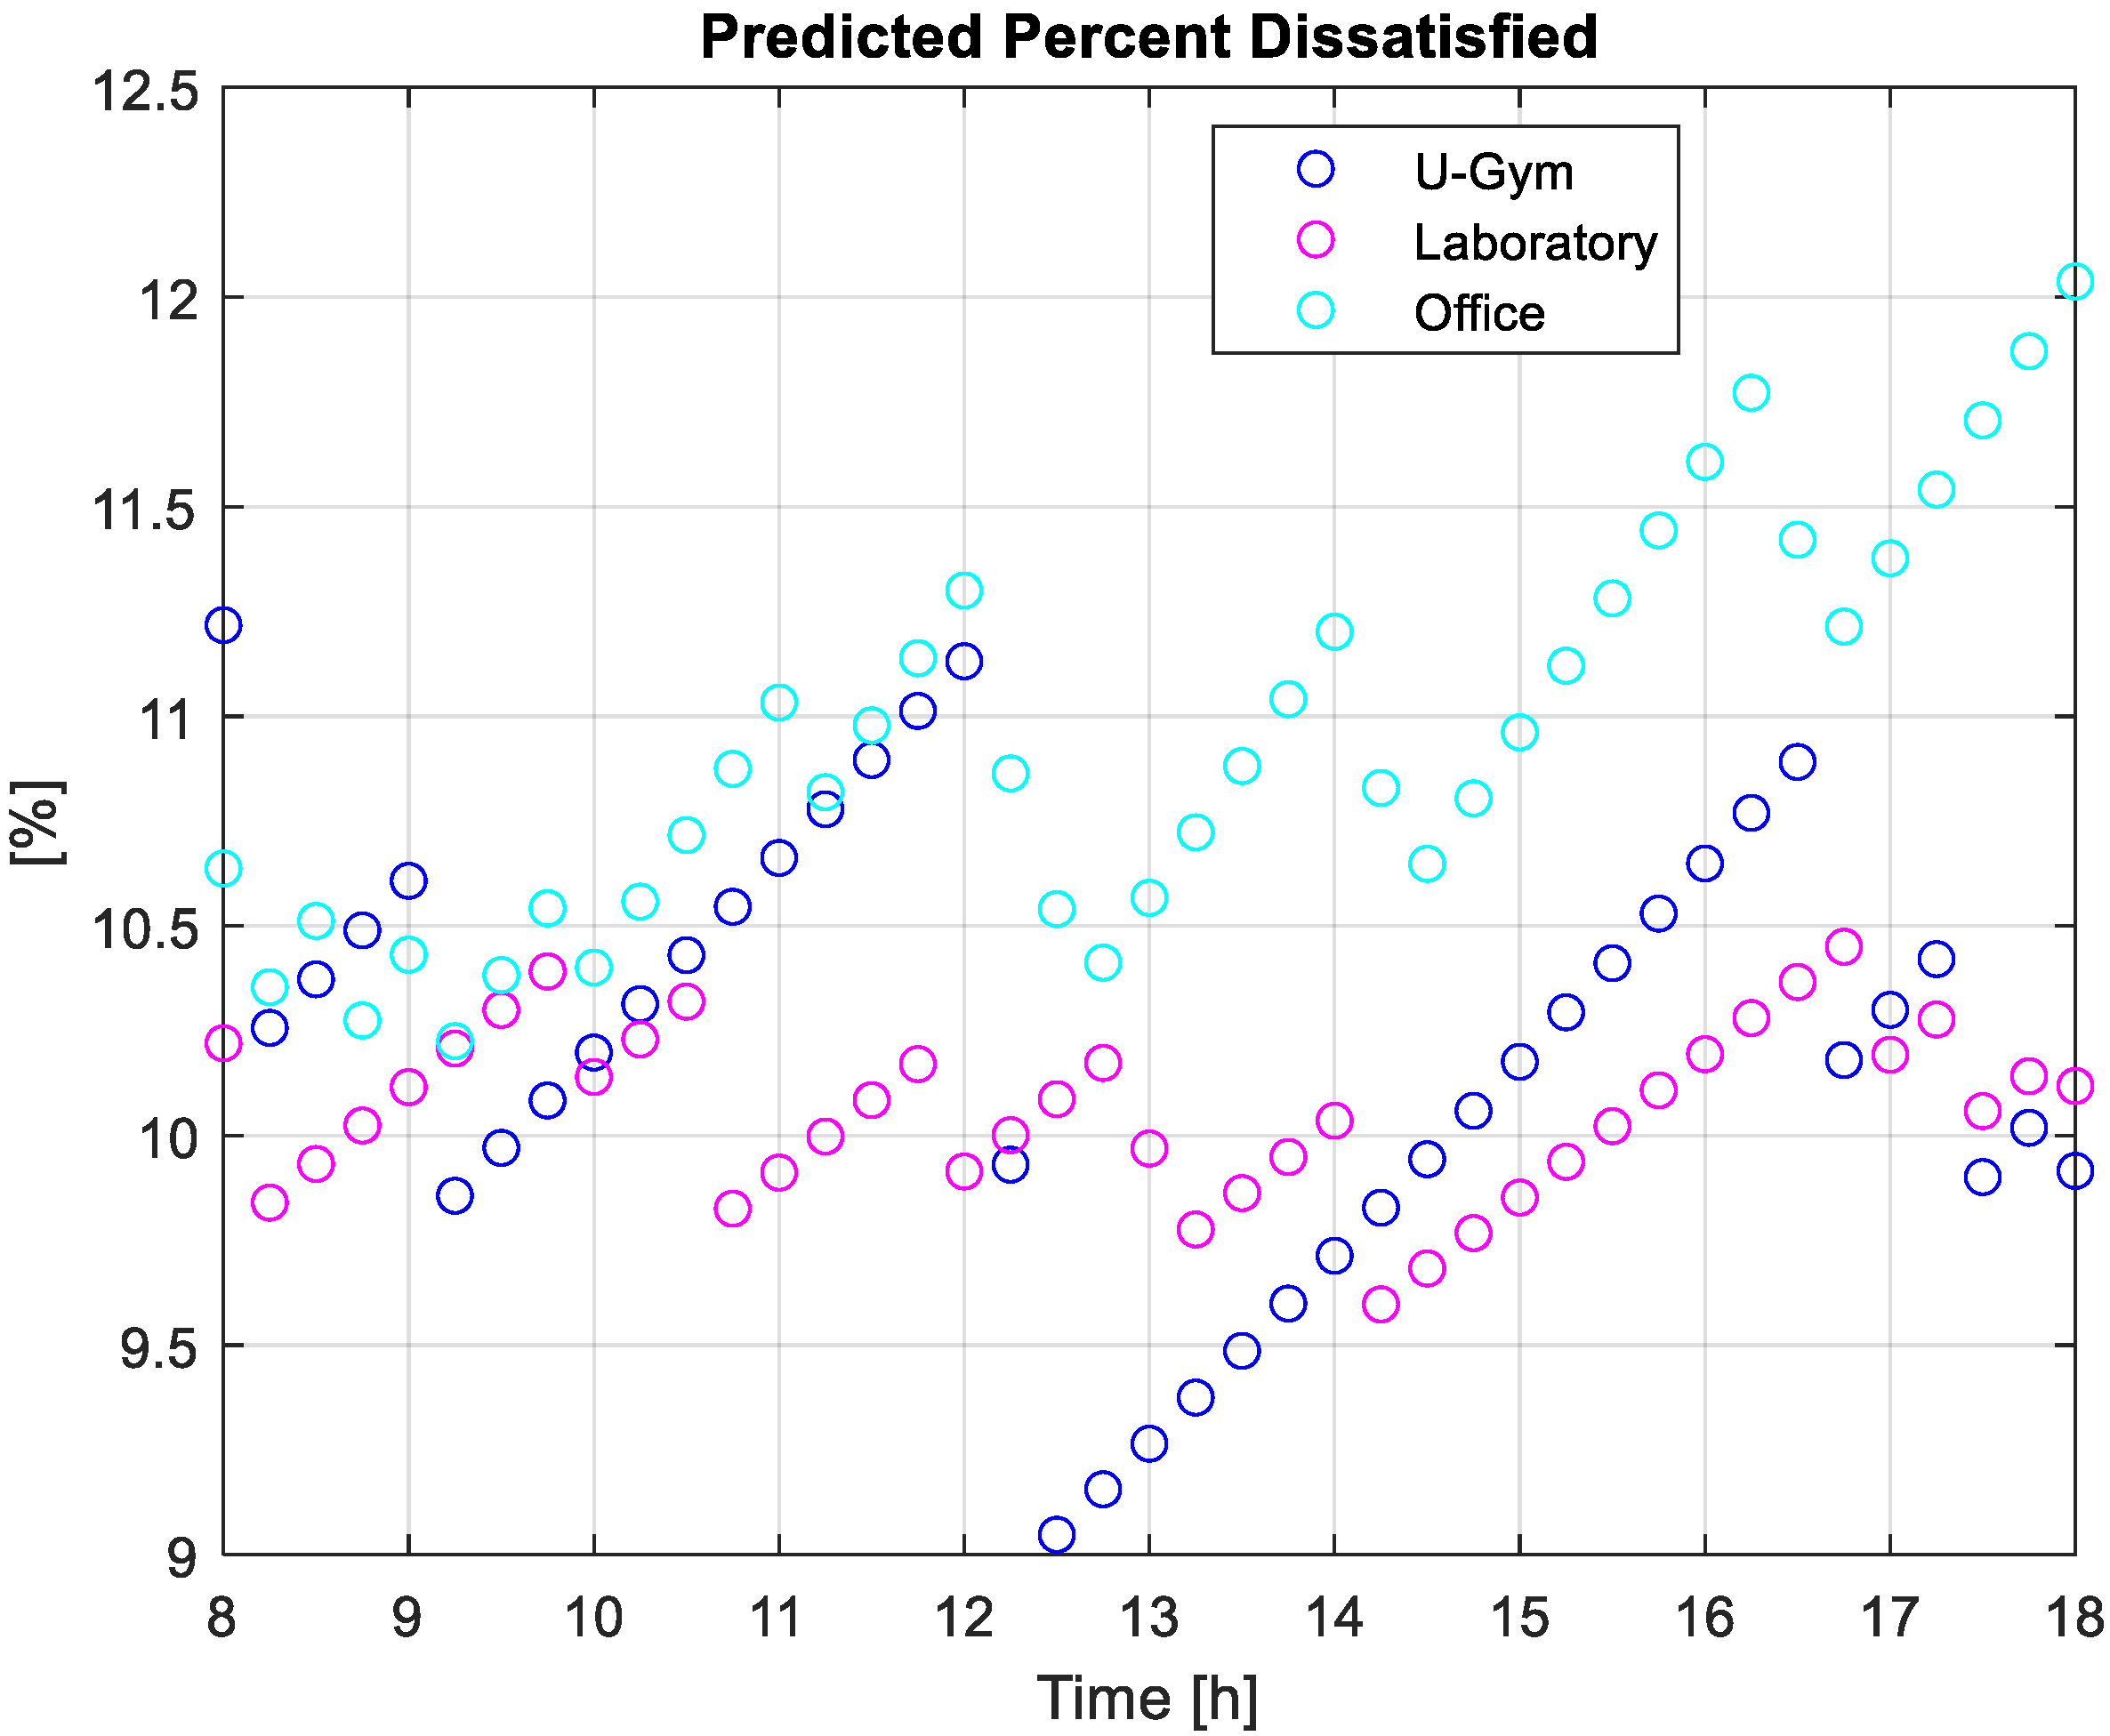
Figure 18 shows that the internal temperatures perform a hysteresis cycle within a band that has the optimal comfort temperature as its average value; this is the result of the heuristic rule that is imposed in standard operating conditions by the control of the HVAC system. The PPD values are reported in Figure 19 during the occupancy period, whereas, in Table 4, the daily average values for the three rooms are shown.
The PPD values for the three rooms are in the acceptability range. As depicted in Figure 19, the maximum PPD value never overcomes 14%.
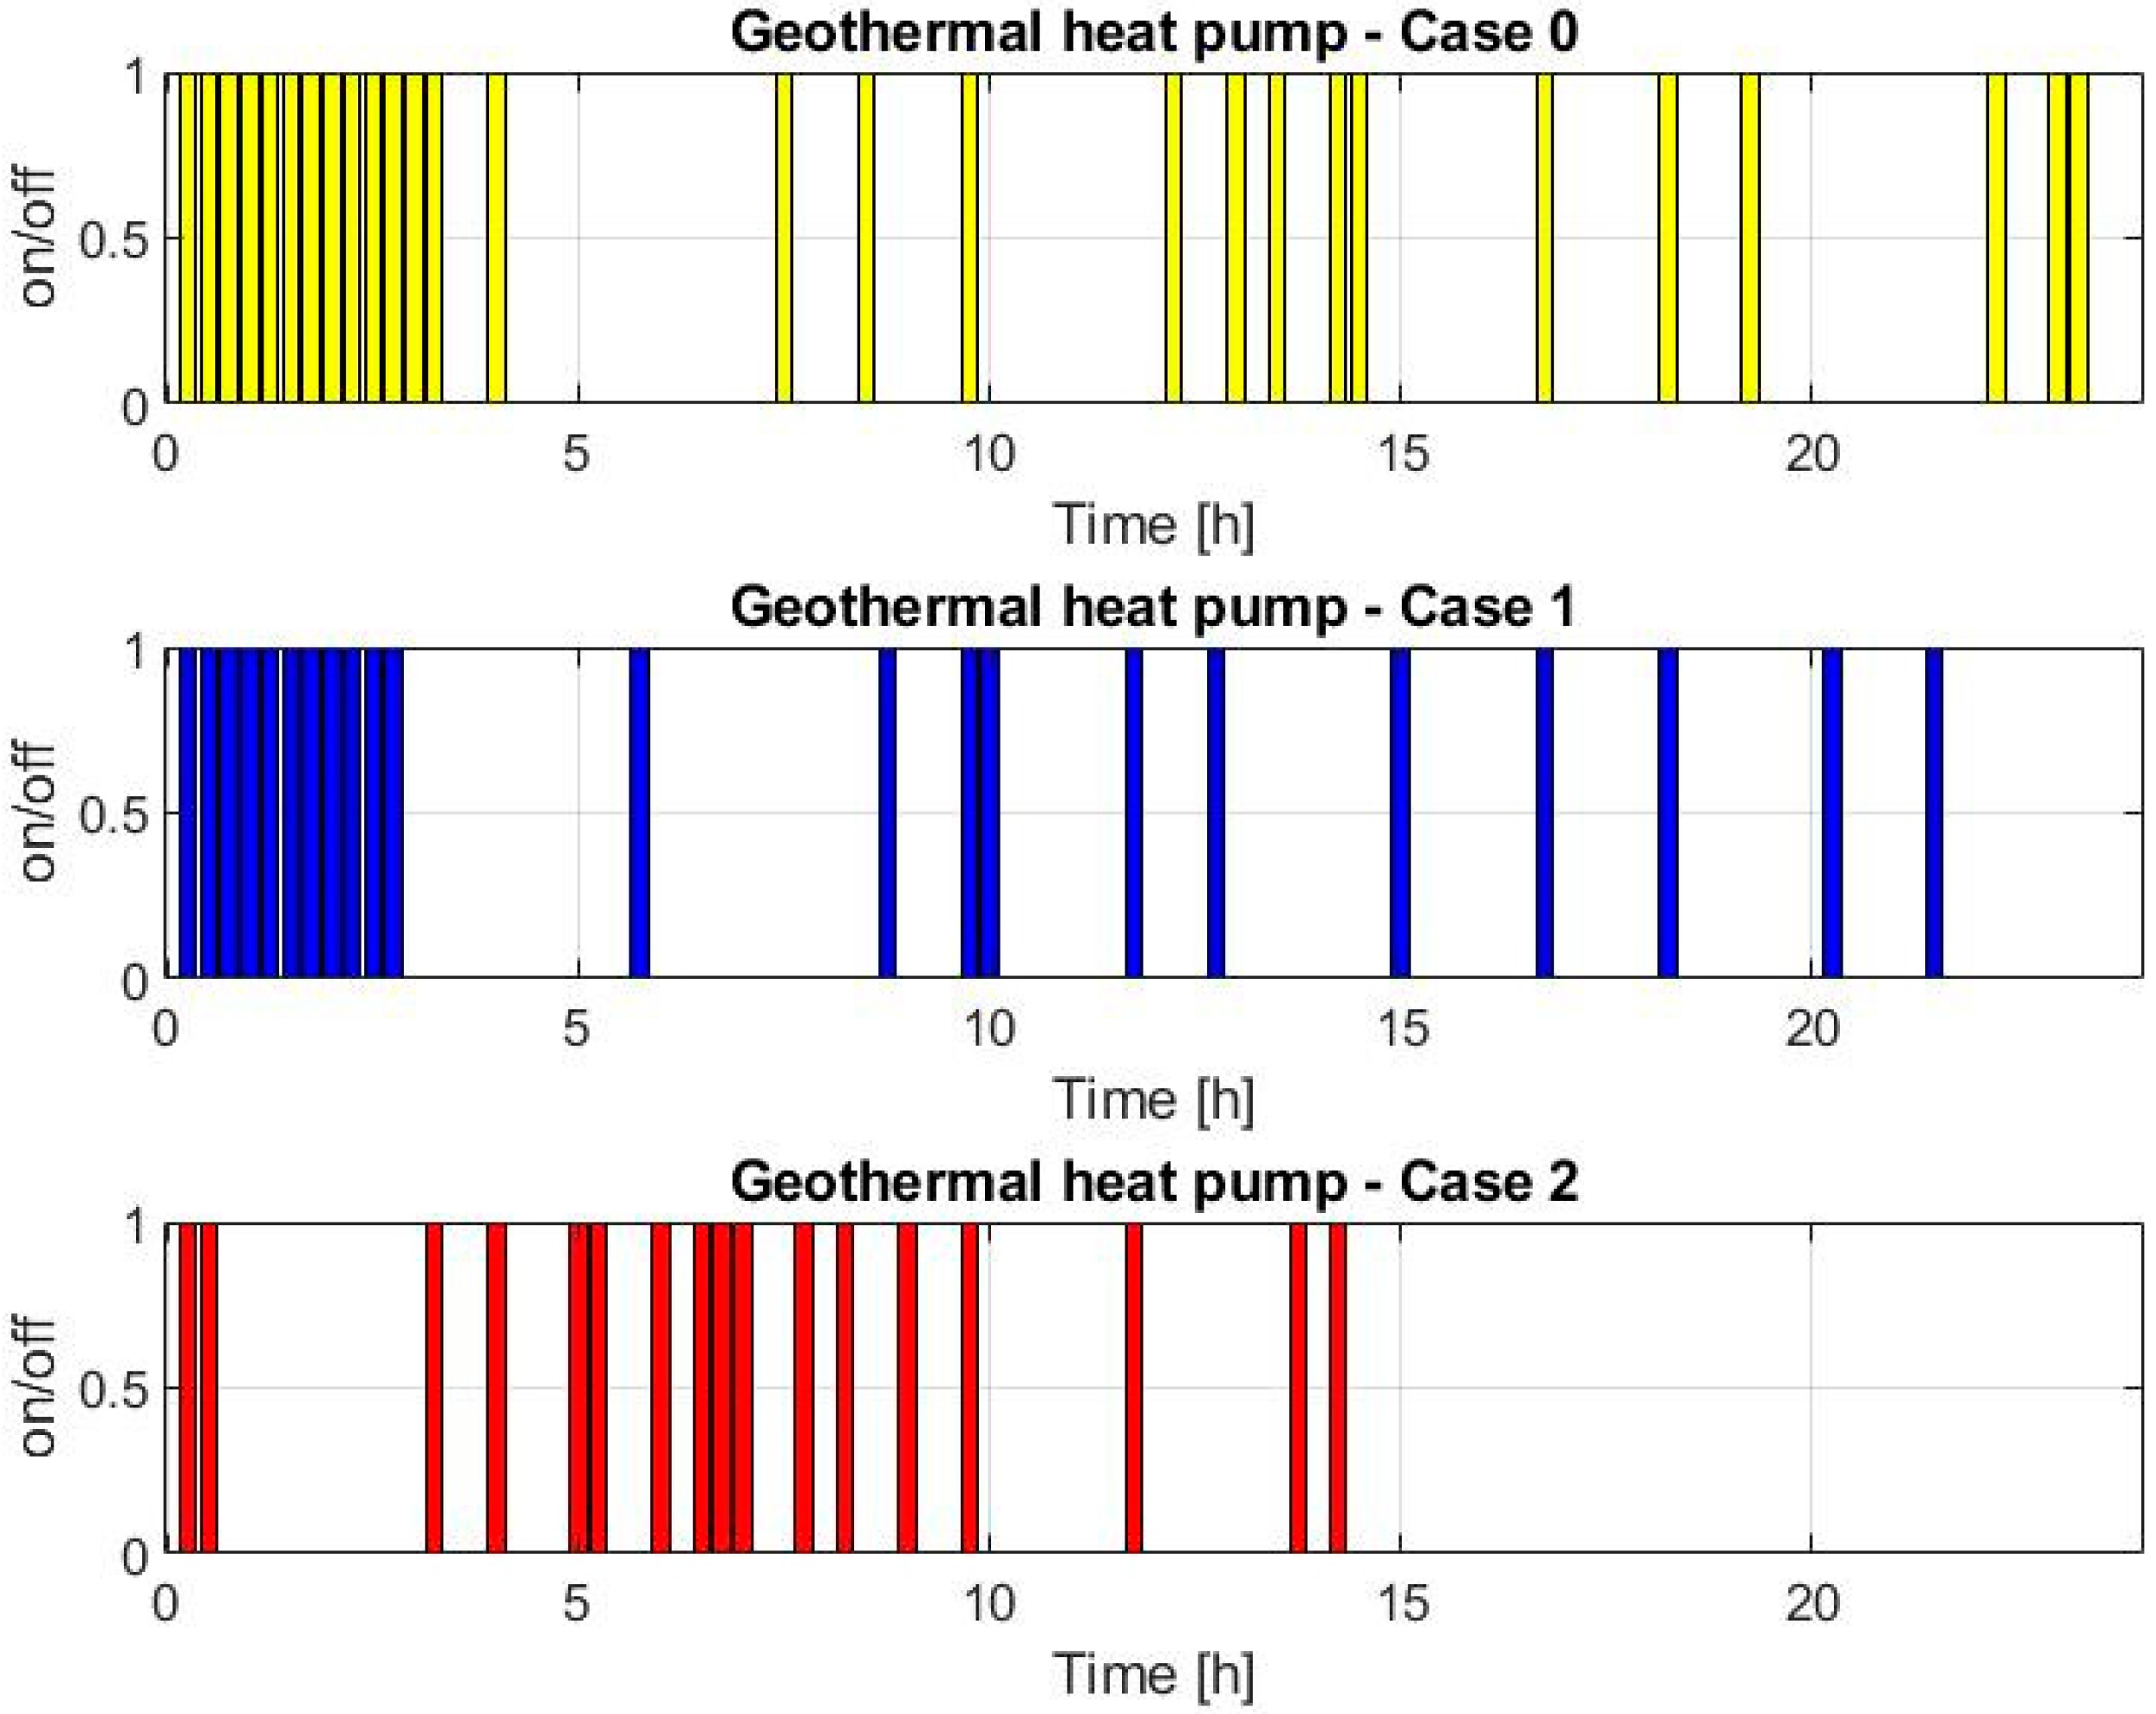
Figure 20 plots the geothermal heat pump scheduling profile for the three examined scenarios; each bar in Figure 20 indicates that the device is on for a time interval of 15 minutes.
The operating costs of the HVAC plant are reported in Table 5 for the three different cases analyzed. In case 0, Figure 18, it is considered that the HVAC system operates under control of the heuristic rule presented in Section 3.2; instead, in case 1 and 2, referred respectively to Figure 14 and Figure 16, the HVAC operates integrated with the BEMS optimization tool. In Table 5, the overall mean PPD values for each case are also collected.
As depicted in Figure 20, the HVAC behavior in the three cases is clearly different. More precisely, in case 0 and 1, the HVAC system starts to operate at the begging of the simulation in order to fill the gap between the actual temperature and the optimal comfort setpoint. During the remainder of the simulation, the HVAC operates to keep the temperature within the optimal temperature slot. The difference between case 0 and case 1 is that, in case 0, the control logic is the heuristic rule, presented in Section 3.2, since the proposed BEMS is not implemented, while, in case 1, the proposed BEMS is implemented and it optimizes the management of the HVAC plant to reach the optimal comfort temperature in the most efficient way; indeed, between the two cases, there is a significant difference in terms of electricity costs and also the PPD value is lower in case 1, as reported in Table 5, whereas, in case 2, the proposed BEMS operates also to reduce the energy consumption. The results highlight a lower daily electricity cost considering case 0 and case 1, while a higher value of PPD is detected considering case 1 in which the main goal of the BEMS is the comfort of the occupants, the PPD value of case 2 is still lower than the one of case 0.

5. Conclusions and Future Developments

A simulator for the evaluation of the thermal dynamic behavior of a building at room level has been developed basing on an equivalent electric model and by focusing on the operation of the HVAC system. The simulator has been successfully validated through real data collected on field at the Savona Campus of the Genoa University, with mean error values of around 1%. Moreover, a BEMS for the day-ahead optimal control of the HVAC system has been proposed. Future developments will investigate the possibility to adapt the BEMS to a receding horizon control scheme with the aim of using it in a demand response application.

Author Contributions

Conceptualization, G.B., S.B., F.D., L.G., M.R. (Michela Robba) and M.R. (Mansueto Rossi); Methodology, G.B., M.R. (Michela Robba) and M.R. (Mansueto Rossi); software, G.B. and L.G.; validation, G.B. and L.G.; data curation, M.R. (Mansueto Rossi); writing—original draft preparation, G.B. and S.B.; writing—review and editing, G.B. and S.B.; project administration, F.D., M.R. (Michela Robba) and M.R. (Mansueto Rossi); funding acquisition, F.D., M.R. (Michela Robba) and M.R. (Mansueto Rossi). All authors have read and agreed to the published version of the manuscript.

Funding

This research received external funding by Liguria Region and the six involved companies (ABB, SOFTECO, GRUPPO SIGLA, MAPS, FLAIRBIT, RULEX), the University of Genoa and the National Council of Research.

Acknowledgments

The work is part of the activities developed within the PICK UP project funded by Liguria Region and that involves six companies (ABB, SOFTECO, GRUPPO SIGLA, MAPS, FLAIRBIT, RULEX), the University of Genoa and the National Council of Research. The authors would like to thank all the partners for their assistance with the collection and elaboration of data.

Conflicts of Interest

The authors declare no conflict of interest.

References

  1. Delfino, F.; Ferro, G.; Minciardi, R.; Robba, M.; Rossi, M.; Rossi, M. Identification and optimal control of an electrical storage system for microgrids with renewables. Sustain. Energy Grids Netw. 2019, 17, 100183. [Google Scholar] [CrossRef]
  2. Delfino, F.; Ferro, G.; Robba, M.; Rossi, M. An Energy Management Platform for the Optimal Control of Active and Reactive Power in Sustainable Microgrids. IEEE Trans. Ind. Appl. 2019, 55, 7146–7156. [Google Scholar] [CrossRef]
  3. Rocha, P.; Siddiqui, A.; Stadler, M. Improving energy efficiency via smart building energy management systems: A comparison with policy measures. Energy Build. 2015, 88, 203–213. [Google Scholar] [CrossRef] [Green Version]
  4. Simma, K.C.J.; Mammoli, A.; Bogus, S.M. Real-time occupancy estimation using WiFi network to optimize HVAC operation. Proc. Procedia Comput. Sci. 2019, 155, 495–502. [Google Scholar] [CrossRef]
  5. Ahmad, M.W.; Mourshed, M.; Rezgui, Y. Trees vs Neurons: Comparison between random forest and ANN for high-resolution prediction of building energy consumption. Energy Build. 2017, 147, 77–89. [Google Scholar] [CrossRef]
  6. Kim, N.K.; Shim, M.H.; Won, D. Building Energy Management Strategy Using an HVAC System and Energy Storage System. Energies 2018, 11, 2690. [Google Scholar] [CrossRef] [Green Version]
  7. Boodi, A.; Beddiar, K.; Benamour, M.; Amirat, Y.; Benbouzid, M. Intelligent systems for building energy and occupant comfort optimization: A state of the art review and recommendations. Energies 2018, 11, 2604. [Google Scholar] [CrossRef] [Green Version]
  8. Hurtado, L.A.; Nguyen, P.H.; Kling, W.L.; Zeiler, W. Building energy management systems-Optimization of comfort and energy use. In Proceedings of the 2013 48th International Universities’ Power Engineering Conference (UPEC), Dublin, Ireland, 2–5 September 2013; pp. 1–6. [Google Scholar]
  9. Zhang, D.; Shah, N.; Papageorgiou, L.G. Efficient energy consumption and operation management in a smart building with microgrid. Energy Convers. Manag. 2013, 74, 209–222. [Google Scholar] [CrossRef]
  10. Shakeri, M.; Shayestegan, M.; Abunima, H.; Reza, S.M.S.; Akhtaruzzaman, M.; Alamoud, A.R.M.; Sopian, K.; Amin, N. An intelligent system architecture in home energy management systems (HEMS) for efficient demand response in smart grid. Energy Build. 2017, 138, 154–164. [Google Scholar] [CrossRef]
  11. Li, X.; Malkawi, A. Multi-objective optimization for thermal mass model predictive control in small and medium size commercial buildings under summer weather conditions. Energy 2016, 112, 1194–1206. [Google Scholar] [CrossRef]
  12. Tang, R.; Wang, S. Model predictive control for thermal energy storage and thermal comfort optimization of building demand response in smart grids. Appl. Energy 2019, 242, 873–882. [Google Scholar] [CrossRef]
  13. Bahramnia, P.; Rostami, S.M.H.; Wang, J.; Kim, G. Modeling and controlling of temperature and humidity in building heating, ventilating, and air conditioning system using model predictive control. Energies 2019, 12, 4805. [Google Scholar] [CrossRef] [Green Version]
  14. Serale, G.; Fiorentini, M.; Capozzoli, A.; Bernardini, D.; Bemporad, A. Model Predictive Control (MPC) for enhancing building and HVAC system energy efficiency: Problem formulation, applications and opportunities. Energies 2018, 11, 631. [Google Scholar] [CrossRef] [Green Version]
  15. Ogunsola, O.T.; Song, L.; Wang, G. Development and validation of a time-series model for real-time thermal load estimation. Energy Build. 2014, 76, 440–449. [Google Scholar] [CrossRef]
  16. Samarji, T.; Jouni, A.; Karaki, A. Net zero energy buildings: Application in Lebanon on a typical residential building. In Proceedings of the 2012 International Conference on Renewable Energies for Developing Countries (REDEC), Beirut, Lebanon, 28–29 November 2012; pp. 1–7. [Google Scholar]
  17. Barbhuiya, S.; Barbhuiya, S. Thermal comfort and energy consumption in a UK educational building. Build. Environ. 2013, 68, 1–11. [Google Scholar] [CrossRef]
  18. Delfino, F.; Procopio, R.; Rossi, M.; Bracco, S.; Brignone, M.; Robba, M. Microgrid Design and Operation: Toward Smart Energy in Cities; Artech House: Norwood, MA, USA, 2018. [Google Scholar]
  19. Tang, R.; Wang, S.; Xu, L. An MPC-based optimal control strategy of active thermal storage in commercial buildings during fast demand response events in smart grids. Energy Procedia 2019, 158, 2506–2511. [Google Scholar] [CrossRef]
  20. Li, X.; Wen, J. Review of building energy modeling for control and operation. Renew. Sustain. Energy Rev. 2014, 37, 517–537. [Google Scholar] [CrossRef]
  21. Ji, Y.; Xu, P.; Duan, P.; Lu, X. Estimating hourly cooling load in commercial buildings using a thermal network model and electricity submetering data. Appl. Energy 2016, 169, 309–323. [Google Scholar] [CrossRef]
  22. De Coninck, R.; Helsen, L. Quantification of flexibility in buildings by cost curves - Methodology and application. Appl. Energy 2016, 162, 653–665. [Google Scholar] [CrossRef]
  23. Park, S.H.; Chung, W.J.; Yeo, M.S.; Kim, K.W. Evaluation of the thermal performance of a Thermally Activated Building System (TABS) according to the thermal load in a residential building. Energy Build. 2014, 73, 69–82. [Google Scholar] [CrossRef]
  24. Crawley, D.B.; Hand, J.W.; Kummert, M.; Griffith, B.T. Contrasting the capabilities of building energy performance simulation programs. Build. Environ. 2008, 43, 661–673. [Google Scholar] [CrossRef] [Green Version]
  25. Missaoui, R.; Joumaa, H.; Ploix, S.; Bacha, S. Managing energy Smart Homes according to energy prices: Analysis of a Building Energy Management System. Energy Build. 2014, 71, 155–167. [Google Scholar] [CrossRef]
  26. Vogler-Finck, P.J.C.; Wisniewski, R.; Popovski, P. Reducing the carbon footprint of house heating through model predictive control—A simulation study in Danish conditions. Sustain. Cities Soc. 2018, 42, 558–573. [Google Scholar] [CrossRef]
  27. Bracco, S.; Delfino, F.; Laiolo, P.; Morini, A. Planning & open-air demonstrating smart city sustainable districts. Sustainability 2018, 10, 1–14. [Google Scholar]
  28. Braun, J.E.; Chaturvedi, N. An inverse gray-box model for transient building load prediction. HVAC R Res. 2002, 8, 73–99. [Google Scholar] [CrossRef]
  29. ASHRAE 2017. ASHRAE Fundamental Handbook SI; ASHRAE: Atlanta, GA, USA, 2017; ISBN 6785392187. [Google Scholar]
  30. Shamsi, M.H.; O’Grady, W.; Ali, U.; O’Donnell, J. A generalization approach for reduced order modelling of commercial buildings. Energy Procedia 2017, 122, 901–906. [Google Scholar] [CrossRef]
  31. Mantovani, G.; Ferrarini, L.; Member, S. With Model Predictive Control Techniques. IEEE Trans. Ind. Electron. 2015, 62, 2651–2660. [Google Scholar] [CrossRef]
  32. Fanger, P.O. Assessment of man’s thermal comfort in practice. Br. J. Ind. Med. 1973, 30, 313–324. [Google Scholar] [CrossRef] [Green Version]
  33. Savola, T.; Fogelholm, C.J. MINLP optimisation model for increased power production in small-scale CHP plants. Appl. Therm. Eng. 2007, 27, 89–99. [Google Scholar] [CrossRef]
  34. Löfberg, J. YALMIP: A toolbox for modeling and optimization in MATLAB. In Proceedings of the 2004 IEEE International Conference on Robotics and Automation (IEEE Cat. No.04CH37508), New Orleans, LA, USA, 2–4 September 2004; pp. 284–289. [Google Scholar]
  35. Djongyang, N.; Tchinda, R.; Njomo, D. Thermal comfort. A review paper. Renew. Sustain. Energy Rev. 2010, 14, 2626–2640. [Google Scholar] [CrossRef]
  36. Carlucci, S.; Bai, L.; de Dear, R.; Yang, L. Review of adaptive thermal comfort models in built environmental regulatory documents. Build. Environ. 2018, 137, 73–89. [Google Scholar] [CrossRef]
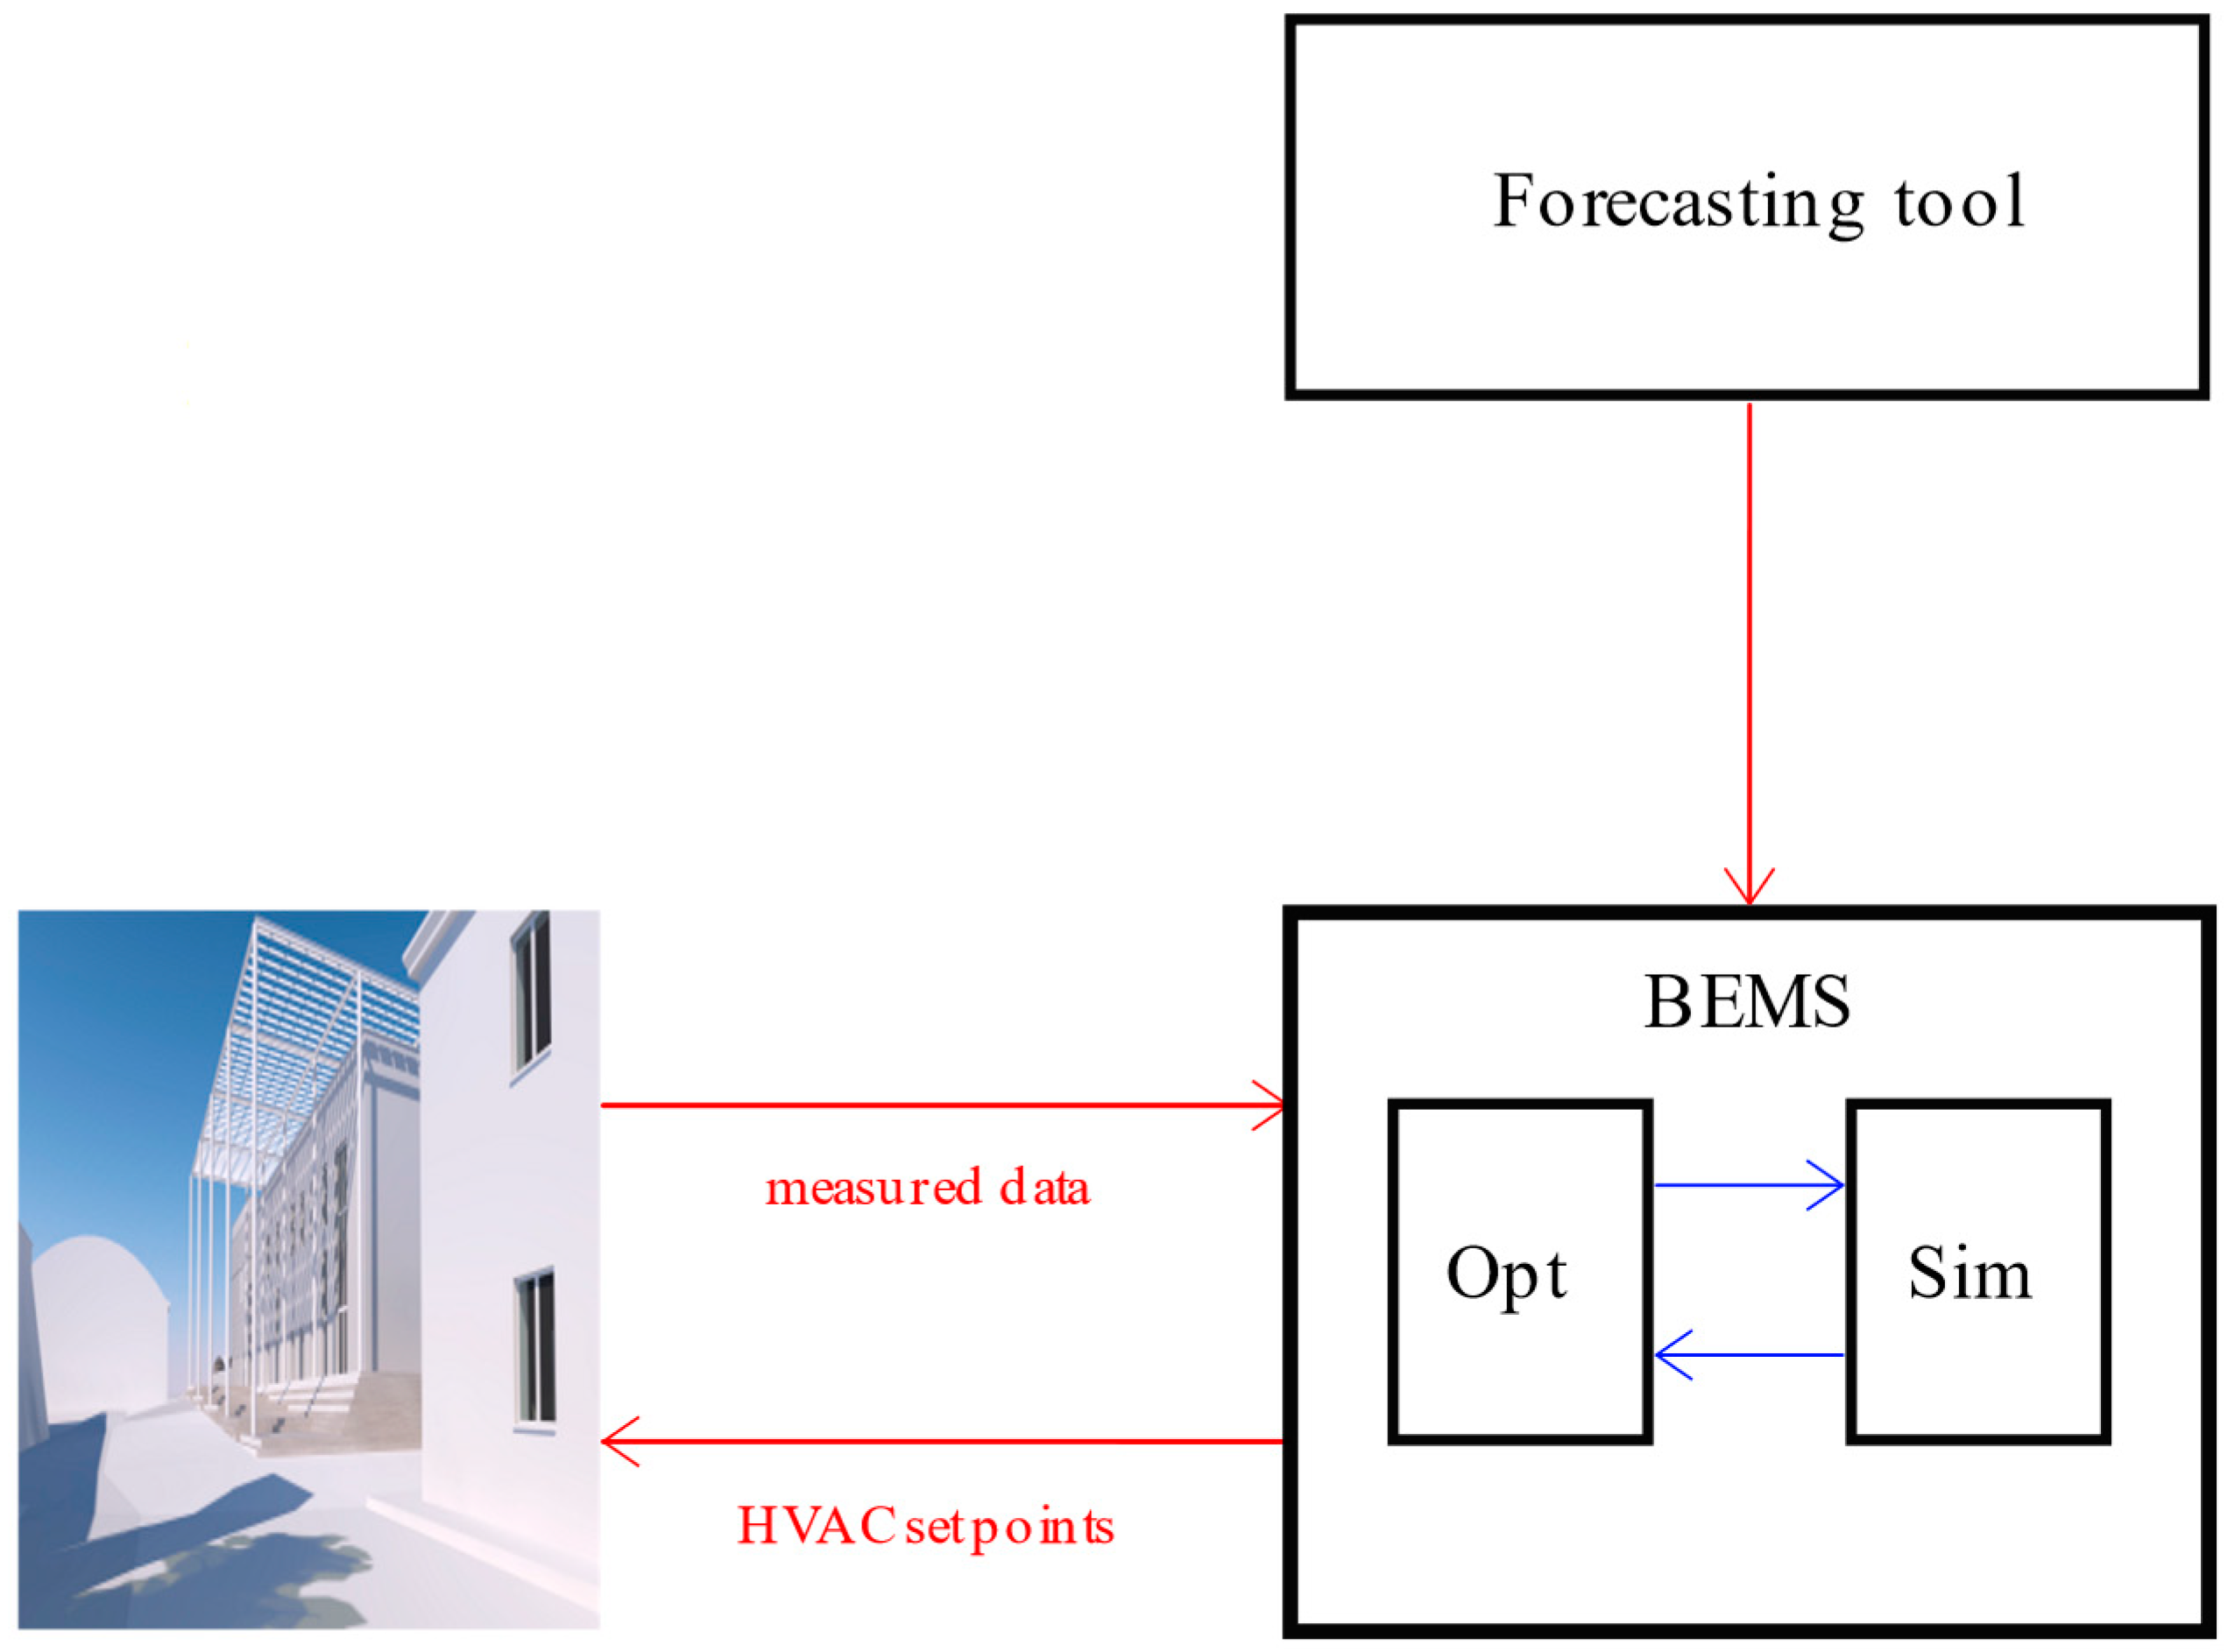
Figure 1. The proposed Building Energy Management System (BEMS) architecture.
Energies 13 01689 g001
Figure 2. The equivalent circuit model for the generic kth room.
Energies 13 01689 g002
Figure 3. Scheme of the Heating, Ventilation and Air Conditioning System (HVAC) plant.
Energies 13 01689 g003
Figure 4. The Smart Energy Building.
Energies 13 01689 g004
Figure 5. The geothermal plant.
Energies 13 01689 g005
Figure 6. (a) Smart Energy Building (SEB) ground floor; (b) SEB first floor.
Energies 13 01689 g006
Figure 7. Nighttime room and external temperatures.
Energies 13 01689 g007
Figure 8. Nighttime temperature mean percentage error.
Energies 13 01689 g008
Figure 9. Nighttime temperature maximum percentage error.
Energies 13 01689 g009
Figure 10. Nighttime temperature root mean square error.
Energies 13 01689 g010
Figure 11. (a) Daytime room temperatures. (b) Daytime external temperatures.
Energies 13 01689 g011
Figure 12. Daytime temperatures mean percentage error.
Energies 13 01689 g012
Figure 13. Daytime temperature root mean square error.
Energies 13 01689 g013
Figure 14. Room temperature profiles in the case of only comfort temperature tracking.
Energies 13 01689 g014
Figure 15. Predicted percent dissatisfied values.
Energies 13 01689 g015
Figure 16. Room temperature profiles in the case of comfort temperature tracking and energy consumption minimization.
Energies 13 01689 g016
Figure 17. Predicted percent dissatisfied values.
Energies 13 01689 g017
Figure 18. Room temperature profiles in the case of standard HVAC plant control logic.
Energies 13 01689 g018
Figure 19. Predicted percent dissatisfied values.
Energies 13 01689 g019
Figure 20. Geothermal heat pump operation scheduling, in the three different cases.
Energies 13 01689 g020
Table 1. Discomfort indicator values.
Room NameMean Error [%]Max Error [%]Rms Error [°C]
U-Gym1.23.50.3
Laboratory1.26.10.4
Office1.04.70.3
Table 2. Discomfort indicator values.
Room NameAverage Predicted Percent Dissatisfied [%]
U-Gym10.1
Laboratory9.3
Office9.4
Table 3. Discomfort indicator values.
Room NameAverage Predicted Percent Dissatisfied [%]
U-Gym10.2
Laboratory10.1
Office10.9
Table 4. Discomfort indicator values.
Room NameAverage Predicted Percent Dissatisfied [%]
U-Gym11.05
Laboratory11.11
Office11.06
Table 5. HVAC plant daily operating costs and predicted percent dissatisfied (PPD) mean values.
CaseCost [€]PPD [%]
Case 036.7511.07
Case 128.879.61
Case 222.3110.4