Article

A Dual-Stage Modeling and Optimization Framework for Wayside Energy Storage in Electric Rail Transit Systems

1
Department of Electrical Engineering, The City University of New York, City College, 160 Convent Avenue, New York, NY 10031, USA
2
Department of Electrical Engineering, Faculty of Engineering, Minia University, Minia 61512, Egypt
*
Author to whom correspondence should be addressed.
Energies 2020, 13(7), 1614; https://doi.org/10.3390/en13071614
Submission received: 24 February 2020 / Revised: 20 March 2020 / Accepted: 24 March 2020 / Published: 1 April 2020
(This article belongs to the Section F: Electrical Engineering)

Abstract

:
In this paper, a dual-stage modeling and optimization framework has been developed to obtain an optimal combination and size of wayside energy storage systems (WESSs) for application in DC rail transportation. Energy storage technologies may consist of a standalone battery, a standalone supercapacitor, a standalone flywheel, or a combination of these. Results from the dual-stage modeling and optimization process have been utilized for deducing an application-specific composition of type and size of the WESSs. These applications consist of different percentages of energy saving due to regenerative braking, voltage regulation, peak demand reduction, estimated payback period, and system resiliency. In the first stage, sizes of the ESSs have been estimated using developed detailed mathematical models, and optimized using the Genetic Algorithm (GA). In the second stage, the respective sizes of ESSs are simulated by developing an all-inclusive model of the transit system, ESS and ESS management system (EMS) in MATLAB/Simulink. The mathematical modeling provides initial recommendations for the sizes from a large search space. However, the dynamic simulation contributes to the optimization by highlighting the transit system constraints and practical limitations of ESSs, which impose bounds on the maximum energy that can be captured from decelerating trains.

1. Introduction

DC rail transportation systems, in urban areas around the world, consume around 14.7 to 1600 GWh of energy annually [1,2,3]. Around 60% of this energy is consumed by trains, which follow a cycle of acceleration, coasting, and deceleration. This energy is supplied to the trains by rectifier substations through DC power supply lines, in the form of either an overhead centenary or a third rail. A substantial portion of the energy consumed by trains during acceleration and coasting can be regenerated during deceleration using regenerative braking. This regenerated braking energy has to return to the third rail, where a part of it can be captured by other accelerating trains in the vicinity and a negligible portion by onboard auxiliary loads. However, the usually fast decelerating trains regenerate a rapidly increasing energy and merely 8–10% of it can be recaptured by other accelerating trains [1]. This is because of the minimum headway that should be maintained for safety between two trains. In addition, the accuracy of scheduling two consecutive trains, one accelerating and the other decelerating simultaneously, often requires cost-prohibitive real-time coordination. Thus, the remaining regenerative braking energy in the third rail raises its voltage beyond its maximum limit and consequently triggers voltage protection circuits to disconnect the train from the third rail. Hence, this remaining regenerative braking energy would be wasted as heat unless retrieved in energy storage systems (ESSs) or through reversible substations. In this paper, we focus on the retrieval of regenerative braking energy using wayside energy storage systems (WESSs).
In the wake of green energy technology and a demand to reduce carbon emission, effective reuse of regenerative braking energy from different transportation systems has received widespread attention. The potential of recovering regenerative braking energy using ESS in a metro-transit system of Rome has been reported in [4], where the difference in potential and effective recovery of regenerative braking energy has been brought to attention. Another literature highlights the use of SCs in the metropolitan railway systems of Colombia and sheds light on the dependence of regenerative braking energy recovery on train scheduling [5]. The performance of different types of ESSs in serving various functionalities, such as voltage quality, emergency power supply, and load levelling, when deployed in the rail transportation system of Japan has been demonstrated in [6,7]. Other similar demonstration projects comprise the use of a sodium-sulphide battery system for Long Island, an SC system for Madrid de Metro, and a flywheel for London Underground, which have been reviewed for effectiveness and return on investment [4,8]. However, these aforementioned studies/reports fail to provide a general methodology for choosing appropriate type and size of ESSs that can support the various functionalities of a rail transportation system.
In some major electric rail transportation systems around the world, such as New York City Transit (NYCT), trains run with a minimum headway of 60 s and the regenerative braking occurs within a span of 30 s with a peak power of about 3 MW [1,9]. Thus, such systems would require storage technologies with high power density that implies fast charging capability along with a large number of life-cycles. However, such systems may also need ESSs that can store energy for prolonged periods of time, for, e.g., under emergency circumstances, for load leveling, and so on. In addition, the major rail transportation systems are usually situated in densely populated areas where power supply substations tend to get congested. This necessitates a provision for peak power shaving of the highly-loaded substations. Hence, the choice of type, combination, and size of ESSs for rail transportation system applications needs to be thoroughly investigated.
Modeling and optimization techniques for using SCs and Hybrid ESS (HESS), in the recapturing of regenerative braking energy in rail transportation system, have been illustrated in [10] and [11], respectively. In [11], the various aspects and constraints of sizing an HESS, consisting of battery and SC, have been incorporated in a mathematical model and optimized using linear programming. This paper further provides insight into the energy and cost saving for different depth of discharge (DoD) of batteries. However, these studies are insufficient in capturing all the essential parameters involved in modeling ESSs for rail transportation system. For instance, the capacity (Ah) of a battery and its charging/discharging current (C-rate) follow a nonlinear relationship. The ratio of these two parameters is very crucial for the estimation of battery life-time, especially for this application as it demands a high rate of charging/discharging current [12,13]. This necessitates a nonlinear optimization technique. In addition, the DoD constraints for a SC, which is crucial for its state of health (SoH), and voltage restrictions of the third rail have been neglected in previous literature. In addition, the dynamics of the transit system have not been captured through a simulation or actual demonstration, which profoundly impacts the parameters of energy and cost savings. Other decisive features such as peak power demand that incurs a significant cost for any transit system, and real market price for ESSs have not been considered in the evaluation of sizes, cost savings, and payback time. Inaccurate estimation of sizes, cost savings, and payback time makes the results of these studies not applicable to practical systems.
In this paper, a two-stage modeling technique, as shown in Figure 1, has been developed for obtaining the most suitable combination and size of WESSs for the DC rail transportation systems. In the first stage, a mathematical model has been developed by a detailed inclusion of the characteristics and constraints in the storage technologies consisting of battery, SC, and flywheel. The mathematical model also takes into consideration the constraints of the rail transportation system, demand charges by utility companies based on peak power in a day, energy cost by utilities, life-cycle cost of ESSs, and maximum achievable utilization of the ESSs with minimum degradation of SoH. This mathematical model has been optimized using GA. The second-stage comprises the use of a detailed simulation model of rail transportation system, train, ESS, and EMS, which have been developed in MATLAB/Simulink. This stage is vital to (a) validate the fidelity of the mathematical model and (b) accurately capture the dynamics of rail transportation system along with ESSs, whose emulation by mathematical equations is complex to develop. This stage uses the optimal sizes from the first stage as guiding parameters to perform the simulations for both single and 24 h cycle of trains. The simulation results infer application specific choices of type, size, and combination of ESSs.

2. Theory: Operating Principle of Transit System and ESSs

An overview of the rail transportation system and ESSs under consideration have been provided in this section.

2.1. Electric Rail Transit System

Generally, DC electric rail transportation systems consist of geographically distributed power supply substations and rail networks. Power supply substations convert AC voltage of the main grid to DC voltage and deliver power to the trains, which are the main load of the system. A portion of such a system, used as case study, is presented in Figure 2. It consists of three power supply substations, four passenger stations, and a train. The system parameters and modeling have been elaborated in Section 4. As a train accelerates from one passenger station, it consumes energy from the substations and subsequently regenerates the same while decelerating into the next passenger station. The regenerative braking energy travels to the third rail, where a small portion of it can be recaptured by other loads in the system. The remaining energy, if not captured, will raise the voltage of the third rail and trigger the chopper circuit to dissipate it as heat in a resistor.

2.2. ESS: Type and Parameters

In this work, we have considered three different types of energy storage technologies, namely battery, SC, and flywheel, for recovery of the remaining regenerative braking energy. The ESSs are placed in passenger stations and are connected to the rail transportation system through bidirectional converters. This section provides an overview of the ESS specifications, which have been considered as guiding parameters for the optimization problem.

2.2.1. Battery Energy Storage System (BESS)

Optimization of the size of a BESS is directed by the elements that limit the SoH of the battery [4,13]. These parameters are temperature, charging/discharging rate, minimum/maximum voltage, and time interval between charge cycles [14,15,16,17,18,19].

2.2.2. Supercapacitor Energy Storage System (SCESS)

SCs, due to their high power density, are used in applications that require high peak power in a short period of time with frequent charge and discharge cycles [20,21,22,23]. Despite its high-performance parameters, application of SCs in a rail transportation system should be monitored carefully to prevent accelerated ageing. The factors responsible for accelerated ageing are terminal voltage, effective current, and temperature [24].

2.2.3. Flywheel Energy Storage System (FESS)

The popularity of FESS is because of its high life cycle, long lifetime, high energy and power density, low environmental impact, and no maintenance requirement [8,25,26]. The constraint on flywheels is imposed by their minimum/maximum rotating speeds.
All of these aforementioned parameters have been incorporated into the equations that lead to optimization of size of ESSs and have also been carefully monitored in the simulation.

3. Stage 1 of Proposed Method: Mathematical Modeling and Optimization

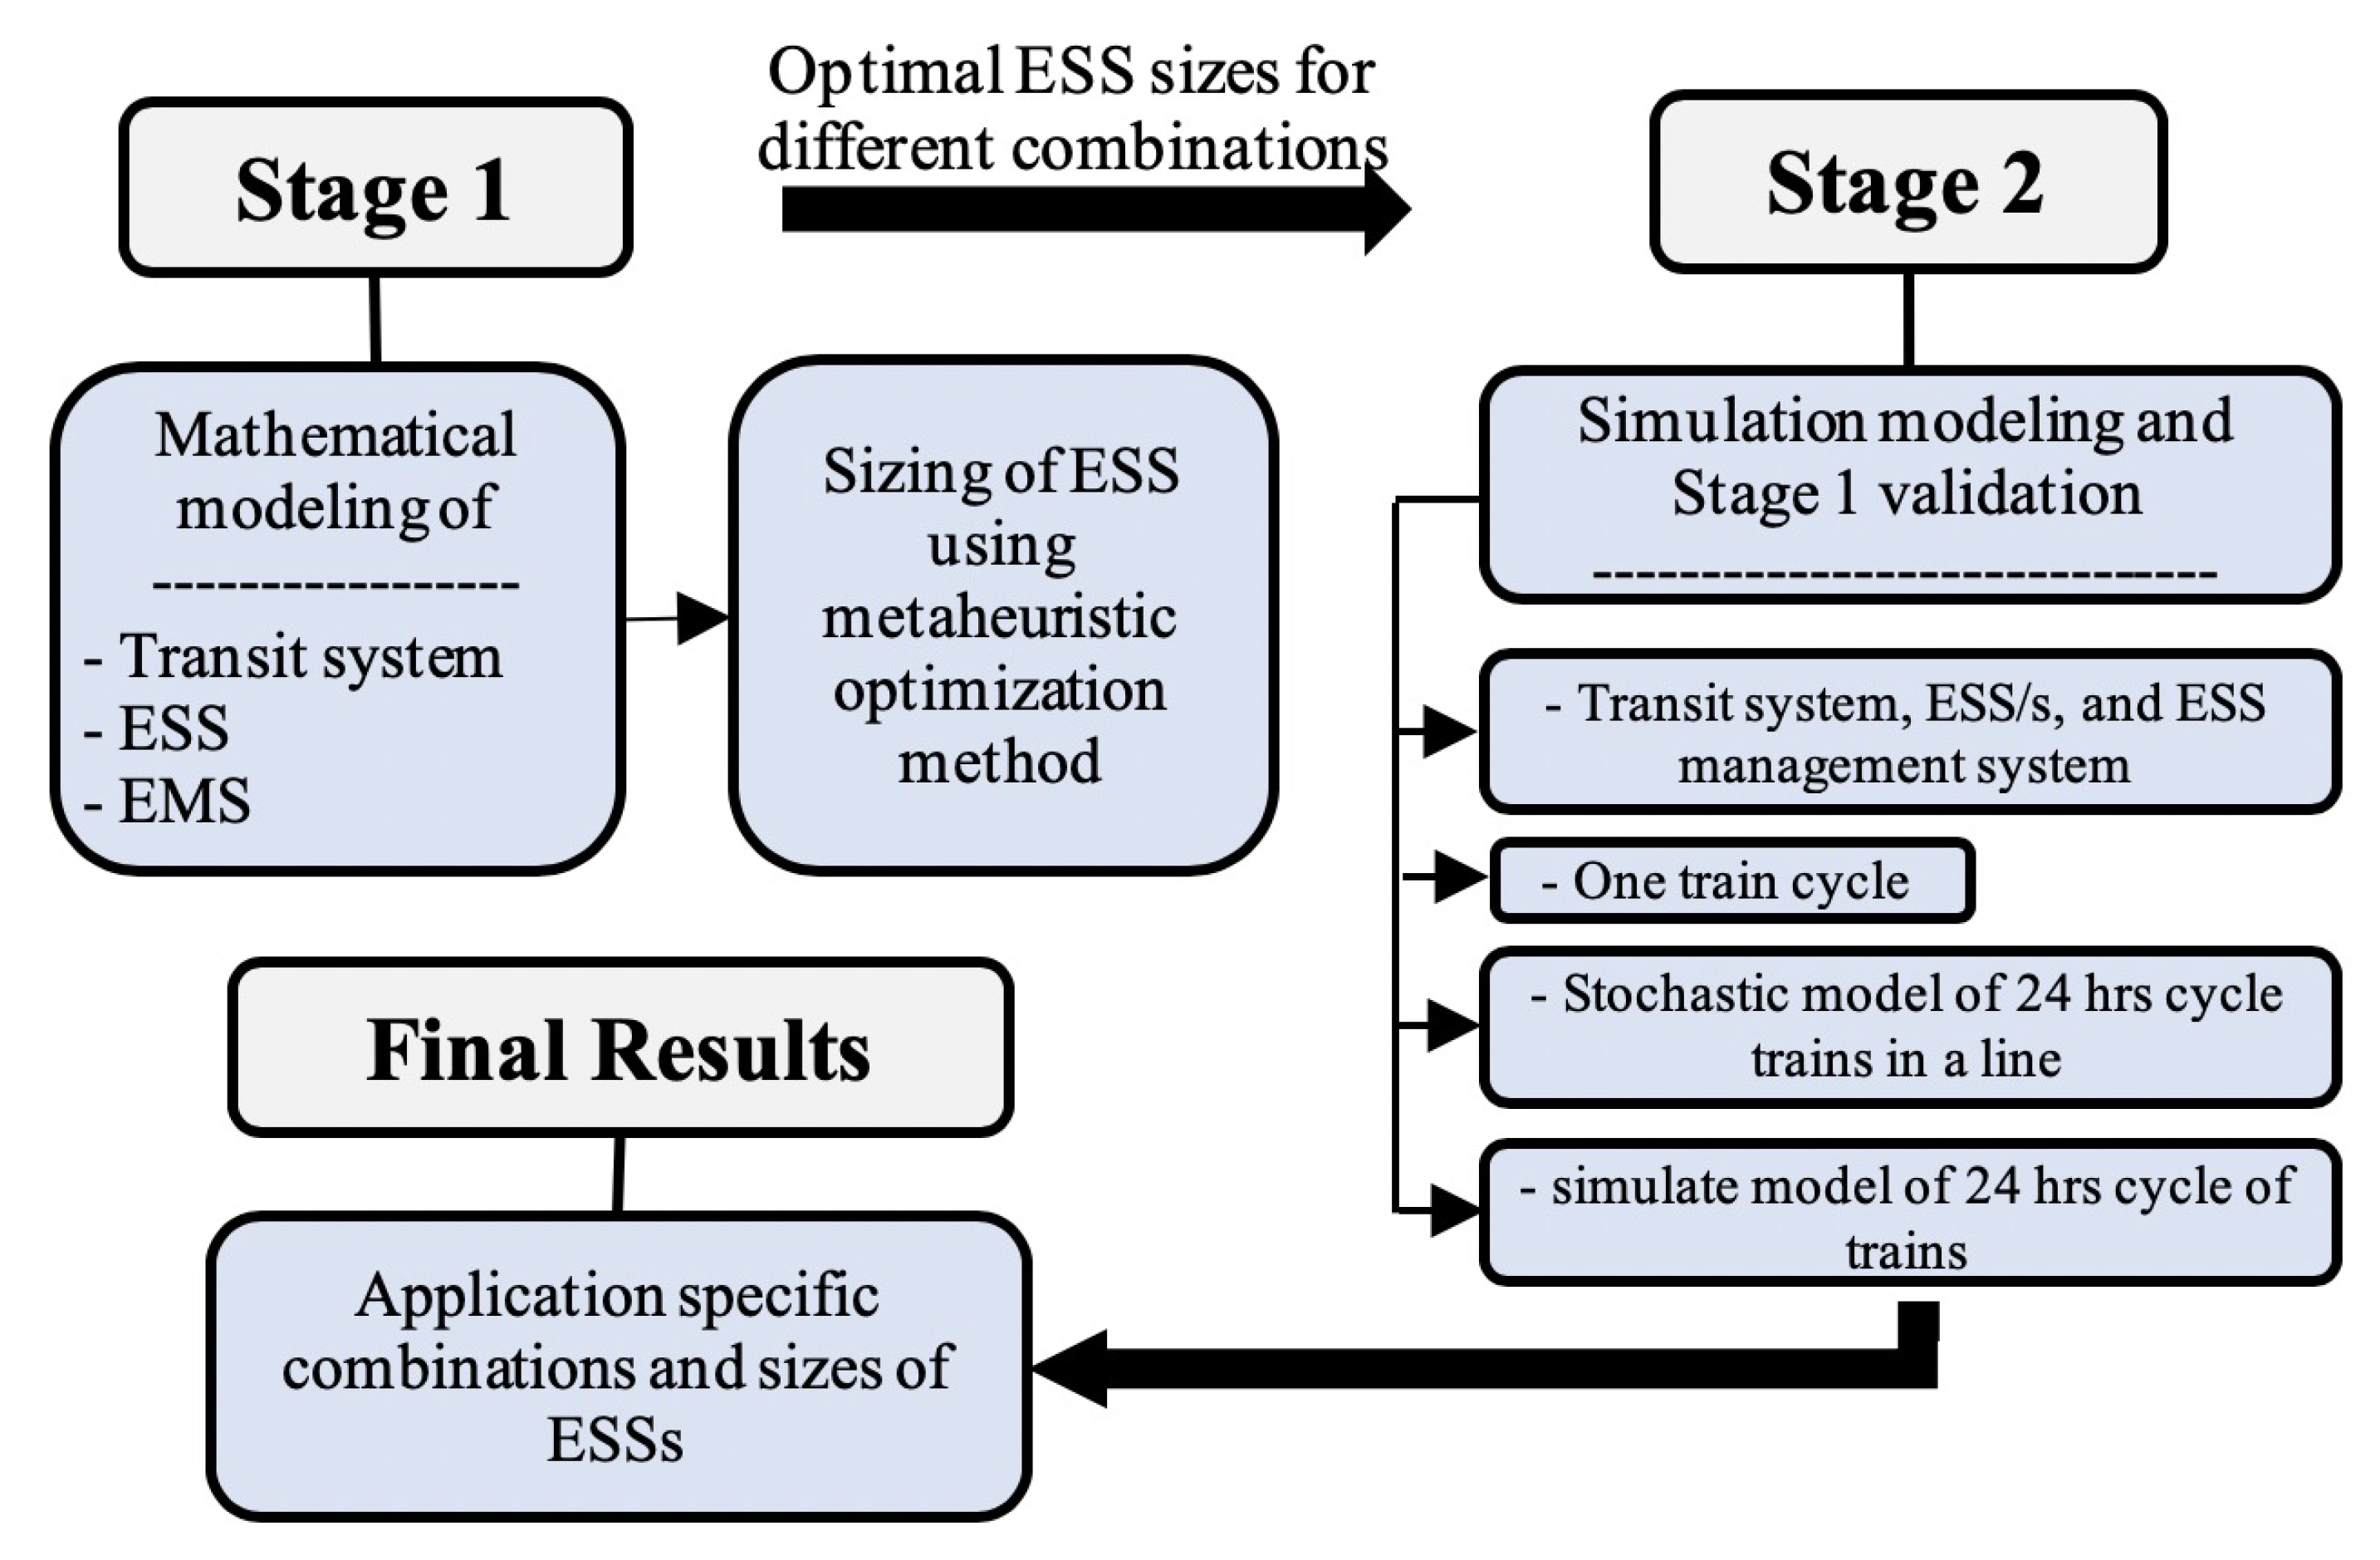
This section describes the first stage, consisting of mathematical modeling and optimization, of the two-stage framework proposed in this paper.

3.1. Mathematical Modeling

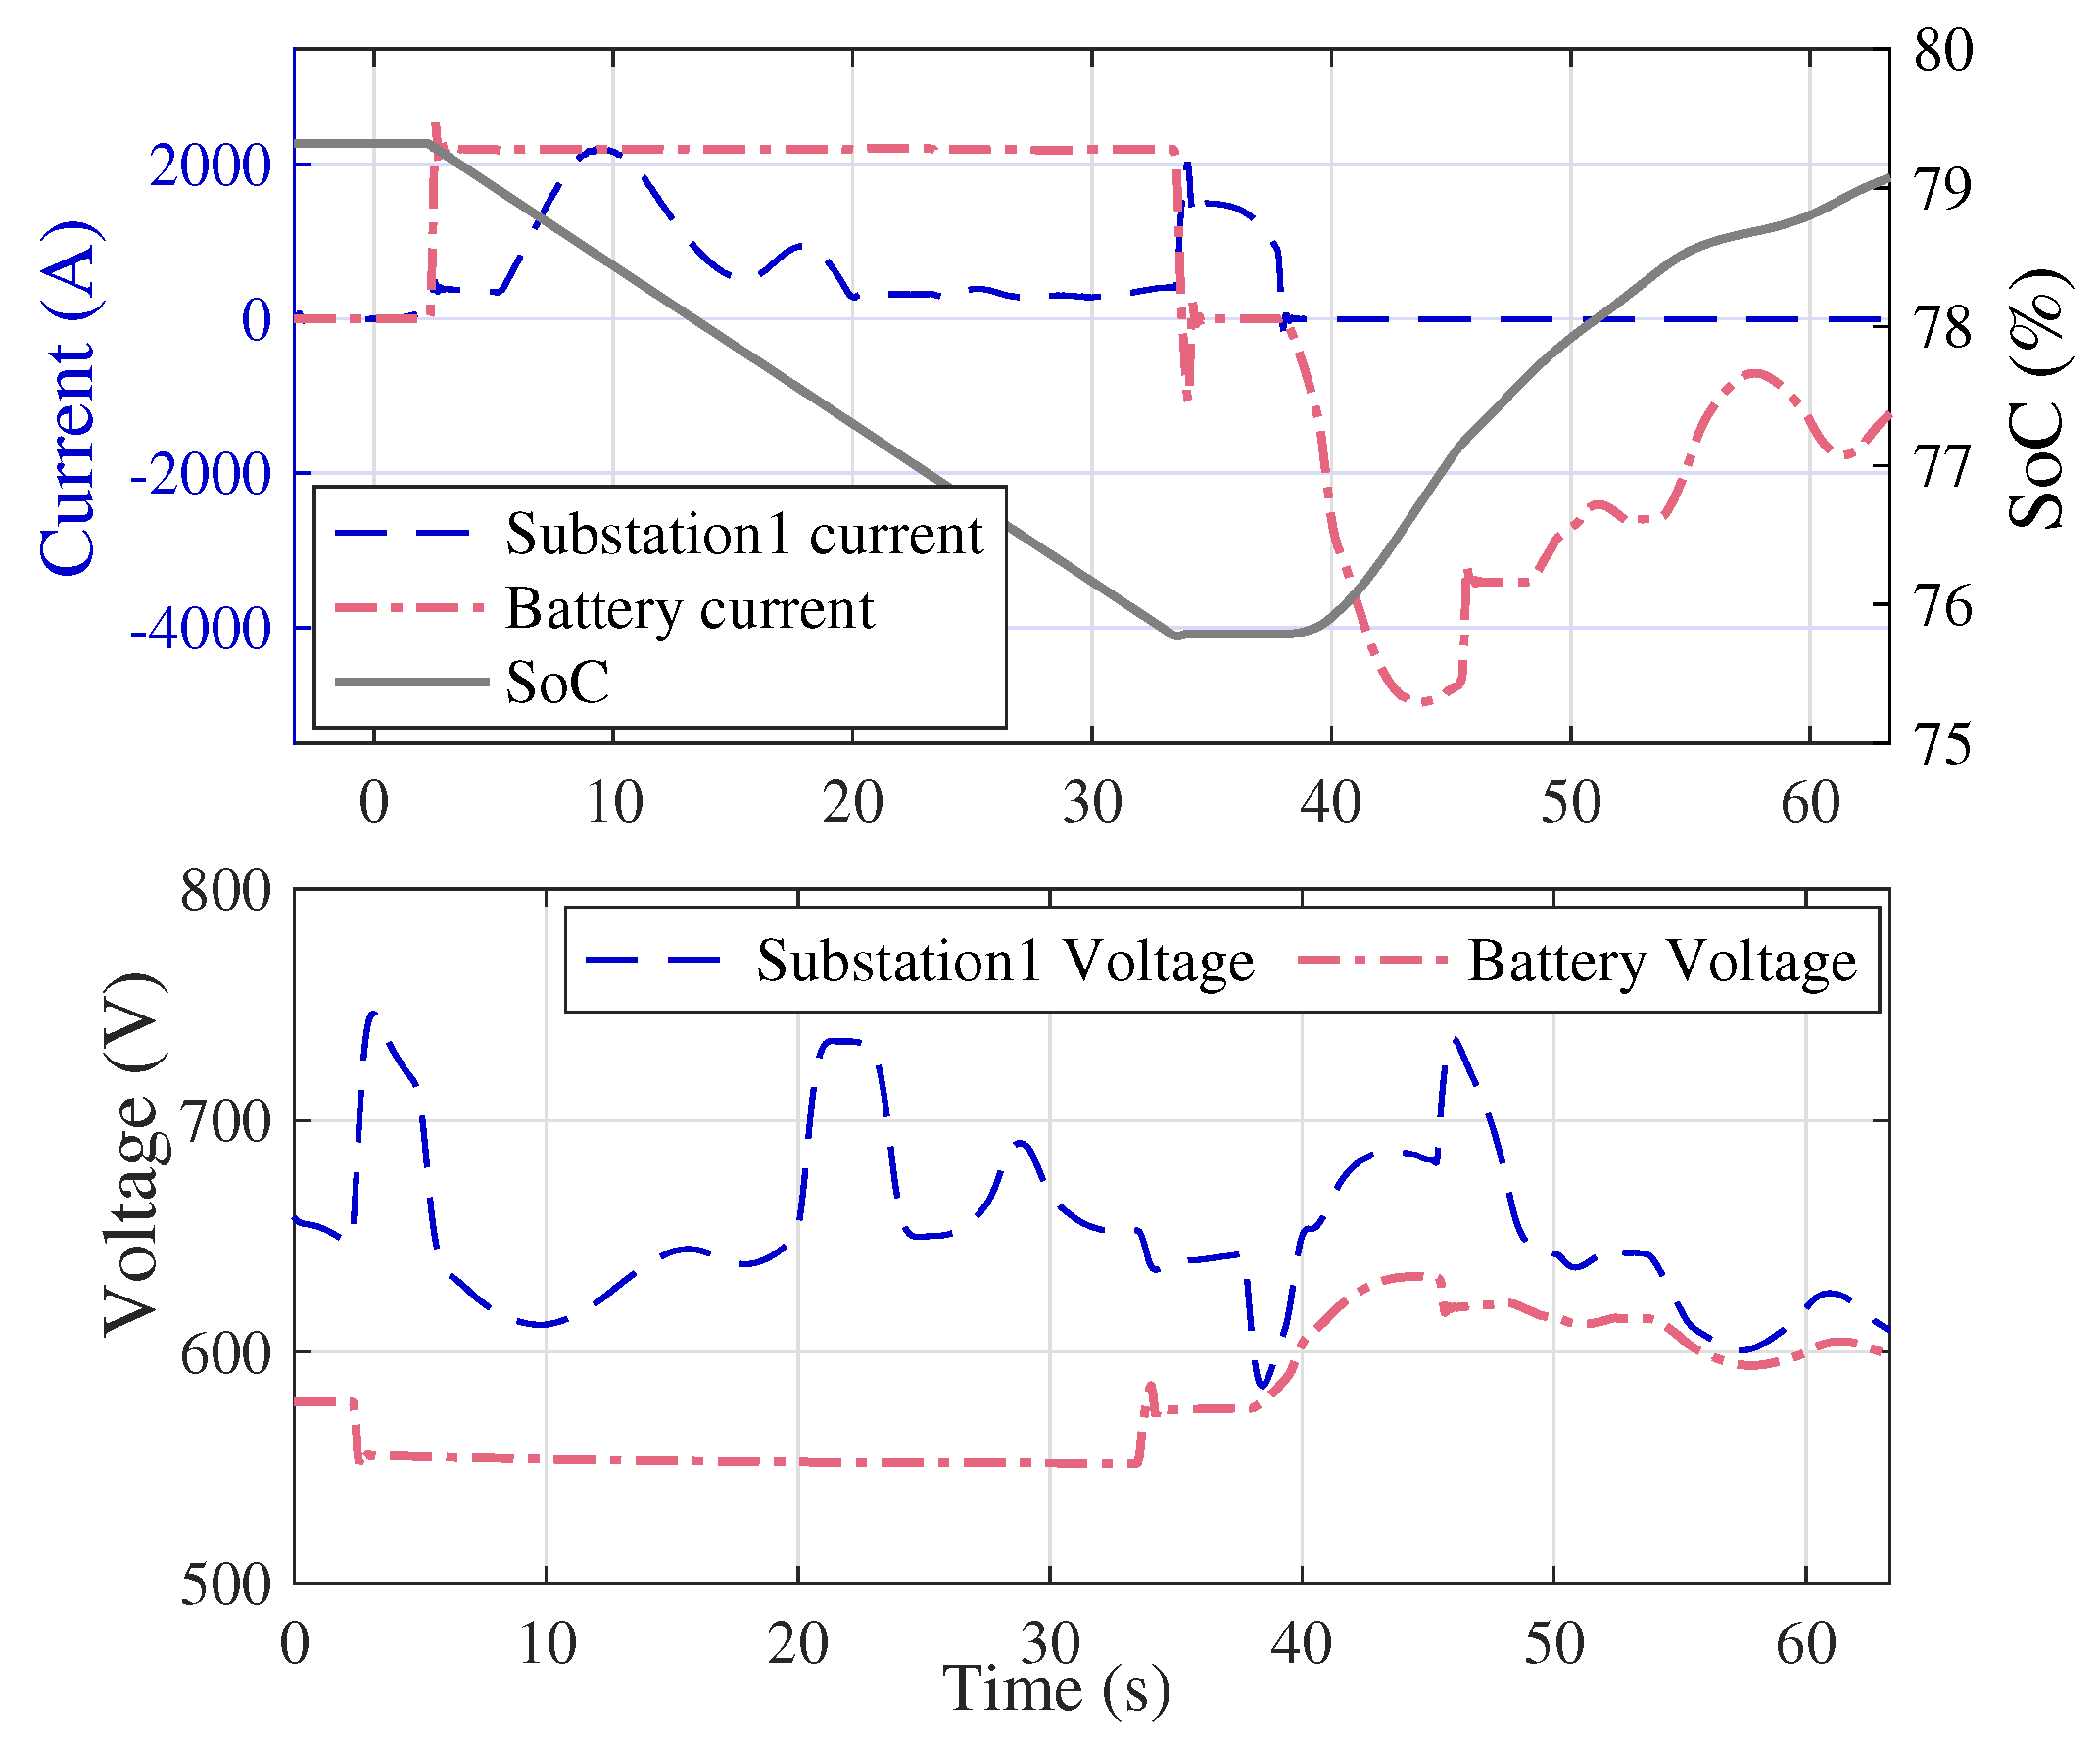
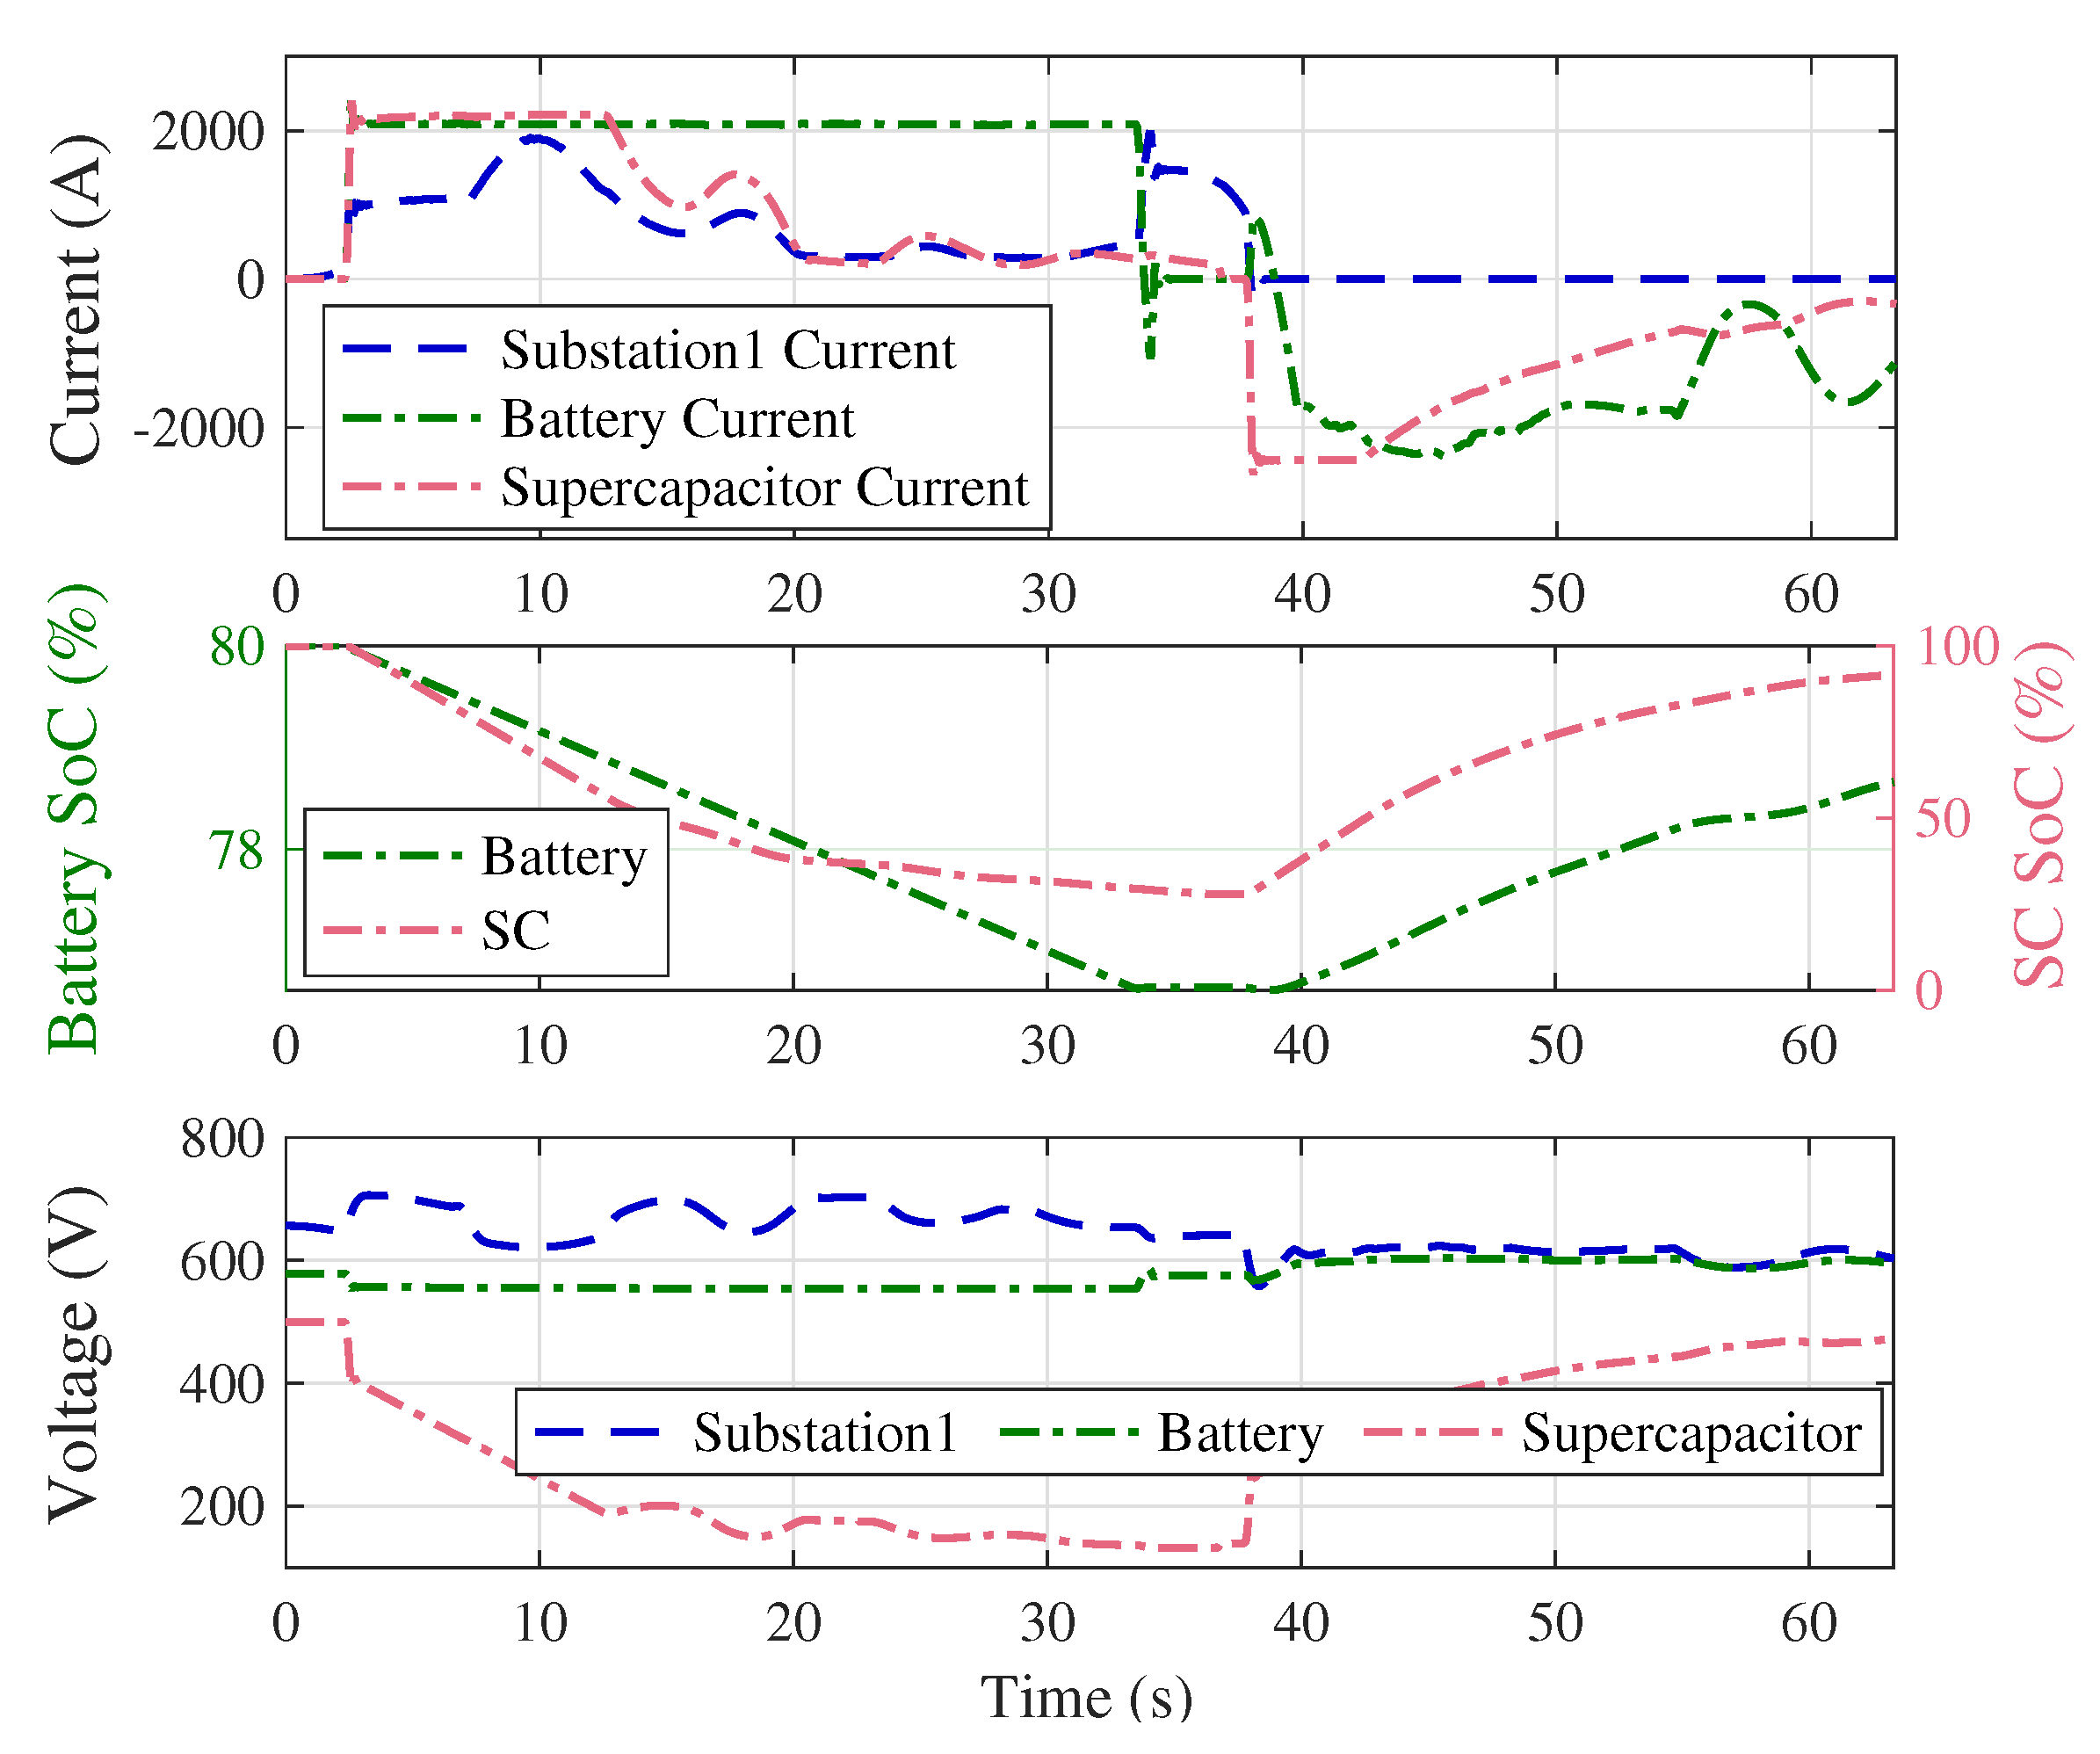
The ESSs may consist of a standalone BESS/SCESS/FESS or a combination of any two of the three types of ESSs. Thus, energy recuperated and discharged by the storage systems, at the low voltage side of a converter, can be formularized as Equations (1) and (2), respectively:
E + = Z 2 B E B + + Z 2 S C E S C + + Z 2 F E F +
E = Z 2 B E B + Z 2 S C E S C + Z 2 F E F
where Z 2 B / S C / F represents a binary number that can assume either 0 or 1 for battery/supercapacitor/flywheel but cannot assume the same value for all the three types of ESS at the same time. Such a condition eliminates the condition where none or all the three types of ESSs are deployed. The total energy captured/generated by ESSs, as expressed by (1) and (2), comprise independent contributions from BESS, SCESS, and FESS, which are expressed in the subsequent discussions. The efficiency of a BESS is contingent on its state of charge (SoC) constraints during both charging and discharging. SoC is expressed as S o C B = 100 1 1 C A h 0 t B I B d t and the constraints on minimum/maximum limits of SoC of a battery during constant current discharging/charging are expressed in (3) and (4), respectively:
S o C B = S o C i n i t i a l I B t B C A h S o C B , m i n
S o C B = S o C i n i t i a l + I B + t B + C A h S o C B , m a x
In this work, S o C B , m i n / m a x are 30% and 40%, respectively, since degradation of a battery is minimum if its SoC remains within 30% and 80% of the full capacity [17,18].
The amount of energy, by which a BESS gets charged, can be expressed by (5):
E B + = I B + η B + η c o n v , B N S t n o m t e x p V b ( t ) d t
such that V b ( t e x p ) = V e x p and V b ( t n o m ) = V n o m . The objective behind the limits of integration in (5) is to operate the battery within S o C B , m i n and S o C B , m a x . The open-circuit voltage ( V o c ) of a battery, as a function of SoC, increases from V n o m to V e x p as the SoC varies from S o C B , m i n to S o C B , m a x , respectively [27]. If a BESS is functional for every acceleration and deceleration of the train, which happens within a span of 27–30 s, the C-rate for charging/discharging can be expected to be higher than 1C. Such a condition will cause the V o c of the battery to change from V n o m to V e x p within a very short period of time (around 27–30 s), so as to render an almost linear increase in V b . Accordingly, the regenerative energy captured by the BESS, as derived from (5), is expressed in (6):
E B + = 1 η B + η c o n v , B t B + I B + N S V e x p + V n o m 2
Similarly, the magnitude of energy contributed by the BESS during a train acceleration can be quantified as (7):
E B = η c o n v , B η B t B I B N S V e x p + V n o m 2
The discharge current and time of a battery are not linearly related to its capacity in Ah. According to Peukert’s equation, the discharge time of a battery reduces for a higher C-rate of discharge, which is expressed in (8) [28]. Thus, (8) acts as a nonlinear constraint on the battery discharge current and capacity. It is to be noted that there is no review yet of the application of Peukert’s equation on the charging current of a battery in literature:
t B = H C A h I B H k
According to (8), a battery of capacity C A h discharging a current of I B will get completely depleted within a time of t B . However, it is not desirable for the SoH of the battery cells to be entirely depleted. Thus, a fraction of t B has been considered in (9) during which the battery remains operational;
t B = U T t B
The quantification of energy discharged by a BESS is concluded in (10) by replacing (8) and (9) in (7). The optimization method will search for the most suitable combination of charging/discharging current ( I B + / ) and capacity ( C A h ) of the battery:
E B = η c o n v , B η B U T 1 H k 1 C A h k I B k 1 N S V e x p + V n o m 2
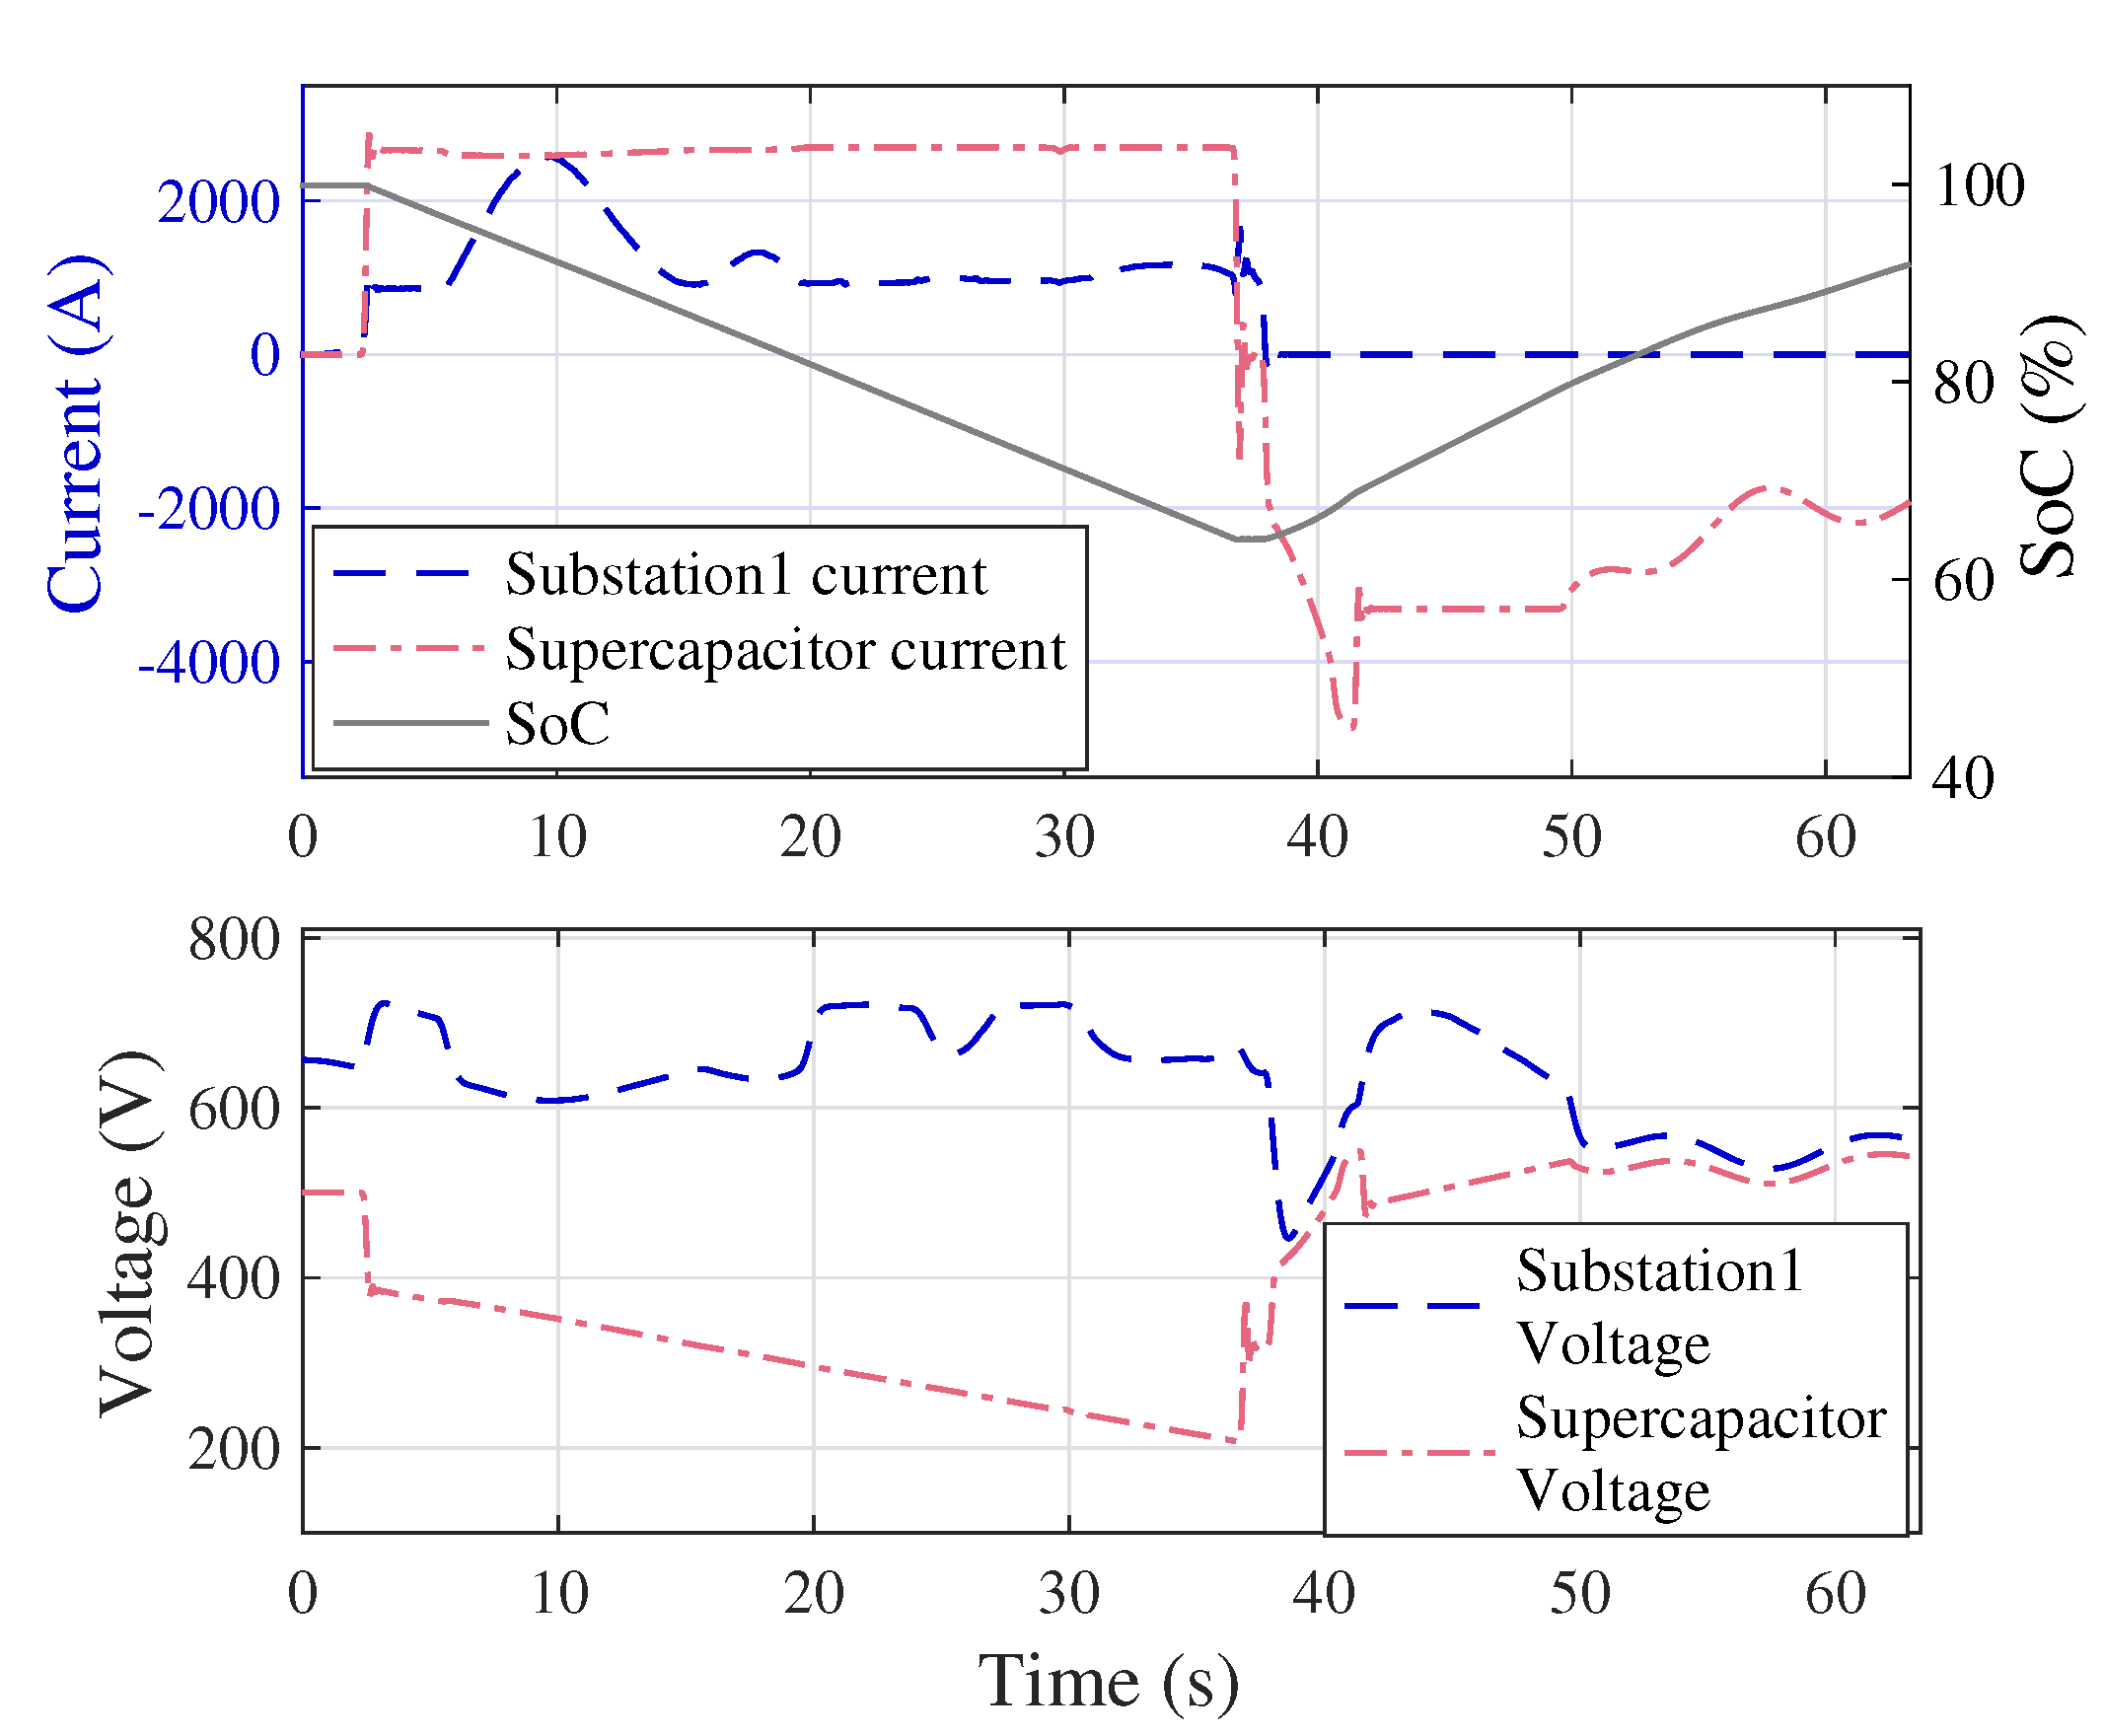
The SCESS has been sized in an approach similar to that of BESS. Expressions for energy recuperated and discharged by the supercapacitor are formulated by (11) and (12), respectively:
E S C + = 1 + ε S C η S C + 1 2 Δ t r e g P S C + η c o n v , S C ,
E S C = 1 + ε S C η c o n v , S C η S C 1 2 Δ t a c c P S C .
In (11) and (12), it is assumed that the SCESS has a constant charging/discharging current which will entail a trapezoidal shaped power profile. In addition, constraint on the minimum open-circuit voltage of the supercapacitor has been also considered in these two equations. This constraint is explicitly mentioned in (13):
ε S C V m a x < V S C < V m a x
Change in voltage across a SC is rather nonlinearly related to the charge/discharge current [28]. Equations for energy of the SCESS, as expressed by (11) and (12), do not consider this nonlinearity and are simplified to minimize the number of variables in the optimization problem. The fact that this linearization does not introduce unacceptable errors is verified by simulation, which uses a nonlinear model of the SC. The optimization process will determine the most suitable values for P S C + / . Thus, capacity of the SCESS in terms of energy can be obtained from its power rating subjected to the constraint in (13).
Expressions for energy recuperated and discharged by a flywheel are illustrated by (14) and (15), respectively:
E F + = η F E F 1 1 K F 2 η c o n v , F
E F = η c o n v , F η F E F 1 1 K F 2
where K F is the ratio between maximum and minimum angular speed of a flywheel. (14) and (15) are subjected to the constraints mentioned in (16) and (17) for a flywheel:
S o C F , m i n < S o C F < 100 %
ω m i n < ω F < ω m a x
The following equations, from (18) to (20), represent the restrictions on energy captured and discharged by the comprising ESSs in (1) and (2). Each individual type of ESS should discharge as much amount of energy during train acceleration as it charged during a train deceleration, in order for it to be prepared to charge for the next train deceleration. This is expressed by (18), (19), and (20) for BESS, SCESS, and FESS, respectively. These constraints are significant as the time duration for train acceleration and deceleration are usually not equal. In addition, charging and discharging efficiencies of ESS and converters are also different:
E B + = E B ,
E S C + = E S C ,
E F + = E F .
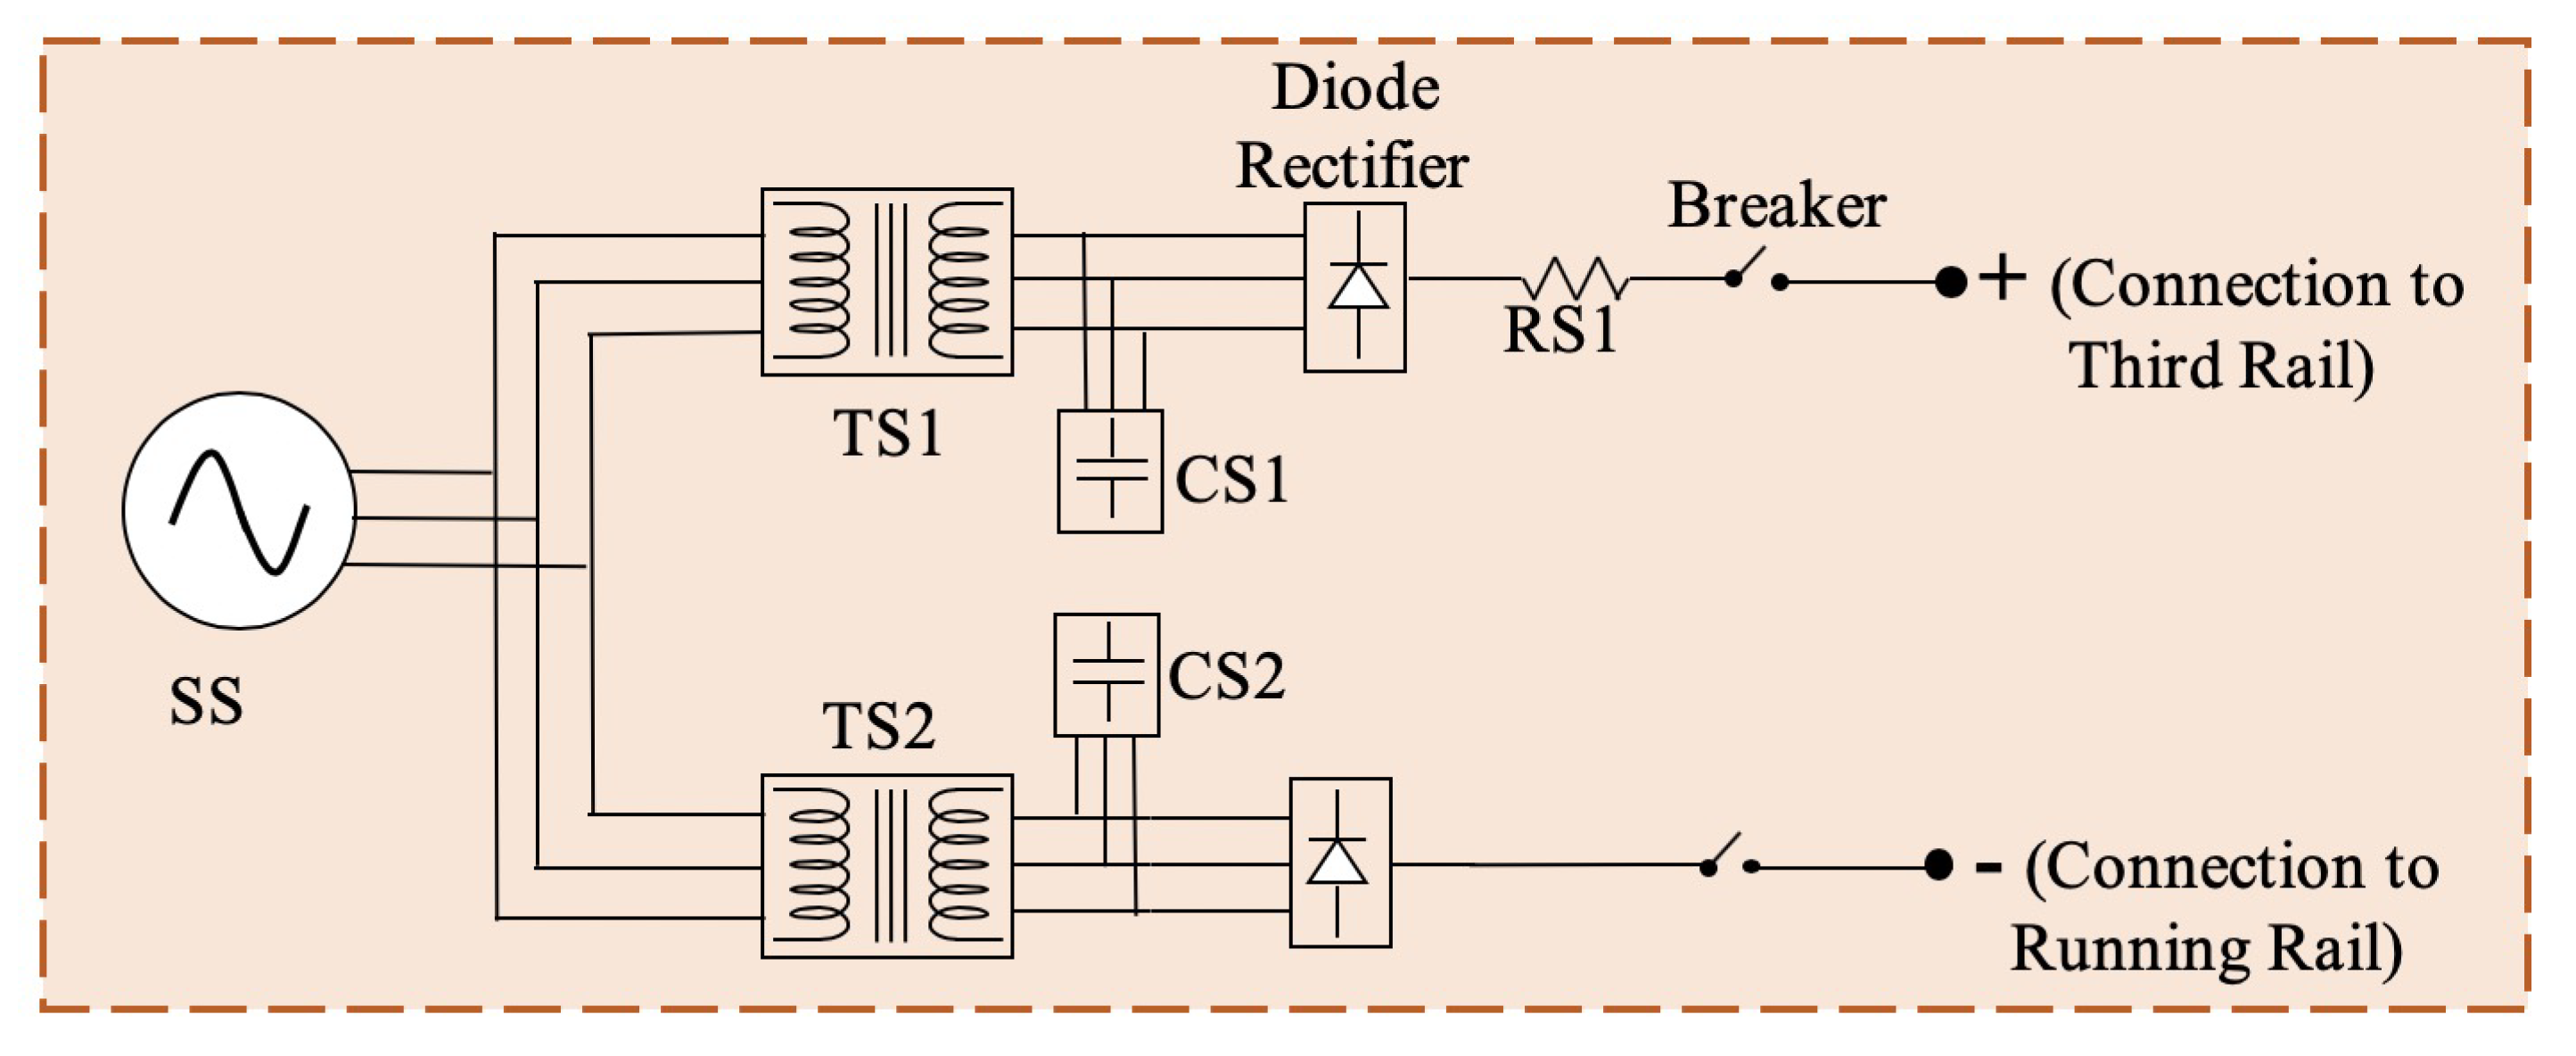
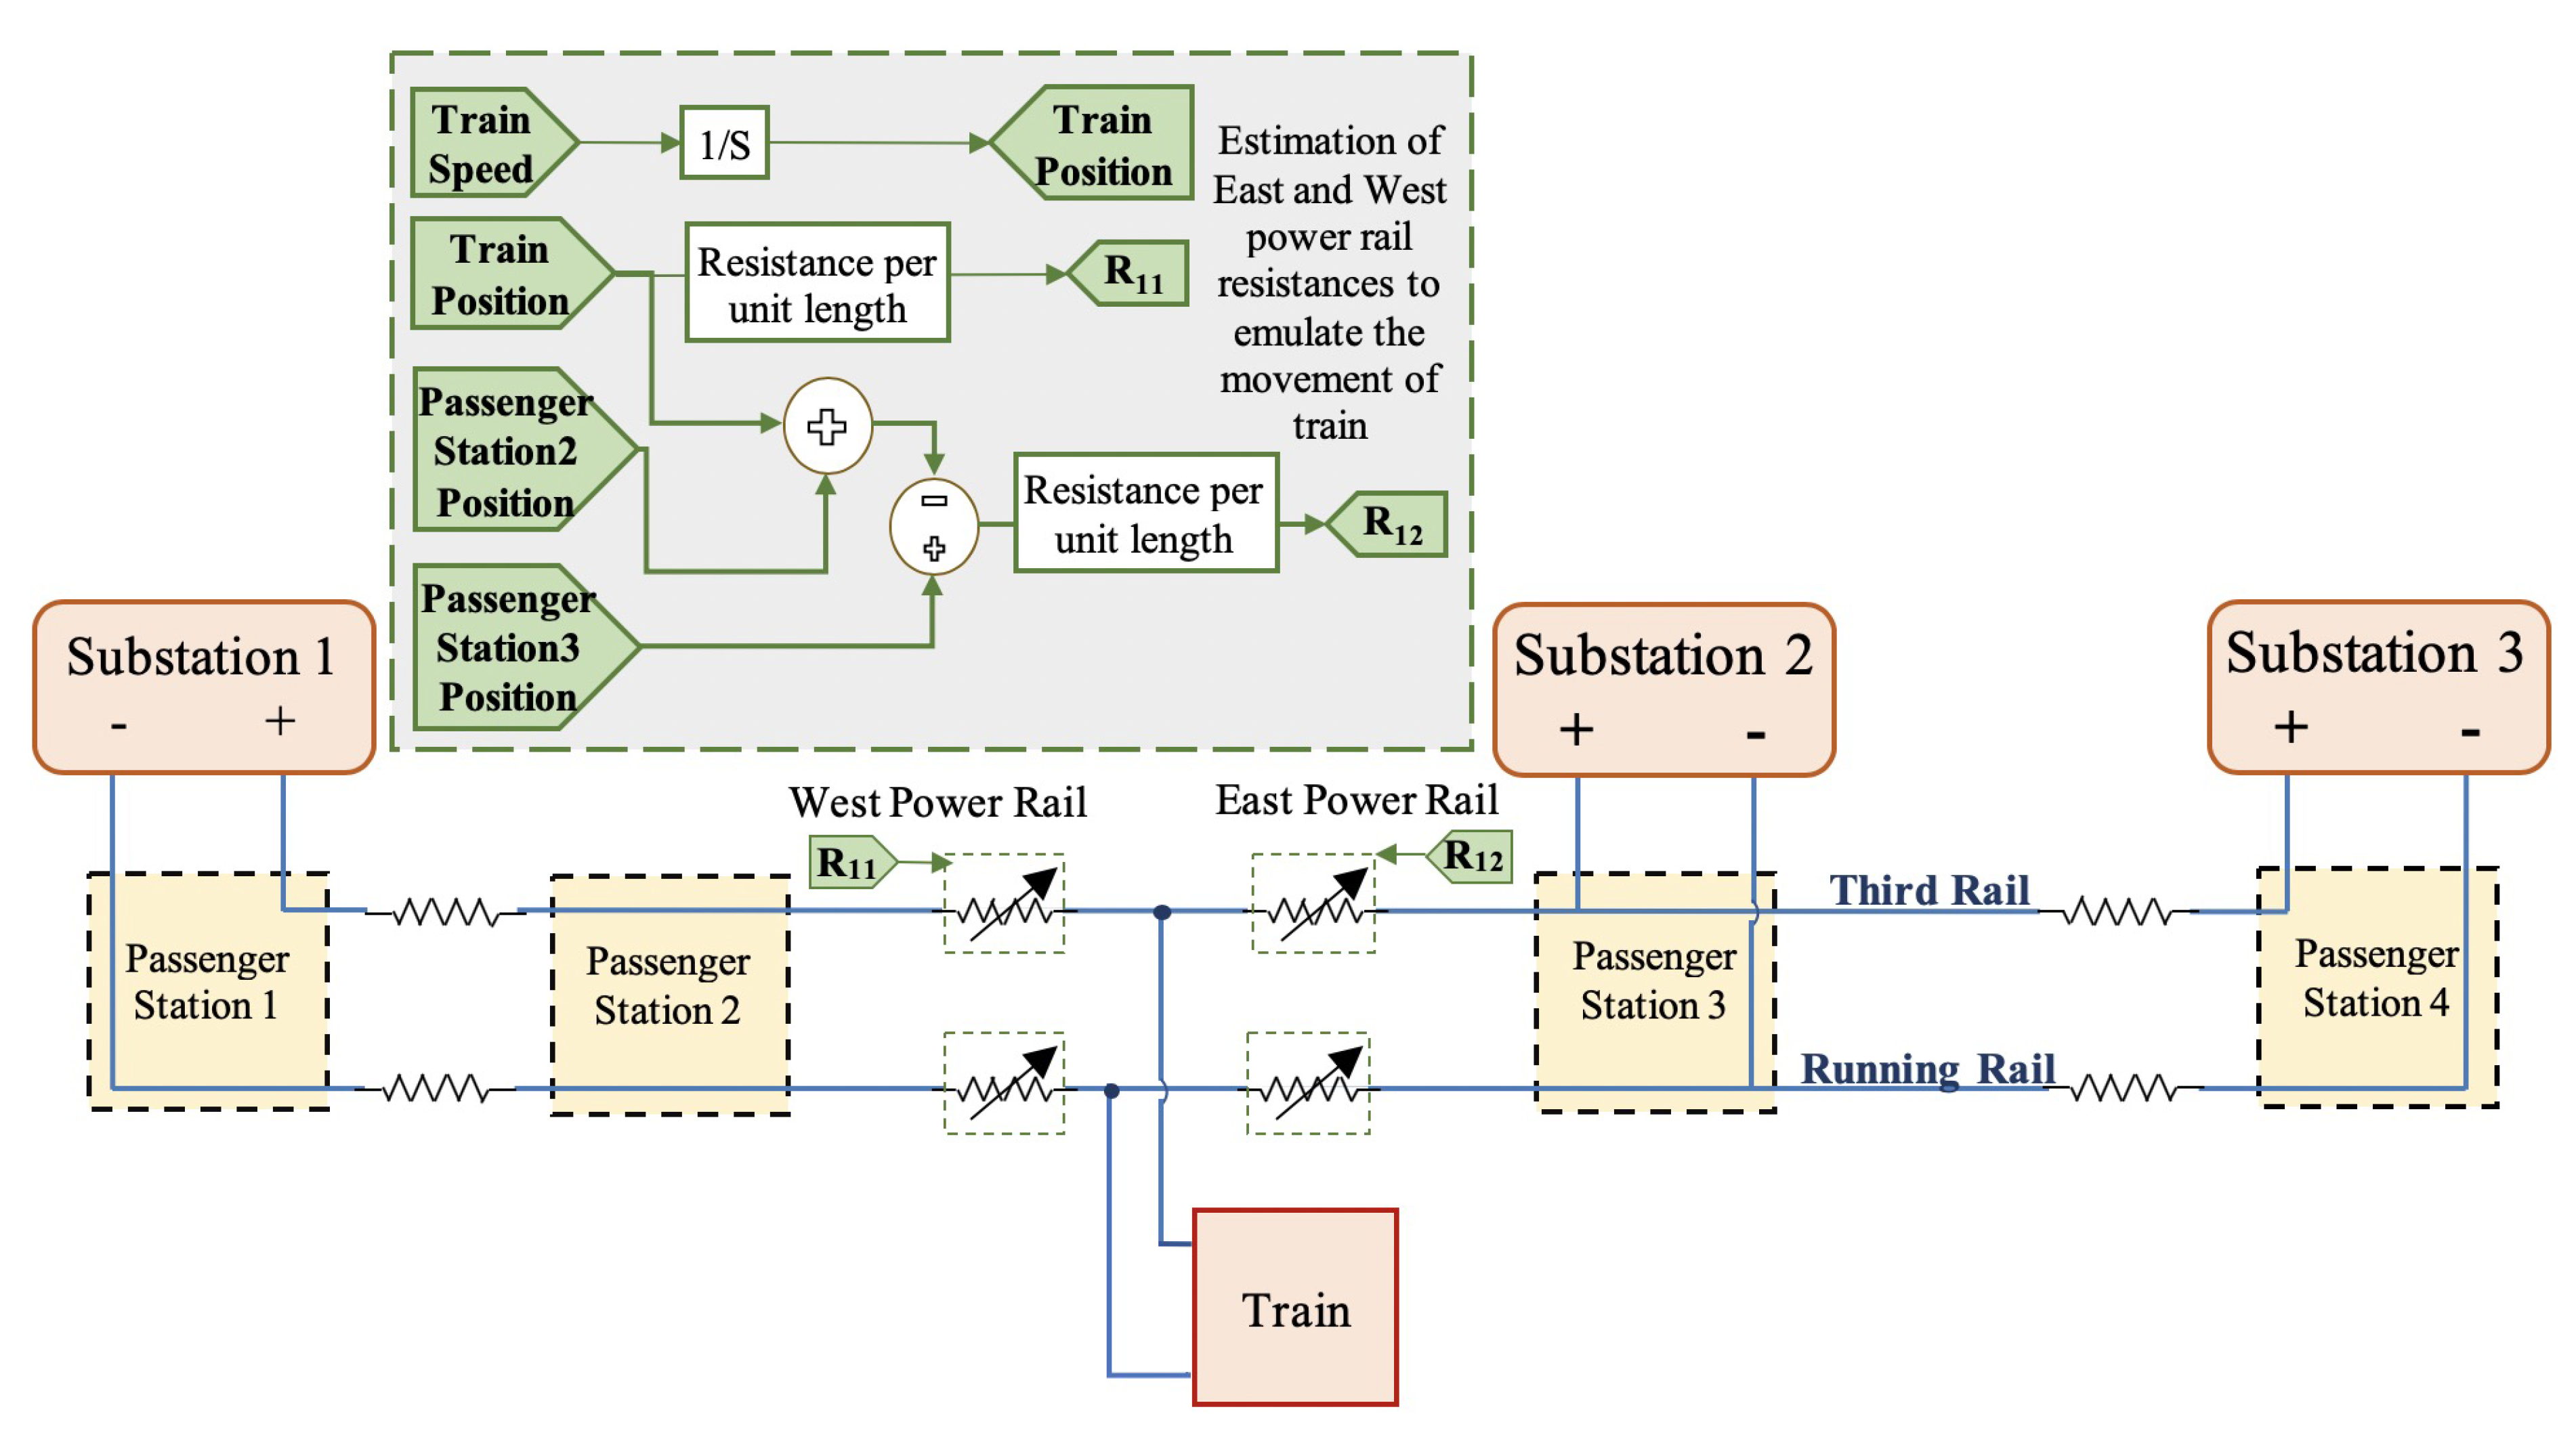
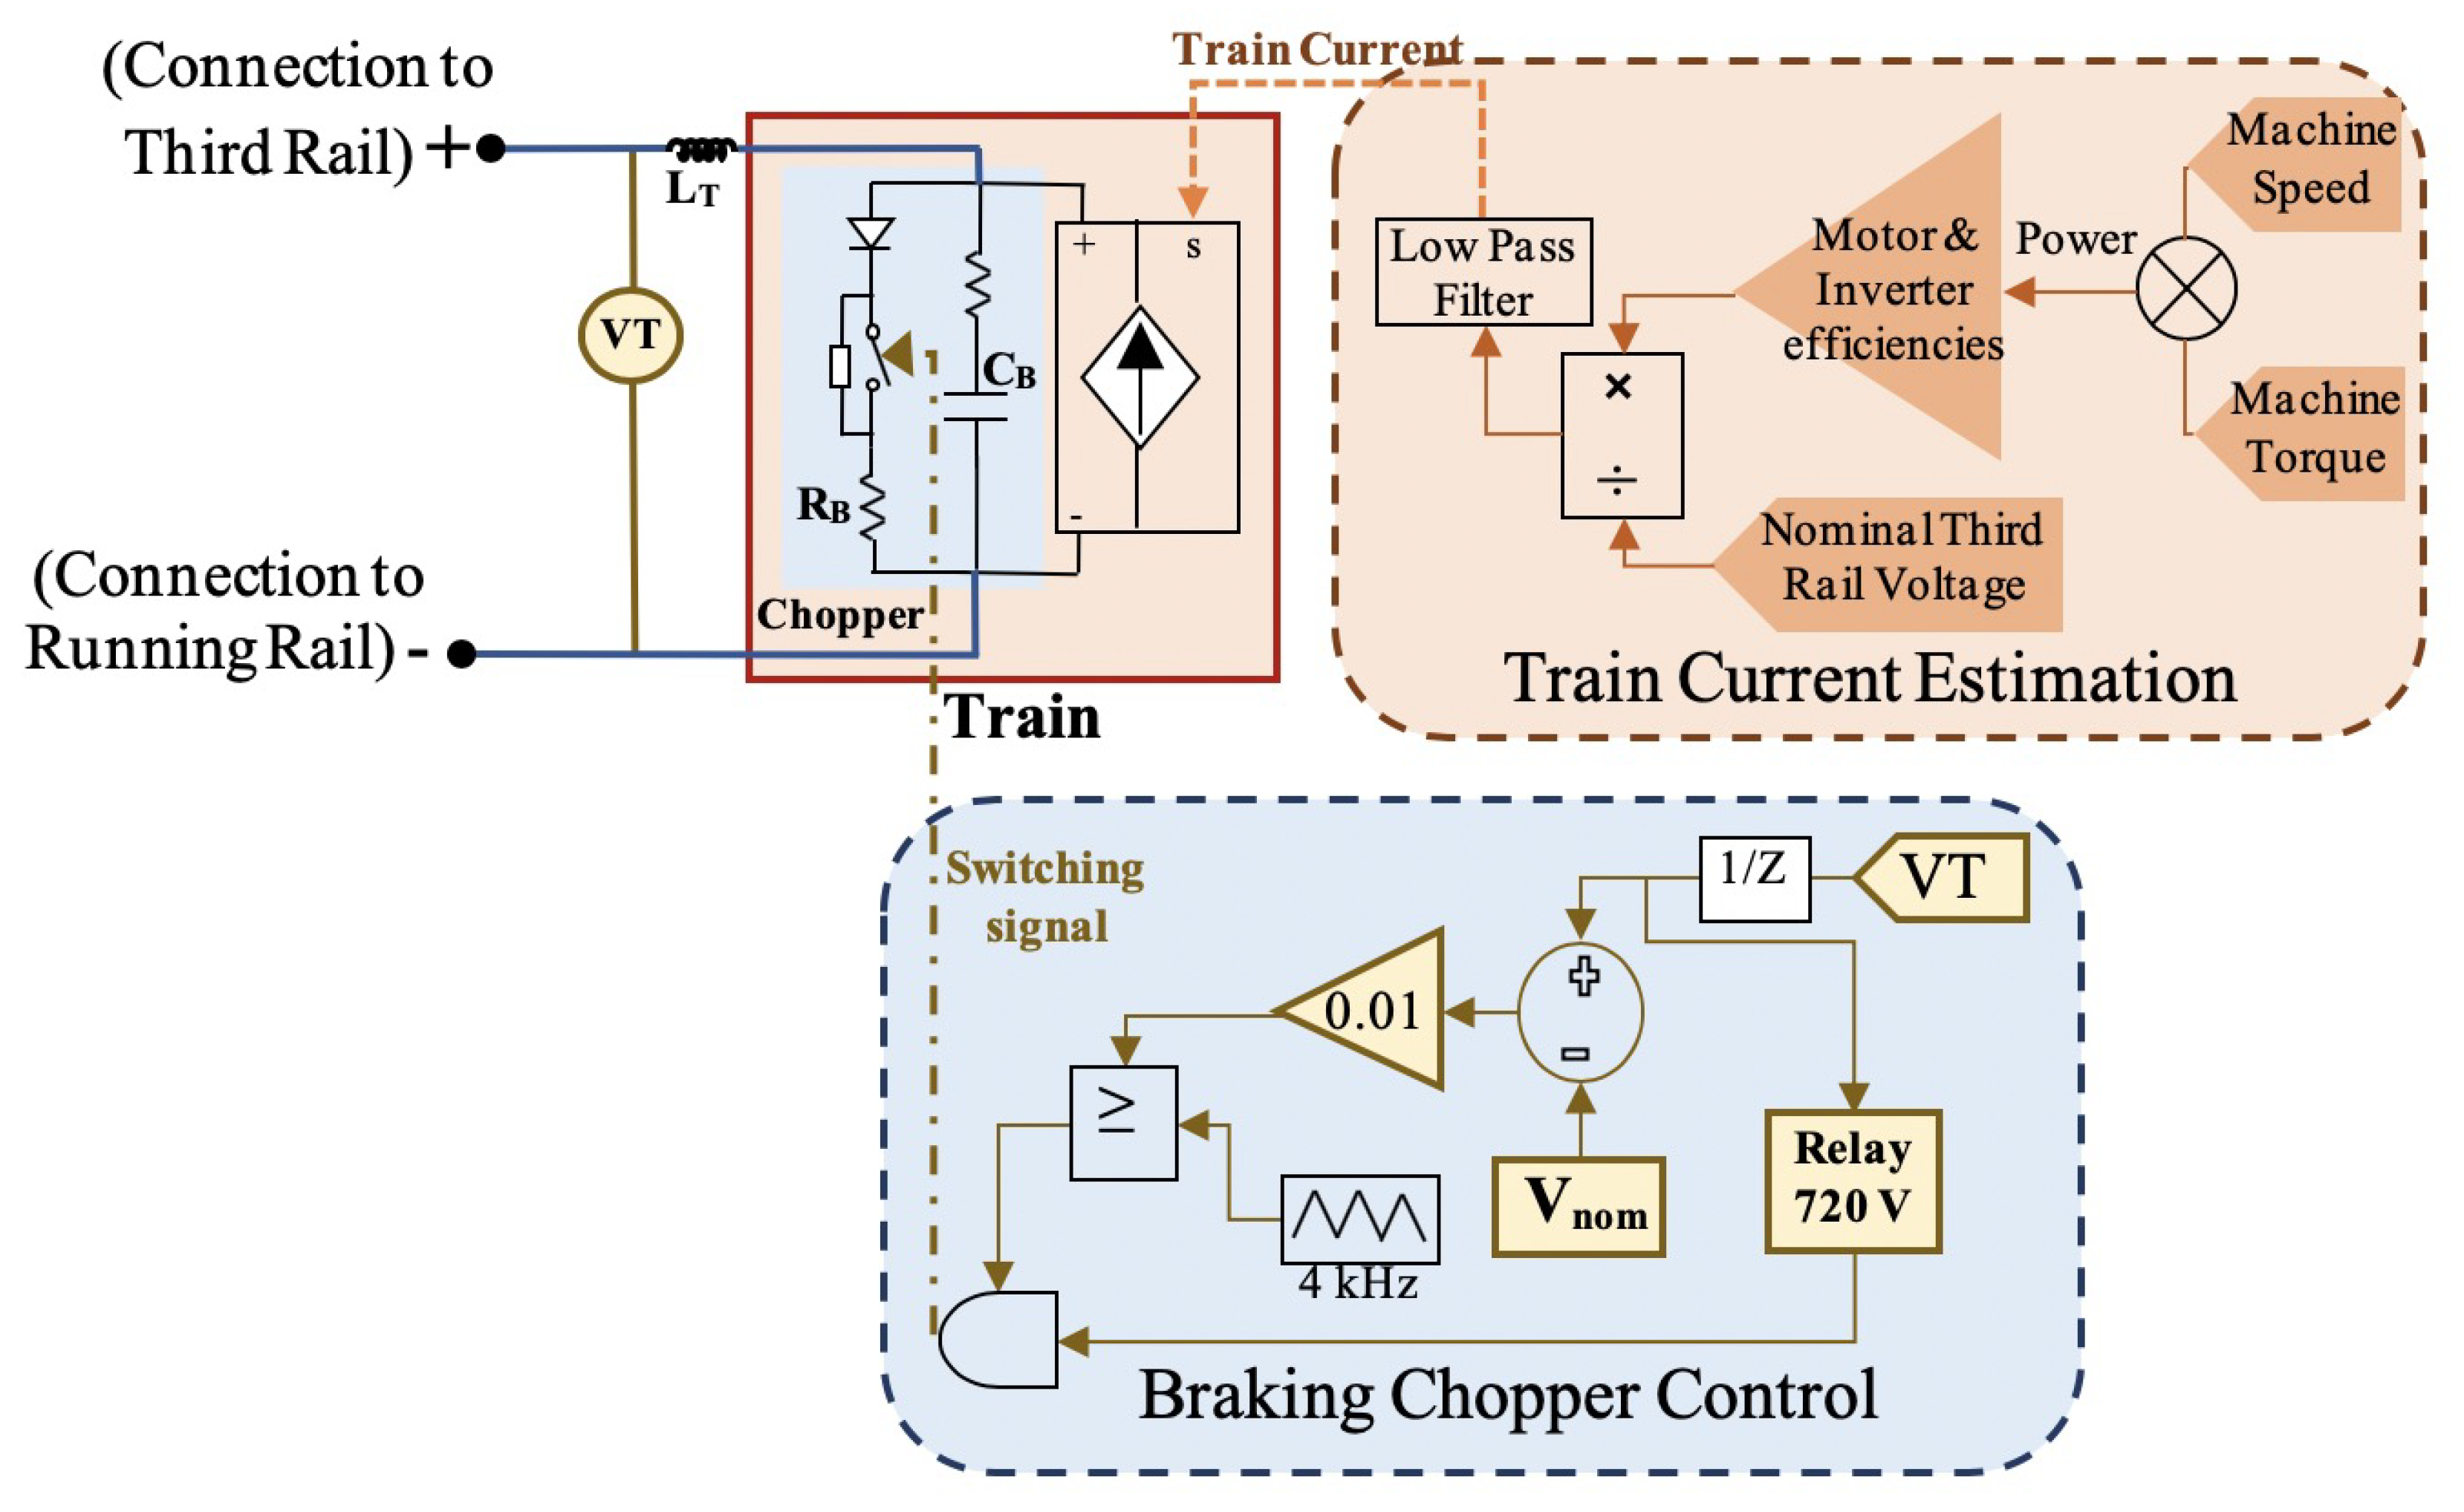
The total current that is regenerated by a train is partly lost in a chopper and partly sent to the third rail based on the voltage level of the latter [12]. In order to comply with the lower and upper voltage limits of third rail, instantaneous power on either side of the bidirectional converter should be compared. Thus, constraints on the rail transit system can be expressed by (21), which considers minimum/maximum limits on third rail voltage:
V t h , m i n < [ Z 2 B N S V n o m I B + η c o n v , B + Z 2 S C P S C + η c o n v , S C + Z 2 F P F + η c o n v , F ] I t r a i n < V t h , m a x
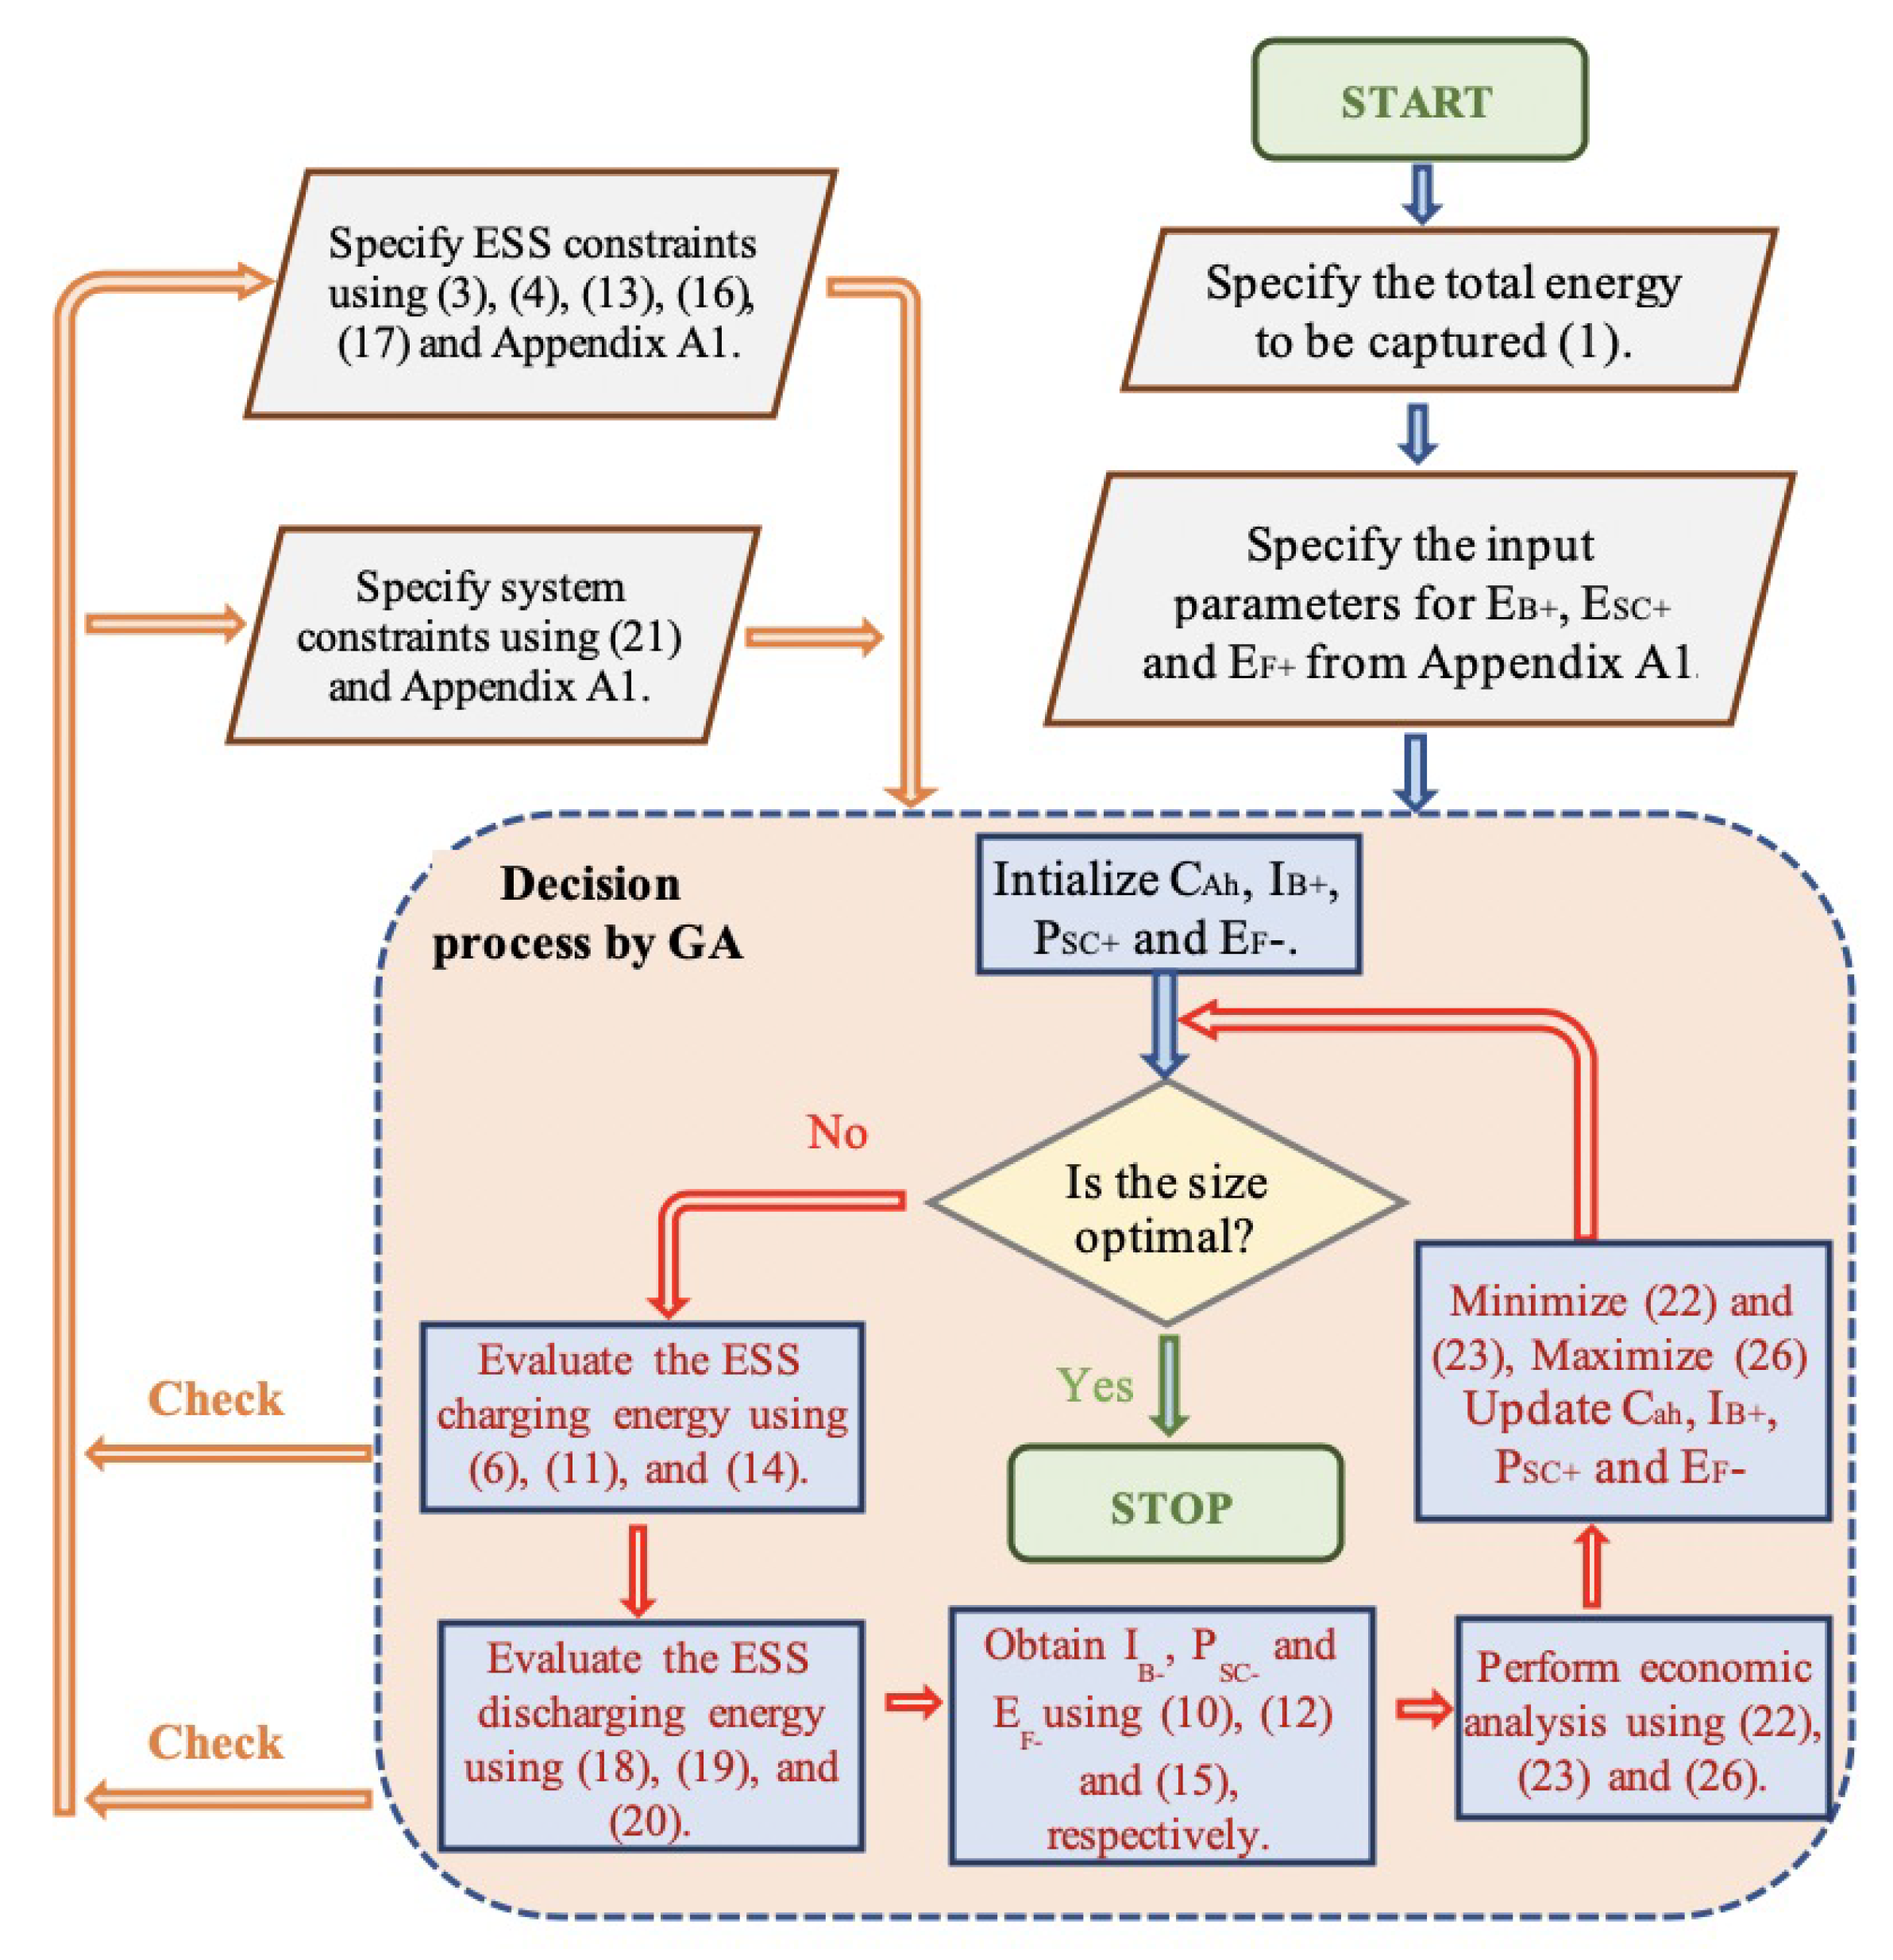
The objective of this optimization is to obtain sizes and type of ESS, in order to capture/contribute to the magnitude of energies specified in (1) and (2), so as to incur a minimum capital and operating cost. The capital and running costs are demonstrated in (22) and (23), respectively:
C c a p i t a l = [ Z 2 B C A h N S V e x p 10 3 C k W h B + Z 2 B N S V e x p I B 10 3 C k W B + 1 2 Z 2 S C 1 + ε S C Δ t r e g P S C + 10 3 C k W h S C + Z 2 S C m a x P S C + , P S C 10 3 C k W S C + Z 2 F E F 10 3 C k W h F + Z 2 F P F 10 3 C k W F ]
In (22), the first and second terms represent capital costs for energy and power ratings of BESS, respectively. Similarly, the third and fourth terms express capital costs for energy and power ratings of SCESS, respectively. Finally, the fifth and sixth terms express capital costs for energy and power ratings of FESS, respectively:
C o p e r a t i n g = Z 2 B N S V n o m I B + t B + 10 3 C k W h B N c y c l e B m + 1 2 Z 2 S C Δ t r e g P S C + 10 3 C k W h S C 1 ε S C 2 N c y c l e S C + Z 2 F t F + P F + 10 3 1 k F 2 C k W h F N c y c l e F
In (23), the first, second, and third terms stand for operating costs of BESS, SCESS, and FESS, respectively. It is to be noted that, in the first term, a modified parameter for number of BESS cycles have been used. This is because operating costs of BESS depend on its life-cycle cost, which in turn is related to its DoD, expressed in (24):
1 I B + t B + C A h = D o D
As the battery is not entirely discharged/charged for every cycle of train acceleration/deceleration, the actual number of battery cycles can be expressed as (25):
N c y c l e B m = N c y c l e B D o D
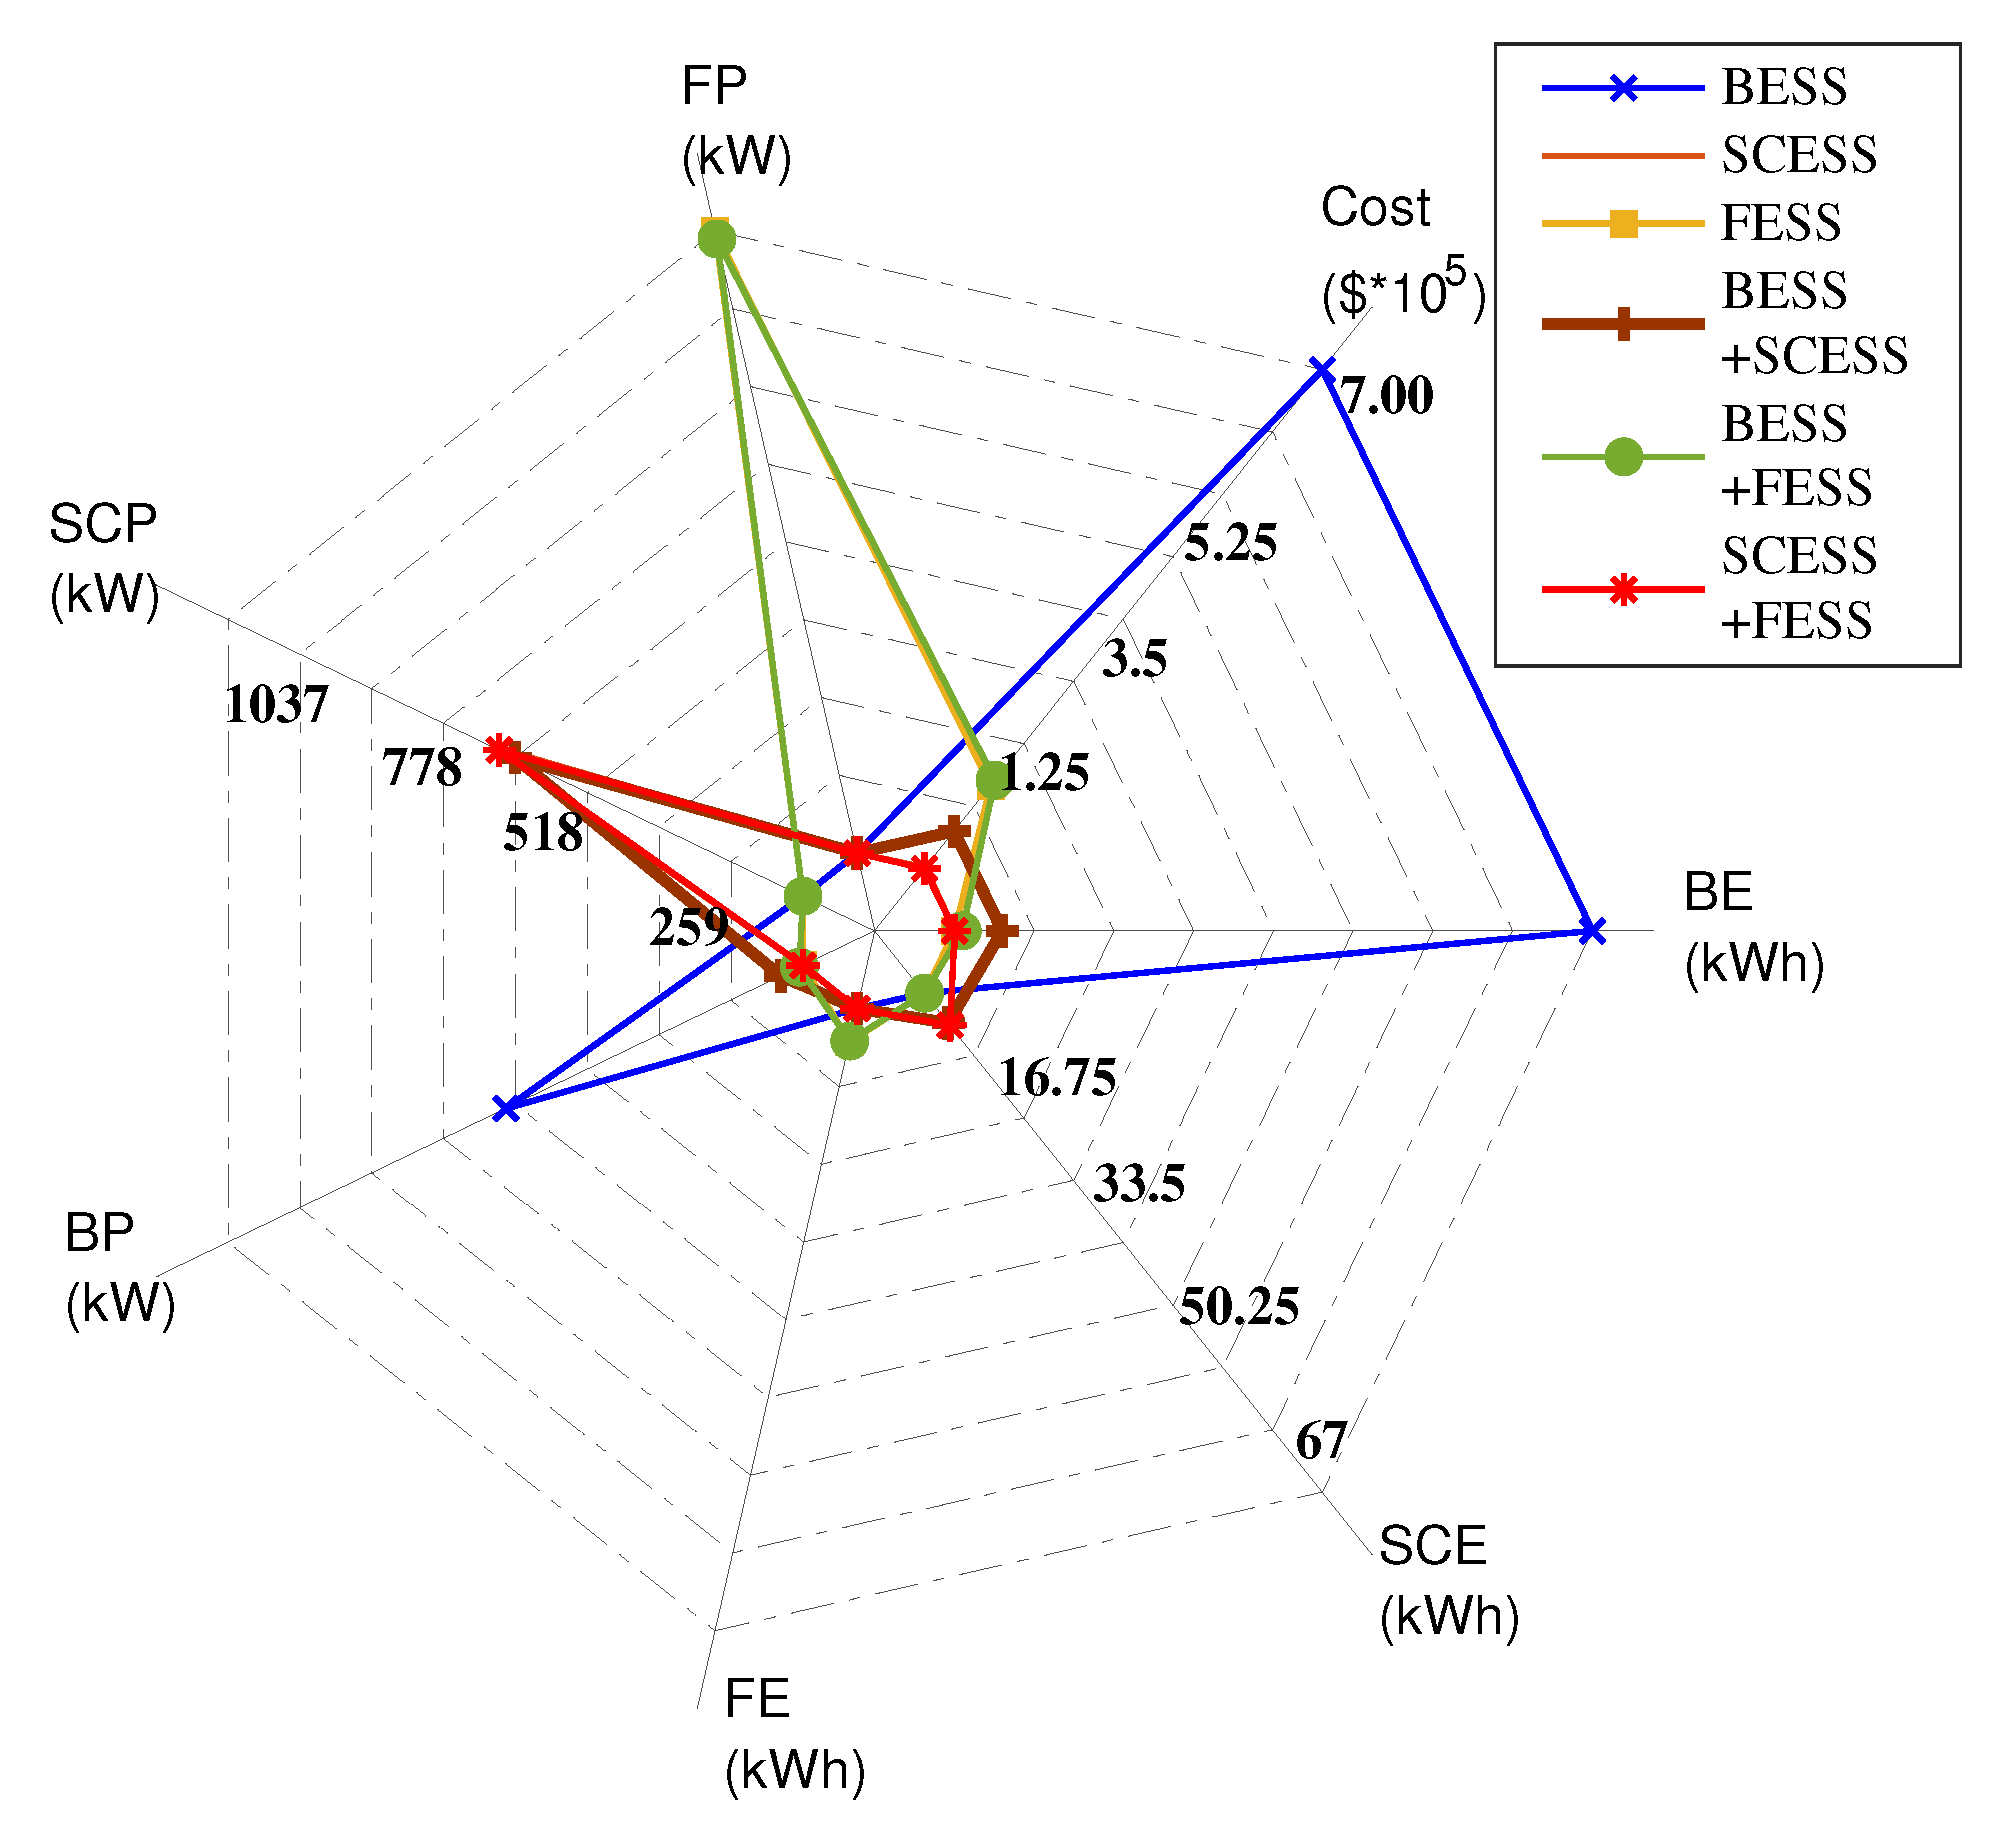
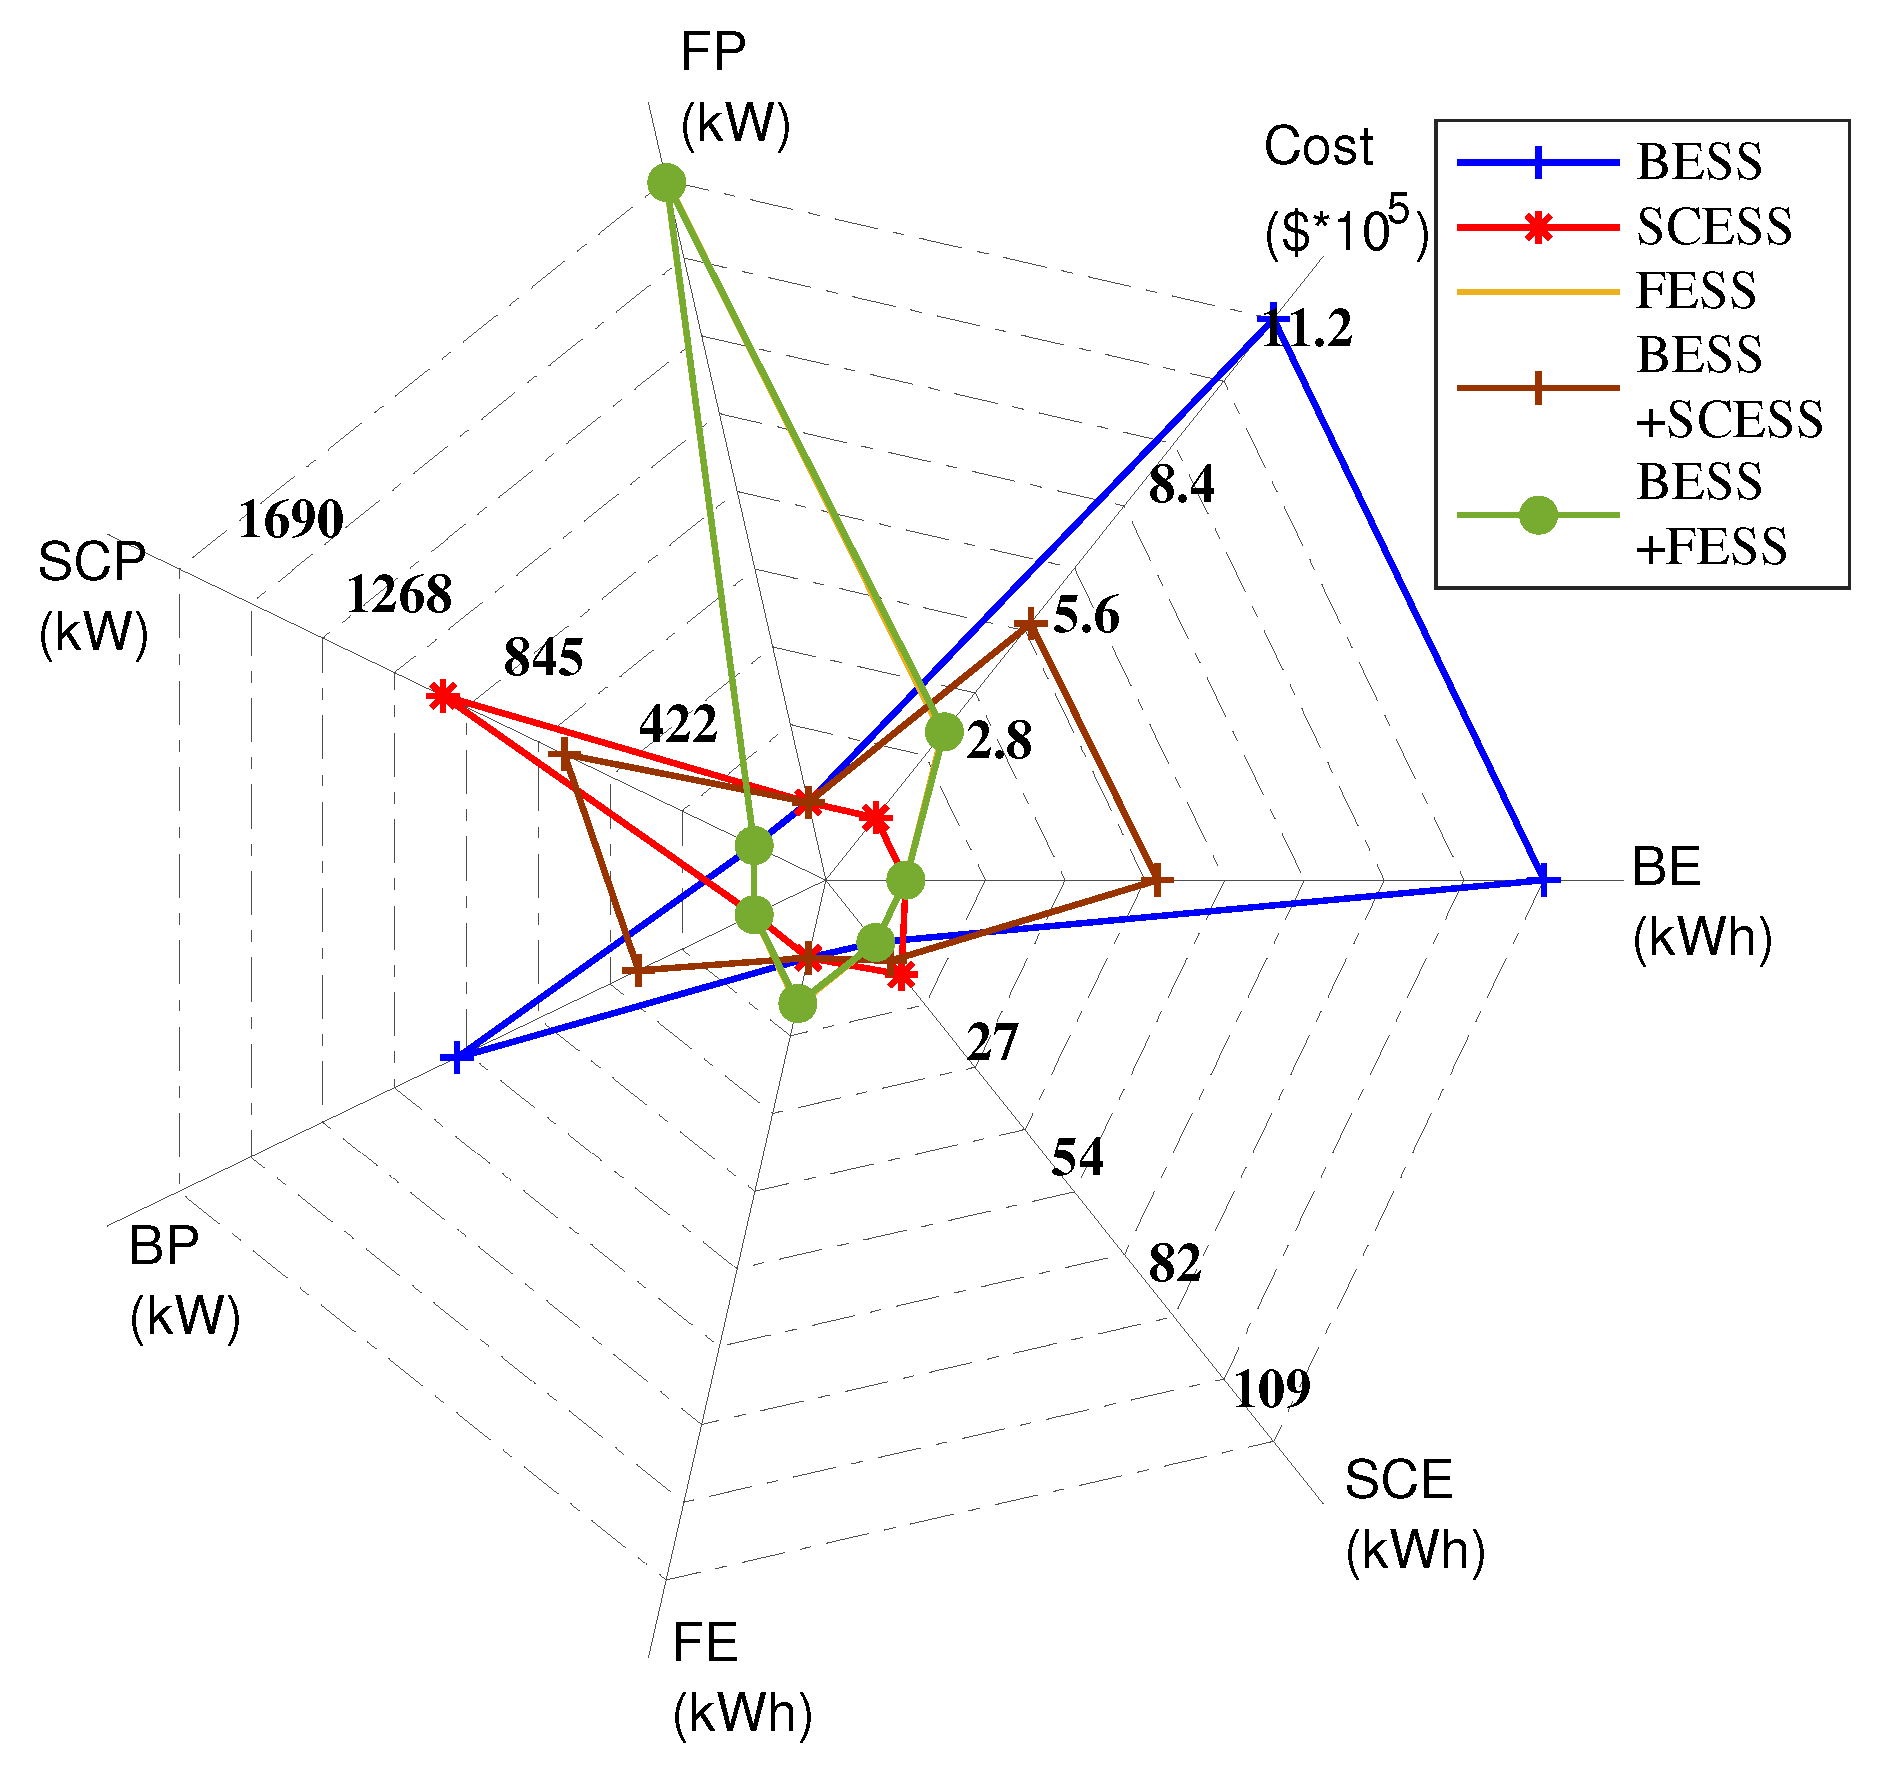
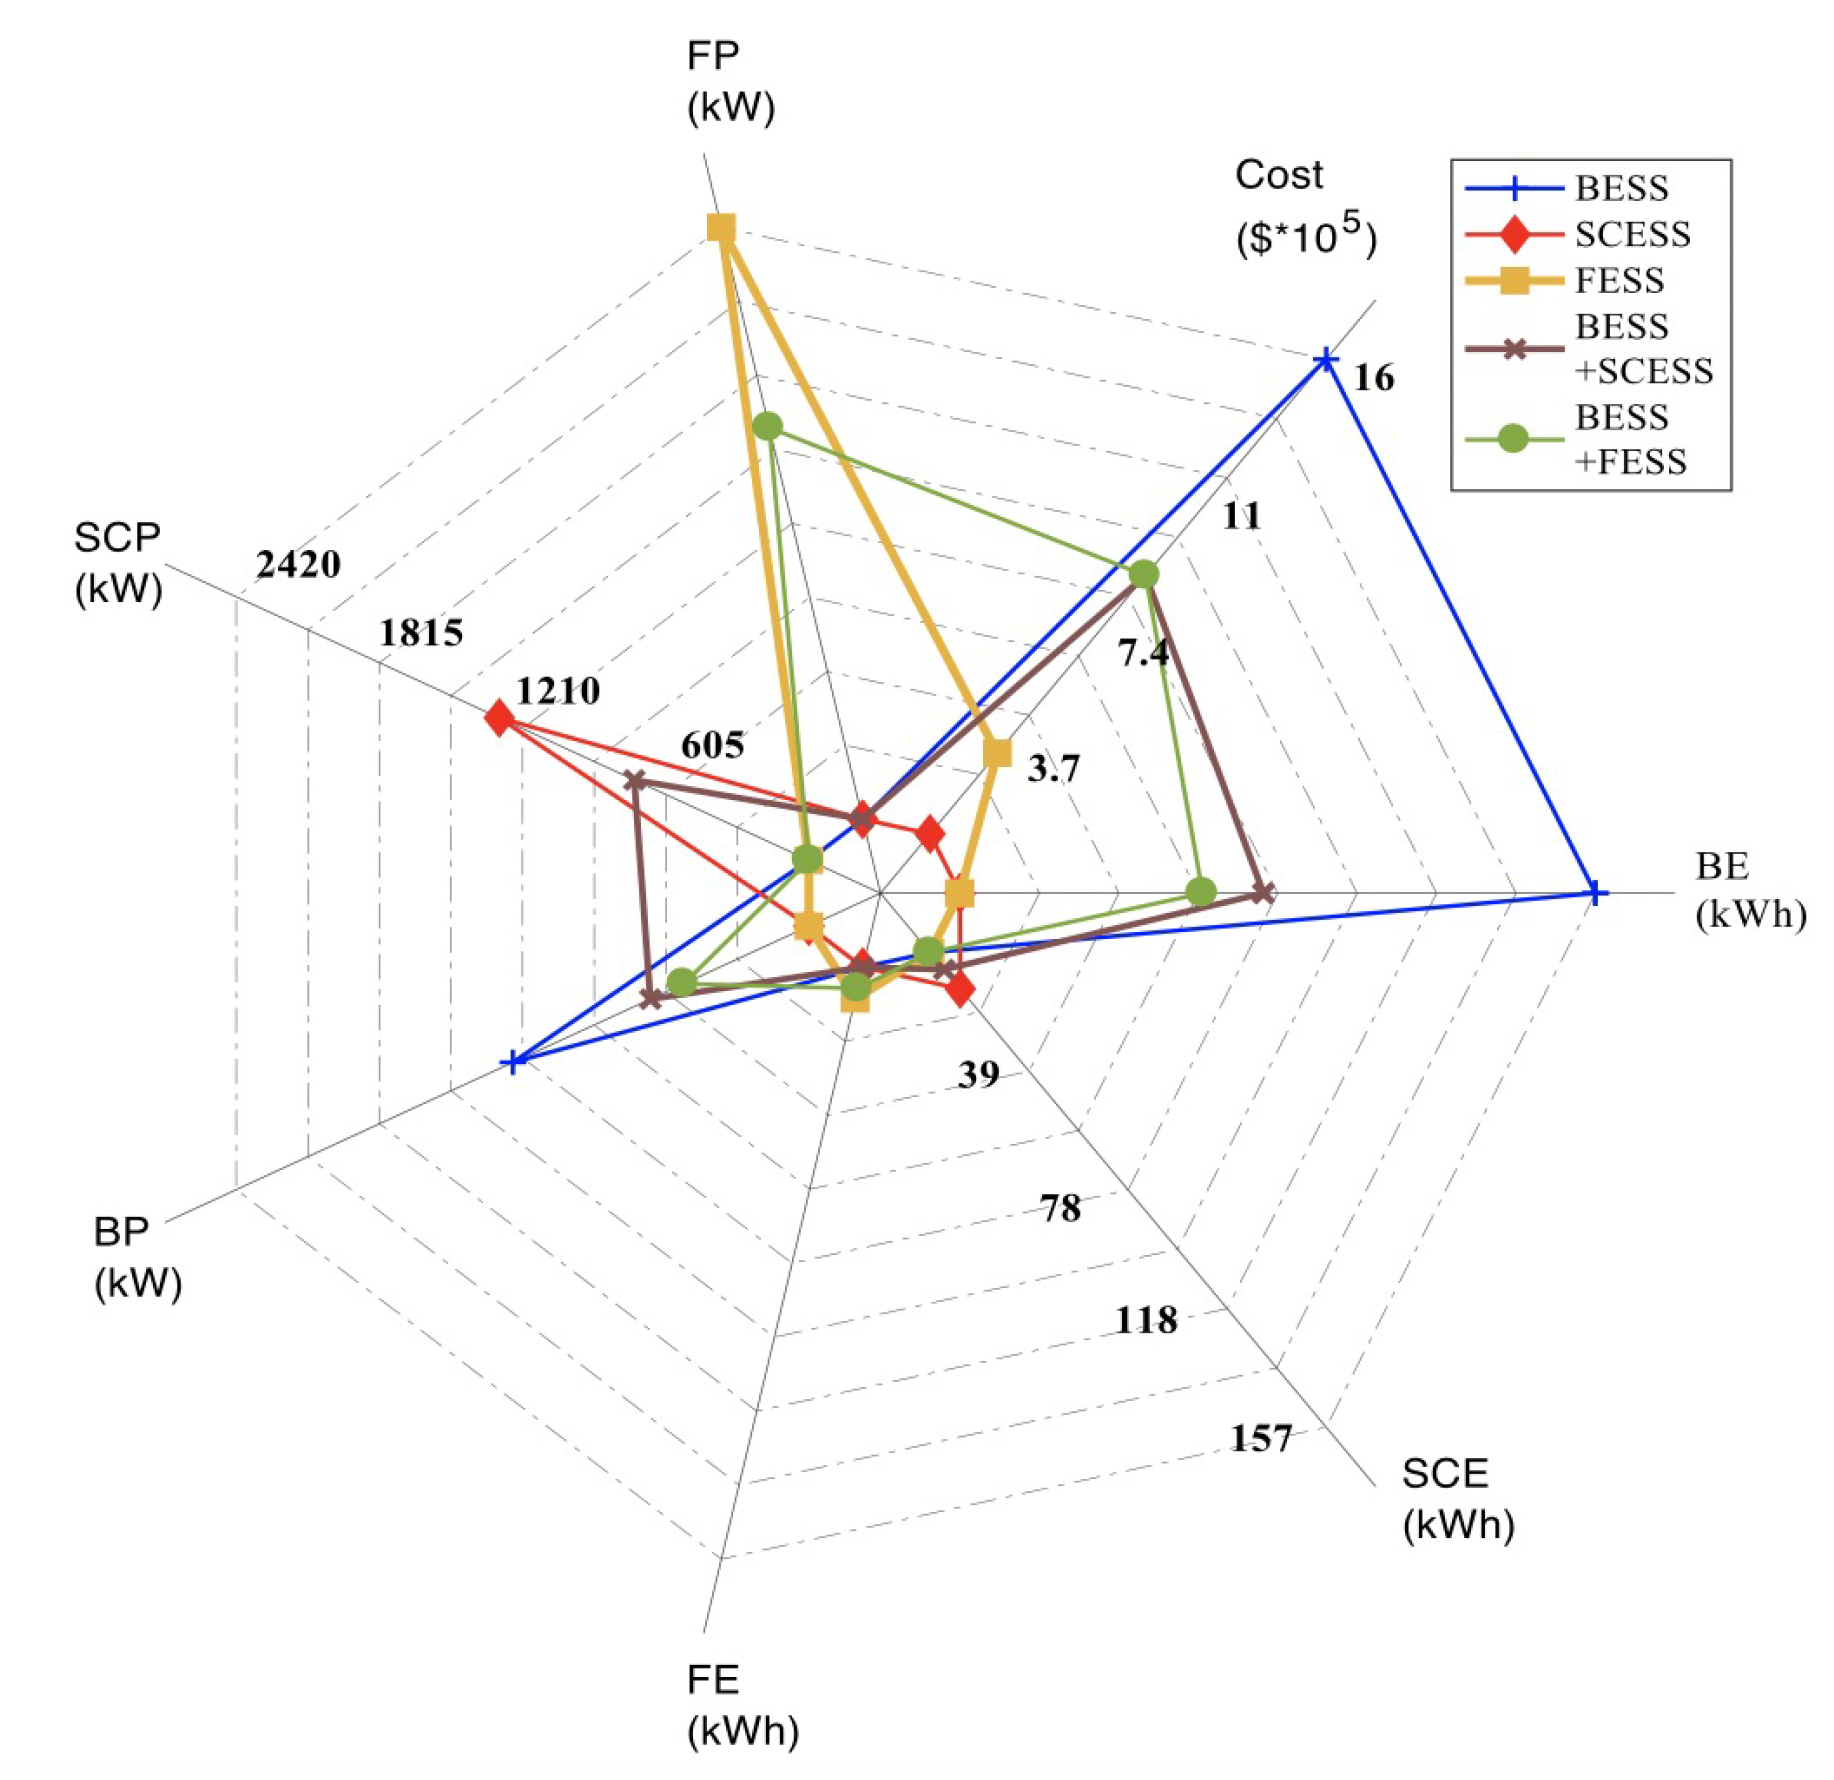
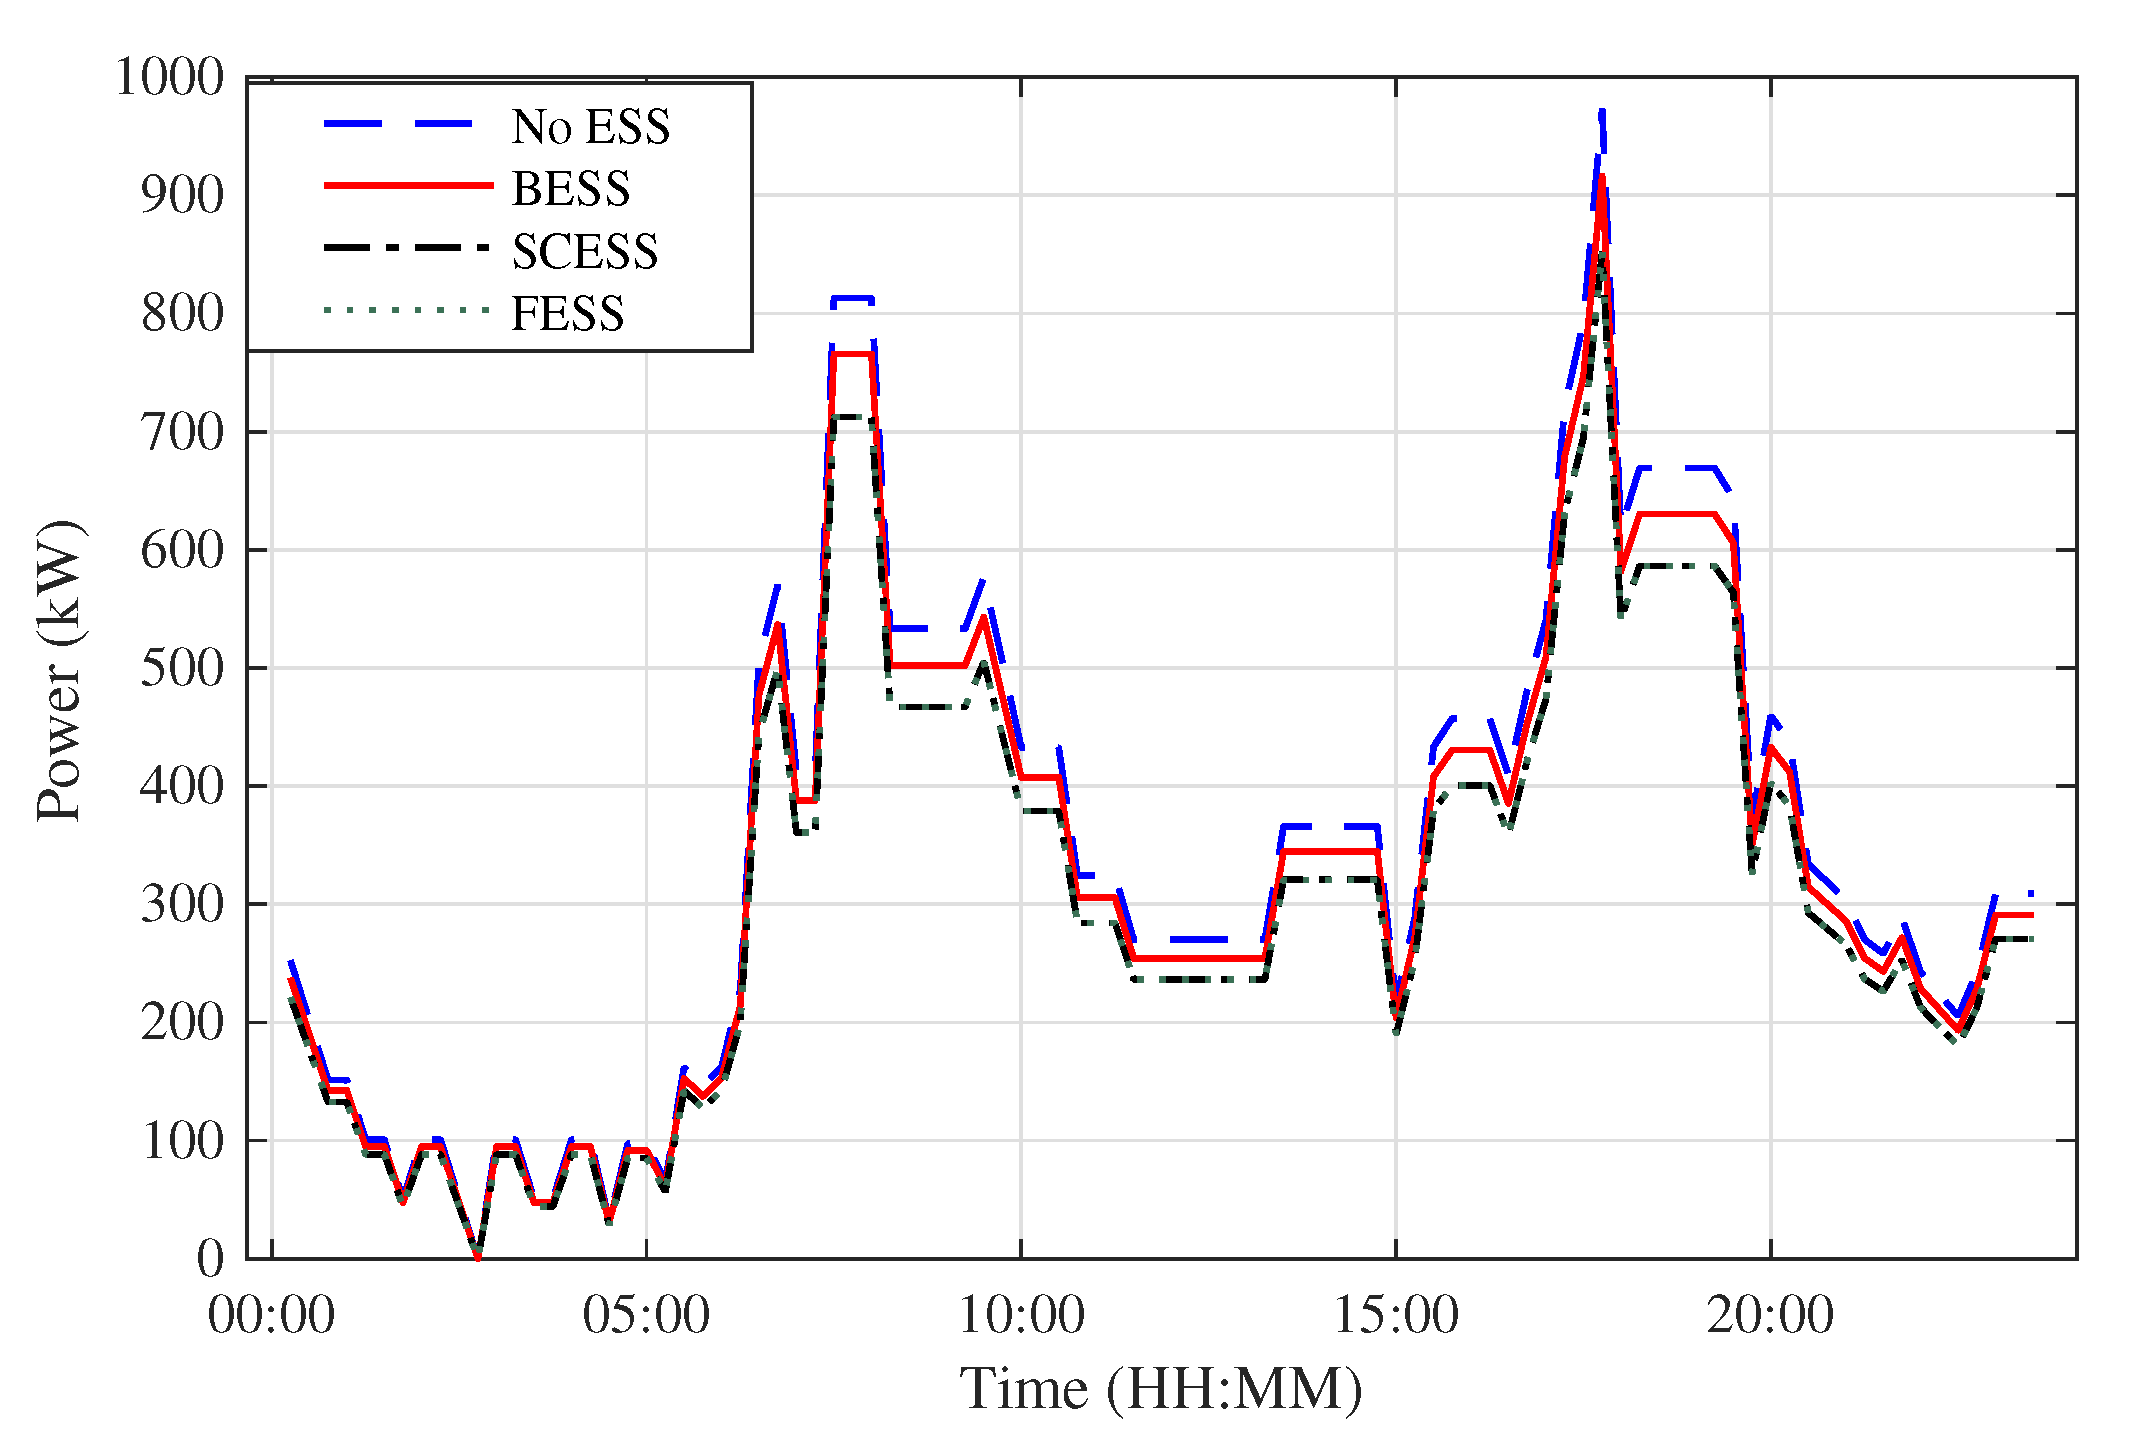
Feasibility of the sizes and combinations of ESSs can be evaluated with the help of cost savings, as expressed in (
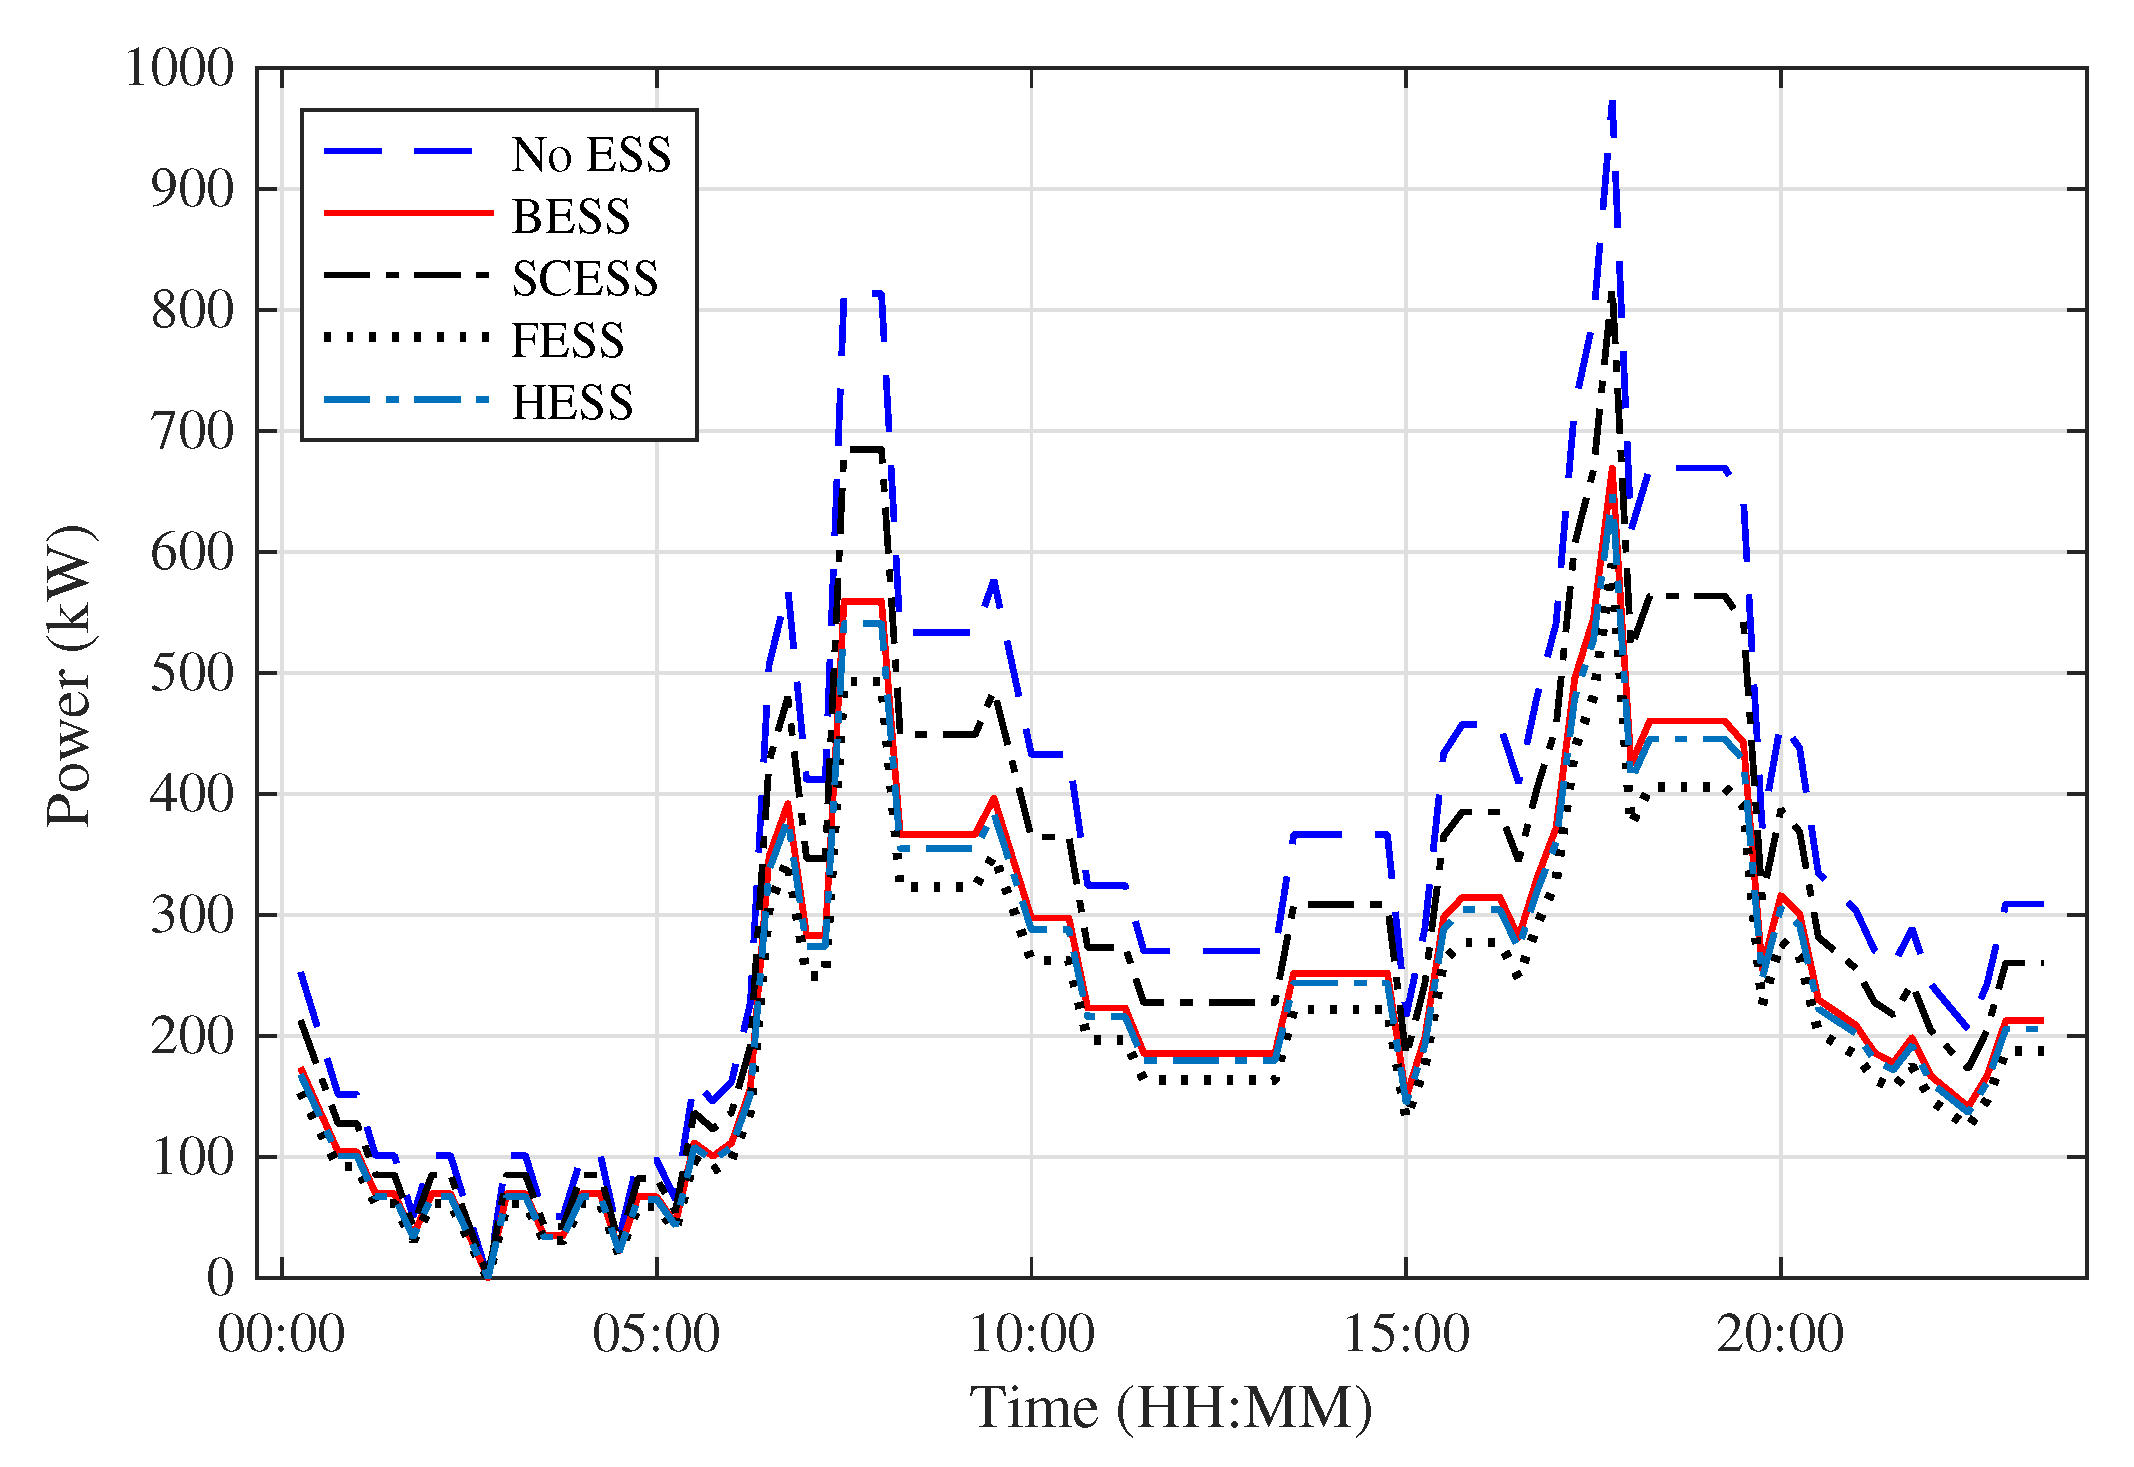
26). This equation estimates the cost savings in terms of (a) energy consumption from utility that gets reduced due to the use of ESSs, and (b) peak power shaving in a 24 hr cycle of trains:
C s a v i n g = E C u t i l i t y k W h + N p e a k [ Z 2 B N S V n o m I B + Z 2 S C P S C + Z 2 F P F ] C u t i l i t y p e a k

3.2. Optimization Algorithm

The equations above consist of both linear and nonlinear constraints, which will guide the optimization process to converge to a suitable size and combination of ESSs. The constraints for SCESS and FESS are linear, whereas that of BESS are nonlinear. The same nonlinear optimization algorithm (Genetic Algorithm) is chosen for all the cases in order to maintain consistency in the optimization process. These parameters are tabulated in Table A3 and the corresponding optimization flowchart is illustrated in Figure 3.

4. Stage 2 of Proposed Method: Simulation Modeling

The outcome of optimizing the equations is attuned to certain system parameters. Thus, a model of DC electric rail transportation system consisting of substations, rail networks, trains, ESS, and EMS have been modeled in detail and simulated in MATLAB/Simulink, as illustrated in Figure 2. An overview of the simulation modeling is provided in this section. The structure developed in this paper emulates many standard transit system models, such as New York City Transit (NYCT). The parameters used for transit system design are tabulated in Table A1.

4.1. Substation Modeling

Referring to Figure 4, the substations primarily consist of two stages: voltage transformation and rectification, where voltage of the main grid is stepped down from a medium voltage level of 13.8 kV (AC) to 645 V (DC).
Reliability of the power supply substations has been increased by using two sets of transformers and rectifiers, and connecting the two sets in parallel. One of the transformers is connected as Y Δ and the other one is connected as Δ Δ for avoiding error in phase shift. A capacitor bank is connected at the output of each transformer for stabilizing its voltage. Protection devices, such as circuit breakers, insulation etc, are connected at both AC and DC sides to increase safety.

4.2. Rail Network Modeling

Trains get their required power from substations through third rails. A return path for the current is provided by running rail, which completes the power circuit. The rail network is divided into multiple sections in order to provide easy operation, protection, and maintenance. These sections are connected to each other by traction circuit breakers. Depending on the connection of these circuit breakers, each section can be powered by one or two substations at both ends, as shown in Figure 5.
The movement of a train on traction rails is simulated by varying two set of resistances, which are specified in terms of resistance per unit length (m Ω /km), at each sampling time of the simulation (refer to Figure 5). One set of resistances, called the West Power Rail, is multiplied by the distance between train position and its departure point, where the train position is obtained by continuously integrating its speed. The second set of resistances, called East Power Rail, is multiplied by the distance between the train’s current position and its arrival point, which in this case is Passenger Station 3.

4.3. Train Modeling

In this study, a backward methodology, also called ‘effect-cause’ methodology, is used to model the trains. In backward modeling, speed of the wheels (effect) is considered as an input and, going backward through various components (vehicle dynamics, gear box and motor drive), power (cause) required by the train is evaluated [29]. In vehicle dynamics, the various forces that are applied to the wheels of the train is accounted for using speed of train (v) and inclination angle of the path ( θ ). These are forces due to friction ( F f ), gravity ( F g ), and wind ( F W ), as expressed in (27) to (29):
F f = f R M t r a i n g cos θ
F g = M t r a i n g sin θ
F W = 1 2 C W A ρ v 2
The motor of the train accelerates by overcoming these aforementioned forces using its tractive effort ( F m o t o r ), as expressed by (30):
F m o t o r F f F g F W = M t r a i n d v d t
This tractive force, when applied to the wheels, provides a rotational torque ( T W ) that is passed through the gearbox to provide T G . The expressions for T W and T G are shown in (31) and (32):
T W = F T × r 4 η c a r s
T G = T W ± B γ G
Consequently, product of torque and angular speed provides the power required by the motor drive. This power is divided by voltage, at the point of connection of the train to the rails, to obtain the required current. The current profile thus obtained, is provided to a current source that is connected to a chopper circuit, as illustrated in Figure 6. The chopper switch is operated based on the maximum voltage level of the third rail. This is an overvoltage protection which dissipates the train energy as heat in resistor R B when the third rail voltage exceeds its nominal value.

4.4. Parameters for ESS Sizing

Characteristics of the three types of ESSs, such as charging/discharging efficiency, cost of power, cost of energy, voltage level, number of cycles, and so on, used for this case study, are presented in Table A2. Design of bidirectional converter and its control strategy is elaborately depicted in Figure 7. As shown in the figure, the bidirectional converter is controlled using a current control strategy. The reference current, I r e f , is obtained from optimization of the mathematical model. Parameters for tuning the bidirectional controller are included in Table A2.
The train has been simulated to travel from passenger station 1 to passenger station 3 of Figure 2. Substation 3 and passenger station 4 have been included in the model to eliminate the anomalies pertaining to a train arriving at a terminal station. The simulation is also modeled to observe a 24 h power cycle at a particular substation due to the movement of trains. The 24 h cycle is influenced by headway of the trains which peak during two time intervals of 7:00 a.m. to 8:00 a.m. and 5:30 p.m. to 6:30 p.m. Natural exchange of regenerative braking energy between a decelerating and accelerating trains is more likely to occur during these peak hours. Probability of this occurrence is combined with the train schedule in every 15 min interval to obtain a 24 h power profile at a particular substation.

5. Results and Discussion

Viability of the equations from Section 3.1 has been substantiated here. Firstly, the equations in Section 3.1 have been optimized to obtain sizes of WESS required for storing specific percentages of regenerating energy. This is followed by simulation of the sizes using a Simulink model. In addition, a time period for return on investment for the different types and sizes of ESSs have been tabulated. Hence, the results have been categorized as (a) Results from Optimization and (b) Results from simulation and (c) Payback time estimation.

5.1. Results from Optimization

In this section, the mathematical model is optimized for saving different percentages of regenerative energy. Maximum amount of braking energy that can be feasibly recovered from regenerative braking is in the range of 38 to 40% [28,29]. Accordingly, the equations have been optimized for energy saving, starting from 15% up to a maximum of 45% with an interval of 10%. Each of these cases yields sizes of BESS, SCESS, FESS, and combinations of any two out of the three. The optimization results are illustrated in Figure 8, Figure 9, Figure 10 and Figure 11.
Figure 8 shows the sizes of WESSs for 15% regenerating energy recuperation. It is evident from this figure that a standalone SCESS and a standalone BESS provide the cheapest and most expensive solutions to this optimization problem, respectively. Among the hybrid systems, a combination of BESS and SCESS is cheaper than that of BESS and FESS.
It is also to be noted that the integration of SCESS with FESS yields the same result as a standalone SCESS. This is because the solution provides a considerably small size for energy and power of flywheel in a hybrid system consisting of SC and flywheel. It is a logical outcome as there is no need to combine two technologies with comparable power and energy densities. Thus, this hybrid system of SCESS and FESS, although not practically feasible, has been included in Figure 8 but eliminated from the other results.
Figure 9, Figure 10 and Figure 11 demonstrate similar results for 25%, 35%, and 45% regenerating energy saving, respectively. Among the hybrid systems, a battery and SC hybrid is cheaper than that of a battery with flywheel, in most cases. Although a standalone SCESS is the cheapest solution, a hybrid of SCESS and BESS might be cost efficient if other benefits are considered, e.g., the aspects of resiliency and reliability of the transit system. For instances, in case of interruption of power supply from the substations, a BESS will be able to provide the train enough power to reach its nearest passenger station. However, for smaller percentages of energy saving (≤25%), the size of battery in a battery and SC HESS is too small to provide such stack benefit. This stack benefit is only feasible for higher values of energy saving (>30%). The results of optimization are subjected to differ based on various values of life cycle cost of the storage technologies. A lesser life cycle cost of FESS might replace SCESS as the cheapest means of storing regenerating energy.

5.2. Results from Simulation

In this section, the theoretical values for the sizes of ESSs, which have been obtained from the optimization method for saving 15–45% of regenerative energy, are substantiated by simulating the prototype (Figure 2) in MATLAB/Simulink. The scenario represents a train accelerating from passenger station 1 and decelerating at passenger station 2. A standard speed profile of the train has been used and its corresponding current and power profiles are shown in Figure 12. In addition, the substation 1 current along with the third rail voltage, without any ESS, is shown in Figure 13.
These figures provide a measure of the energy consumed/regenerated during acceleration/deceleration of a train. In addition, V t h , as shown in Figure 13, is within the limits of 580 V to 720 V. In this case, all the regenerated energy is dissipated in the chopper as heat. The system is then provided with different sizes of BESS, SCESS, FESS, and various combinations of the three at Passenger station 1 to achieve a desired percentage of energy saving from regeneration. The following discussion highlights the cases for 15% and 45% energy saving, as similar results are obtained for 25% and 35% energy saving.

5.2.1. 15% Energy Energy Saving

Results for 15% regenerative energy recovery have been analyzed here. Figure 14 shows substation1 and BESS current along with BESS SOC, followed by third rail and BESS voltage. Figure 15 illustrates the same for SCESS. It can be observed from Figure 14 that the third rail voltage and SoC constraints for BESS have been complied with. In addition, it can be noted from the BESS SoC that a small relaxation time has been provided between the discharging and charging cycles. This parameter had been incorporated in the mathematical model as well in order to improve SoH of BESS.
However, unlike that of BESS, there is violation of the upper limit of V t h with SCESS for about 6 s (refer to 42–48 s period in Figure 15). This happens because a constant charging/discharging current profile prevents any abrupt change in the voltage across it ( d V S C d t ), and such violation of voltage limit will disconnect the train from the third rail. Thus, a slightly higher value of SC, compared to the one obtained from mathematical modeling, is required for maintaining a proper voltage profile. The abrupt drop in voltage, as shown in Figure 15, happens during transition of state of the train from coasting to deceleration and thus the train current changes from positive to negative. During this short time, the substation current reaches zero while the supercapacitor current demand rises to about 1000 A. Thus, the supercapacitor current demand can only be supplied by regenerating current from the train. However, it takes some time for the regenerating current to reach that magnitude demanded by the supercapacitor, as shown in Figure 12. Thus, there occurs a sudden drop in the third rail voltage during this short span of time. This problem can be mitigated by having an SC charging current with triangular shape. A similar but smaller drop in third rail voltage is observed in the case of BESS. This is because the battery current demand rises gradually, as shown in Figure 14. It is also to be noted from Figure 15 that the product of SC current and voltage will provide a trapezoidal shaped power profile, as was mentioned in the mathematical model in Section 3.1 Equations (6) and (7). Results for FESS are similar to SCESS, except that the flywheel discharges/charges a higher magnitude of current in a shorter period of time.

5.2.2. 45% Energy Saving

The retrieval of regenerating energy from train was estimated to be around 3% higher with simulation than that suggested by the equations for every size and combination of ESSs. This is because optimization equations do not capture the dynamics of a transient model. For instance, optimal sizes of BESS and SCESS, for 25% energy saving, could actually recover nearly 28% in the simulation. However, the size of the battery that was designed to capture 45% energy, could not save higher than 40% from the train. This is because of the combined effect of slow response time and constant charging current requirement of battery, as shown in Figure 16.
As can be observed from Figure 12, the train braking current rapidly drops from a peak of 10 kA to 2.5 kA within 10 s, emulating a triangular shaped current profile. However, the chemistry of a battery limits its charging current profile from taking a rectangular shape. Hence, a battery cannot efficiently capture such rapidly increasing current. However, a SC can have a charging current of any shape. The battery current, during this interval, is quite unstable as compared to the SC current in Figure 17. Thus, the BESS fails to save as much energy as compared to SCESS.
Figure 18 demonstrates the results for an HESS consisting of a battery and SC, sized to capture 45% of the train’s braking energy. Similar to most cases, the battery is underutilized (BESS discharges from 80% to 76%) as compared to the SC (SCESS discharges from 100% to 40%). However, the substation voltage is more stable with this HESS.

5.2.3. 24 h Power Profile

Effectiveness of deploying energy storage is also reflected on the peak demand reduction, which contributes a significant amount in the utility price incurred by any transit system. In addition, reducing the peak demand is also beneficial for utility companies as it helps them in controlling congestions in certain regions. The 24 h power profiles and their corresponding peak demand reductions for 15% and 45% energy saving are demonstrated in Figure 19 and Figure 20, respectively.
It is to be noted that the peak demand reduction with BESS increases with the size of battery but that with SCESS does not change noticeably with the size of SC. This phenomenon can be better understood from the performance of chopper. The chopper is modeled to switch on when the third rail voltage exceeds the maximum limit of 720 V. Hence, the chopper should be active only during train braking. However, when the SC discharges a high magnitude of current during train acceleration, the third rail voltage exceeds 720 V for some instances. Consequently, the chopper switches on and takes some current from the substation during train acceleration. Thus, the overall consumption of energy from the substation does not reduce significantly. This problem can be mitigated with a more sophisticated energy management system. In addition, it is suggested that the chopper parameter should be relaxed when ESSs are deployed in a rail transportation system. Although FESS provides the same peak shaving as SCESS for 15% regenerative energy saving, it provides the best results for 45% energy saving. In addition, an HESS consisting of a battery and SC provides better peak demand reduction than its constituting technologies as standalone systems.

5.3. Payback Time Estimation

A basic cost–benefit analysis has been performed by using (22), (23), and (26), to estimate a payback period for the installed storage technologies. This evaluation considers the capital and operating costs of the ESSs to be the expenses incurred over the cost saving in terms of energy and peak power, to obtain an approximate time after which a return on investment can be expected. The expenses for personnel and land that may contribute to the installation cost have been neglected here. With this assumption, the period for return on investment with energy saving of 15% and 45% have been tabulated in Table 1.
The actual return on investment considering all the parameters is expected to be slightly higher than this. Nonetheless, a comparative analysis between the individual units shows that the payback time for BESS is almost 15 times that of SCESS and FESS for 15% energy saving. However, this ratio is 7 for an energy saving of 45%. This shows that a battery as WESS becomes economically viable for higher (>30%) proportion of energy saving only. This claim has also been validated in the simulation results. Although an HESS is not required for lower percentage (<25%) of energy saving, its payback time is closely comparable to that of a standalone SCESS and FESS for higher energy saving.
Thus, it can be inferred from these results that the choice of type and size of WESS in a rail transit system is application specific. In order to provide a better guidance, the applications and their pertinent adoption of type and size of WESS are categorized in Table 2.

6. Conclusions

In this work, three different types of storage technologies, viz. battery, SC, and flywheel, have been investigated for wayside energy storage application in DC electric rail transportation systems. A two stage modeling and optimization framework has been proposed here in order to obtain an optimal size and combination of the ESSs, such that maximum saving of regenerative energy from trains can be accomplished with minimum investment and operating costs of the storage technologies. The first stage comprises a detailed mathematical model of the system and its constraints, which has been optimized using GA. Results from this stage show that SCESS is the cheapest, followed by FESS and BESS. However, a hybrid system consisting of a technology with high power density and another with high energy density is also essential for resiliency of a system. Among the hybrid systems, a combination of SCESS and BESS is comparatively cheaper than that of a BESS with FESS. Nonetheless, an HESS is feasible only for higher percentage (>30%) of regenerative braking energy recuperation.
The optimization results have been validated and tuned in the second stage, where a detailed simulation model has been developed in MATLAB/Simulink. The simulation results highlight underutilization of BESS, as compared to SCESS and FESS, during a train acceleration/deceleration. In addition, the third rail voltage is more stable when an HESS is deployed at passenger stations. These simulation results are also extended to a 24 h profile of the train. The 24 h profile exhibits that an FESS provides better peak demand reduction, as compared to other technologies, for higher percentage of energy recuperation. In addition, an HESS consisting of battery and SC provides more demand reduction as compared to a standalone BESS or SCESS. Thus, the suitable combination and size of WESS for rail transportation is specific to the required application, as shown in Table 2.

Author Contributions

Conceptualization, O.D., M.K. and A.M.; Data curation, O.D.; Formal analysis, O.D.; Funding acquisition, A.M.; Investigation, O.D., M.K. and A.M.; Validation, M.S. and A.M. All authors have read and agree to the published version of the manuscript.

Funding

This work is supported in part by the National Science Foundation (Award No. 1846940), New York State Energy Research and Development Authority, Con Edison, and New York City Transit. Any opinions, findings, and conclusions or recommendations expressed in this material are those of the authors and do not necessarily reflect the views of the supporting agencies.

Conflicts of Interest

The authors declare no conflict of interest.

Nomenclature

SymbolDescriptionSymbolDescription
E + / Total energy charged (+)/discharged (-) by the combination of ESSs, (Wh) E B + / Energy charged/discharged by BESS, (Wh)
E S C + / Energy charged/discharged by SCESS, (Wh) E F + / Energy charged/discharged by FESS, (Wh)
V b Open-circuit voltage of a battery, (V) V n o m , V e x p Nominal, exponential voltages of the battery respectively, (V)
t n o m , t e x p Time at which battery voltage reaches its exponential and nominal voltages respectively, (h) t B + / Battery charging/discharging time, (h)
I B + / Battery charging/discharging current, (A) C A h Capacity of a battery, (Ah)
N S Number of batteries in series η B + / Battery charging/discharging efficiency
η c o n v , B / S C / F Converter efficiency for battery/ supercapacitor/ flywheelkPeukert’s constant
HRated discharge time, (h) V S C Open-circuit voltage of supercapacitor, (V)
U T Utilization time of a battery ε S C Utilization factor of a supercapacitor
P S C + / Maximum charging/discharging power of SCESS, (W) Δ t a c c Acceleration time of a train, (h)
η S C + / Supercapacitor charging/discharging efficiency Δ t r e g Deceleration time of a train, (h)
η F + / Flywheel charging/discharging efficiency ω m i n / m a x Minimum/maximum speed of flywheel, (rpm)
P F + / Maximum charging/discharging power of flywheel, (W) S o C B / F State of charge of battery/flywheel
C c a p i t a l Capital cost, ($) C o p e r a t i n g Operating cost, ($)
C k W h _ B / S C / F Cost of energy for battery/supercapacitor/flywheel, ($/kWh) C k W _ B / S C / F Cost of power for battery/supercapacitor/flywheel, ($/kW)
η D o D Depth of discharge of battery N c y c l e _ B / S C / F Number of cycles of battery/supercapacitor/Flywheel
C s a v i n g Cost of total saving, ($) C u t i l i t y _ k W h Cost of energy by utility, ($/kWh)
N p e a k The average highest number of train cycles in a 15 mins period of a day C u t i l i t y _ p e a k Demand charges by the utility, ($/kW)

Abbreviations

The following abbreviations are used in this manuscript:
BESSBattery Energy Storage System
DoDDepth of Discharge
EMSEnergy Management System
ESSEnergy Storage System
FESSFlywheel Energy Storage System
GAGenetic Algorithm
HESSHybrid Energy Storage System
SCESSSupercapacitor Energy Storage System
SoCState of Charge
SoHState of Health
WESSWayside Energy Storage System

Appendix A

Table A1. System parameters
TypeParameterUnitValue
 SSkV13.2
 TS1 Y/D
  kV13.2/0.465
SubstationTS2 D/D
  kV13.2/0.465
 CS1, CS2F10−3
 RS1m Ω 1.08
ThirdThird Rail resistancem Ω /km170
Rail andRunning Rail resistancem Ω /km17.2
RunningDistance between passenger stationsm596.6
RailNominal Third Rail Voltage ( V n o m )V650
 Max speed of trainm/s18
 Max/Min train accelerationm/s2+/−2.5
 Effective mass of Traint380
 Rolling resistance factor-0.002
 Gravity (g)N/kg9.81
 Rail slope ( α )-0
 Drag coefficient-0.5
TrainAir density ( ρ )kg/m31.225
 Front area of the train (A)m29
 Wheel radiusm0.432
 Number of cars-11
 Gearbox efficiency-94%
 Motor efficiency-93%
 Inverter efficiency-93%
  C B μ F7500
  R B Ω 0.125
  L T μ H20
  R B D Ω 0.01
  L B D mH10.2
Bidirectional Converter C B D μ F54
 PI1-0.002, 0.2
 PI2-0.02, 2
Table A2. ESS and utility parameters.
SymbolValuesSymbolValues
V t h , m i n / m a x 580 V/720 V V b 1.3 V
V n o m 1.15 V V e x p 1.4 V
t B + / 23.1/25 s η B + / 0.75
η c o n v 0.99 N S 357
k1.3H20 h
η D o D 0.3 V S C 500 V
U T 20% ε 0.5
Δ a c c 30.9 s Δ r e g 20 s to 25 s
η S C + / 0.95 η F + / 0.9
η c y c l e _ B / S C / F 5000 / 1 × 10 6 / 1 × 10 5 t F + / 30.9/25 s
C k W h _ B / S C / F $600/500/2000 C k W _ B / S C / F $1200/100/150
C u t i l i t y _ k W h $0.035 C u t i l i t y _ p e a k $8.03
N p e a k 27.25
Table A3. GA parameters.
ParameterValuesParameterValues
Constraint TolerancePositive Scalar ( 1 × 10 3 )Crossover FractionPositive Scalar 0.8
Fitness limit-infFunction Tolerance 1 × 10 6
Initial Population Range−10 to 10Maximum stall generations50
Migration Fraction0.2Migration Interval20
Mutation FunctionGaussianPopulation Size50
Pareto Fraction0.38

References

  1. Mohamed, A.; Reid, A.; Lamb, T. White Paper on Wayside Energy Storage for Regenerative Braking Energy Recuperation in the Electric Rail System. IEEE Trans. Intell. Transp. Syst. 2019, 20, 2831–2847. [Google Scholar]
  2. Yang, X.; Li, X.; Ning, B.; Tang, T. A Survey on Energy-Efficient Train Operation for Urban Rail Transit. IEEE Trans. Intell. Transp. Syst. 2016, 17, 2–13. [Google Scholar] [CrossRef]
  3. Casals, M.; Gangolells, M.; Forcada, N.; Macarulla, M.; Giretti, A. A breakdown of energy consumption in an underground station. Energy Build. 2014, 78, 89–97. [Google Scholar] [CrossRef] [Green Version]
  4. Falvo, M.C.; Lamedica, R.; Bartoni, R.; Maranzano, G. Energy saving in metro-transit systems: Impact of braking energy management. In Proceedings of the SPEEDAM 2010, Pisa, Italy, 14–16 June 2010. [Google Scholar]
  5. Killer, A.; Armstorfer, A.; Díez, A.E.; Biechl, H. Ultracapacitor assisted regenerative braking in metropolitan railway systems. In Proceedings of the 2012 IEEE Colombian Intelligent Transportation Systems Symposium (CITSS), Bogota, Colombia, 30–30 August 2012; pp. 1–6. [Google Scholar] [CrossRef]
  6. Okui, A.; Hase, S.; Shigeeda, H.; Konishi, T.; Yoshi, T. Application of energy storage system for railway transportation in Japan. In Proceedings of the 2010 International Power Electronics Conference - ECCE ASIA, Sapporo, Japan, 21–24 June 2010; pp. 3117–3123. [Google Scholar] [CrossRef]
  7. Ogasa, M. Application of energy storage technologies for electric railway vehicles—Examples with hybrid electric railway vehicles. IEEJ Trans. Electr. Electron. Eng. 2010, 5, 304–311. [Google Scholar] [CrossRef]
  8. Radcliffe, P.; Wallace, J.S.; Shu, L.H. Stationary applications of energy storage technologies for transit systems. In Proceedings of the 2010 IEEE Electrical Power Energy Conference, Halifax, NS, Canada, 25–27 August 2010; pp. 1–7. [Google Scholar] [CrossRef]
  9. Ogura, K.; Nishimura, K.; Matsumura, T.; Tonda, C.; Yoshiyama, E.; Andriani, M.; Francis, W.; Schmitt, R.A.; Visgotis, A.; Gianfrancesco, N. Test Results of a High Capacity Wayside Energy Storage System Using Ni-MH Batteries for DC Electric Railway at New York City Transit. In Proceedings of the 2011 IEEE Green Technologies Conference (IEEE-Green), Baton Rouge, LA, USA, 14–15 April 2011; pp. 1–6. [Google Scholar] [CrossRef]
  10. Battistelli, L.; Fantauzzi, M.; Iannuzzi, D.; Lauria, D. Energy management of electrified mass transit systems with Energy Storage devices. In Proceedings of the International Symposium on Power Electronics Power Electronics, Electrical Drives, Automation and Motion, Sorrento, Italy, 20–22 June 2012; pp. 1172–1177. [Google Scholar] [CrossRef]
  11. de la Torre, S.; Sánchez-Racero, A.J.; Aguado, J.A.; Reyes, M.; Martínez, O. Optimal Sizing of Energy Storage for Regenerative Braking in Electric Railway Systems. IEEE Trans. Power Syst. 2015, 30, 1492–1500. [Google Scholar] [CrossRef]
  12. Dutta, O.; Saleh, M.; Mohamed, A. HESS in DC rail transit system: Optimal sizing and system design. In Proceedings of the 2017 IEEE 6th International Conference on Renewable Energy Research and Applications (ICRERA), San Diego, CA, USA, 5–8 November 2017; pp. 908–913. [Google Scholar] [CrossRef]
  13. Bauman, J.; Kazerani, M. A Comparative Study of Fuel-Cell-Battery, Fuel-Cell-Ultracapacitor, and Fuel-Cell-Battery-Ultracapacitor Vehicles. IEEE Trans. Veh. Technol. 2008, 57, 760–769. [Google Scholar] [CrossRef]
  14. Farhadi, M.; Mohammed, O. Energy Storage Technologies for High-Power Applications. IEEE Trans. Ind. Appl. 2016, 52, 1953–1961. [Google Scholar] [CrossRef]
  15. Chen, H.; Cong, T.N.; Yang, W.; Tan, C.; Li, Y.; Ding, Y. Progress in electrical energy storage system: A critical review. Prog. Nat. Sci. 2009, 19, 291–312. [Google Scholar] [CrossRef]
  16. Wenzl, H.; Baring-Gould, I.; Kaiser, R.; Liaw, B.Y.; Lundsager, P.; Manwell, J.; Ruddell, A.; Svoboda, V. Life prediction of batteries for selecting the technically most suitable and cost effective battery. J. Power Sources 2005, 144, 373–384. [Google Scholar] [CrossRef]
  17. Rezvanizaniani, S.M.; Liu, Z.; Chen, Y.; Lee, J. Review and recent advances in battery health monitoring and prognostics technologies for electric vehicle (EV) safety and mobility. J. Power Sources 2014, 256, 110–124. [Google Scholar] [CrossRef]
  18. Meissner, E.; Richter, G. Battery monitoring and electrical energy management: Precondition for future vehicle electric power systems. J. Power Sources 2003, 116, 79–98. [Google Scholar] [CrossRef]
  19. Ng, K.S.; Moo, C.S.; Chen, Y.P.; Hsieh, Y.C. Enhanced coulomb counting method for estimating state-of-charge and state-of-health of lithium-ion batteries. Appl. Energy 2009, 86, 1506–1511. [Google Scholar] [CrossRef]
  20. Khaligh, A.; Li, Z. Battery, Ultracapacitor, Fuel Cell, and Hybrid Energy Storage Systems for Electric, Hybrid Electric, Fuel Cell, and Plug-In Hybrid Electric Vehicles: State of the Art. IEEE Trans. Veh. Technol. 2010, 59, 2806–2814. [Google Scholar] [CrossRef]
  21. Ortuzar, M.; Moreno, J.; Dixon, J. Ultracapacitor-Based Auxiliary Energy System for an Electric Vehicle: Implementation and Evaluation. IEEE Trans. Ind. Electron. 2007, 54, 2147–2156. [Google Scholar] [CrossRef]
  22. Khodaparastan, M.; Mohamed, A. Supercapacitors for electric rail transit systems. In Proceedings of the 2017 IEEE 6th International Conference on Renewable Energy Research and Applications (ICRERA), San Diego, CA, USA, 5–8 November 2017; pp. 896–901. [Google Scholar] [CrossRef]
  23. Khodaparastan, M.; Mohamed, A. A study on super capacitor wayside connection for energy recuperation in electric rail systems. In Proceedings of the 2017 IEEE Power Energy Society General Meeting, Chicago, IL, USA, 16–20 July 2017; pp. 1–5. [Google Scholar] [CrossRef]
  24. Hammar, A.; Venet, P.; Lallemand, R.; Coquery, G.; Rojat, G. Study of Accelerated Aging of Supercapacitors for Transport Applications. IEEE Trans. Ind. Electron. 2010, 57, 3972–3979. [Google Scholar] [CrossRef]
  25. Vazquez, S.; Lukic, S.M.; Galvan, E.; Franquelo, L.G.; Carrasco, J.M. Energy Storage Systems for Transport and Grid Applications. IEEE Trans. Ind. Electron. 2010, 57, 3881–3895. [Google Scholar] [CrossRef] [Green Version]
  26. Konishi, T.; Tobita, M. Fixed energy storage technology applied for DC electrified railway (traction power substation). In Proceedings of the 2012 Electrical Systems for Aircraft, Railway and Ship Propulsion, Bologna, Italy, 16–18 October 2012; pp. 1–6. [Google Scholar] [CrossRef]
  27. Rahimi-Eichi, H.; Baronti, F.; Chow, M. Online Adaptive Parameter Identification and State-of-Charge Coestimation for Lithium-Polymer Battery Cells. IEEE Trans. Ind. Electron. 2014, 61, 2053–2061. [Google Scholar] [CrossRef]
  28. Iannuzzi, D.; Tricoli, P. Speed-Based State-of-Charge Tracking Control for Metro Trains With Onboard Supercapacitors. IEEE Trans. Power Electron. 2012, 27, 2129–2140. [Google Scholar] [CrossRef]
  29. Siemens, A. Increasing Energy Efficiency: Optimized Traction Power Supply in Mass Transit Systems; Technical Report for Siemens; Siemens: Munich, Germany, 2011. [Google Scholar]
Figure 1. Optimization of WESS using a two-stage methodology.
Energies 13 01614 g001
Figure 2. An overview of the Electric Rail Transportation System under study.
Energies 13 01614 g002
Figure 3. Flowchart for optimization of WESS.
Energies 13 01614 g003
Figure 4. Simulation model of substation.
Energies 13 01614 g004
Figure 5. Simulation model of the rail network and locomotion of the train.
Energies 13 01614 g005
Figure 6. Simulation model of train.
Energies 13 01614 g006
Figure 7. Simulation model of the ESS management system.
Energies 13 01614 g007
Figure 8. Comparison of different combinations of ESS for 15% regenerative energy saving, where BE: Battery Energy, BP: Battery Power, SCE: SC Energy, SCP: SC Power, FE: Flywheel Energy, FP: Flywheel Power. The axes for energy are scaled from 0–67 kWh, those for power are scaled from 0–1037 kW, and the axis for cost is scaled from $ 0.57 × 10 5 7 × 10 5 .
Energies 13 01614 g008
Figure 9. Comparison of different combinations of ESS for 25% regenerative energy saving, where BE: Battery Energy, BP: Battery Power, SCE: SC Energy, SCP: SC Power, FE: Flywheel Energy, FP: Flywheel Power. The axes for energy are scaled from 0–109 kWh, those for power are scaled from 0–1690 kW, and the axis for cost is scaled from $ 0.93 × 10 5 11.2 × 10 5 .
Energies 13 01614 g009
Figure 10. Comparison of different combinations of ESS for 35% regenerative energy saving, where BE: Battery Energy, BP: Battery Power, SCE: SC Energy, SCP: SC Power, FE: Flywheel Energy, FP: Flywheel Power. The axes for energy are scaled from 0–157 kWh, those for power are scaled from 0–2420 kW, and the axis for cost is scaled from $ 1.3 × 10 5 16 × 10 5 .
Energies 13 01614 g010
Figure 11. Comparison of different combinations of ESS for 45% regenerative energy saving, where BE: Battery Energy, BP: Battery Power, SCE: SC Energy, SCP: SC Power, FE: Flywheel Energy, FP: Flywheel Power. The axes for energy are scaled from 0–198 kWh that for power are scaled from 0–3026 kW, and the axis for cost is scaled from $ 1.68 × 10 5 20 × 10 5 .
Energies 13 01614 g011
Figure 12. Speed, Current, and Power profile of train.
Energies 13 01614 g012
Figure 13. Substation1 Current and Voltage profiles without ESS.
Energies 13 01614 g013
Figure 14. Substation1 and Battery Current, Battery SoC, Substation1, and Battery Voltage for 15% energy saving with standalone BESS.
Energies 13 01614 g014
Figure 15. Substation1 and SC Current, SC SoC, Substation1 and SC Voltage for 15% energy saving with standalone SCESS.
Energies 13 01614 g015
Figure 16. Substation1 and Battery Current, Battery SoC, Substation1 and Battery Voltage for 45% energy saving with standalone BESS.
Energies 13 01614 g016
Figure 17. Substation1 and SC Current, SC SoC, Substation1 and SC Voltage for 45% energy saving with standalone SCESS.
Energies 13 01614 g017
Figure 18. Substation1, Battery, and SC parameters for 45% energy saving with an HESS consisting of battery and SC.
Energies 13 01614 g018
Figure 19. 24 h profile for 15% saving of regenerative braking energy.
Energies 13 01614 g019
Figure 20. 24 h profile for 45% saving of regenerative braking energy.
Energies 13 01614 g020
Table 1. Benefit–Cost analysis.
Energy SavingType of ESSTime
 BESS2372.5 days
15%SCESS134 days
 FESS178 days
 BESS1825 days
45%SCESS293 days
 FESS302 days
 HESS547.5 days
Table 2. Application specific choice of WESS.
ApplicationEnergy Saving (%)Type of WESSReason
Congestion<25SCESSLowest cost
Control>30FESSBetter peak demand
   reduction and a comparable cost
 <25NoneNo significant technical-economic
Resiliency  trade-off
 >30HESSBest system performance and
  (BESS + SCESS)economic trade-off
 <25SCESSLowest cost and
Energy  simplicity of converter
Saving only>45BESSBetter utilization
   factor of a battery
 25–45HESSBest system performance
  (BESS + SCESS)and cost-benefit analysis

