Abstract
Smart cities directly rely on a variety of elements, including water, gas, electricity, buildings, services, transportation networks, and others. Lack of properly designed transportation networks may cause different economic and safety concerns. Highway–rail grade crossings are known to be a hazardous point in the transportation network, considering a remarkable number of accidents recorded annually between highway users and trains, and even solely between highway users at highway–rail grade crossings. Hence, safety improvement at highway–rail grade crossings is a challenging issue for smart city authorities, given limitations in monetary resources. In this study, two optimization models are developed for resource allocation among highway–rail grade crossings to minimize the overall hazard and the overall hazard severity, taking into account the available budget limitations. The optimization models are solved by CPLEX to the global optimality. Moreover, some heuristic algorithms are proposed as well. A case study focusing on the public highway–rail grade crossings in the State of Florida is performed to evaluate the effectiveness of the developed optimization models and the solution methodologies. In terms of the computational time, all the solution approaches are found to be effective decision support tools from the practical standpoint. Moreover, the results demonstrate that some of the developed heuristic algorithms can provide near-optimal solutions. Therefore, the smart city authorities can utilize the proposed heuristics as decision support tools for effective resource allocation among highway–rail grade crossings.
1. Background
Smart city operations are significantly influenced by a variety of elements, including water, gas, electricity, buildings, services, transportation networks, and others [1,2,3,4,5,6,7,8,9]. Transportation networks play a critical role for the populations inhabiting smart cities. The railroad transportation concept was introduced for the first time in the United States (U.S.) in the early 18th century [10]. There were only a few trains by the middle of the 18th century moving at a fairly low speed. Hence, safety at highway–rail grade crossings did not receive a lot of attention in the U.S. By the end of 1960s, the number of accidents at highway–rail grade crossings started increasing due to rapid industrialization, rail network expansion, and increasing train speed. Therefore, safety at highway–rail grade crossings became a major concern [11]. Although the maximum number of fatalities was recorded in 1928, the rate of fatalities to rail traffic kept increasing. The rate of highway user fatalities per million train miles comprised 1.13 and 1.95 in 1950 and 1966, respectively. The latter tendencies can be explained due to an increase in the railway and highway traffic along with limited monetary resources for installation of traffic safety devices at highway–rail grade crossings. Hence, the Federal Aid Rail–Highway Crossing Program, as a part of the Federal Highway Act of 1973 (commonly referred to as “the Section 130 Program”), was issued to provide financial resources for safety improvement at highway–rail grade crossings [11].
In 2010, it was reported that there were a total of approximately 255,000 highway–rail grade crossings all around the U.S., with 52% of them open for public use [12]. Each highway–rail grade crossing is a potential location for an accident between a highway user and a train. Furthermore, existence of a highway–rail grade crossing can increase the possibility of accidents that do not involve trains, including the following: (1) rear-end accidents between two vehicles, one of which is stopped at a highway–rail grade crossing, with the other one stopped on the highway; (2) accidents with traffic control devices at highway–rail grade crossings (e.g., signal equipment or signs); and (3) non-collision accidents, where a driver loses control of the vehicle. The analysis of the accident data collected for the highway–rail grade crossings in the U.S. showcases that the minimum number of accidents, injuries, and fatalities was recorded for 2009, while the maximum number was recorded for 2007 [13]. In general, the number of accidents, injuries, and fatalities fluctuated between 2007 and 2017, which means that the highway–rail grade crossing upgrades have not been implemented in the optimal way to produce a decreasing pattern for the number of accidents, injuries, and fatalities from 2007 to 2017.
Based on the information provided by the Federal Railroad Administration (FRA), 841 injuries and 308 fatalities among 2117 accidents were reported at highway–rail grade crossings across the country in 2017, while 54 injuries and 23 fatalities were the consequences of 106 accidents occurred in the State of Florida [13]. The frequent accident occurrence at highway–rail grade crossings in the State of Florida can be explained by the following factors [14]: (1) the State of Florida is the third most populous state in the U.S.; (2) about 201,040 million vehicle miles of travel were recorded in the State of Florida in 2015; (3) the majority of the population travel to work by automobiles; (4) the State of Florida is largely urbanized; and (5) the metropolitan areas in the State of Florida record a high volume of freight and passenger rail traffic. This study aims to improve the safety of railway and highway travelers in smart cities and proposes two optimization models that can assist with resource allocation among highway–rail grade crossings. The objective of the first optimization model is to minimize the overall hazard, while the second optimization model aims to minimize the overall hazard severity.
In order to solve the developed optimization models and to achieve the global optimality, two exact optimization approaches are adopted. Moreover, a group of heuristic algorithms that prioritize highway–rail grade crossings for upgrading based on certain rules are developed to solve the proposed optimization models within a reasonable computational time for the realistic problem instances. A case study, considering the public highway–rail grade crossings in the State of Florida, is used to evaluate the performance of the solution approaches. In particular, the performance of the solution approaches is assessed from two points of view: (1) the solution quality (i.e., the overall hazard and the overall hazard severity at the highway–rail grade crossings after implementation of the suggested countermeasures); and (2) the computational time (so that decisions regarding selection of the highway–rail grade crossings for upgrading and identification of the appropriate upgrading type can be made effectively and in a timely manner). The input data required to conduct the numerical experiments (e.g., the set of highway–rail grade crossings, the set of countermeasures considered for implementation, and the hazard severity categories) will be further described in the manuscript.
The remainder of this paper is structured as follows. In the Section 2, the related literature is reviewed. The resource allocation problem addressed herein is discussed in the Section 3. The developed optimization models and their formulations are described in the Section 4. The adopted exact optimization approaches and the developed heuristic algorithms are explained in the Section 5. The Section 6 covers the input data description, evaluation of the solution methodologies, and the managerial insights. Conclusions and future research extensions are highlighted in the Section 7.
2. Literature Review
Under this section of the manuscript, two groups of previously conducted studies are comprehensively described: (1) previous safety efforts at highway–rail grade crossings; and (2) resource allocation studies for highway–rail grade crossings. Towards the end of the literature review section, the contributions of this study are clearly stated as well.
2.1. Previous Efforts on Safety at Highway–Rail Grade Crossings
Some of the state Departments of Transportation (DOTs) in the U.S. have conducted a number of studies, aiming to improve safety at highway–rail grade crossings. A total of 13 accident prediction models and hazard prediction models were investigated by the Virginia Highway and Transportation Research Council [15]. In that study, the models were evaluated in terms of the accident prediction ability, and the adoption of models among different states was investigated as well. Moreover, the main accident and hazard model predictors were identified in the study, where the number of vehicles per day and the number of trains per day were recognized as the most commonly used factors. The study classified the identified formulae as follows: (1) relative formulae that rely on the hazard index value; and (2) absolute formulae that rely on the number of accidents. The results from the conducted analysis demonstrated that the U.S. DOT accident prediction formula outperformed the other formulae in terms of ranking the most hazardous highway–rail grade crossings in the State of Virginia.
The Tennessee DOT in collaboration with the University of Memphis developed a set of models to allocate the available monetary resources for safety improvement projects at the highway–rail grade crossings in the State of Tennessee. The objective was to reduce the expected number of accidents and the expected accident severity [16]. The study performed a survey on the nationally recognized methods and the state-specific approaches used for prediction of accidents and for assessing a potential hazard of highway–rail grade crossings. Moreover, a detailed review was conducted on the Tennessee Roadway Information Management System (TRIMS) database, which included some important information about the highway–rail grade crossings in the State of Tennessee. Several heuristic approaches were presented in order to solve the developed mathematical models for resource allocation. Comprehensive numerical experiments were conducted to show the applicability of the proposed methodology.
Weissmann et al. [17] proposed a methodology for prioritizing highway–rail grade crossings in the State of Texas. Some of the previously developed accident and hazard prediction models were reviewed. The study presented the revised Texas priority index to address the limitations, which were reported for the existing Texas priority index. The revised Texas priority index value for a given highway–rail grade crossing was calculated by considering the predicted number of accidents per year and the number of accidents observed over the last 5 years. A comprehensive set of experiments were conducted over 9108 highway–rail grade crossings, with the results demonstrating the superiority of the revised Texas priority index formula in identification of the most hazardous highway–rail grade crossings. Moreover, the methodologies that were used to issue warrants for passive highway–rail grade crossings were reviewed in the study. The results showed that the Florida DOT (FDOT) methodology was stricter than the other methods. It was concluded that active highway–rail grade crossings should be prioritized considering the revised Texas priority index, while passive highway–rail grade crossings should be prioritized based on the revised Texas priority index and the Texas passive crossing index.
The Iowa DOT in collaboration with the Institute for Transportation at Iowa State University conducted a project for the development of a methodology to prioritize the highway–rail grade crossings for safety improvement projects in the State of Iowa [18,19]. The Iowa DOT [18] developed a safety action plan, aiming to reduce the number of accidents at the highway–rail grade crossings in the State of Iowa, to identify the most hazardous highway–rail grade crossings, and to determine specific engineering solutions to improve safety at the highway–rail grade crossings. The benefit–cost analysis was adopted by the Iowa DOT to allocate the available monetary resources among the highway–rail grade crossings that required safety improvement projects. Hans et al. [19] showed that the following factors should be considered throughout the selection of highway–rail grade crossings for safety improvement projects: (1) demand factor; (2) alternate route factor; and (3) certain other railway- and roadway-related factors. In conclusion, a weighted-index method and an accompanying tool for Microsoft Excel spreadsheets were developed for prioritization of the highway–rail grade crossings in the State of Iowa based on the aforementioned factors.
The Ohio DOT in collaboration with Ohio University and Texas A&M Transportation Institute developed a decision support methodology to assist with selection of highway–rail grade crossings for safety improvement projects [20]. The existing highway–rail grade crossing improvement program in the State of Ohio can be summarized in the following three steps: (1) development of the list of candidate grade crossing locations; (2) diagnostic review of the candidate grade crossing locations; and (3) project implementation. A review of the projects, conducted by other state DOTs and focusing on the adopted accident and hazard prediction formulae, was performed. The review showed that there were a number of factors that other states considered in their models but they were not included in the model by the State of Ohio. These factors included: (1) stopping sight distance; (2) school bus or special vehicle volume; (3) highway traffic speed; (4) proximity of a highway–rail grade crossing to a nearby intersection; and (5) “close call” data. In conclusion, it was recommended to use the U.S. DOT accident prediction formula for resource allocation among the highway–rail grade crossings in the State of Ohio. Moreover, the study suggested deploying the Missouri Exposure Index and the North Carolina Investigative Index in order to rank passive highway–rail grade crossings upon completion of the initial prioritization.
In addition to the aforementioned state DOT efforts, other state DOTs have conducted some research works on safety at highway–rail grade crossings as well. A detailed description of the other state DOT efforts, as well as the accident and hazard prediction models that have been used for highway–rail grade crossings, can be found in Elzohairy and Benekohal [21] and Dulebenets et al. [22]. A significant number of studies aimed to improve safety at highway–rail grade crossings in other countries as well. For example, Hu et al. [23] developed a logit model to analyze the severity of accidents at the highway–rail grade crossings in Taiwan. The data were collected for a total of 592 highway–rail grade crossings. The findings indicated that the annual daily train traffic, the annual daily roadway traffic, highway separation, approaching crossing markings, and obstacle detection devices could substantially influence the accident severity.
Evans [24] investigated fatal accidents that occurred at the highway–rail grade crossings in Great Britain between 1946 and 2009. The considered highway–rail grade crossings were classified into three groups, including: (1) railway-controlled; (2) automatic; and (3) passive groups. The highest fatality rate was observed for the automatic highway–rail grade crossings (52% of fatalities), while the best safety performance was recorded for the railway-controlled highway–rail grade crossings. Boros et al. [25] focused on improving safety at the highway–rail grade crossings in Hungary. The required data were collected from approximately 1700 highway–rail grade crossings. The analysis results indicated that the annual daily train traffic and the annual daily roadway traffic were significant predictors that influenced the safety level the most. On the other hand, crossing angle, number of tracks, track alignment, and sight distances were found to be non-significant.
Laapotti [26] compared the accident occurrence at the passive and active highway–rail grade crossings in Finland. The passive highway–rail grade crossings were found to be riskier. The study highlighted that human error was one of the main factors causing the accident occurrence. Larue and Wullems [27] and Larue et al. [28] also pointed out that human errors could negatively affect safety at highway–rail grade crossings. However, both studies were performed for the highway–rail grade crossings in Australia.
Beanland et al. [29] studied the driver compliance at the rural highway–rail grade crossings with passive protection in Australia. A total of 22 drivers participated in the experiments. It was observed that 14% of drivers violated stop controls, while 27% made rolling stops (<10 km/h). The study highlighted that the compliant and non-compliant drivers had the same approach speed, but the non-compliant drivers spent less time visually checking for trains. Beanland et al. [30] evaluated three new treatments for the rural highway–rail grade crossings in Australia using a driving simulator, including the following: (1) GPS average speed interface; (2) ecological interface design crossing; and (3) simple but strong crossing. The results indicated that the proposed new treatments had some advantages and disadvantages, which should be further studied in the future. A number of other studies also focused on reducing safety risks at the highway–rail grade crossings in Australia [31,32,33,34].
2.2. Resource Allocation Studies for Highway–Rail Grade Crossings
Berg [35] highlighted that many research efforts relied on the effectiveness ratios for various safety improvement actions and incorporated the accident history into accident prediction models and hazard prediction models, as well as resource allocation procedures. It was shown that the existing methods could introduce some bias in the analysis, which could further cause inaccurate resource allocation among highway–rail grade crossings. The study recommended ignoring the adjustment of the predicted accident rate based on the recent accident history. Forgionne [36] proposed a high-speed rail grade crossing analysis tool, which could assist the FRA in evaluating the costs and benefits of potential infrastructure projects. In the conducted study, the FRA objectives and the role of a cost–benefit analysis in achieving these objectives were discussed. The study also demonstrated the applicability of the developed decision support system using real-life data.
Konur et al. [37] developed an optimization model to assist the Tennessee DOT with resource allocation among the highway–rail grade crossings for safety improvement projects. The developed optimization model aimed to maximize the safety benefits subjected to the operational constraints. A set of sorting heuristics were developed to solve the optimization models, which were based on the safety benefit-to-cost ratios. The computational experiments demonstrated that the proposed mathematical modeling approach was more accurate than the developed sorting heuristics. Rezvani et al. [38] proposed a benefit–cost methodology for highway–rail grade crossing safety protocols to be utilized for prioritization of safety improvement projects. The proposed methodology included five major steps: (1) measuring the accident cost; (2) cost-based screening; (3) benefit–cost analysis; (4) project prioritization; and (5) funding. It was concluded that the proposed framework could be effectively used by decision makers to allocate the available funds among highway–rail grade crossings.
2.3. Discussion and Contributions
A review of the relevant literature revealed a significant number of research efforts aiming to improve safety at highway–rail grade crossings. Some studies presented methodologies that can be used for resource allocation among highway–rail grade crossings. Considering a substantial number of accidents at the highway–rail grade crossings in the State of Florida, this study presents two optimization models that can assist the relevant stakeholders, including the smart city authorities, with identification of the highway–rail grade crossings that require upgrading, as well as selection of the appropriate upgrading type, taking into account the available budget limitations. The objective of the first optimization model is to minimize the overall hazard at the highway–rail grade crossings, while the second optimization model minimizes the overall hazard severity at the highway–rail grade crossings. A set of solution algorithms, including exact and heuristic methods, are proposed to solve each one of the optimization models. A case study is further conducted for the public highway–rail grade crossings in the State of Florida to evaluate the performance of the developed solution algorithms, as well as to showcase some important managerial insights that would be of interest to the smart city authorities.
3. Problem Description
A detailed description of the resource allocation optimization problems investigated herein is presented in this section of the manuscript. Each state in the U.S. is allocated a limited budget to upgrade the highway–rail grade crossings, with the aim of improving the level of safety. The relevant stakeholders, including the smart city authorities, are expected to effectively distribute the available budget among the considered highway–rail grade crossings to implement the countermeasures.
Let denote a set of highway–rail grade crossings considered for upgrades. Some specific countermeasures, which were determined based on the relevant procedures, can be assigned to the highway–rail grade crossings throughout the resource allocation process. Here, is a set of countermeasures, which can be implemented at highway–rail grade crossings. Two optimization models are developed in this study, where one of them minimizes the overall hazard at the highway–rail grade crossings and the other one minimizes the overall hazard severity at the highway–rail grade crossings. The overall hazard () will be estimated based on the Florida index priority formula (see Section 6.1 for more details). In order to calculate the overall hazard severity for the second optimization model, the overall hazard should be divided into different severity categories (denoted using set ) based on the methodology provided by the GradeDec.NET reference manual [39]. Note that the hazard of severity category for highway rail grade crossing will be referred to as . A weight (i.e., ) is associated with each severity category, and the weight value increases with the severity level (i.e., the fatality hazard should have a higher weight value as compared to the injury hazard for a given highway–rail grade crossing).
The current features of a given highway–rail grade crossing (i.e., the existing traffic control devices installed at the highway–rail grade crossing) determine the eligibility of the highway–rail grade crossing for implementation of different types of countermeasures. This concept is applied within the developed resource allocation optimization models using the parameter . In particular, if , then countermeasure can be implemented at highway–rail grade crossing . On the other hand, if , countermeasure cannot be implemented at highway–rail grade crossing . Moreover, the influence of implementing a given countermeasure at the highway–rail grade crossings is designated by a specific effectiveness factor, which represents the percentage reduction of a potential hazard or hazard severity at a given highway–rail grade crossing after the countermeasure implementation. The effectiveness factor is applied within the developed resource allocation optimization models using the parameter . The cost of implementing countermeasure at highway–rail grade crossing is designated using the parameter . The total cost of implementing countermeasures assigned to the highway–rail grade crossings throughout the resource allocation process should not exceed the total available budget ().
4. Model Formulation
This section of the manuscript provides a detailed explanation of the two developed optimization models, along with all of the components and notations, which will be used within the mathematical models. Moreover, two integer programming mathematical formulations are presented for the two developed optimization models, where the first model aims to minimize the overall hazard at the highway–rail grade crossings, and the second model aims to minimize the overall hazard severity at the highway–rail grade crossings. The constraint sets, which are used within the developed mathematical models, will be further described in detail as well.
4.1. Nomenclature
The nomenclature used throughout the mathematical model development is explained in this section of the manuscript. Table 1 provides a detailed description of all the components and notations adopted in the integer programming mathematical models, which were developed for resource allocation among the respective highway–rail grade crossings.

Table 1.
Description of the mathematical model components and notations.
4.2. Minimizing the Overall Hazard
The integer programming model, developed for the first resource allocation problem (RAP-1) among the existing highway–rail grade crossings, is presented under this section of the manuscript. The RAP-1 mathematical model aims to minimize the overall hazard at the highway–rail grade crossings. The RAP-1 mathematical model can be formulated as follows.
RAP-1:
Subject to:
The objective function (1) minimizes the overall hazard at the highway–rail grade crossings. Constraint set (2) ensures that no more than one countermeasure can be implemented at each one of the considered highway–rail grade crossings. Constraint set (3) indicates that a given countermeasure can be implemented only at the highway–rail grade crossings that are eligible for that countermeasure. Constraint set (4) guarantees that the total cost of upgrading the highway–rail grade crossings will not be greater than the total available budget. The nature of decision variables and parameters of the RAP-1 mathematical model is defined within constraint sets (5) and (6) (note that “” refers to a set of binary numbers and “” refers to a set of positive real numbers).
4.3. Minimizing the Overall Hazard Severity
The integer programming model, developed for the second resource allocation problem (RAP-2) among the existing highway–rail grade crossings, is presented under this section of the manuscript. The RAP-2 mathematical model aims to minimize the overall hazard severity at the highway–rail grade crossings. The RAP-2 mathematical model can be formulated as follows.
RAP-2:
Subject to:
The objective function (7) minimizes the overall hazard severity at the highway–rail grade crossings. Constraint set (8) ensures that no more than one countermeasure can be implemented at each one of the considered highway–rail grade crossings. Constraint set (9) indicates that a given countermeasure can be implemented only at the highway–rail grade crossings that are eligible for that countermeasure. Constraint set (10) guarantees that the total cost of upgrading the highway–rail grade crossings will not be greater than the total available budget. The nature of decision variables and parameters of the RAP-2 mathematical model is defined within constraint sets (11) and (12) (note that “” refers to a set of binary numbers and “” refers to a set of positive real numbers).
5. Solution Methods
In general, resource allocation problems that distribute a limited budget among certain areas can be reduced to a typical Knapsack problem, which has non-deterministic polynomial time complete (NP-complete) complexity [22]. Two groups of solution methodologies were developed to solve the proposed RAP-1 and RAP-2 mathematical models: (1) exact optimization approaches; and (2) heuristic algorithms. Exact optimization methodologies provide the global optimum for the developed optimization models (i.e., RAP-1 and RAP-2). However, exact optimization methodologies may require significant computational time to solve a given mathematical model to the global optimality. Therefore, a group of heuristic algorithms were developed to solve RAP-1 and RAP-2 and to provide high-quality solutions within a reasonable computational time. The adopted exact optimization approaches are presented in Section 5.1 of the manuscript, while the developed heuristic algorithms are described in Section 5.2 of the manuscript.
5.1. Exact Optimization Approaches
Two exact optimization approaches, including the MATLAB function “intlinprog” and CPLEX, were adopted to solve the RAP-1 and RAP-2 mathematical models to the global optimality. The function “intlinprog” is a solver embedded in the MATLAB optimization toolbox, which is widely used for mixed-integer linear programming optimization models [40]. On the other hand, CPLEX executes a set of heuristics to facilitate exploration of various domains of the search space. The heuristics, deployed by CPLEX, can be categorized into the following two groups: (1) node heuristics; and (2) neighborhood exploration heuristics. In this study, CPLEX was executed using the general algebraic modeling system (GAMS) [41], where the target optimality gap was set to 0.01%, and the computational time was restricted to 7200 sec. GAMS was called via the MATLAB environment throughout the numerical experiments.
5.2. Heuristic Algorithms
A total of four heuristic algorithms were developed to solve the RAP-1 mathematical model: (a) the most profitable hazard reduction (MPHR) heuristic; (b) the most effective hazard reduction (MEHR) heuristic; (c) the profitable hazard reduction (PHR) heuristic; and (d) the effective hazard reduction (EHR) heuristic. Additionally, four heuristic algorithms were developed to solve the RAP-2 mathematical model: (a) the most profitable severity reduction (MPSR) heuristic; (b) the most effective severity reduction (MESR) heuristic; (c) the profitable severity reduction (PSR) heuristic; and (d) the effective severity reduction (ESR) heuristic. The developed heuristic algorithms create a priority list for highway–rail grade crossings by sorting them based on certain attributes. The following sections of the manuscript describe each heuristic in detail.
5.2.1. The Most Profitable Hazard Reduction and Severity Reduction Heuristics (MPHR/MPSR)
The first heuristic for the RAP-1 mathematical model was named the most profitable hazard reduction (MPHR) heuristic. Figure 1 provides the main steps of the MPHR heuristic. Note that two abbreviations, “” and “”, stand for the terms “countermeasure” and “hazard reduction-to-cost ratio”, respectively. Other notations are adopted from Table 1. The data structures required throughout the algorithm execution are initialized in step 0 (i.e., the countermeasure-to-crossing assignment decision variable—; the highway–rail grade crossing priority list—; the hazard reduction-to-cost ratios—; and the remaining budget—). The values are estimated for the available highway–rail grade crossing and countermeasure pairs in step 1. The highest () and feasible countermeasure with the highest () are determined for each highway–rail grade crossing in step 2. The priority list is developed by sorting the highway–rail grade crossings based on the values following the descending order in step 3. Also, all the highway–rail grade crossings that are not eligible for any of the considered countermeasures are eliminated in step 3.
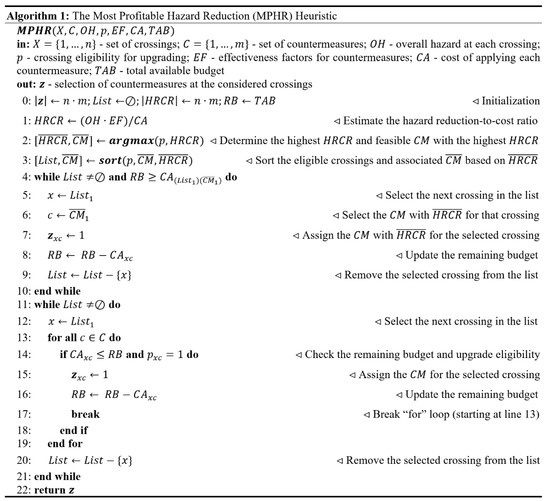
Figure 1.
The most profitable hazard reduction (MPHR) heuristic.
Then, the first loop of the MPHR heuristic (steps 4–10) is executed. Steps 5 and 6 are allocated to select the next highway–rail grade crossing in the priority list and the corresponding countermeasure, respectively. The considered highway–rail grade crossing is assigned the respective countermeasure in step 7. Step 8 is used to update the remaining budget. In step 9, the highway–rail grade crossing that was selected for upgrading is eliminated from the priority list. The first MPHR loop is terminated when either the priority list is empty or the remaining budget is not sufficient to implement the countermeasure with for the next highway–rail grade crossing belonging to the priority list. After that, the second loop of MPHR (steps 11–21) is executed. The next highway–rail grade crossing belonging to the priority list is selected in step 12. Then, MPHR searchers for the first countermeasure that a given highway–rail grade crossing is eligible for, considering the remaining budget (steps 13–19). In step 20, the highway–rail grade crossing that was selected is eliminated from the priority list. The second loop continues until the priority list is empty.
The MPHR heuristic developed for RAP-1 is similar to the MPSR heuristic developed for RAP-2. The only difference between the MPHR and MPSR algorithms is that MPSR relies on the hazard severity reduction-to-cost ratios (denoted as “”) rather than the hazard reduction-to-cost ratios throughout resource allocation. The hazard severity reduction-to-cost ratio is estimated by MPSR in step 1 for each crossing–countermeasure pair as follows: .
5.2.2. The Most Effective Hazard Reduction and Severity Reduction Heuristics (MEHR/MESR)
The second heuristic for the RAP-1 mathematical model was named the most effective hazard reduction (MEHR) heuristic. Figure 2 provides the main steps of the MEHR heuristic. The notations used for description of steps in Algorithm 2 are adopted from Table 1. The data structures, required throughout the algorithm execution, are initialized in step 0 (i.e., the countermeasure-to-crossing assignment decision variable—; the highway–rail grade crossing priority list—; the hazard reduction-to-cost ratios—; and the remaining budget—). The effectiveness factor for the most effective and feasible countermeasure is identified for each highway–rail grade crossing in step 1. The value is estimated for each highway–rail grade crossing and corresponding most effective countermeasure in step 2. The highest () and feasible countermeasure with the highest () are determined for each highway–rail grade crossing in step 3. The priority list is developed by sorting the highway–rail grade crossings based on the values following the descending order in step 4. Also, all the highway–rail grade crossings that are not eligible for any of the considered countermeasures are eliminated in step 4.
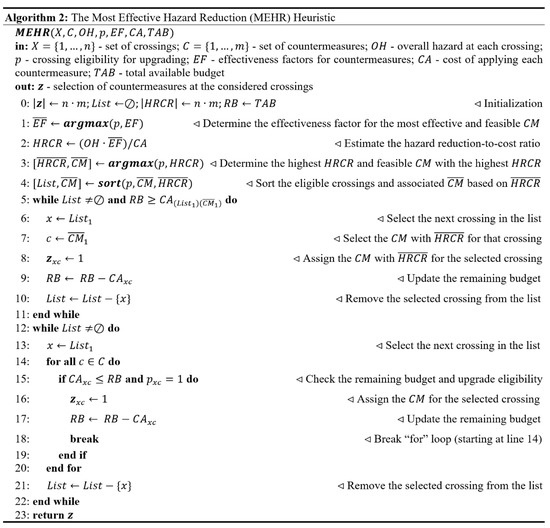
Figure 2.
The most effective hazard reduction (MEHR) heuristic.
Then, the first loop of MEHR (steps 5–11) is executed. Steps 6 and 7 are allocated to select the next highway–rail grade crossing in the priority list and the corresponding countermeasure, respectively. The considered highway–rail grade crossing is assigned the respective countermeasure in step 8. Step 9 is used to update the remaining budget. In step 10, the highway–rail grade crossing that was selected for upgrading is eliminated from the priority list. The first MEHR loop is terminated when either the priority list is empty or the remaining budget is not sufficient to implement the countermeasure with for the next highway–rail grade crossing belonging to the priority list. After that, the second loop of MEHR (steps 12–22) is executed. The next highway–rail grade crossing belonging to the priority list is selected in step 13. Then, MEHR searchers for the first countermeasure that a given highway–rail grade crossing is eligible for, considering the remaining budget (steps 14-20). In step 21, the highway–rail grade crossing that was selected is eliminated from the priority list. The second loop continues until the priority list is empty.
The MEHR heuristic developed for RAP-1 is similar to the MESR heuristic developed for RAP-2. The only difference between the MEHR and MESR algorithms is that MESR relies on the hazard severity reduction-to-cost ratios (denoted as “”) rather than the hazard reduction-to-cost ratios throughout resource allocation. The hazard severity reduction-to-cost ratio is estimated by MESR in step 2 for each crossing–countermeasure pair as follows: .
5.2.3. The Profitable Hazard Reduction and Severity Reduction Heuristics (PHR/PSR)
The third heuristic for the RAP-1 mathematical model was named the profitable hazard reduction (PHR) heuristic. Figure 3 provides the main steps of the PHR heuristic. The notations used for description of steps in Algorithm 3 are adopted from Table 1. The data structures required throughout the algorithm execution are initialized in step 0 (i.e., the countermeasure-to-crossing assignment decision variable—; the highway–rail grade crossing priority list—; the hazard reduction-to-cost ratios—; and the remaining budget—). The values are estimated in the first loop of Algorithm 3 (steps 1-6) to establish the priority list, which includes all the highway–rail grade crossing–countermeasure pairs (unlike the MPHR heuristic, which creates the priority list based on the highway–rail grade crossings only). The generated priority list is sorted based on the values following the descending order in step 7. Additionally, all the highway–rail grade crossings that are not eligible for any of the considered countermeasures are eliminated in step 7.
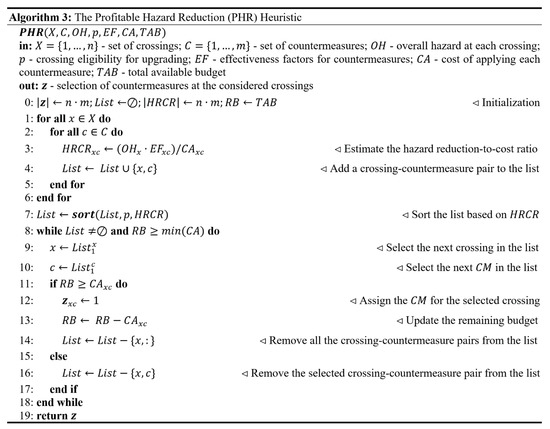
Figure 3.
The profitable hazard reduction (PHR) heuristic.
Then, the second loop of PHR (steps 8–18) is executed. Steps 9 and 10 are allocated to select the next highway–rail grade crossing in the priority list and the corresponding countermeasure, respectively. In step 11, the budget available for assignment of a given countermeasure to the considered highway–rail grade crossing is checked. If the remaining budget is sufficient, the considered highway–rail grade crossing is assigned the respective countermeasure in step 12. Step 13 is used to update the remaining budget. In step 14, all the crossing–countermeasure pairs associated with the highway–rail grade crossing that was selected for upgrading are eliminated from the priority list. If the remaining budget for assignment of a given countermeasure to the considered highway–rail grade crossing (checked in step 11) is insufficient, the PHR heuristic removes the selected crossing–countermeasure pair from the priority list in step 16. However, PHR will be able to investigate the other countermeasures that have lower hazard reduction-to-cost ratios and lower installation costs due to the fact that the other crossing–countermeasure pairs associated with that highway–rail grade crossing may still be present in the priority list. The loop continues until the priority list is empty or the remaining budget is not sufficient to implement any of the available countermeasures.
The PHR heuristic developed for RAP-1 is similar to the PSR heuristic developed for RAP-2. The only difference between the PHR and PSR algorithms consists of the fact that PSR relies on the hazard severity reduction-to-cost ratios (denoted as “”) rather than the hazard reduction-to-cost ratios throughout resource allocation. The hazard severity reduction-to-cost ratio is estimated by PSR in step 3 for each crossing–countermeasure pair as follows: .
5.2.4. The Effective Hazard Reduction and Severity Reduction Heuristics (EHR/ESR)
The fourth heuristic for the RAP-1 mathematical model was named the effective hazard reduction (EHR) heuristic. Figure 4 provides the main steps of the EHR heuristic. The notations used for description of steps in Algorithm 4 are adopted from Table 1. The additional abbreviation “” stands for the term “hazard reduction”. The data structures required throughout the algorithm execution are initialized in step 0 (i.e., the countermeasure-to-crossing assignment decision variable—; the highway–rail grade crossing priority list—; the hazard reduction values—; and the remaining budget—). The values are estimated in the first loop of Algorithm 4 (steps 1–6) to establish the priority list, which includes all the highway–rail grade crossing countermeasure pairs (unlike the MEHR heuristic, which creates the priority list based on the highway–rail grade crossings only). The generated priority list is sorted based on the values following the descending order in step 7. Also, all the highway–rail grade crossings that are not eligible for any of the considered countermeasures are eliminated in step 7.
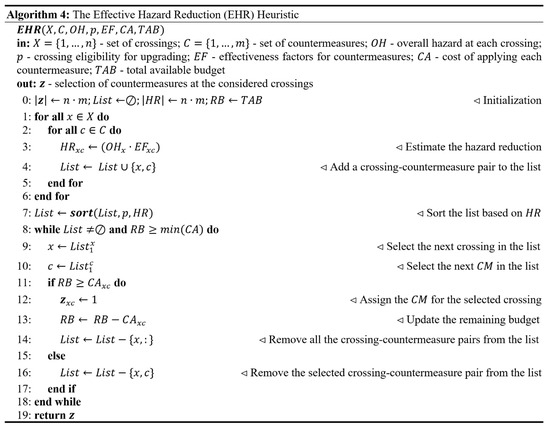
Figure 4.
The effective hazard reduction (EHR) heuristic.
Then, the second loop of EHR (steps 8–18) is executed. Steps 9 and 10 are allocated to select the next highway–rail grade crossing in the priority list and the corresponding countermeasure, respectively. In step 11, the budget available for assignment of a given countermeasure to the considered highway–rail grade crossing is checked. If the remaining budget is sufficient, the considered highway–rail grade crossing is assigned the respective countermeasure in step 12. Step 13 is used to update the remaining budget. In step 14, all the crossing–countermeasure pairs associated with the highway–rail grade crossing that was selected for upgrading are eliminated from the priority list. If the remaining budget for assignment of a given countermeasure to the considered highway–rail grade crossing (checked in step 11) is insufficient, the EHR heuristic removes the selected crossing–countermeasure pair from the priority list in step 16. However, EHR will be able to investigate the other countermeasures that have lower hazard reduction values and lower installation costs due to the fact that the other crossing–countermeasure pairs associated with that highway–rail grade crossing may be still present in the priority list. The loop continues until the priority list is empty or the remaining budget is not sufficient to implement any of the available untermeasures.
The EHR heuristic developed for RAP-1 is similar to the ESR heuristic developed for RAP-2. The only difference between the EHR and ESR algorithms consists in the fact that ESR relies on the hazard severity reduction values (denoted as “”) rather than the hazard reduction values throughout resource allocation. The hazard severity reduction value is estimated by ESR in step 3 for each crossing–countermeasure pair as follows: .
6. Case Study
This section of the manuscript presents a case study that was used to evaluate the effectiveness of the developed optimization models and solution approaches for the existing highway–rail grade crossings in the State of Florida. Note that only public highway–rail grade crossings will be considered throughout the analysis.
6.1. Input Data
Both RAP-1 and RAP-2 optimization models require certain input data in order to perform resource allocation among the highway–rail grade crossings in the State of Florida. The input data related to the set of highway–rail grade crossings () were extracted from the publicly available crossing inventory database, which is maintained by the FRA [42]. The inventory database includes detailed information regarding basic crossing characteristics (e.g., average daily traffic volume, average daily train volume, protection type, train speed, crossing surface). The overall hazard at highway–rail grade crossings () for the RAP-1 mathematical model was calculated using the Florida priority index formula [22]:
where = the Florida priority index at highway–rail grade crossing (no units); = average daily traffic volume at highway–rail grade crossing (vehicles per day); = average daily train volume at highway–rail grade crossing (trains per day); = train speed at highway–rail grade crossing (mph); = protection factor at highway–rail grade crossing (PF = 1.00 for passive; PF = 0.70 for flashing lights; PF = 0.10 for gates); = accident history parameter at highway–rail grade crossing (accidents), representing the total number of accidents in the last 5 years or since the year of last improvement (if there was an upgrade).
Note that many factors may influence the overall hazard of a given highway–rail grade crossing (i.e., average daily train volume, number of cars in a train, train type, train speed, number of tracks, average daily traffic volume, sight distance, number of traffic lanes, highway vehicular speed, approach gradient, crossing angle, location, existing protection, etc.). Dulebenets et al. [22] evaluated a wide range of different accident and hazard prediction models for the highway–rail grade crossings in the State of Florida, including the Coleman–Stewart model, NCHRP Report 50 accident prediction formula, Peabody–Dimmick formula, U.S. DOT accident prediction formula, New Hampshire formula, California hazard rating formula, Connecticut hazard rating formula, Illinois hazard index formula, Michigan hazard index formula, Texas priority index formula, and the Florida priority index formula. The considered accident and hazard prediction models directly accounted for many of the aforementioned factors that influence the overall hazard of highway–rail grade crossings. The actual 2007–2016 accident data provided by the FRA were used to estimate the predicted number of accidents and the predicted overall hazard by applying the candidate models, while the actual 2017 accident data were used to validate the candidate models. It was found that over-represented accident and hazard prediction models (i.e., the ones that consider many factors at the same time) have low accident and hazard prediction accuracy for the highway–rail grade crossings in the State of Florida. On the other hand, the Florida priority index formula demonstrated the best performance; therefore, it was used throughout this study.
The overall hazard of a given highway–rail grade crossing was set equal to the Florida priority index (i.e., ). The FRA highway–rail grade crossing accident database [13] was used for estimation of the accident history parameter (). Both RAP-1 and RAP-2 mathematical models relied on a set of countermeasures, denoted as , to improve the level of safety at the highway–rail grade crossings. Each countermeasure has a specific effectiveness factor, which represents the percentage reduction of a potential hazard at a given highway–rail grade crossing [39,43]. However, not all the countermeasures can be implemented at a given highway–rail grade crossing, considering its technical characteristics. In this study, a total of 11 countermeasures were adopted for the RAP-1 and RAP-2 mathematical models from the GradeDec.NET reference manual [39]. The basic information regarding the countermeasures was retrieved from the GradeDec.NET reference manual (see Table 2), including the (1) effectiveness factors () and (2) installation costs (). Note that the RAP-1 and RAP-2 mathematical models can be applied for other types of countermeasures as well (i.e., not just the ones that are suggested by the GradeDec.NET reference manual). In order to introduce new countermeasures in the developed mathematical models, the user will need to add new elements to the set of countermeasures () and specify the effectiveness factor (), as well as the installation cost (), for each new countermeasure.
Table 2.
Basic information for the considered countermeasures.
In order to estimate the overall hazard severity at each highway–rail grade crossing for the RAP-2 mathematical model, the overall hazard estimated by the Florida priority index should be divided into different severity categories. In this study, the hazard severity was categorized based on the GradeDec.NET reference manual as follows [39]: (1) fatal accidents—accidents with at least one fatality; (2) injury accidents—accidents with at least one injury, but no fatality; and (3) property damage only accidents. The severity weights attributed to different severity categories in the RAP-2 mathematical model were adopted based on the project conducted by the Iowa DOT [18]. Specifically, the base values for the weights of fatality hazard (), injury hazard (), and property damage hazard () were set to , , and , respectively.
6.2. Evaluation of the Solution Algorithms
All the solution algorithms developed for the RAP-1 and RAP-2 mathematical models were evaluated for all the public highway–rail grade crossings in the State of Florida. There were a total of 6089 public highway–rail grade crossings in the State of Florida based on the FRA crossing inventory database as of November 2018. A total of 121 scenarios were developed to evaluate the performance of the exact optimization algorithms and the heuristic algorithms. The scenarios were developed by varying the number of highway–rail grade crossings and the number of available countermeasures. The following values were considered for the number of highway–rail grade crossings: . The number of countermeasures was altered from 1 to 11 by an increment of 1. A total of 12 problem instances were developed by changing the values for the total available budget as follows: . Note that the adopted values for the total available budget are in line with the ones reported by the FDOT [14].
All the developed heuristic algorithms (see Section 5.2 of the manuscript) were encoded in the MATLAB environment. Moreover, the GAMS environment was used to encode the RAP-1 and RAP-2 mathematical models and to solve them to the global optimality with CPLEX. A CPU with Dell Intel(R) Core™ i7 Processor, 32 GB of RAM, and Windows 10 operating system was utilized to perform all the numerical experiments throughout this study. Note that the RAP-1 and RAP-2 mathematical models were solved using the function “intlinprog” available within the MATLAB optimization toolbox. However, the initial numerical experiments showed that “intlinprog” required a significant computational time as compared to the other solution methodologies adopted in this study. Furthermore, in some cases, “intlinprog” violated certain constraint sets of the RAP-1 and RAP-2 mathematical models. Therefore, the MATLAB “intlinprog” function had to be withdrawn from the analysis. Section 6.2.1 and Section 6.2.2 provide more details regarding evaluation of the candidate solution algorithms for the RAP-1 and RAP-2 mathematical models, respectively.
6.2.1. Solution Quality and Computational Efforts for RAP-1
The RAP-1 mathematical model was solved utilizing CPLEX, MPHR, MEHR, PHR, and EHR solution algorithms for all the developed scenarios of each problem instance considered. Note that the same objective function values were returned by each algorithm after each iteration, as they are deterministic in nature. However, in order to estimate the average computational time, a total of 5 replications were performed for each scenario and each problem instance. Table 3 and Figure 5 present the average over the developed scenarios overall hazard values returned by CPLEX, MPHR, MEHR, PHR, and EHR for each of the considered problem instances of the RAP-1 mathematical model. Furthermore, the average over the considered problem instances overall hazard values returned by CPLEX, MPHR, MEHR, PHR, and EHR for each of the developed scenarios of the RAP-1 mathematical model are presented in Figure 6.
Table 3.
The average overall hazard values returned by the candidate solution algorithms for the considered problem instances of the RAP-1 mathematical model.

Figure 5.
The average overall hazard values identified by the candidate solution algorithms for the considered problem instances of the RAP-1 mathematical model.

Figure 6.
The average overall hazard values returned by the candidate solution algorithms for the developed scenarios of the RAP-1 mathematical model.
Based on the information presented in Table 3, the averages of the overall hazard values for the developed scenarios were 1,755,123.6, 1,769,527.6, 2,061,902.0, 1,769,495.1, and 2,034,204.7 for CPLEX, MPHR, MEHR, PHR, and EHR, respectively. Hence, the MPHR and PHR heuristics returned the solutions that were close to the optimal solutions identified by CPLEX for all the developed scenarios of each problem instance of the RAP-1 mathematical model. However, PHR was found to be superior to MPHR for certain scenarios, as it consistently assigns countermeasures to the highway–rail grade crossings from the priority list using the hazard reduction-to-cost ratios (unlike MPHR, which assigns countermeasures with the highest hazard reduction-to-cost ratios to the highway–rail grade crossings from the priority list, while the remaining budget is allocated for implementation of eligible countermeasures at certain highway–rail grade crossings that were not selected for upgrading). The numerical experiments show that the MEHR and EHR heuristics were outperformed by CPLEX in terms of the overall hazard values on average by 17.48% and 15.90%, respectively, over the considered problem instances. Hence, prioritization of the highway–rail grade crossings based on the hazard reduction-to-cost ratios (implemented within MPHR and PHR) was found to be a more effective strategy throughout resource allocation as compared to prioritization of the highway–rail grade crossings based on either combination of the hazard reduction-to-cost ratios and the hazard reduction (implemented within MEHR) or based on the hazard reduction only (implemented within EHR).
Table 4 presents the average over the developed scenarios computational time recorded for CPLEX, MPHR, MEHR, PHR, and EHR for each of the considered problem instances of the RAP-1 mathematical model. The averages of computational time values for the developed scenarios were 81.19 sec, 29.89 sec, 10.25 sec, 16.78 sec, and 11.68 sec for CPLEX, MPHR, MEHR, PHR, and EHR, respectively. Although all the candidate solution algorithms were able to solve all the developed scenarios of each problem instance of the RAP-1 mathematical model within a reasonable computational time, it is expected that the CPLEX computational time may significantly increase for certain problem instances due to the computational complexity of the RAP-1 mathematical model. Therefore, based on the results from the conducted analysis, the PHR heuristic algorithm is recommended for resource allocation among the highway–rail grade crossings in the State of Florida, aiming to minimize the overall crossing hazard.
Table 4.
The average computational time recorded for the candidate solution algorithms for the considered problem instances of the RAP-1 mathematical model.
6.2.2. Solution Quality and Computational Efforts for RAP-2
The RAP-2 mathematical model was solved utilizing CPLEX, MPSR, MESR, PSR, and ESR solution algorithms for all the developed scenarios of each problem instance considered. Note that the same objective function values were returned by each algorithm after each iteration, as they are deterministic in nature. However, in order to estimate the average computational time, a total of 5 replications were performed for each scenario and each problem instance. Table 5 and Figure 7 present the average over the developed scenarios overall hazard severity values returned by CPLEX, MPSR, MESR, PSR, and ESR for each of the considered problem instances of the RAP-2 mathematical model. Furthermore, the average over the considered problem instances overall hazard severity values returned by CPLEX, MPSR, MESR, PSR, and ESR for each of the developed scenarios of the RAP-2 mathematical model are presented in Figure 8.
Table 5.
The average overall hazard severity values returned by the candidate solution algorithms for the considered problem instances of the RAP-2 mathematical model.

Figure 7.
The average overall hazard severity values identified by the candidate solution algorithms for the considered problem instances of the RAP-2 mathematical model.
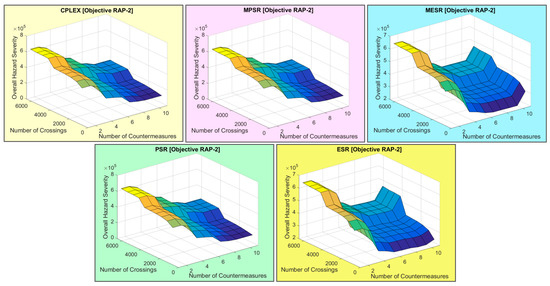
Figure 8.
The average overall hazard severity values returned by the candidate solution algorithms for the developed scenarios of the RAP-2 mathematical model.
Based on the information presented in Table 5, the average overall hazard severity values for the developed scenarios were 338,700.3, 341,696.5, 401,785.0, 341,687.4, and 398,079.7 for CPLEX, MPSR, MESR, PSR, and ESR, respectively. Hence, the MPSR and PSR heuristics returned solutions that were close to the optimal solutions identified by CPLEX for all of the developed scenarios of each problem instance of the RAP-2 mathematical model. However, PSR was found to be superior to MPSR for certain scenarios, as it consistently assigns countermeasures to the highway–rail grade crossings from the priority list using the hazard severity reduction-to-cost ratios (unlike MPSR, which assigns countermeasures with the highest hazard severity reduction-to-cost ratios to the highway–rail grade crossings from the priority list, while the remaining budget is allocated for implementation of eligible countermeasures at certain highway–rail grade crossings that were not selected for upgrading). The numerical experiments show that the MESR and ESR heuristics were outperformed by CPLEX in terms of the overall hazard severity values on average by 18.63% and 17.53%, respectively, over the considered problem instances. Hence, prioritization of the highway–rail grade crossings based on the hazard severity reduction-to-cost ratios (implemented within MPSR and PSR) was found to be a more effective strategy throughout resource allocation as compared to prioritization of the highway–rail grade crossings based on either combination of the hazard severity reduction-to-cost ratios and the hazard severity reduction (implemented within MESR) or based on the hazard severity reduction only (implemented within ESR).
Table 6 presents the average over the developed scenarios computational time recorded for CPLEX, MPSR, MESR, PSR, and ESR for each of the considered problem instances of the RAP-2 mathematical model. The average computational time values for the developed scenarios were 79.64 sec, 14.52 sec, 13.94 sec, 15.01 sec, and 15.24 sec for CPLEX, MPSR, MESR, PSR, and ESR, respectively. Although all the candidate solution algorithms were able to solve all the developed scenarios of each problem instance of the RAP-2 mathematical model within a reasonable computational time, it is expected that the CPLEX computational time may significantly increase for certain problem instances due to the computational complexity of the RAP-2 mathematical model. Therefore, based on the results from the conducted analysis, the PSR heuristic algorithm is recommended for resource allocation among the highway–rail grade crossings in the State of Florida, aiming to minimize the overall crossing hazard severity.
Table 6.
The average computational times recorded for the candidate solution algorithms for the considered problem instances of the RAP-2 mathematical model.
6.3. Managerial Insights
This section of the manuscript provides the results of the sensitivity analyses, which were conducted to reveal how the developed optimization models and solution methodologies can assist the relevant stakeholders, including the smart city authorities, with important managerial insights. In particular, the sensitivity of the resource allocation decisions to the total available budget and the number of available countermeasures will be further investigated.
6.3.1. Sensitivity Analysis for the Total Available Budget
A sensitivity analysis was conducted to determine how the total available budget may impact the resource allocation decisions among the highway–rail grade crossings in the State of Florida. A total of 12 budget availability scenarios were developed by altering the total available budget from $7.5 million to $13.0 million, with increments of $500,000. The impact of the total available budget on the number of upgraded highway–rail grade crossings by RAP-1 and RAP-2 is illustrated in Figure 9. Note that PHR and PSR were used as solution approaches for RAP-1 and RAP-2, respectively. As expected, the total number of highway–rail grade crossings upgraded by RAP-1 and RAP-2 increased after increasing the total available budget. Specifically, a total of 1198 and 1723 highway–rail grade crossings were selected for upgrading by RAP-1 for budget availability scenarios “1” and “12”, respectively. On the other hand, a total of 1212 and 1705 highway–rail grade crossings were selected for upgrading by RAP-2 for budget availability scenarios “1” and “12”, respectively. Therefore, the total available budget may substantially influence the resource allocation decisions and directly affect the number of upgraded highway–rail grade crossings.

Figure 9.
The impact of the total available budget on the number of highway–rail grade crossings upgraded by RAP-1 and RAP-2.
Figure 10 illustrates the overall hazard before and after implementation of countermeasures at the highway–rail grade crossings that were suggested for upgrading by RAP-1 for all 12 developed budget availability scenarios. It can be noticed that neither the overall hazard before nor the overall hazard after implementation of countermeasures at the highway–rail grade crossings that were suggested for upgrading by RAP-1 substantially changed from increasing the total available budget. Such a finding can be explained by the fact that RAP-1 selected for upgrading the most hazardous highway–rail grade crossings, even with the total available budget of $7.5 million (i.e., scenario “1”). Increasing the total available budget allowed upgrading of additional highway–rail grade crossings, however their overall hazard was not as significant as the one recorded for the highway–rail grade crossings upgraded under budget availability scenario “1”. Nevertheless, implementation of the countermeasures that were suggested by RAP-1 significantly reduced the overall hazard at the highway–rail grade crossings. Specifically, the overall hazard was reduced by for budget availability scenario “1”. Furthermore, the overall hazard was reduced by for budget availability scenario “12”. Therefore, the developed RAP-1 mathematical model can serve as an efficient methodology for reducing the overall hazard at the highway–rail grade crossings under various budget availability scenarios.

Figure 10.
The impact of the total available budget on the overall hazard before and after implementing countermeasures at the highway–rail grade crossings upgraded by RAP-1.
Figure 11 illustrates the overall hazard before and after implementation of countermeasures at the highway–rail grade crossings that were suggested for upgrading by RAP-2 for all 12 developed budget availability scenarios. Similar to the resource allocation results that were observed for RAP-1, neither the overall hazard before nor the overall hazard after implementation of countermeasures at the highway–rail grade crossings that were suggested for upgrading by RAP-2 substantially changed by increasing the total available budget. Nevertheless, implementation of the countermeasures that were suggested by RAP-2 significantly reduced the overall hazard at the highway–rail grade crossings. Specifically, the overall hazard was reduced by for budget availability scenario “1”. Furthermore, the overall hazard was reduced by for budget availability scenario “12”. Therefore, the developed RAP-2 mathematical model can serve as an efficient methodology for reducing the overall hazard at the highway–rail grade crossings under various budget availability scenarios.
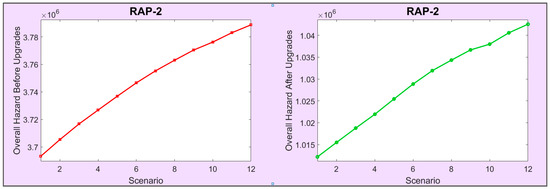
Figure 11.
The impact of the total available budget on the overall hazard before and after implementing countermeasures at the highway–rail grade crossings upgraded by RAP-2.
Note that similar percentages were observed in terms of the overall hazard reduction at the highway–rail grade crossings that were suggested for upgrading for both RAP-1 and RAP-2. However, RAP-1 suggested a total of 1198 and 1723 highway–rail grade crossings to be upgraded for budget availability scenarios “1” and “12”, respectively, while RAP-2 suggested a total of 1212 and 1705 highway–rail grade crossings to be upgraded for budget availability scenarios “1” and “12”. Such a variation can be explained by differences in the resource allocation objectives (i.e., RAP-1 aims to minimize the overall crossing hazard, while RAP-2 aims to minimize the overall crossing hazard severity).
6.3.2. Sensitivity Analysis for the Number of Available Countermeasures
A sensitivity analysis was conducted to determine how the number of available countermeasures may impact the resource allocation decisions among the highway–rail grade crossings in the State of Florida. A total of 11 countermeasure availability scenarios were developed by altering the number of available countermeasures from 1 to 11 by an increment of 1 countermeasure. The impact of the number of available countermeasures on the number of highway–rail grade crossings upgraded by RAP-1 and RAP-2 is illustrated in Figure 12. Note that PHR and PSR were used as solution approaches for RAP-1 and RAP-2, respectively. As expected, the total number of highway–rail grade crossings upgraded by RAP-1 and RAP-2 increased after increasing the number of available countermeasures. Specifically, a total of 100 and 1198 highway–rail grade crossings were selected for upgrading by RAP-1 for countermeasure availability scenarios “1” and “11”, respectively. On the other hand, a total of 100 and 1212 highway–rail grade crossings were selected for upgrading by RAP-2 for countermeasure availability scenarios “1” and “11”, respectively. Such a significant increase in the number of upgraded highway–rail grade crossings can be explained by the introduction of low-cost countermeasures (i.e., countermeasures “7”, “8”, and “9”—see Table 2). Therefore, the number of available countermeasures may substantially influence the resource allocation decisions and directly affect the number of upgraded highway–rail grade crossings.

Figure 12.
The impact of the number of countermeasures on the number of highway–rail grade crossings upgraded by RAP-1 and RAP-2.
Figure 13 illustrates the overall hazard before and after implementation of countermeasures at the highway–rail grade crossings that were suggested for upgrading by RAP-1 for all 11 developed countermeasure availability scenarios. It can be noticed that the overall hazard before and after implementation of countermeasures at the highway–rail grade crossings that were suggested for upgrading by RAP-1 substantially increased after increasing the number of available countermeasures. This finding can be explained by the fact that the number of upgraded highway–rail grade crossings significantly increased after introducing additional countermeasures. Moreover, implementation of the countermeasures that were suggested by RAP-1 significantly reduced the overall hazard at the highway–rail grade crossings. Specifically, the overall hazard was reduced by for countermeasure availability scenario “1”. Furthermore, the overall hazard was reduced by for countermeasure availability scenario “11”. Therefore, the developed RAP-1 mathematical model can serve as an efficient methodology for reducing the overall hazard at the highway–rail grade crossings under various countermeasure availability scenarios.

Figure 13.
The impact of the number of countermeasures on the overall hazard before and after implementing countermeasures at the highway–rail grade crossings upgraded by RAP-1.
Figure 14 illustrates the overall hazard before and after implementation of countermeasures at the highway–rail grade crossings that were suggested for upgrading by RAP-2 for all 11 developed countermeasure availability scenarios. Similar to the resource allocation results that were observed for RAP-1, the overall hazard before and after implementation of countermeasures at the highway–rail grade crossings that were suggested for upgrading by RAP-2 substantially increased after increasing the number of available countermeasures. Moreover, implementation of the countermeasures that were suggested by RAP-2 significantly reduced the overall hazard at the highway–rail grade crossings. Specifically, the overall hazard was reduced by for countermeasure availability scenario “1”. Furthermore, the overall hazard was reduced by for countermeasure availability scenario “11”. Therefore, the developed RAP-2 mathematical model can serve as an efficient methodology for reducing the overall hazard at the highway–rail grade crossings under various countermeasure availability scenarios.

Figure 14.
The impact of the number of countermeasures on the overall hazard before and after implementing countermeasures at the highway–rail grade crossings upgraded by RAP-2.
Note that similar percentages were observed in terms of the overall hazard reduction at the highway–rail grade crossings that were suggested for upgrading for both RAP-1 and RAP-2. However, RAP-1 suggested a total of 100 and 1198 highway–rail grade crossings to be upgraded for countermeasure availability scenarios “1” and “11”, respectively, while RAP-2 suggested a total of 100 and 1212 highway–rail grade crossings to be upgraded for countermeasure availability scenarios “1” and “11”. Such a variation can be explained by differences in the resource allocation objectives (i.e., RAP-1 aims to minimize the overall crossing hazard, while RAP-2 aims to minimize the overall crossing hazard severity).
7. Conclusions and Future Research Directions
Smart cities directly rely on a variety of elements, including water, gas, electricity, buildings, services, transportation networks, and others. Lack of properly designed transportation networks may cause different economic and safety concerns. Considering a significant number of accidents at the highway–rail grade crossings across the United States, safety improvement projects have to be conducted on a regular basis. Given the limited budget available for highway–rail grade crossing safety improvement projects, effective resource allocation has been a challenging issue for the state Departments of Transportation (DOTs). This study presented two optimization models for resource allocation among highway–rail grade crossings. The objective function of the first optimization model aimed to minimize the overall hazard at the highway–rail grade crossings. On the other hand, the objective function of the second optimization model aimed to minimize the overall hazard severity at the highway–rail grade crossings. The developed optimization models were solved to the global optimality using CPLEX. Also, several heuristic algorithms were developed to solve each one of the optimization models. The heuristic algorithms constructed the priority list for the available highway–rail grade crossings based on certain attributes (i.e., hazard reduction-to-cost ratios, hazard severity reduction-to-cost ratios, hazard reduction, and hazard severity reduction).
A case study was performed for the public highway–rail grade crossings in the State of Florida, aiming to evaluate the performance of the developed solution methodologies. It was found that the developed heuristic algorithms were promising in terms of the solution quality and the computational time. Furthermore, prioritization of highway–rail grade crossings for safety improvement projects based on the hazard and hazard severity reduction-to-cost ratios was found to be a more promising strategy as compared to prioritization based on the hazard and hazard severity reduction values. The conducted case study showed that allocation of additional funds for safety improvement projects and introduction of additional countermeasures increased the number of upgraded highway–rail grade crossings and reduced the overall hazard at the highway–rail grade crossings. The proposed methodology can be further used by the relevant stakeholders, including the smart city authorities, for effective resource allocation among the highway–rail grade crossings, not only in Florida but across the nation.
The future research extensions include: (1) conducting additional sensitivity analyses for the model parameters (e.g., sensitivity of the models for different groups of highway–rail grade crossings—private, public, or both private and public); (2) applying the proposed methodology to the highway–rail grade crossings located in other states; (3) developing metaheuristic algorithms to solve the optimization models (e.g., evolutionary algorithms, ant colony optimization, particle swarm optimization, artificial bee colony, tabu search, simulated annealing, variable neighborhood search, and others [44,45,46,47,48]); (4) considering the application of multiple countermeasures at a given highway–rail grade crossing through resource allocation; and (5) performing resource allocation for both private and public highway–rail grade crossings in the State of Florida.
Author Contributions
The authors confirm contribution to the paper as follows: study conception and design, M.K., M.A.D., J.P., O.F.A.; data collection, M.K., J.P., O.F.A.; analysis and interpretation of results, M.K., M.A.D.; draft manuscript preparation, M.K., M.A.D., J.P., O.F.A., R.M., J.S., E.E.O. All authors reviewed the results and approved the final version of the manuscript.
Funding
This research was funded by the Florida Department of Transportation, grant number BDV30-977-26.
Acknowledgments
This study was supported by the Florida Department of Transportation. The opinions, findings, and conclusions expressed in this publication are those of the authors and not necessarily those of the Florida Department of Transportation or the U.S. Department of Transportation. The authors would like to thank Mr. Rickey Fitzgerald, Freight and Multimodal Operations Office Manager, for his involvement and valuable feedback throughout this study.
Conflicts of Interest
The authors declare no conflict of interest. The funders provided their valuable feedback throughout this study.
References
- Jin, S.; Bai, L.; Kim, J.; Jeong, S.; Kim, K. Analysis of GHG emission reduction in South Korea using a CO2 transportation network optimization model. Energies 2017, 10, 1027. [Google Scholar] [CrossRef]
- Yang, X.; Li, Y.; Cai, Y.; Cao, Y.; Lee, K.; Jia, Z. Impact of Road-Block on Peak-Load of Coupled Traffic and Energy Transportation Networks. Energies 2018, 11, 1776. [Google Scholar] [CrossRef]
- Amini, M.H.; Karabasoglu, O. Optimal operation of interdependent power systems and electrified transportation networks. Energies 2018, 11, 196. [Google Scholar] [CrossRef]
- Abioye, O.F.; Dulebenets, M.A.; Pasha, J.; Kavoosi, M. A Vessel Schedule Recovery Problem at the Liner Shipping Route with Emission Control Areas. Energies 2019, 12, 2380. [Google Scholar] [CrossRef]
- Dulebenets, M.A. A Diploid Evolutionary Algorithm for sustainable truck scheduling at a cross-docking facility. Sustainability 2018, 10, 1333. [Google Scholar] [CrossRef]
- Theophilus, O.; Dulebenets, M.A.; Pasha, J.; Abioye, O.F.; Kavoosi, M. Truck scheduling at cross-docking terminals: a follow-up state-of-the-art review. Sustainability 2019, 11, 5245. [Google Scholar] [CrossRef]
- Dulebenets, M.A. A Delayed Start Parallel Evolutionary Algorithm for just-in-time truck scheduling at a cross-docking facility. Int. J. Prod. Econ. 2019, 212, 236–258. [Google Scholar] [CrossRef]
- Sinha, R.; Bak-Jensen, B.; Radhakrishna Pillai, J.; Zareipour, H. Flexibility from Electric Boiler and Thermal Storage for Multi Energy System Interaction. Energies 2020, 13, 98. [Google Scholar] [CrossRef]
- Inga, E.; Hincapié, R.; Céspedes, S. Capacitated Multicommodity Flow Problem for Heterogeneous Smart Electricity Metering Communications Using Column Generation. Energies 2020, 13, 97. [Google Scholar] [CrossRef]
- Ditts, J. The Nation’s First Railroad. In The Great Road: The Building of the Baltimore and Ohio; Stanford University Press: Palo Alto, CA, USA, 1996; pp. 1828–1853. [Google Scholar]
- Mok, S.C.; Savage, I. Why Has Safety Improved at Rail-Highway Grade Crossings? Rsk. Analys. An. Int. J. 2005, 25, 867–881. [Google Scholar] [CrossRef]
- Chadwick, S.; Zhou, N.; Saat, M.R. Highway-Rail Grade Crossing Safety Challenges for Shared Operations of High-Speed Passenger and Heavy Freight Rail in the U.S. Saf. Sci. 2014, 68, 128–137. [Google Scholar] [CrossRef]
- FRA. Accident/Incident Data. 2018. Available online: https://safetydata.fra.dot.gov/OfficeofSafety/publicsite/on_the_fly_download.aspx (accessed on 6 July 2019).
- FDOT. Florida’s Highway-Rail Grade Crossing Safety Action Plan. Florida, 2011. Available online: http://www.fdot.gov/rail/FCSAP0811.pdf (accessed on 24 September 2018).
- Faghri, A.; Demetsky, M. Evaluation of Methods for Predicting Rail-Highway Highway-Rail Grade Crossing Hazards; A Technical Report Prepared for the Virginia Department of Transportation; Virginia Department of Transportation: Charlottesville, VA, USA, 1986.
- Dulebenets, M.A. Highway-Rail Grade Crossing Identification and Prioritizing Model Development. Master′s Thesis, University of Memphis, Memphis, TN, USA, 2012. [Google Scholar]
- Weissmann, A.J.; Weissmann, J.; Kunisetty, J.L.; Warner, J.; Park, E.; Sunkari, S.; Protopapas, A.; Venglar, S. Integrated Prioritization Method for Active and Passive Highway-Rail Crossings; A Technical Report Prepared for the Texas Department of Transportation; Texas Department of Transportation: Austin, TX, USA, 2013.
- Iowa DOT. Use of a Benefit-Cost Ratio to Prioritize Projects for Funding. 2006. Available online: https://www.iowadot.gov/iowarail/assistance/130/130SelectionProcess_final.pdf (accessed on 12 June 2019).
- Hans, Z.; Albrecht, C.; Johnson, P.; Nlenanya, I. Development of Railroad Highway Grade Highway-Rail Grade Crossing Consolidation Rating Formula; A Technical Report Prepared for the Iowa Department of Transportation; Iowa Department of Transportation: Ames, IA, USA, 2015. Available online: https://lib.dr.iastate.edu/cgi/viewcontent.cgi?referer=&httpsredir=1&article=1061&context=intrans_techtransfer (accessed on 15 June 2019).
- Sperry, B.; Naik, B.; Warner, J. Evaluation of Grade Crossing Hazard Ranking Models. Ohio Transportation Engineering Conference. 2017. Available online: http://www.dot.state.oh.us/engineering/OTEC/2017Presentations/75/Sperry_75.pdf (accessed on 30 September 2018).
- Elzohairy, Y.; Benekohal, R. Evaluation of Expected Accident Frequency Formulas for Rail-Highway Highway-Rail Grade Crossings; A Technical Report Prepared for the Illinois Department of Transportation; Illinois Department of Transportation: Springfield, IL, USA, 2000. Available online: http://www.idot.illinois.gov/Assets/uploads/files/Transportation-System/Research/Illinois-Transportation-Research-Center/2000.09.01%20-%20Evaluation%20of%20Expected%20Accident%20Frequency%20Formulas%20for%20Rail-Highway%20Crossings%20-%20VC-HR1%20FY98.pdf (accessed on 24 September 2018).
- Dulebenets, M.A.; Moses, R.; Sobanjo, J.; Ozguven, E.E.; Abioye, O.F.; Kavoosi, M.; Pasha, J. Development of the Optimization Model for Improving Safety at Rail Crossings in Florida; A Technical Report Prepared for the Florida Department of Transportation; Florida Department of Transportation: Tallahassee, FL, USA, 2020.
- Hu, S.R.; Li, C.S.; Lee, C.K. Investigation of key factors for accident severity at railroad grade crossings by using a logit model. Saf. Sci. 2010, 48, 186–194. [Google Scholar] [CrossRef] [PubMed]
- Evans, A.W. Fatal accidents at railway level crossings in Great Britain 1946–2009. Accid. Anal. Prev. 2011, 43, 1837–1845. [Google Scholar] [CrossRef]
- Borsos, A.; Gabor, M.; Koren, C. Safety ranking of railway crossings in Hungary. Trans. Res. Proc. 2016, 14, 2111–2120. [Google Scholar] [CrossRef][Green Version]
- Laapotti, S. Comparison of fatal motor vehicle accidents at passive and active railway level crossings in Finland. IATSS Res. 2016, 40, 1–6. [Google Scholar] [CrossRef]
- Larue, G.S.; Wullems, C. Human factors evaluation of a novel Australian approach for activating railway level crossings. Proc. Manuf. 2015, 3, 3293–3300. [Google Scholar] [CrossRef]
- Larue, G.S.; Naweed, A.; Rodwell, D. The road user, the pedestrian, and me: Investigating the interactions, errors and escalating risks of users of fully protected level crossings. Saf. Sci. 2018, 110, 80–88. [Google Scholar] [CrossRef]
- Beanland, V.; Salmon, P.M.; Filtness, A.J.; Lenné, M.G.; Stanton, N.A. To stop or not to stop: Contrasting compliant and non-Compliant driver behaviour at rural rail level crossings. Accid. Anal. Prev. 2017, 108, 209–219. [Google Scholar] [CrossRef]
- Beanland, V.; Grant, E.; Read, G.J.; Stevens, N.; Thomas, M.; Lenné, M.G.; Stanton, N.A.; Salmon, P.M. Challenging conventional rural rail level crossing design: Evaluating three new systems thinking-Based designs in a driving simulator. Saf. Sci. 2018, 110, 100–114. [Google Scholar] [CrossRef]
- Wigglesworth, E.C.; Uber, C.B. An evaluation of the railway level crossing boom barrier program in Victoria, Australia. J. Saf. Res. 1991, 22, 133–140. [Google Scholar] [CrossRef]
- Cairney, P.; Gunatillake, T.; Wigglesworth, E. Reducing Collisions at Passive Railway Level Crossings in Australia; Austroads: Sydney, Australia, 2002; No. AP-R208/02. [Google Scholar]
- Edquist, J.; Stephan, K.; Lenne, M. A Literature Review of Human Factors Safety Issues at Australian Level Crossings; Monash University Accident Research Centre: Melbourne, Australia, 2009. [Google Scholar]
- Wullems, C. Towards the adoption of low-Cost rail level crossing warning devices in regional areas of Australia: A review of current technologies and reliability issues. Saf. Sci. 2011, 49, 1059–1073. [Google Scholar] [CrossRef]
- Berg, V. Critique of Rail-Highway Grade Crossing Effectiveness Ratios and Resource Allocation Procedures. Trans. Res. Rec. 1986, 1069, 88–100. [Google Scholar]
- Forgionne, G.A. Selecting rail grade crossing investments with a decision support system. Info. Sci. 2002, 144, 75–90. [Google Scholar] [CrossRef]
- Konur, D.; Golias, M.M.; Darks, B. A mathematical modeling approach to resource allocation for railroad-Highway crossing safety upgrades. Accid. Anal. Prev. 2013, 51, 192–201. [Google Scholar] [CrossRef]
- Rezvani, A.Z.; Peach, M.; Thomas, A.; Cruz, R.; Kemmsies, W. Benefit-Cost methodology for highway-Railway grade crossing safety protocols as applied to transportation infrastructure project prioritization processes. Trans. Res. Proc. 2015, 8, 89–102. [Google Scholar] [CrossRef]
- U.S. DOT. GradeDec.NET Reference Manual. 2014. Available online: https://www.fra.dot.gov/Elib/Document/14852 (accessed on 8 June 2019).
- MathWorks. MATLAB. 2019. Available online: https://www.mathworks.com/ (accessed on 1 June 2019).
- GAMS. Cutting Edge Modeling. 2019. Available online: https://www.gams.com/ (accessed on 3 July 2019).
- FRA. FRA Data Dictionary for External Use Grade Crossing Inventory System (GCIS) v2.5.0.0; The U.S. Department of Transportation: Federal Railroad Administration. Office of Railroad Safety: Washington, DC, USA, 2016.
- U.S. DOT. Rail-Highway Grade Crossing Handbook, 2nd ed.; 2007. Available online: https://www.fra.dot.gov/Elib/Document/1464 (accessed on 6 May 2019).
- Kavoosi, M.; Dulebenets, M.A.; Abioye, O.F.; Pasha, J.; Wang, H.; Chi, H. An augmented self-adaptive parameter control in evolutionary computation: A case study for the berth scheduling problem. Adv. Eng. Inform. 2019, 42, 100972. [Google Scholar] [CrossRef]
- Dulebenets, M.A. Application of evolutionary computation for berth scheduling at marine container terminals: Parameter tuning versus parameter control. IEEE Trans. Intell. Trans. Syst. 2018, 19, 25–37. [Google Scholar] [CrossRef]
- Dulebenets, M.A. A novel Memetic Algorithm with a deterministic parameter control for efficient berth scheduling at marine container terminals. Mar. Bus. Rev. 2017, 2, 302–330. [Google Scholar] [CrossRef]
- Dulebenets, M.A.; Kavoosi, M.; Abioye, O.; Pasha, J. A Self-Adaptive Evolutionary Algorithm for the berth scheduling problem: towards efficient parameter control. Algorithms 2018, 11, 100. [Google Scholar] [CrossRef]
- Kavoosi, M.; Dulebenets, M.A.; Abioye, O.; Pasha, J.; Theophilus, O.; Wang, H.; Kampmann, R.; Mikijeljević, M. Berth scheduling at marine container terminals: A universal island-based metaheuristic approach. Mar. Bus. Rev. 2020, 5, 30–66. [Google Scholar] [CrossRef]
© 2020 by the authors. Licensee MDPI, Basel, Switzerland. This article is an open access article distributed under the terms and conditions of the Creative Commons Attribution (CC BY) license (http://creativecommons.org/licenses/by/4.0/).