Abstract
Many local governments have started using smartphone applications to more effectively inform and communicate with citizens. This trend is of interest, as cities can only be smart if they are responsive to their citizens. In this paper, the intention to use such a mobile application among adult residents (n = 420) of a mid-sized city in the southeastern United States was examined using hierarchical linear regression analysis. The regression model that was tested indicated significant predictors of the intention to use the app in order to report municipal problems, such as power outages, and to request services for one’s home or community, including: Performance expectancy (e.g., citizens’ beliefs that the app would be efficient, helpful, convenient), effort expectancy (citizens’ beliefs about difficulty of using the app), social influence, perceived cost (e.g., privacy loss, storage space, unwanted notifications), and prior use of city apps. Consistent with current research on technology adoption, performance expectancy had the strongest influence on app-use intentions. Additionally, citizens’ trust in their city government’s ability to effectively manage an app was a weak, positive predictor of app-use intentions; general trust in the city government did not predict app-use intentions. Implications for city governments and city app developers are discussed.
1. Introduction
Smart cities depend on services and information that are easily accessible to all citizens. Mobile applications, therefore, are considered to be important for the provision of wide access to information and increased opportunities for communication/information exchange. As such, governments of leading cities around the world have begun adopting city service mobile applications as a major component of their smart city initiatives [1]. Examples of such apps designed to foster public service delivery and operation are London’s “FixMyStreet” and Boston’s “Citizens Connect”. Through these apps, citizens can request services for themselves, such as reporting electrical problems, power outages, gas meter issues, and sewer problems. They can also report problems for their communities, such as malfunctioning street or traffic lights, potholes, graffiti, and road blockages. These smart-city service apps can serve as public participation and co-production platforms to connect citizens, communities, governments, and other stakeholders with urban infrastructure and municipal services. Through these mobile apps, governments can provide real-time public information while citizens can report public service problems and share their ideas with the city government, its functional departments and agencies, as well as with other users. Smart city applications such as these provide governments with the opportunity to engage citizens by acting as a tool for mass information dissemination, mass production, and collaboration. They expand the role of citizens from passive consumers of public services to co-producers who are active in jointly tackling social problems [2].
This co-production and collaborative governance process via information communication technology (ICT) is commonly referred to as electronic government, or e-government, in the urban management and e-government literature (e.g., [3,4,5]). Further, with the rapid growth of the utilization of mobile-phone-based ICT in the e-government process, mobile government or m-government—a technology-specific sub-category of e-government—has received much attention both in and outside academic circles (e.g., [6,7]). Among various m-government services and implementations (such as traffic information systems, disaster alerts, and crime reporting apps), city service apps have the potential to offer new opportunities for more direct, convenient, and low-cost connections between citizens and their government, thanks to high mobile phone penetration and ubiquitous Internet infrastructure [7,8,9]. In addition, the delivery of public services through mobile apps enables services that are demand-driven and citizen-oriented [10]. Altogether, it is hoped that these city management apps can facilitate collective governance over city issues across citizens and other stakeholders, thereby bringing a higher level of smartness to municipalities through the m-government process.
Although city service apps are offered in many U.S. cities and have been heralded to empower citizen co-production of public services in the smart city movement, city apps and related m-government functions have not been as quickly or widely adopted by citizens as predicted [8,11]. Accordingly, the present study aimed to expand current efforts to examine the acceptance and use of mobile-phone-based city service apps among residents, using common factors recently found to be associated with the adoption of m-government and city service apps. Factors influencing app adoption were first investigated with focus groups of residents [12]. Beliefs about city apps expressed by participants in those groups were used, along with the existing literature on technology and m-government adoption, to create items contributing to the main constructs in our model.
This research sits at the intersection of three literature bases. The first is literature on civic engagement and participation through citizen-initiated contacts with government. The second is the literature on e-governance and m-governance as coproduction. This provides a context for applying theory from the third literature base on technology adoption, which frames the empirical analysis.
1.1. Theory of Citizen-Initiated Contacts and m-Government Applications
The theory of citizen-initiated contacts explains why citizens contact their government. Thomas [13] suggests that citizen-initiated contact is related to needs for government services [14]. For example, homeowners in particular have a strong vested interest in contacting their local governments in order to receive services that help them protect their property and family [15]. Hirlinger [16] found that perceived need, perceived efficacy, socioeconomic status, race, age, and political ties were related to citizen-initiated contacts with government. In summary, the theory predicts that those who have a greater need for services will contact their government more often. However, a trade-off between traditional methods of contact (such as phone) and e-based methods has been acknowledged. Although e-based methods can be more expedient, phone-based contact is more likely to provide personal real-time contact with city officials, and citizens have generally reported feeling quite satisfied with those interactions [17]. Accordingly, examining perceived advantages and disadvantages of mobile app-based government contact at the individual level seems warranted.
Networked co-production emphasizes the relationships between government and citizens using governmental services [5]. City apps allow communication with dialogue and feedback between citizens and government representatives as well as co-production, in which the public sector and citizens make better use of each other’s assets and resources to achieve better outcomes and improved efficiency [18]. Public administration research on co-production through e-government and m-government is linked to perceptions of usefulness and ease of use [19,20,21].
Given that technology use is embedded in a context, and the context is an important aspect of understanding the technology acceptance and use [22], it is important to identify specific factors that influence the use of specific mobile apps. Accordingly, we attempt to integrate the e-government literature with that in ICT to propose and test a model of city management app acceptance.
1.2. Understanding Adoption of City Apps through Technology Acceptance Models
A number of theoretical models have been proposed to understand the determinants of technology acceptance and innovation adoption, including the technology acceptance model [23] and its derivatives, the unified theory of acceptance and use of technology (the UTAUT [24] and UTAUT2 [25]). In particular, extensions and adaptations of the TAM and the UTAUT models have been applied to predict and explain the adoption of e-government, m-government, and city apps in particular (for example, [11,26,27,28,29,30,31,32,33]). Across these studies (see also [27] for a review), several factors have been consistently examined and found to be predictive of adoption or intention to adopt smart city applications and/or m-government: Perceived usefulness of the technology (termed performance expectancy in more recent models, such as UTAUT [25]), perceived ease of use of the technology (termed effort expectancy in more recent models), costs (reconceptualized as price-value in more recent models), social influence (perceived expectations of others in one’s social environment), privacy concerns, and trust in the government and/or provider of the technology. We analyzed the influence of those factors that seemed most relevant to the adoption of city service apps in the United States. Through the analysis, we refined and extended the previous constructs and models by incorporating context-specific considerations. The following discussion provides our conceptual definitions of those constructs and their proposed influence on behavioral intention to use a city app.
The concept of perceived usefulness or performance expectancy (PE) refers to the degree to which prospective users expect that using a specific technology will provide personal benefits [25]; the greater the expectations, the more likely individuals will adopt the technology. PE incorporates five constructs from different technology adoption models, including the perceived usefulness of the technology, extrinsic motivation to use it, job-fit, relative advantage compared to older technologies, and outcome expectation (beliefs about positive or negative consequences of using the technology), and is found to be the most salient factor predicting technology adoption intention [24]. The variable of performance expectancy in the current study captures the traditional perceived benefits of using mobile apps, such that it includes citizens’ perceptions of speed, mobility, reachability, and convenience associated with use of the app [34,35,36].
Based on the literature on citizen-contacting behavior [15,16,37], we also incorporate into our conceptualization of performance expectancy the concept of the need for government services in order to reflect how citizens perceive that using city service apps fulfills their needs. Such considerations are suggested by the theory of citizen-initiated contacts and the findings from a focus group study previously conducted for this project [12]. In that study, citizens rated the ability to request services as particularly useful, and many considered that ability to be the primary reason to adopt the app. Additionally, most participants believed apps would help them accomplish relevant tasks better and receive faster service request responses compared to traditional methods of reporting problems or requesting services from their city government. Based on existing studies of technology adoption, we predicted that performance expectancy would have a strong and significant influence on citizens’ intentions to use the city app.
Hypothesis 1 (H1).
Performance expectancy will be positively associated with intention to use a city app to request services/report problems.
Effort expectancy (EE) is defined as the perceived ease of using the technology [23]. Previous studies found that users had greater intention to adopt a new technology when they perceived the effort to learn and understand the technology was low (e.g., [38]). Additionally, EE has been found to be a positive predictor of the adoption of various information communication technologies (e.g., [39,40]). For example, effort expectancy determined American college students’ intention to use course-management software [41] and predicted students’ adoption of e-government services in Kuwait [42].
Hypothesis 2 (H2).
Effort expectancy (measured as perceived ease-of-use) will be positively associated with intention to use a city app to request services/report problems.
Furthermore, the ultimate success of city apps depends on their effectiveness in attracting and engaging a large number of citizens to co-govern and help manage their cities [6,32]. Indeed, a major function of city service apps is to allow city residents to report public problems associated with their communities and neighborhoods. Social influence (SI) broadly refers to the process by which an individual changes an attitude or behavior because of the influence of other people. Relevant to technology acceptance, the construct of subjective social norms, defined as individuals’ beliefs about whether relevant others approve or expect them to engage in a specific behavior, has been incorporated in adoption models (see [43] for a meta review). Studies of consumers’ innovative behaviors have repeatedly demonstrated that mere knowledge that other people are using an innovation may be sufficient to motivate one’s own adoption (e.g., [44,45,46]). In addition, research in social psychology has found that perceptions of descriptive social norms (the extent to which we perceive others are practicing a given behavior) can directly influence behaviors [47,48], especially to the extent that we identify or feel affiliated with the given referent group [49]. Further, according to social identity theory, people tend to categorize themselves and others into social groups, such as age cohort, organization, and communities; a strong social identity toward a group increases an individual’s sense of belonging to that group [50]. Research indicates that as citizens’ social identity increases, so does public participation [51] and public service motivation [52].
The aforementioned research on social norms indicates that individuals develop perceptions of what others in their communities are doing by observing others’ behaviors and via interpersonal communication with others [49]. Based on this research, we suggest that citizens can develop perceptions of the extent to which neighbors or other community members use a city app via personal conversations with community members or via discussions about (or recommendations of) the app on social media, such as neighborhood Facebook pages. Identification with the community is a relevant indicator of the extent to which individuals feel an affiliation with their neighbors and fellow community members. So, individuals who perceive that others in the community are using the app and who also identify with those people should feel more social pressure to use the app. The literature on social norms also suggests that citizens who have a greater sense of belonging to their community might be more likely to adopt and use city apps to report community and neighborhood concerns and issues. This logic led us to conceptualize social influence as the perceived extent of app use among those within one’s community in conjunction with community identity, the extent to which one identifies with their community [53]. Based on previous research that has consistently found that social normative influence predicts a wide variety of behaviors, we tested the following hypothesis:
Hypothesis 3 (H3).
Social influence will be positively associated with intention to use the app.
Recent technology adoption models (such as the UTAUT2) acknowledge that consumers typically experience financial and other costs associated with using a technology. The price-value construct in such models has been defined as consumers’ perceived tradeoff between the monetary costs of technology and the expected or experienced benefits of using it [25]. However, because smartphone users can typically download and use m-government or city service apps without financial costs, it seems more reasonable to focus on less tangible aspects of the cost–benefit analysis for potential users. For example, potential users might perceive a “cost” associated with installing and using city service apps, which can take up valuable mobile storage space [12]. Additionally, recent investigations of technology and m-government adoption have consistently identified concerns about invasion of privacy and personal safety (e.g., [8,27,54,55]). Such “cost” concerns can influence citizens’ evaluation of the apps. Accordingly, we conceptualized cost associated with city app use somewhat broadly in order to reflect these less tangible costs and expected greater perceptions of cost to mitigate intention to use the smart city app.
Hypothesis 4 (H4).
Perceived cost will be negatively associated with intention to use the app.
Because city apps are developed and run by city governments, trust in government should play an important role in citizens’ expectations of the apps. Indeed, trust has been shown to influence the adoption of website-based and m-government services [8,56,57] and to be correlated with support for new energy technology [58], while citizens’ lack of trust in their government has been found to negatively affect citizens’ intentions to use e-government services [59]. Similarly, trust in the vendor of a technology (perceived general trustworthiness and trust in the provider’s ability to offer adequate services) has been found to enhance the adoption of e-commerce and m-government services [60,61]. Two components of trust have been identified in the field of social cognition and in recent work that examines trust in organizations (agents) that produce and manage new energy-related technologies [58]. The first component is competence, the extent to which citizens evaluate the responsible agent as possessing sufficient knowledge and expertise to manage the project or technology; the second is integrity, the extent to which an agent is judged as honest, transparent, and possessing good intentions [58]. Accordingly, we investigated the role of both of these trust factors in predicting citizens’ intentions to use a city app.
Hypothesis 5a (H5a).
Trust in government factors of competence.
Hypothesis 5b (H5b).
Trust in government factors of integrity will be positively associated with intention to use the app.
While technology acceptance models (e.g., TAM, UTAUT) have improved our understanding of factors leading to initial acceptance (or not) of a particular communication technology, they do not sufficiently capture what happens after adoption [62,63]. Initial adoptions alone do not necessarily lead to sustained usage, because users are likely to update their attitudes toward or judgements of the adopted technology, which could influence continued use [64]. In particular, self-perception theory [65] proposes that people sometimes infer their attitudes by observing their own behavior and the circumstances in which that behavior occurs. City service apps are still in the infancy stage in the U.S., and, unlike most commercial apps, there are not many alternatives to such apps in a particular city or region. Residents in one city are unlikely to use service apps of other cities and compare different features or functions. Thus, users may not form a clear judgment regarding the app after adoption but might tend to reason that “the app must be good because I use it.” Past use has been found to significantly impact users’ evaluations of the technology [66]. Additionally, greater use of a technology can increase motivation to continue use [67]. Therefore, we included the factor of prior use in our model in order to examine whether it predicted intention to use the specific app of interest.
Hypothesis 6 (H6).
Prior use of city apps will be positively associated with intention to use the app.
1.3. The Proposed Model
Based on the technology acceptance and e-government literature described above, we proposed an initial model shown in Figure 1. Of note, we included the beliefs and intentions of both users and non-users of the app in order to provide a robust test of the model.
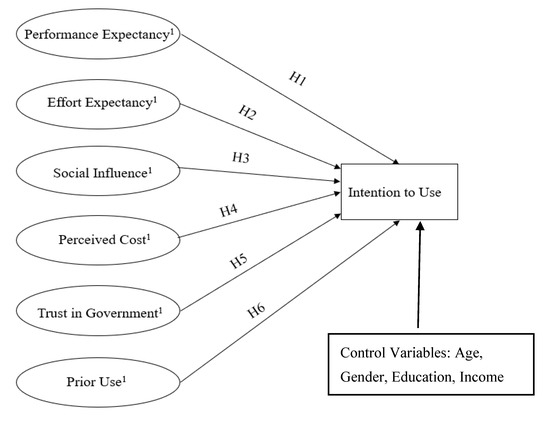
Figure 1.
Proposed model. 1 After controlling for demographic factors.
2. Materials and Methods
2.1. Study Context
An online survey was deployed to explore drivers of and barriers to adoption of the smart city app DigiTally among residents of Tallahassee, FL. Tallahassee represents an exemplar case among mid-sized US cities due to the city government’s progressiveness in ICT innovation and community engagement. In response to the recession in 2006 and 2007, the city government focused on ways to improve public service delivery through technological innovation. Resources were directed toward automating processes, improving workflows, and putting information databases online and in the cloud. This push toward ICT innovation led to the city to becoming one of the first American medium-sized cities to initiate programs related to becoming a “smart city”. The city was recognized in 2015 for being a pioneer in employing emerging technologies in local government [68].
As one of the city government’s smart-city endeavors, DigitTally (the management mobile app system) was launched in 2013. The app was developed as a streamlined way for citizens to report crime, submit service requests, and forward their complaints to city government agencies, which concurrently receive and respond to submissions and engage citizens in public service. The app is free and available for iOS and Android phones. The main app function is the service request function, which allows residents to submit and track a host of non-emergency service requests, such as power outages, gas leaks, blocked roads, graffiti, and potholes. Users can upload photos as well as send descriptions of problems. They can also view and monitor other requests in nearby locations. However, usage data reported by the city at the time of the most recent (2017) United States Census [69] indicated that a small proportion of adult residents of the city had downloaded or were actively using the app (this low adoption rate is consistent with others reported in the literature).
2.2. Participant Recruitment and Survey Administration
To test our hypotheses, an online questionnaire was distributed to city/county residents by Qualtrics (after receiving approval for research with human subjects from the university’s Institutional Review Board). Survey participants were recruited and compensated by Qualtrics. A stratified sampling scheme was used to recruit participants, with an attempt to represent the adult population of the city in terms of age and gender. Additionally, survey respondents were filtered through three prerequisites. First, qualified respondents were required to be a smartphone owner or user. Second, they were required to be residents of the city of Tallahassee and of age 18 or older. Third, some need for public services was required, such that the services provided by the apps would be relevant to them (e.g., having a city utility account). To gain a more complete view of city app adoption, both citizens with and without prior knowledge or usage of smart city apps were included.
2.3. Construct Measures
The survey question items used to measure the constructs in the model were based on previous conceptual and operational definitions identified in the existing literature on technology adoption as well as on specific construct-related beliefs expressed by participants in the focus groups that were conducted to initially inform the current study. All constructs/measures, except for prior use, employed 7-point Likert-type response categories ranging from 1 (low agreement) to 7 (high agreement) with the statements described below. All multi-item measures (indexes) were examined for and found to exhibit satisfactory reliability (all Chronbach’s αs > 0.70). Chronbach’s α is a measure of the internal consistency of a set of items that contribute to a scale or index (a measure of how related the items within a measure are to each other). Mathematically, Chronbach’s α is a function of fthe number of items in the measure and the average intercorrelation among those items. For each measure below, we provide the Chronbach’s α statistic along with the sample mean (M) and standard deviation (SD) scores for each measure (index).
Performance expectancy: Four items measured citizens’ perceived benefits of using city management apps (α = 0.82 for users; α = 0.89 for nonusers; combined scale for users and non-users, M = 5.22, SD = 1.24): DigiTally adds (can add) convenience to my life; I (believe) find city management apps like DigiTally (would be) useful in helping me get public services I need; Using city apps like DigiTally helps (would help) me get a faster response to my service requests; and Compared to other ways to report problems or request government services (e.g., website, email, phone call), city management apps like DigiTally have many advantages.
Effort expectancy: The perceived degree of ease to use city management apps was assessed by 4 items (M = 5.55, SD = 1.70, α = 0.92): Learning to use city management apps like DigiTally is (would be) easy for me; Overall, (I believe) city management apps like DigiTally are (would be) easy to use; I (believe I would) know how to use city management apps like DigiTally; and I am (would be) confident about using city management apps like DigiTally.
Social influence: Because social influence is operationalized in the current study as the product of the extent to which one perceives that others in the community use the app and the extent to which one identifies with members of that community, the measure of social influence was created by multiplying perceived social norms by community identity. Perceived social norms (M = 3.62, SD = 1.35, Spearman’s rho = 0.82) were assessed by 2 items: I think most people in my neighborhood/community use DigiTally to report problems and request services; I think most people in the city of X use DigiTally to report problems and request services. Community identity (M = 5.22, SD = 1.12, α = 0.85) was measured by 3 items: I identify with my community/neighborhood; I identify with my city; I am glad to be a part of my community /neighborhood.
Perceived cost: The perceived cost of using city management apps was measured by 5 items (M = 3.73, SD = 1.17, α = 0.76): City apps (would) take up too much storage space/memory on my phone; In general, I would be annoyed if I received automatic phone notifications from a city app; I am concerned that I would be “watched” by the government if (when) I use a city app; I worry about providing personal information on a city app; and During emergency situations (such as a storm or disaster), I would be annoyed if I received automatic phone notifications from a city app.
Trust in city government. As described in the literature review, studies have recently identified two components of trust [58]: Competence, the extent to which citizens evaluate the responsible agent as possessing sufficient knowledge and expertise to manage the project or technology, and integrity, the extent to which an agent is judged as honest, transparent, and possessing good intentions. Based on this conceptualization and previous items measuring trust [60,61], we measured competence by asking participants “How much do you trust your city government to effectively run and manage a city management app like DigiTally?” M = 4.58, SD = 1.56, and measured integrity by asking participants “How would you rate your trust in your city government overall?” M = 4.29, SD = 1.62.
Prior use: Two items assessed participants’ prior use of city apps (M = 0.97, SD = 1.59, Spearman’s rho = 0.74): On average, how often do you use city management apps to request services for your home/dwelling?; and On average, how often do you use city management apps like DigiTally to request services for your neighborhood/community? (0 = Never to 6 = All the time).
Intention to use app: Two items assessed participants’ future intention to use a smart city app (M = 4.77, SD = 1.54, Spearman’s rho = 0.89): I plan to use city management apps like DigiTally if I need to request city services in the near future; and I predict I will use city management apps like DigiTally if I need to request city services in the near future.
2.4. Statistical Model
Outlier Analysis: Before conducting the test of the model, data were screened for outlier cases. Five cases were identified as outliers across at least 3 variables. However, removing those cases from the dataset did not change any relationships in the model described in the results section below, and the Cook’s distance test described below indicated those cases did not have an undue influence on the model. Accordingly, those cases were allowed to remain in the data set and tests of the hypotheses.
Testing of assumptions: We used hierarchical linear regression analysis to test the theoretical model proposed in Figure 1. Data were examined to confirm that the assumptions for conducting a linear regression analysis were met. Scatterplots were first inspected to verify that the relationships between the predictor variables and outcome variable were all linear. No major multicollinearity problems were identified among the constructs (all VIFs < 4; no tolerance values below 0.20). The Durbin–Watson statistic was close to 2.0 (Durbin–Watson = 1.91), indicating that the values of the residuals in the model were independent. The plot of standardized residuals versus standardized predicted values showed no obvious funneling pattern, indicating that the assumption of homoscedasticity (similarity of variance of residuals across the model) had been met. Inspection of the P-P plot confirmed that the assumption of normality of the distribution of the residuals had not been violated. Finally, we examined Cook’s distance for any case values over 1.0 in order to determine whether any extreme cases had an undue influence on the model: All values were under 1, indicating no such influence. Altogether, our tests indicated that the principal assumptions of linear regression models were met.
Two-step hierarchical model: To test our hypotheses, we used a hierarchical linear regression model, which is an ordinary least square (OLS) regression-based analysis with a sequential process of entering predictor variables into the analysis in steps. Because prior research indicated an influence of demographic factors on the adoption of various technologies, we controlled for demographic factors (age, gender, highest level of education, and income) in the first step of the model. In the second step of the model, the constructs of technology adoption were entered.
3. Results
The sample for this study included 420 individuals. Our sample was 54% female, similar to the city population (52% female); and 85% of our sample was aged 25–64, similar to the city adult population, for which 90% of residents were ages 25–64 at the time of data collection (the remaining 15% of our sample were aged 18–23). Most participants (63%) had a bachelor’s degree or higher. In terms of ethnicity, 79.8% identified as white; 12.9% as black or African American; and 4.8% as Hispanic. Of those participants, only 39.5% said they were current or former city app users; 58.3% said they had never used a city app. Of note, users were younger, M = 42.78, SD = 13.85, than non-users, M = 49.48, SD = 14.08, t (418) = 4.80, p < 0.001, and were more educated than non-users, Kendall’s τb (409) = 0.11, p < 0.001 (non-users coded as 0; users as 1), although the latter relationship was weak. Users did not differ significantly from non-users in terms of gender, χ2 (420) = 0.18, p > 0.10, or household income, Kendall’s τb (402) = 0.06, p > 0.10.
As described above, hierarchical regression analysis was used to test the theoretical model proposed in Figure 1. Demographic factors (age, gender, highest level of education, and income) were entered as controls in the first step of the model, F (4, 403) = 4.44, p < 0.01, Adj. R2 = 0.03. The first step of the model was significant, but it explained little variance in app-use intentions. Age was the only demographic factor that was associated with app-use intentions: Older participants expressed weaker intentions to use the app. None of the other demographic factors were associated with use intentions.
Change statistics indicated that the second step of the model, which included the main predictor variables, resulted in a significant increase in the variance explained in behavioral intention, R2 = 0.52, F (7, 376) = 63.60, p < 0.001. The second step of the model was significant, F (11, 396) = 45.51, p < 0.001, and it explained approximately 55% of the total variance in behavioral intention, suggesting the explanatory power of the proposed model similar to that identified in previous technology adoption studies. Table 1 depicts the results of the tests of hypotheses.

Table 1.
Hierarchical multiple regression model results.
As predicted by H1, and aligning with the literature [24], performance expectancy was the strongest predictor of intention to use a city app. Effort expectancy was the second strongest predictor of app-use intentions (H2), followed by social influence (H3). Greater perceived cost associated with the technology was associated with less intent to use the app (H4), although the effect was not strong. A positive association between the competence component of trust (trust in the city government’s ability to effectively manage an app) and intentions to use an app was identified (H5a). The integrity component (general trust in the city government) was not associated with such intentions (H5b). Prior app use was a somewhat weak and positive predictor of future app-use intentions (H6). Of note, age was no longer a significant predictor of intent to use the app in the second step of the model, indicating that beliefs about the app itself and the city’s competence were more important predictors than the demographic factor of age.
4. Discussion
This study developed and tested a prediction model to explain citizens’ adoption and use of city service apps in order to facilitate communication about citizens’ needs for services. The findings can help illuminate factors that will likely influence the use of technologies developed and operated by local governments. Performance expectations, effort expectations, social influence, and trust in the local government’s competence were found to have a positive and salient influence on intention to use an app. These results provide several implications for practices that promote city-service app use and m-government in general.
Consistent with prior studies, performance expectations and effort expectations were the strongest predictors of intent to use an app. Our operationalization of these concepts and findings suggest that the adoption of citizen-engagement apps will likely be driven by two beliefs: That app use helps assure faster responses to service requests and that the app will be easy to use. These findings are also in line with the claimed benefits of m-government, which include more convenient, timely, and cost-effective services for citizens [8]. The findings might further suggest that city app designers and managers attempt to continue to increase efficiency in the delivery of public services. For example, expanding current service domains and incorporating more municipal functions—emergency management, local medical services, local news, and events notifications—may turn a city app into a convenient, community-relevant, and inclusive “one stop shop” to fulfill a wide array of city services. This strategy may also help to differentiate city service apps from conventional mobile apps that specialize to just one or a couple of features.
Social influence was also a fairly strong predictor of app-use intentions in this study. These findings suggest that it might be useful for cities to attempt to increase residents’ perceptions that others in the community are using the app (increase citizens’ descriptive norm perceptions about city service app use). For example, publicizing app use by members of the community could be an effective strategy for cities. Theories of normative conduct suggest that descriptive norm perceptions tend to influence our own behaviors because we believe that if many others are engaging in a given behavior, it must be an effective action to take (i.e., if others are doing it, it must work). Our data and the theory of normative social behavior [70] also suggest that norms perceptions are likely to influence behavior when potential users identify with those they perceive to be practicing the behavior (those who identify with their communities). So, descriptive norm perceptions should be more influential in closely knit communities.
Our sample perceived fairly low levels of personal costs associated with using city apps (reporting cost concerns below the midpoint of the 7-point scale, M = 3.75). Although the focus group data initially collected for this project indicated concerns about data storage space, unwanted notifications, and privacy, the influence of such cost concerns on intention to use an app was not particularly strong. Future studies should examine whether these and other “cost” concerns significantly influence the use of similar apps.
The competence factor of trust in city government was revealed to be positively associated with intention to use an app—greater trust was associated with stronger intentions. The influence of this factor was not as strong as that of performance and effort expectations, but the findings suggest this component of trust might be an important consideration for cities designing or promoting similar apps. Of note, however, previous studies have found the integrity component of trust to weigh more heavily in consumers’ decisions regarding some technologies [58]. Such a relationship is consistent with previous research [21] that found that citizens who are integrated into public administration processes of their municipalities have an increased intention to use city portals. Accordingly, we suggest both components of trust continue to be examined when predicting citizens’ willingness to participate in e-government and smart city applications. We further note that both components of the trust were moderately high in this study, just above the mean of the 7-point scale, at 4.58 for competence and 4.29 for integrity. It would be interesting to investigate the role of trust in other communities in which citizens have lower levels of trust in their municipal governments.
We note that, although some models of technology adoption (e.g., UTAUT2) predict that demographic factors, such as age and gender, will influence adoption intentions (at least indirectly), recent work suggests that gender and age differences associated with use and motivation to adopt new technologies tend to diminish with higher levels of education and with greater participation in the workforce [71]. Given that this study was conducted in a city with a highly educated population [69] and with a relatively high employment rate [72], we did not necessarily expect these factors to strongly influence intent to use the app. We did find that users were more educated than non-users (although the relationship between user status and education was weak) and that users were younger than non-users. However, the only the demographic variable that influenced behavioral intent in the regression model was age (but only in the first step of the model). Our data indicate that examining the specific benefits and risks that a given group of citizens attributes to the technology might be more fruitful than examining demographic predictors of intentions and use.
Limitations: Our findings should be considered in light of broader concerns about and some criticisms of smart city initiatives in general. These concerns and criticisms center around some planners’ and scholars’ unrealistic expectations of a technological utopia, faulty assumptions that city growth and increased competitiveness is infinite and unproblematic, and the problems of increased corporatization of municipalities and their technological infrastructures [73]. Additionally, there is a concern that rather than increasing democratic participation, smart cities will decrease it, by leaving behind or marginalizing the voices of less affluent citizens who lack access to or interest in the technologies [74]. This study did not seek to respond to or provide evidence of the validity of such criticisms. Rather it was intended to serve as more of an examination of the more “mundane” [73] features of smart city apps and their adoption by citizens as part of a continued discussion about the general attractiveness of fairly simple smart city technologies among those being encouraged to use them. However, as these technologies continue to be promoted and adopted by cities, it seems reasonable to consider the extent to which they truly serve the needs of all citizens as well as whether other means of communication and interaction are necessary to give a wide variety of citizens a voice and access to services.
While acknowledging the limitations described above, we believe the findings from this study can help local governments to gain a greater understanding of what drives the development and acceptance of smart city apps in ways that have the potential to enhance citizen engagement and governmental efficiency. Given increasing political demands for greater involvement of citizens in the political processes in general as well as in smart city governance, smart city mobile apps could be integral in enhancing citizen engagement and input in service decisions.
With respect to other practical and research applications, survey data similar to those collected for the current study can also be combined with technical data on disaster-related disruptions to city functioning and infrastructure in order to better understand citizen needs and the use of smart city functions [75]. Specifically, such survey data can be combined or cross-validated with data on infrastructure disruptions, such as power outages and roadway closures [76,77,78,79] as well as with city data on demographics and socioeconomics [80,81].
5. Conclusions
The findings herein have practical implications for the management of services and co-production. Several implications of this study can be directed to implementers and developers of smart city apps within local governments. There seems to be a need to guarantee the usefulness and ease of using mobile government apps. Such features should enhance the acceptance and use of smart city apps. Marketing communications that highlight social norms and community identity may also help in promoting app acceptance. App acceptance, in turn, will enhance the government performance and save cost and time for both citizens and government employees. As a transportation-focused example, through the use of this app, citizens can pick the best possible routes and save energy and money by avoiding any unnecessary detours. Similarly, they can learn about the best strategies for electricity consumption and can make their plans accordingly to save energy and money. Such similar benefits are critical for cities and their citizens becoming smarter.
As a future direction of research, this work can be expanded to other similar cities that serve their citizens with smart city apps. This can lead to a comparative assessment between different cities and communities.
Author Contributions
J.H., funding acquisition, conceptualization, writing, editing; L.A., conceptualization, writing, editing, formal analysis; Y.W., writing, editing, formal analysis; R.F., writing, editing; E.O., funding acquisition, conceptualization, editing; R.A., funding acquisition and conceptualization. All authors have read and agreed to the published version of the manuscript.
Funding
This research was funded by National Science Foundation, CNS Division of Computer and Network Systems Award #1640587.
Conflicts of Interest
The authors declare no conflict of interest. The funders had no role in the design of the study; in the collection, analyses, or interpretation of data; in the writing of the manuscript, or in the decision to publish the results.
References
- Ganapati, S. Using Mobile Apps in Government; IBM Center for the Business of Government: Washington, DC, USA, 2015. [Google Scholar]
- Mattson, G.A. The promise of citizen coproduction: Some persistent issues. Public Prod. Rev. 1986, 10, 51–56. [Google Scholar] [CrossRef]
- Dawes, S.S. The evolution and continuing challenges of e-governance. Public Adm. Rev. 2008, 68, S86–S102. [Google Scholar] [CrossRef]
- Dunleavy, P.; Margetts, H.; Bastow, S.; Tinkler, J. New public management is dead—Long live digital-era governance. J. Public Adm. Res. Theory 2006, 16, 467–494. [Google Scholar] [CrossRef]
- Meijer, A.J. Networked coproduction of public services in virtual communities: From a government-centric to a community approach to public service support. Public Adm. Rev. 2011, 71, 598–607. [Google Scholar] [CrossRef]
- Tang, T.; Hou, J.; Fay, D.L.; Annis, C. Revisit the drivers and barriers to e-governance in the mobile age: A case study on the adoption of city management mobile apps for smart urban governance. J. Urban Aff. 2019, 1–23. [Google Scholar] [CrossRef]
- Carter, L.; Bélanger, F. The utilization of e-government services: citizen trust, innovation and acceptance factors. Inf. Syst. J. 2005, 15, 5–25. [Google Scholar] [CrossRef]
- Sharma, S.K.; Al-Badi, A.; Rana, N.P.; Al-Azizi, L. Mobile applications in government services (mG-App) from user’s perspectives: A predictive modelling approach. Gov. Inf. Q. 2018, 35, 557–568. [Google Scholar] [CrossRef]
- Wang, Y.S.; Lin, H.H.; Luarn, P. Predicting consumer intention to use mobile service. Inf. Syst. J. 2006, 16, 157–179. [Google Scholar] [CrossRef]
- Burksiene, V.; Dvorak, J.; Duda, M. Upstream Social Marketing for Implementing Mobile Government. Societies 2019, 9, 54. [Google Scholar] [CrossRef]
- Rosenbaum, J.; Zepic, R.; Schreieck, M.; Wiesche, M.; Krcmar, H. Barriers to mobile government adoption: An exploratory case study of an information platform for refugees in Germany. In ECDG 2018 18th European Conference on Digital Government; Academic Conferences and Publishing International Limited: Sonning Common, UK, 2018; p. 198. [Google Scholar]
- Hou, J.; Tang, T.; Annis, C.; Wu, Y.; Arghandeh, R.; Ozguven, E.E. The road toward Smart Cities: A focus group study on citizens’ perceptions and use of mobile applications for city management. In Proceedings of the National Communication Association Annual Conference, Salt Lake City, UT, USA; 8–11 November 2018. [Google Scholar]
- Thomas, J.C. Citizen-initiated contacts with government agencies: A test of three theories. Am. J. Political Sci. 1982, 26, 504–522. [Google Scholar] [CrossRef]
- Jones, B.D.; Greenberg, S.R.; Kaufman, C.; Drew, J. Bureaucratic response to citizen-initiated contacts: environmental enforcement in Detroit. Am. Political Sci. Rev. 1977, 71, 148–165. [Google Scholar] [CrossRef]
- Sharp, E.B. Citizen-Demand Making in the Urban Context. Am. J. Political Sci. 1984, 28, 654–670. [Google Scholar] [CrossRef]
- Hirlinger, M.W. Citizen-initiated contacting of local government officials: a multivariate explanation. J. Politics 1992, 54, 553–564. [Google Scholar] [CrossRef]
- Thomas, J.C.; Streib, G. The new face of government: citizen-initiated contacts in the era of E-Government. J. Public Adm. Res. Theory 2003, 13, 83–102. [Google Scholar] [CrossRef]
- Falco, E.; Kleinhans, R. Beyond technology: Identifying local government challenges for using digital platforms for citizen engagement. Int. J. Inf. Manag. 2018, 40, 17–20. [Google Scholar] [CrossRef]
- Norris, D.F.; Reddick, C.G. Local e-government in the United States: Transformation or incremental change? Public Adm. Rev. 2013, 73, 165–175. [Google Scholar] [CrossRef]
- Rana, N.P.; Dwivedi, Y.K.; Williams, M.D. Analysing challenges, barriers and CSF of egov adoption. Transform. Gov. People Process Policy 2013, 7, 177–198. [Google Scholar] [CrossRef]
- Wirtz, B.W.; Kurtz, O.T. Determinants of citizen usage intentions in E-government: An empirical analysis. Public Org. Rev. 2017, 17, 353–372. [Google Scholar] [CrossRef]
- Brown, S.A.; Venkatesh, V. A model of adoption of technology in the household: A baseline model test and extension incorporating household life cycle. MIS Q. 2005, 29, 11. [Google Scholar] [CrossRef]
- Davis, F.D. Perceived usefulness, perceived ease of use, and user acceptance of information technology. MIS Q. 1989, 13, 319–340. [Google Scholar] [CrossRef]
- Venkatesh, V.; Morris, M.G.; Davis, G.B.; Davis, F.D. User acceptance of information technology: Toward a unified view. MIS Q. 2003, 27, 425–478. [Google Scholar] [CrossRef]
- Venkatesh, V.; Thong JY, L.; Xu, X. Consumer acceptance and use of information technology: Extending the unified theory of acceptance and use of technology. MIS Q. 2012, 36, 157–178. [Google Scholar] [CrossRef]
- Ahmad, S.Z.; Khalid, K. The adoption of M-government services from the user’s perspectives: Empirical evidence from the United Arab Emirates. Int. J. Inf. Manag. 2017, 37, 367–379. [Google Scholar] [CrossRef]
- Ishengoma, F.; Mselle, L.; Mongi, H. Critical success factors for m-Government adoption in Tanzania: A conceptual framework. Electron. J. Inf. Syst. Dev. Ctries. 2019, 85, e12064. [Google Scholar] [CrossRef]
- Liu, Y.; Li, H.; Kostakos, V.; Goncalves, J.; Hosio, S.; Hu, F. An empirical investigation of mobile government adoption in rural China: A case study in Zhejiang province. Gov. Inf. Q. 2014, 31, 432–442. [Google Scholar] [CrossRef]
- Mohamudally, N.; Armoogum, S. Smart City Mobile Apps Exploratory Data Analysis: Mauritius Case. In Proceedings of the Third International Conference on Smart City Applications; Springer: Cham, Switzerland, 2019; pp. 41–52. [Google Scholar]
- Shareef, M.A.; Kumar, V.; Kumar, U.; Dwivedi, Y.K. e-Government Adoption Model (GAM): Differing service maturity levels. Gov. Inf. Q. 2011, 28, 17–35. [Google Scholar] [CrossRef]
- Shareef, M.A.; Archer, N.; Dwivedi, Y.K. Examining adoption behavior of mobile government. J. Comput. Inf. Syst. 2012, 53, 39–49. [Google Scholar]
- Yeh, H. The effects of successful ICT-based smart city services: From citizens’ perspectives. Gov. Inf. Q. 2017, 34, 556–565. [Google Scholar] [CrossRef]
- Leong, G.W.; Ping, T.A.; Muthuveloo, R. Antecedents of Behavioural Intention to Adopt Internet of Things in the Context of Smart City in Malaysia. Glob. Bus. Manag. Res. 2017, 9, 442–456. [Google Scholar]
- Arvidsson, N. Consumer attitudes on mobile payment services–results from a proof of concept test. Int. J. Bank Mark. 2014, 32, 150–170. [Google Scholar] [CrossRef]
- Smith, P.; Sankaranarayanan, S. Smart agent based mobile shopping and secured payment. Int. J. Emerg. Trends Technol. Comput. Sci. 2012, 1, 240–254. [Google Scholar]
- Ozturk, A.B.; Bilgihan, A.; Nusair, K.; Okumus, F. What keeps the mobile hotel booking users loyal? Investigating the roles of self-efficacy, compatibility, perceived ease of use, and perceived convenience. Int. J. Inf. Manag. 2016, 6, 1350–1359. [Google Scholar] [CrossRef]
- Minkoff, S.L. NYC 311: A Tract-Level Analysis of Citizen–Government Contacting in New York City. Urban Affairs Rev. 2016, 52, 211–246. [Google Scholar] [CrossRef]
- Curtis, L.; Edwards, C.; Fraser, K.L.; Gudelsky, S.; Holmquist, J.; Thornton, K.; Sweetser, K.D. Adoption of social media for public relations by nonprofit organizations. Public Relat. Rev. 2010, 36, 90–92. [Google Scholar] [CrossRef]
- Gupta, B.; Dasgupta, S.; Gupta, A. Adoption of ICT in a government organization in a developing country: An empirical study. J. Strateg. Inf. Syst. 2008, 17, 140–154. [Google Scholar] [CrossRef]
- Han, S.; Mustonen, P.; Seppanen, M.; Kallio, M. Physicians’ acceptance of mobile communication technology: an exploratory study. Int. J. Mobile Commun. 2006, 4, 210–230. [Google Scholar] [CrossRef]
- Marchewka, J.T.; Kostiwa, K. An application of the UTAUT model for understanding student perceptions using course management software. Commun. IIMA 2007, 7, 10. [Google Scholar]
- Al Awadhi, S.; Morris, A. The Use of the UTAUT Model in the Adoption of E-government Services in Kuwait. In Proceedings of the 41st annual Hawaii international conference on system sciences (HICSS 2008), Waikoloa, HI, USA, 7–10 January 2008. [Google Scholar]
- Schepers, J.; Wetzels, M. A meta-analysis of the technology acceptance model: Investigating subjective norm and moderation effects. Inf. Manag. 2007, 44, 90–103. [Google Scholar] [CrossRef]
- Chatterjee, S.; Sarker, S.; Valacich, J.S. The behavioral roots of information systems security: Exploring key factors related to unethical IT use. J. Manag. Inf. Syst. 2015, 31, 49–87. [Google Scholar] [CrossRef]
- Kulviwat, S.; Bruner, G.C., II; Al-Shuridah, O. The role of social influence on adoption of high-tech innovations: The moderating effect of public/private consumption. J. Bus. Res. 2009, 62, 706–712. [Google Scholar] [CrossRef]
- Talukder, M.; Quazi, A. The impact of social influence on individuals’ adoption of innovation. J. Org. Comput. Electron. Commerce 2011, 21, 111–135. [Google Scholar] [CrossRef]
- Cialdini, R.B.; Reno, R.R.; Kallgren, C.A. A focus theory of normative conduct: Recycling the concept of norms to reduce littering in public places. J. Pers. Soc. Psychol. 1990, 58, 1015–1026. [Google Scholar] [CrossRef]
- Mortensen, C.R.; Neel, R.; Cialdini, R.B.; Jaeger, C.M.; Jacobson, R.P.; Ringel, M.M. Trending norms: A lever for encouraging behaviors performed by the minority. Soc. Psychol. Pers. Sci. 2019, 10, 201–210. [Google Scholar] [CrossRef]
- Lapinski, M.K.; Rimal, R.N. An Explication of Social Norms. Commun. Theory 2005, 15, 127–147. [Google Scholar] [CrossRef]
- Tajfel, H.; Turner, J.C. An integrative theory of intergroup conflict. In the Social Psychology of Intergroup Relations; Austin, W.G., Worchel, S., Eds.; Brooks/Cole: Monterey, CA, USA, 1979; pp. 33–37. [Google Scholar]
- Hafer, J.; Ran, B. Developing a citizen perspective of public participation: Identity construction as citizen motivation to participate. Adm. Theory Praxis 2016, 38, 206–222. [Google Scholar] [CrossRef]
- Coursey, D.; Perry, J. Institutional Logic, Social Identification, and Public Service Motivation: Does Organization Matter. In Proceedings of the Public Management Research Conference, Syracuse, NY, USA, 2–4 June 2011. [Google Scholar]
- Postmes, T.; Haslam, S.; Jans, L. A single-item measure of social identification: Reliability, validity, and utility. Br. J. Soc. Psychol. 2013, 52, 597–617. [Google Scholar] [CrossRef]
- Dennison, L.; Morrison, L.; Conway, G.; Yardley, L. Opportunities and challenges for smartphone applications in supporting health behavior change: qualitative study. J. Med. Internet Res. 2013, 15, e86. [Google Scholar] [CrossRef]
- Felt, A.P.; Egelman, S.; Wagner, D. I’ve got 99 problems, but vibration ain’t one: A survey of smartphone users’ concerns. In Proceedings of the 2nd ACM Workshop on Security and Privacy in Smartphones and Mobile Devices ACM, Raleigh, NC, USA, 19 October 2012; pp. 33–44. [Google Scholar]
- Teo, T.; Srivastava, S.; Jiang, L. Trust and electronic government success: an empirical study. J. Manag. Inf. Syst. 2008, 25, 99–132. [Google Scholar] [CrossRef]
- Wang, C. Antecedents and consequences of perceived value in mobile government continuance use: An empirical research in China. Comput. Hum. Behav. 2014, 34, 140–147. [Google Scholar] [CrossRef]
- Liu, L.; Bouman, T.; Perlaviciute, G.; Steg, L. Effects of competence-and integrity-based trust on public acceptability of renewable energy projects in China and the Netherlands. J. Environ. Psychol. 2020, 67, 101390. [Google Scholar] [CrossRef]
- Fakhoury, R.; Aubert, B. Citizenship, trust, and behavioral intentions to use public e-services: the case of Lebanon. Int. J. Inf. Manag. 2015, 35, 346–351. [Google Scholar] [CrossRef]
- Gefen, D. E-commerce: The role of familiarity and trust. Omega 2000, 28, 725–737. [Google Scholar] [CrossRef]
- Hung, S.Y.; Chang, C.M.; Kuo, S.R. User acceptance of mobile e-government services: An empirical study. Gov. Inf. Q. 2013, 30, 33–44. [Google Scholar] [CrossRef]
- Kim, S.S.; Malhotra, N.K. Predicting system usage from intention and past use: scale issues in the predictors. Decis. Sci. 2005, 36, 187–196. [Google Scholar] [CrossRef]
- Limayem, M.; Hirt, S.G.; Cheung, C.M. How habit limits the predictive power of intention: The case of information systems continuance. MIS Q. 2007, 31, 705–737. [Google Scholar] [CrossRef]
- Limayem, M.; Hirt, S.G. Force of habit and information systems usage: Theory and initial validation. J. Assoc. Inf. Syst. 2003, 4, 3. [Google Scholar] [CrossRef]
- Bem, D.J. Self-perception theory. Adv. Exp. Soc. Psychol. 1972, 6, 1–62. [Google Scholar]
- Bajaj, A.; Nidumolu, S.R. A feedback model to understand information system usage. Inf. Manag. 1998, 33, 213–224. [Google Scholar] [CrossRef]
- Parthasarathy, M.; Bhattacherjee, A. Understanding Post-Adoption Behavior in the Context of Online Services. Inf. Syst. Res. 1998, 9, 362–379. [Google Scholar] [CrossRef]
- Center for Digital Government. Best of the Web & Digital Government Achievement Awards 2015; Government Technology: Folsom, CA, USA, 2015. [Google Scholar]
- United States Census Bureau. [Data file]. 2017. Available online: https://www.census.gov/searchresults.html?q=education&page=1&stateGeo=none&searchtype=web&cssp=SERP&_charset_=UTF-8 (accessed on 23 January 2018).
- Rimal, R.N.; Real, K. How behaviors are influenced by perceived norms: A test of the theory of normative social behavior. Commun. Res. 2005, 32, 389–414. [Google Scholar] [CrossRef]
- Arenas-Gaitán, J.; Peral-Peral, B.; Ramón-Jerónimo, M. Elderly and internet banking: An application of UTAUT2. J. Internet Bank. Commer. 2015, 20, 1–23. [Google Scholar]
- United States Bureau of Labor Statistics. Metropolitan and Nonmetropolitan Area Occupational Employment and Wage Estimates; United States Bureau of Labor Statistics: Tallahassee, FL, USA, 2017.
- Glasmeier, A.; Christopherson, S. Thinking about smart cities. Camb. J. Reg. Econ. Soc. 2015, 8, 3–12. [Google Scholar] [CrossRef]
- Martin, C.J.; Evans, J.; Karvonen, A. Smart and sustainable? Five tensions in the visions and practices of the smart-sustainable city in Europe and North America. Technol. Forecast. Soc. Chang. 2018, 133, 269–278. [Google Scholar] [CrossRef]
- Diwanji, V.; Arpan, L.; Ulak, M.B.; Hou, J.; Ozguven, E.E.; Arghandeh, R. Understanding citizens’ communication channel preferences during natural disasters: A synchronicity-based, mixed-methods exploration using survey and geospatial analysis. Int. J. Disaster Reduct. [CrossRef]
- Ghorbanzadeh, M.; Koloushani, M.; Ulak, M.B.; Ozguven, E.E.; Arghandeh, R. Spatial and Statistical Analysis of Hurricane-induced Roadway Closures and Power Outages. Energies 2020, 13, 1098. [Google Scholar] [CrossRef]
- Gilanifar, M.; Wang, H.; Ozguven, E.E.; Zhou, Y.; Arghandeh, R. Bayesian Spatiotemporal Gaussian Process for Short-term Load Forecasting Using Combined Transportation and Electricity Data. ACM Trans. Cyber-Physical Syst. 2019, 4. [Google Scholar] [CrossRef]
- Gilanifar, M.; Sriram, L.M.K.; Wang, H.; Ozguven, E.E.; Arghandeh, R. Multi-Task Bayesian Spatiotemporal Gaussian Processes for Short-term Load Forecasting. IEEE Trans. Ind. Electron. 2020, 67. [Google Scholar] [CrossRef]
- Sriram, L.M.K.; Gilanifar, M.; Zhou, Y.; Ozguven, E.E.; Arghandeh, R. Causal Markov Elman Network for Load Forecasting in Multinetwork Systems. IEEE Trans. Ind. Electron. 2019, 66, 1434–1442. [Google Scholar] [CrossRef]
- Ulak, M.B.; Kocatepe, A.; Sriram, L.M.K.; Ozguven, E.E.; Arghandeh, R. Assessment of the Hurricane-Induced Power Outages from a Demographic, Socioeconomic and Transportation Perspective. Nat. Hazards 2018, 92, 1489–1508. [Google Scholar] [CrossRef]
- Sriram, L.M.K.; Ulak, M.B.; Ozguven, E.E.; Arghandeh, R. Multi-Network Vulnerability Causal Model for Infrastructure Co-Resilience. IEEE Access 2019, 7, 35344–35358. [Google Scholar] [CrossRef]
© 2020 by the authors. Licensee MDPI, Basel, Switzerland. This article is an open access article distributed under the terms and conditions of the Creative Commons Attribution (CC BY) license (http://creativecommons.org/licenses/by/4.0/).