Abstract
The manuscript presents the possibilities of using selected Lean Management tools at a fast food restaurant located at the international airport terminal in Poland. Observations in other points of the company lasting for five years, made possible fair proposals for improvement of selected elements of production and work organization. The research part presents the results of application of such tools as value stream mapping (VSM), Kaizen, and 5S. The Lean Management method, chosen after careful analysis of the work system in the facility, contributed to the increase of work efficiency. Production times were shortened. Additionally, the possibility of reducing energy consumption, and thus the reduction of CO2 emissions associated with production, achieved without interfering with product quality was demonstrated. The timetable for device work was proposed. It was selected based on the analysis of the daily number of transactions compared with energy consumption. It should be emphasized that properly selected Lean tools allow for practical increase of work efficiency, reduction of production cycle times, and a decrease of energy consumption, which, in turn, leads to the decrease of CO2 emissions. It is demonstrated that, concerning the large number of enterprises of that type, introducing appropriate changes in work organization is able to facilitate large changes in emissions on a global scale. The presented solutions were tested in practice, however, due to the nature of the place, it should be considered individually.
1. Introduction
Production processes, practically in all branches of industry, need substantial energy inputs to maintain regular everyday operation [1,2,3,4]. The use of various fossil fuels, as well as electricity, also to a large extent associated with the use of fossil fuels, cause emission of carbon dioxide [5,6]. It is well known that carbon dioxide emitted to the atmosphere is one of the most important greenhouse gases [7,8]. Moreover, it is easily soluble in water, and therefore its concentration in the global aquatic zone increases simultaneously with an increase of concentration in atmosphere. The most probable consequences are global warming and acidification of ocean waters. Both changes affect the biosphere and might produce enormous influence on living organisms including man [9,10]. Consequently, a decrease of CO2 concentrations in oceans and atmosphere has become one of the most important challenges to the humanity. There are two possible paths leading to a decrease of carbon dioxide concentrations [11,12]. One of those, probably the most important, is the natural biological consumption of CO2 by the organisms capable of photosynthesis. The other may be the series of existing and emerging technologies enabling utilization of carbon dioxide already present in nature or just being released to atmosphere by industrial processes. The other way might consist of mitigation of emissions of carbon dioxide from actually conducted industrial processes. This aim can be achieved by appropriate design of new technologies, modernization of old ones, or introduction of changes to the production organization i.e., a kind of production processes reengineering [13,14,15,16]. The ideas of Lean Manufacturing or Lean Management appear as tools enabling such modifications of industrial processes that energy savings, and consequently a decrease of carbon dioxide emissions, can be achieved in any industrial sector [17,18,19]. The present paper demonstrates this possibility in a specific type of enterprise, namely a fast food restaurant, which is one of the most common carbon dioxide emitters.
Nowadays, the survival of an enterprise requires a lot of commitment and innovation [20,21,22]. To succeed, you need to constantly find new ways to provide the customer with better and better products that meet different requirements [23,24,25]. This is followed by the need to reduce costs with the most possible lack of reduction in terms of product quality [26,27]. There are countless enterprise management systems [28,29,30].
One of the inseparable elements of production is energy [31,32]. Typical electricity loss for an electrical appliance used at home, in a restaurant, or in the office can be between 1 W and even 30 W. The costs resulting from this loss are not significant enough to be felt by the consumer. The situation changes when the power losses of all households, restaurants, and office equipment are aggregated at the accounting level. Then the amount becomes significant and cannot be ignored, especially in the context of dynamic changes in the power sector, energy price forecasts, and increasingly restrictive environmental regulations [33,34,35].
Taking into account both independent operators and large restaurant chains, there is no doubt that the catering industry reduces energy and water consumption, minimizes waste generation, and establishes contact with energy-conscious guests [36,37,38,39]. According to research by the U.S. Environmental Protection Agency, restaurants can easily save energy, for example on cooking (23% saving), heating (19%), lighting (11%), freezing (8%), cooling (6%), ventilation (5%), and office equipment (1%) [40,41,42,43].
These issues are so important that they have become the subject of research and many scientific publications [44,45,46,47,48].
Rising electricity prices are one of the factors determining product prices. The lower the production costs, the greater the profit [49,50]. Today is a time of strong market competition. Businesses are competing with each other to make a profit. According to [51,52], it is currently the customer who has the greatest impact on what is produced. Increasingly, he or she pays attention not only to the price but also to the quality of the product or service offered. The management system implemented is important in the structure of the organization [53,54]. This is what largely influences the price and quality. Lean Management [55,56,57] is one of the management methods. It applies to all branches of the enterprise’s business activity, from production, through administration, to energy consumption.
Lean Management, in the simplest terms, is about slimming the management processes [58,59,60,61]. Reducing unnecessary activities, production times, and minimizing the use of raw materials and energy.
The key to success in Lean Management described in the literature on the subject are assumptions such as flattening the organizational structure, personal responsibility for the work performed, standardization and unification, elimination of waste in every form, simplifying work organization and administration at every possible level, striving for perfection [62,63,64].
In the Lean concept, the biggest enemy is waste. The recipient pays only for the final product. Production is focused on creating value for the recipient. The work culture in the Lean system distinguishes seven main types of waste [65,66,67,68].
The Lean concept recognizes that continuous material flow is the key to reducing costs. Therefore, all types of storage are seen as bad. The reason for this cost can be batch production and bottlenecks on the production line.
The goals of Lean Management (LM) implementation in a given enterprise are usually associated with improvement of economic performance of that institution. The relationship between economic productivity of the factory and its energy efficiency was never studied in the focus of Lean Management implementation. The hypothesis posed for the present research assumes existence of a correlation between changes of production organization, being compatible with LM requirements, and the energy efficiency of the enterprise. The hypothesis is very general, and can be tested on various types of economic organizations.
The aim of the present work is to check validity of the hypothesis mentioned by performing an analysis on the case study of a specific enterprise. The increase of energy efficiency, due to decrease in energy consumption, can be directly associated with mitigation of carbon dioxide emissions to the atmosphere.
Although the paper does not directly deal with CO2 utilization, the process that would eliminate some CO2 from the atmosphere, the authors consider that avoiding emission of some amount of greenhouse gas has an identical ecological effect as removal of the same amount of that gas.
In order to prove the hypothesis, the authors have to report the details of Lean Management procedures being applied in the enterprise investigated.
2. Materials and Methods
The aim of the paper is to try to use selected Lean Management tools at a selected quick service point located at the airport terminal in Poland. Thanks to observations that have been ongoing since 2010 at other outlets of the company, it was possible to reliably present proposals for improving selected production elements and work organization. The Lean Management method was chosen after a thorough analysis of the work system in the facility.
Carefully selected Lean tools allow for practical increase of work efficiency, reduction of production cycle times, and in some cases reduction of energy consumption. The presented solutions have been tested in practice.
Due to the nature of the place, they should be considered individually. They may not always give the same effect at another point belonging to a company that is a leader in the Polish market in the fast food industry. Due to the standards in force in the organization, some solutions have only been tested and not implemented permanently.
In the near future, all companies will have to apply more or less intrusive solutions aimed at reducing costs without interfering with the quality of the goods offered. The same applies to reducing energy consumption. The manuscript proposes a device operation schedule. It was selected based on the analysis of the daily number of transactions compared to energy consumption.
Lean Management has many tools to improve and streamline business operations. The use of a specific tool is conditioned by the specificity and capabilities of the enterprise. The needs arising from the current situation are also significant. Selected Lean Management tools are presented below. They were adapted to the specifics of the restaurant and the possibility of their introduction.
The intention of the authors of the manuscript is not to assume that the manufacturers will adapt the devices according to their requirements. This manuscript intends to show that Lean Management tools can support the drive to reduce energy consumption (and thus CO2 emissions) in gastronomy.
2.1. Value Stream Mapping (VSM)
Value stream mapping is considered to be the basic tool for improving material and data flow processes in the Lean concept [69]. The idea of value stream mapping (VSM) is to recognize all activities (adding and not adding value) that are undertaken during the cycle of creation of a particular product or service. It starts from the raw material phase and ends with the final good. Illustrating VSM allows you to find any losses and unnecessary activities in the process. It allows directing corrective actions aiming at slimming in accordance with the Lean principle. A well-illustrated flow of value stream makes it easy to get rid of losses and additional costs. What distinguishes value streaming mapping from the rest of the Lean Management tools is the aforementioned analysis not only of material flows, but also of the information itself [70]. If there was no VSM, all attempts to slim and improve production processes could have been limited to individual work stations. On-site refinement has no major impact on the entire material flow process. Thanks to VSM, it is possible to look more clearly at the processes taking place in the examined aspect of the organization’s activity (e.g., administration, production) [71]. The technique of creating a good map of the material flow stream in an enterprise considers three separate stages of formation [72,73,74].
The rest of the manuscript presents VSM on the example of two products: sandwiches requiring passage through all work stations of the production line and pieces of chicken. The focus was on the ergonomics and availability of intermediates and packaging. There was no need to change the organization of the production system due to the suction nature used for production. This greatly facilitated the possibility of introducing changes without much interference in existing solutions. As it will be presented later, the use of various Lean tools will shorten the overall production cycle of selected products.
2.2. Kaizen
Kaizen should not be seen as a tool, but rather an approach to work. This is already well known and considered by some as an outdated perception of the approach to the organization. In the simplest reasoning, it is continuous improvement. This method refers to every sphere of the organization’s functioning. Kaizen’s idea is to involve the entire staff of the company in the work and production process [75]. Management should conduct the transition process in small steps. Thanks to this, high costs and revolution are avoided. In spite of appearances, the basis of this philosophy is a private employee. It is the pillar of the entire organizational machine. Trainings for basic and senior staff are recommended. If an employee feels involved in the entire production process, the likelihood of improving the efficiency of the work station will increase. This can be achieved even through the influence of the employees themselves on the work station in which they work. They know what is most convenient for them. The manuscript uses this method to determine the placement of work tools and packaging in accordance with the 5S rule [76,77,78,79,80,81].
2.3. 5S
The 5S tool is directly related to the issue of ensuring effective work, and thus better quality products. This is one of the foundations of the Lean Management concept, beside Kaizen. The idea of 5S is to eliminate unnecessary elements that are a source of waste in the stream of materials [82]. Such elements include unused work stations, excessive administration or lack of order at the workplace. It can be said that by introducing 5S, an organization or plant is reorganized to ensure better productivity. The 5S tool has five stages of introduction [83,84].
The manuscript used the 5S method to focus on integrating it with Kaizen. Operation times at work stations modernized in this way were measured before and after. The list of changes with descriptions is presented in the next section. Whereas, the results after using 5S are presented in the summary section.
2.4. Device Operation Schedule
Scheduling consisted of proposing a different approach to the times when the equipment was in operation. During observations, periods of operation of individual devices were recorded in 24 h. On this basis, a device operation schedule was created, broken down into hourly intervals.
The machine working times were then compared with the hourly distribution of the intensity of incoming orders to the kitchen area and the number of employees in individual hours. Knowing the positioning of personnel at the point, it was possible to develop the possibility of filling given work stations at selected hours (assessment of the sense of operation of the device for a given number of employees). A new machine work schedule was developed. The time of starting-up of given devices was taken into account. It should be understood here as the time of cooling down, heating up, and loading. Everything depends on whether it is a cash register, a refrigerator, or a heater. Then the percentage reduction in the operating time of individual devices was calculated. All working hours were added together to calculate the overall reduction in machine intensity for the entire outlet. The calculation consisted of calculating the difference in working hours before and after modernization. Then the result was checked in terms of the percentage of the original number of working hours. Equation (1) presents the formula to facilitate understanding of the flow of thinking. A negative value calculated from the formula would mean an increase rather than a decrease in working time.
To test practical possibilities, the new schedule was applied for a week. This made it possible to check the accuracy of decisions resulting from the research. After the correction, the final changes are presented along with the conclusions in the manuscript.
Thanks to access to the energy data of the outlet, it was possible to check how the proposed schedule affects energy consumption in terms of the whole day. The consumption data obtained was compared with consumption on days with a similar number of transactions in other periods of operation of the outlet. The characteristics of the number of transactions and energy demand are presented in the next section. Whereas, the comparative results are in the penultimate section. For better visualization, an indicator of the amount of energy consumed during the day to the number of transactions was created. The lower the value, the better.
The manuscript focuses on developing a device operation schedule during an intensified period of the year.
2.5. Information on Energy Consumption
It was possible to obtain data on daily energy consumption due to the fact that the organization is equipped with an energy consumption control system. Access to the system is remote via an internet connection. Energy data is recorded in one-minute spans. Thanks to this it is possible to read the consumption states in selected time intervals.
In addition, the highest energy consumption in particular hours is recorded. The system has the ability to split energy consumption into selected areas. As a result, it was possible to collate data only for the devices being developed.
Thanks to the location of the sensors on each of the sockets, it is possible to read the energy consumption from anywhere in the restaurant. Optionally, it is also possible to turn devices on and off remotely at selected times. On the basis of the information obtained from the company, it is known that the examined outlet in the winter period has programmed heating off.
3. Characteristics of Research Objects with Solutions
3.1. Place of Research
Place of research is one of the restaurants of the popular fast food chain. It is located at the terminal in the duty free zone of the Airport in Poland. The opening took place on 1 May 2015. The usable area without warehouses is approximately 55 sq. m. This is one of the smallest restaurants belonging to the organization in Poland. The outlet has two separate storage places. The main one is outside the duty-free zone at the lower level of the airport and an auxiliary one is at the level of the departure area. Due to the scope of work, the location of the warehouses does not affect the results of observations. For the needs of the manuscript, the restaurant was divided into two zones: a production one and a service one. The production zone includes a kitchen with preparation stations. The second zone is where the orders are received and given. A description of the principle of each work station will be presented later in the manuscript.
3.1.1. Working Time
The working time of the outlet can be divided into two periods of the year. The season of heavy traffic, when the restaurant is opened from 1:00 to 22:00 and out of season time when opened from 3:00 to 22:00. Increased traffic is caused by additional flights during the night.
3.1.2. Number of Transactions
Data on the number of transactions carried out each day were collected. Thanks to this it was possible to set two periods of the year mentioned earlier. Figure 1 shows the number of transactions in individual months, and the average number of transactions during one day in each month is marked in red. The average was calculated by dividing the sum of transactions by the number of days in a given month. The result was rounded to the full value.
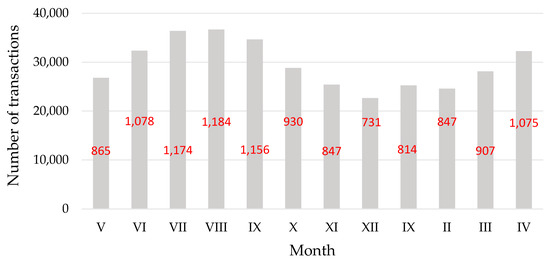
Figure 1.
The sum of transactions in individual months. The red color marks the average number of transactions per day.
As it can be seen from Figure 1, warmer months are marked by a significant increase in transactions. The smaller number of transactions in May 2015 was probably due to the fact that it was the first month of business activity, and information on the business activity has not been broadcasted yet. December is the weakest month. The reason may be the number of public holidays.
The average number of transactions is very important information because it will be used to prepare schedules for individual machines later in the manuscript. Thanks to this, it will be possible to propose energy savings.
3.1.3. Energy Consumption Distribution
Energy consumption data came from reports generated using the energy management system. The statement was generated on a monthly basis and average daily consumption in individual months. Figure 2 shows the results obtained.
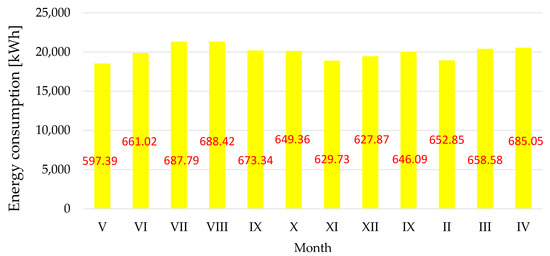
Figure 2.
Monthly energy consumption per point. The red color marks the average monthly energy consumption.
As it can be seen, energy consumption per month oscillates in the range of about 19 to 21 MWh. The differences in individual months result from the number of days in months and traffic volume in selected time intervals.
Data collation in the form of average daily consumption gives a better view of the whole situation. The values do not diverge as much as in the previous chart. The daily consumption is around 654 kWh.
3.1.4. An Indicator of Energy Consumption for the Number of Transactions
By collecting the data previously presented, it is possible to create an indicator of the amount of energy consumed per transaction. In the manuscript, it will be used to compare the effectiveness of the implemented solutions regarding the change of device operating times. Table 1 presents the values of energy consumed for each transaction in individual months.

Table 1.
Summary of energy consumption per transaction.
The average energy consumption per transaction was 0.69 kWh/transaction. This is a satisfactory result. The rest of the manuscript the options for reducing this value will be presented. This will be possible mainly due to the seasonality of traffic distribution at a point during the year.
3.2. Operating Principles of Individual Areas
The algorithm of the production process will be presented on the example of two products. The first is a sandwich with the largest unit sales for every 1000 transactions. The second product is pieces of chicken.
The order is displayed on the monitor at the first position. An appropriate roll is taken from the rack and placed in the toaster (Figure 3a). The arrangement of baskets on the rack is fixed and used by all shifts. Thanks to this, there is no downtime at the first stage of production. During toasting of a roll, the person standing at the beginning of the production line takes the packaging from the rack (Figure 3b).
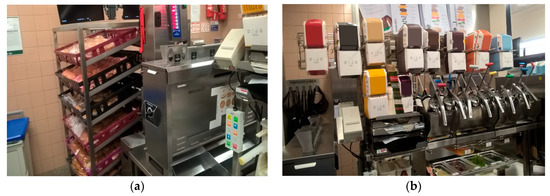
Figure 3.
Areas in the restaurant: (a) an initiation work station with a roll rack; (b) packaging racks.
After the roll leaves from the toaster, it is placed in a box and transferred to the garnishing station. At this stage, an appropriate portion of the sauce is applied using a dispenser. Each of them has a corresponding place assigned to the type of sauce. The next stage is the application of specific intermediates in the correct order. The arrangement of containers with intermediate products is not predetermined. Typically, night shift employees arrange containers in line with their experience. This sometimes leads to minor changes in the layout.
After applying the intermediate products, the sandwich goes to the meat warmer stand. Here, inventory is kept for a period of time specified by the organization to maintain quality. The meat levels at the stands are supplemented according to the sales level and projections displayed on the screen. Suggestions for stock levels are updated automatically every 10 min. The system itself compares the designed number of transactions with actual results.
The meat is applied with suitable tongs. Each type of meat has a dedicated tool color compatible with the color of the drawers in which the meat is kept. It was observed that the arrangement of tongs is not specified. The employees usually put tools away at a place which is closer to them. Due to the rotation of work stations, this causes significant delays along this section of the production chain.
Finally, after placing the meat, the sandwich is packed in a special paper pocket and closed in a box in which it was transported throughout the entire production cycle. After packing, it is moved to a special gutter heated by two heating lamps. Here, waiting for pickup by an employee, the order number is printed and transferred to the place of giving it away.
The order is only called when all the ingredients are on the tray along with the additions. It was observed that the arrangement of containers with additives is not fixed. This causes long time delays due to the location process itself.
It should be mentioned that all packages are delivered from the initiator’s work station. Therefore, if the pieces of chicken that require only packaging are ordered, they also have to go through the garnishing table.
The kitchen consists of two mirror production lines. The theoretical capacity of one side is 150 sandwiches per hour. The second side is launched if the value of incoming orders begins to reach the previously presented value.
3.2.1. Descriptions of Intermediates and Products
To maintain the quality of used intermediates, a system of tags describing the shelf life is used. A specially adapted and programmed printer is used for printing. Each of the eight keys has an assigned set of letters. The system is analogous to the writing system in older cell phone models. For example, to select the letter “B”, the “2” key is pressed twice. This involves the need for a long time lost on the description itself.
Table 2 presents a list of all intermediate products used in the kitchen area with secondary times after opening. As it can be seen, many intermediates have the same parameters. Nevertheless, separate labels are used for each one. The name of the tag does not matter from a practical point of view. Best times are the most important. The rest of the manuscript will present a solution that reduces the description system.
Table 2.
Summary of shelf life of intermediate products.
It is also characteristic for the enterprise that new seasonal intermediates are introduced periodically. Most often their shelf-life is identical to one of those in use. During the observation period, red onion had the same parameters as white onion and Lolo lettuce was equivalent to rocket and grated cheese.
Hot drinks produced at the point are also described. A separate printer prints labels for each drink. The stickers are attached to each cup for easier identification of drinks. It was observed that employees often have a problem with sticking a small sticker, which usually falls off when given away.
In addition, it was observed that employees do not need such facilities and use them only out of necessity rather than more of suitability. This causes significant delays in giving out itself.
3.2.2. VSM for the Production Cycle of the “Sandwich + Coffee” Order
For easier visualization of information and materials flow, a value stream map was created on the example of a sandwich and coffee order.
The sandwich will include two portions of sauce, fresh onion, red pepper, lettuce, two slices of tomato, a slice of cheese, and a chicken cutlet. Coffee is made in the style of latte requiring manual foaming of milk with three portions of sugar.
The following VSM drawing (Figure 4) takes into account the times that employees need to take over the product when moving from one work station to another. Times include the period an employee needs to locate the tools.
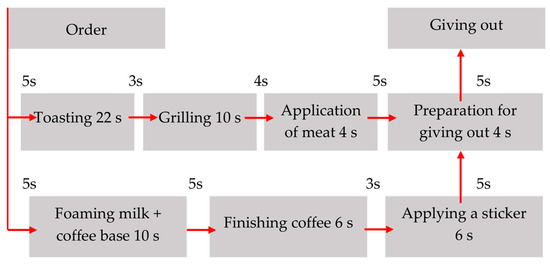
Figure 4.
Value stream mapping (VSM) production of order before modernization.
With the current system, the sandwich production cycle time is 58 s until it can be given out. Coffee production time with all additions such as sugar, stirrer, and lid is 37 s. Activities such as the sticker on the cup or the time needed to find the right tongs do not add value to the customer. These are not activities that give value to his or her order. The most important for the customer is the time after which he or she receives his or her order. In the manuscript, improvements will seek to reduce production cycle time to a minimum of 51 s.
3.3. Scheduling the Operation of Devices
Observations have been conducted since 1 May 2015, i.e., since the opening. The observation period ended on 30 April 2016. Initially, the observations were from the use of individual devices during the whole day of operation of the restaurant.
Data on the number of transactions carried out each day were collected. Thanks to this it was possible to set two periods of the year mentioned earlier.
The company has a rule that all devices are to be started-up from opening to closing of the restaurant. It does not matter whether the equipment can be operated by a sufficient number of personnel. This is the case, for example, on the other side of the kitchen. Some devices are repeated here. At the beginning, the start-up times for individual devices were measured. The results are presented in Table 3.
Table 3.
Start-up times for individual devices.
The start-up time means the time until the device cools down, heats up, or charges. Everything depends on the specification. Refrigerator 1 is used for storing salads and yogurt in the service area. Refrigerator 2 is designed for storing milk for coffee. The table cooler means a device located under the table in the kitchen area. Larger salads are kept there.
The schedule (Table 4) shows the time of device operation in 24 h observed during tests. As it can be seen, most devices are not even turned off when the outlet closes. This is due to the lack of time for unloading or simply forgetfulness of employees. This results in unprofitable energy consumption that gives no added value to products and a customer. The heat emitters should be understood as a French fries packing station and a gutter where ready-made sandwiches roll down.
Table 4.
Device operation schedule in the restaurant.
The grey color in Table 4 indicates the time intervals during which the device is used. The 1 means the whole hour, and smaller numbers mean working time in the form of a decimal hour. The 0 is device off. On the right side there is a full summary of the number of hours of operation of the machine in 24 h. The opening and closing times of the restaurant are marked at the very bottom of the table. There are hourly intervals at the top of the table. A 60 min interval was specially selected. Thanks to this display, new scheduling was possible later.
After analyzing the use of devices in 24 h and the number of staff in 24 h, a new schedule was proposed. It is presented in the next section. The new work schedule was tested for a week. Then the energy consumption in the restaurant was compared with an analogous day with a similar number of transactions. Thanks to this, it was possible to check what impact the changes applied have on energy consumption. The measure was energy consumption for the number of transactions.
4. Results
4.1. Improving the System for Describing Intermediates
An earlier part of the manuscript describes the system for describing intermediates. It was very extensive, and the intermediates were repeated many times. At the beginning, the time taken for all tags to be printed by 15 employees was measured. They were people with various work experience. The employees did not know the purpose of the research.
The average time it took to print all tags was 58.85 s. Considering that the average time of one sandwich production cycle is 59 s, this is a lot. Therefore, it was proposed to create groups of labels describing intermediates with identical times. Thanks to this, it became possible to limit the number of stickers needed. Table 5 presents the proposed breakdown with descriptions. What is more, due to the fact that the shelf life of open packaging of intermediate products are also identical, it was limited to creating one sticker called the cold store.
Table 5.
Changes introduced in the descriptions.
Thanks to the Lean process, the labels were limited to six types. After making the changes, the same employees were asked to reprint the tags.
At the beginning a new principle of descriptions was explained to them. The histogram below (Figure 5) shows the times of new measurements. The line above the bars represents the previous times for a better perception of the difference in times. The average time of new measurements was 10.44 s. This is an 82.5% increase in performance. The red line represents the times before the system was introduced. The time saved in this way can be used to focus on the production itself, not just the description of intermediates. Considering the fact that the description of intermediates takes place even several times within an hour, this is a significant improvement in production.
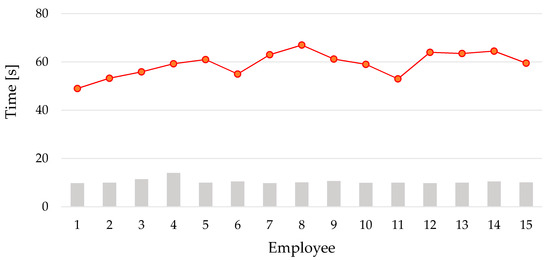
Figure 5.
Time distribution after reducing the tag system.
During the research, it was also proposed to change the colors of the containers from white to the color corresponding to the description on the label.
According to the employees, this would make their work even easier. They came to the conclusion that if the drawers in the heaters have different colors, so can the containers. This proposal was presented while explaining Kaizen’s philosophy to employees. Unfortunately, it rises costs that the organization does not agree to bear at this time.
4.2. Everything Has Its Place
At the examined catering outlet, there are local problems with storage of small equipment used for production. There is the place where the tongs are kept below the meat heaters. Metal for beef is kept in heater number 1. There following colors of tongs are used for each type of fried poultry: white: mild chicken, red: spicy chicken wings, blue: fish, white shovel: chicken pieces.
Before the solution was introduced, there was no rule for storing the tongs. Everyone put them in a random place. The photo below shows one of the randomly selected tongs before applying 5S tools (Figure 6a) and after applying 5S tools (Figure 6b).
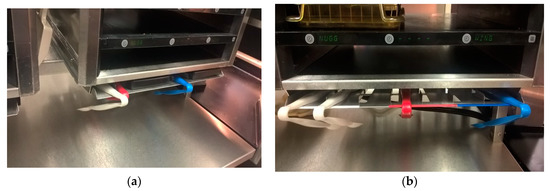
Figure 6.
The system of tongs: (a) before applying 5S; (b) after applying 5S.
Figure 6b presents the following layout: white, red blue; in line with the “used more often are stored closer” principle. To make it easier to assign space for individual tongs, the recesses were marked with the same color. The 5S rule was applied saying that everything is in place and the work stations are to be ordered. White is most commonly used, so to improve production continuity, it was proposed to increase the number of tongs to two.
At the beginning, the frequency of using individual grippers for meat fried in fat was examined. The time of day was randomly selected and the frequency of use of each color was calculated for 50 successively ordered products. Beef products were not counted. Ten such measurements were made during the month. The measurement results are presented below (Table 6).
Table 6.
Frequency of using the tongs.
The result is that there are no problems when it comes to beef tongs because there is only one type. The most commonly used tongs are white, then red, and rarely blue.
Measurements of times needed by an employee to locate the tongs and reach for selected meat were also made. The measurement was carried out when the sandwich was taken from the garnishing station. It was important that an employee was freshly placed. This means that he or she did not work in this position a few minutes earlier. He or she did not know the layout of tongs before he or she started work. It was a simulation of the situation when the rotation of positions occurs. The average duration of this activity was 3.16 s. It should be noted that this is only the time to reach for meat. At this station, one must additionally add time to pack the whole sandwich.
The measurement was repeated after introducing the 5S rule. The group of surveyed employees had been acquainted with the system before and the reason for this arrangement was explained. Thanks to this, an employee’s awareness and work culture were also increased. The average time after making changes was 1.76 s. This is a 44.5% increase in performance on this activity.
Interestingly, no employee was shown the reason for marking the place of storage of individual tongs in one color with the same color. Each employee put it away at the previous place. Table 7 below presents the results of measurements before and after the change.
Table 7.
Average times during the test before 5S.
Another improvement was to manage the worktop under the table for unused drawers. It was previously established that all unused tools were stored on a shelf on the other side of the kitchen. This arrangement is managed by the entire organization. This solution works only in cases of even traffic. In the case of jumps in the number of transactions per hour, as is characteristic in the examined outlet, this solution is inefficient. An employee’s movement just to get a new drawer causes a loss of time. The figure below (Figure 7a) shows the place designated during observation for potential storage. It is located directly under the heaters station.
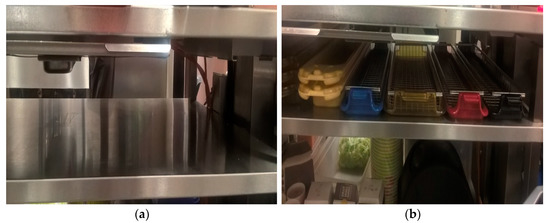
Figure 7.
Management of unused space. (a) Free space designated for storage; (b) space managed upon applying the 5S method.
The solution was introduced after consulting employees. Consultations were held with them regarding the facilities they would like to introduce. Figure 7b shows a system with drawers that are not used during production.
Storage of drawers in this way allows for more flexible production. A person working in a frying station does not waste time moving to the other side of the kitchen when increasing production. The same happens when you reduce a portion of fried meat. Unused drawers are simply hidden under the table.
The possibility of managing the free space was additionally carried out on the heaters themselves. The organization has a rule that all packaging is served by the person initiating the production. This results in a large loss of time on the packaging flow itself for chicken pieces. Likewise, an employee loses time to locate and reach for them. They are located under the garnishing table. This is troublesome due to the large number of moves. It was proposed that the selected packaging should be on meat heaters. The initiator communicates verbally what to pack. The person standing at the position of the heaters confirms the order by reaching for the packaging. Thanks to this he or she knows what to pack. The same applies to tortilla packaging. The packaging often fell during observations. This generated losses in the assortment itself and in time.
Material flow improvements also included the service area. One of them was the change of setting of coffee sprinkles and tools for finishing drinks. The previous imposed system of containers and tools was unfavorable in terms of the time of product preparation. Every time an employee wanted to reach for a spatula to separate foam from milk or a stirrer they had to navigate in a place that was difficult to reach. Whereas, the containers with coffee sprinkles were in a place that took up space and made it difficult to pass the cups with the drink on.
During the observation, it was noticed that more coffees were ordered at the point. This means that you do not need to use sprinkles for them. It was proposed to change places of containers with sprinkles with the containers for tools. Figure 8a,b presents the described situation.
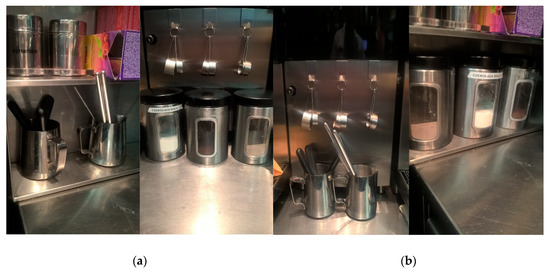
Figure 8.
Settings for coffee sprinkles and drink finishing tools: (a) layout before the change; (b) layout after the changes.
Table 8 shows the times needed to reach for the tools before and after the change. In this case, the time was also measured for 15 employees.
Table 8.
Times of employees.
The average time before changes was 4.4 s. The change brought the acceleration of one activity to the average of 3.19 s.
In order to further reduce coffee preparation time, it was proposed to abandon the coffee labelling system with stickers. The first argument is the very fact of unwillingness to use the system. As it was written earlier, employees are able to recognize coffee visually. The second argument is that during the observation of the position it was not observed once that someone read what is written on the sticker. The average time needed for the sticker to be applied and identified was 4.5 s. The need to use this system is only forced by the top management of the organization. In theory, the system is good. It is worse when it comes to applying it in practice. It is possible that in other parts of the organization it may make sense to use it. At the examined outlet, based on yearly observations, this need was not noticed.
4.3. Solutions Enabling Energy Saving
The first solution was to limit the use of the other side of the kitchen.
The observations carried out at the outlet showed that it is not started-up for most of the day. There are two reasons. The first is no need due to the number of transactions per hour. The theoretical capacity of one side is 150 sandwiches. The second reason is the number of employees in given hours. It was observed that while in the middle of the day there are no problems with it, in the morning and evening the number of staff is insufficient. Previously, the heaters for heating the table were in operation from opening to closing of the outlet. It was proposed that they were operated from 8 a.m. to 8 p.m. The same applies to the evaporator for heating pies. This gives a saving of 50% on the work time of these devices. Another solution is meat heaters. It was observed during the tests, as in the case of the other side of the kitchen, that the slots are not fully utilized. This means that they were unprofitable. Due to the fact that it is possible to reprogram the heaters, it was possible to create a system in which all drawers fit in one. The use of only one heater is recommended from 1 to 4 a.m. and from 8 to 10 p.m. This allows a saving of 6 h of operation.
The grill for frying meat consists of three independent flaps, which are equipped with separate heaters. During the observation period all flaps were set to “AUTO” mode. This means that it was possible to fry any type of beef on each flap. As with meat heaters, it was proposed to turn off one of the flaps when using one heater. This was associated with less demand for production. Flap off times are identical to one heater. It is also possible to turn off some frying chambers. It was observed that it is possible to switch off one of the two chambers for frying fries. The times of switching off are from 9 p.m. to 7 a.m. the following day. As far as the service area is concerned, the possible energy savings are turning off the two refrigerators equipped after closing the restaurant and starting them at 2 a.m. The remaining products would be stored in a refrigerator located in the kitchen area. Each product is always secured and closed. Thanks to this, there is no risk of cross-contamination. It is also possible to switch off one of the coffee machines from 10 p.m. to 3 a.m. This is due to the lower demand for the production of hot drinks.
As for the positions of cash registers, it was observed that the third cash register is only used with full personnel present. It is used only in very heavy traffic. It was proposed that all cash registers were switched off after closing time. The middle cash register can be turned off from 7 p.m. to 9 a.m. the following day. Table 9 presents the new device operation schedule.
Table 9.
New device operation schedule.
In addition, it was proposed to turn off unnecessary lighting, such as all screens of unused cash registers. For example, 0.66 for a grill means that one of the three flaps is turned off during these hours.
In order to check the impact of the new schedule in the context of energy savings, it was applied for one week. These were the days from 8 May 2015 to 14 May 2016. Then energy consumption was compared with days with the same number of transactions. If during the week there was no day with the number of transactions identical to the days of the previous year, the proportion was used. As a result, the estimated energy consumption for a specific number of transactions was known. Access to daily energy consumption on the surveyed days was also possible thanks to the EvoSystem system used by the organization. The results are shown in Table 10. The TC (Transaction Carried) abbreviation stands for the number of transactions carried out during the day.
Table 10.
Comparison of energy consumption during the day with the old and new schedule.
The average daily energy consumptions in the analyzed weeks are 663 kWh per week after Lean Management implementation and 690 kWh for the week prior to LM implementation. It means that introduction of Lean Management procedures caused reduction of CO2 emissions by 3.88% compared to the comparable days of the previous year. It may seem that this is not large enough, but if you consider the scale of the whole year and energy costs, these are measurable savings. Such a result is observed with the use of the device operation schedule without incurring additional costs related to eventual device replacement.
Energy consumption is associated with carbon dioxide emission. The relation is not simple. The amount of CO2 emitted during production of 1 kWh of electricity is strongly dependent upon s.c. energy mix, which means the composition of row energy vectors in a particular region. The data published for various countries [85,86,87] show quite substantial differences between countries. The smallest value 0.013 kgCO2/kWh was reported for Sweden, while the highest of 0.819 kgCO2/kWh was for Estonia, and the value of 0.773 was reported for Poland.
Therefore, the average daily CO2 emission form the analyzed restaurant located in Poland was 553.5 kg CO2 prior to, and 533.4 kg CO2 after implementation of Lean Management procedures.
It is also interesting how large the effect of carbon dioxide mitigation would be on a wider scale.
The data [88] given in Table 10 for restaurants of major worldwide chains of fast food restaurants indicates the number of restaurants of particular chain located worldwide. Since neither the distribution of locations in the individual countries nor the energy consumption for each restaurant are specified, it is impossible to compute precisely their energy consumption and to apply correct value of CO2 emission to restaurants located in a particular country. Therefore, at first the global energy consumption of these chains of restaurants was estimated on the basis of values determined for Polish example for the two cases: prior- and post-LM implementation. Results of this estimation are given in Table 11.
Table 11.
Number of Restaurants belonging to a particular chain located globally for two examples of energy consumption by individual restaurant and estimates of their daily energy consumption.
Further, the maximum, and minimum values of emissions (corresponding to Sweden and Finland) were applied to all enterprises in order to roughly estimate the worldwide CO2 emission limits from this source. This gives four cases corresponding to both variants of individual energy consumption, and two values of carbon dioxide emission per 1kWh of electricity. Results of this estimation presented in millions metric tons of CO2 are given in the Table 12.
Table 12.
Estimations of daily emission of carbon dioxide for world-wide distributed restaurants of particular chains.
Finally, the year’s decrease of carbon dioxide emission can be computed for both cases of low and high values of emission corresponding to 1 kWh of electricity. Those estimates are 32.99 Mt CO2 for the lowest case of 0.01 kg CO2/kWh and 2078.97 Mt CO2 for the highest case of emissivity of 0.819 kg CO2/kWh. It is seen that the presented values of carbon dioxide prevented emissions due to only organizational changes introduced to production procedures are substantial and therefore important for the global CO2 inventory.
4.4. New VSM
The Lean Management tools used shortened the production process. Simple organizational changes and a change in employees’ approach resulted in more efficient and faster work. Based on the previous stream flow map and re-measurements after applying Lean tools, a histogram of operating time at the stations was created (Figure 9). The blue line represents the times reached before Lean Management.
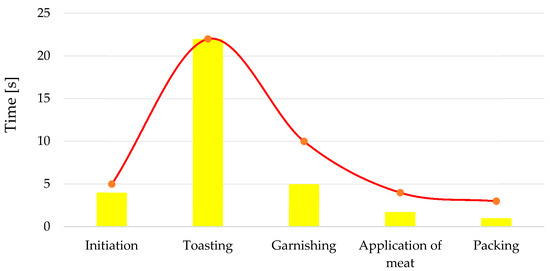
Figure 9.
Histogram of times at work stations.
As it can be seen, it was possible to reduce operating times in almost each of the examined work stations. This was not possible only at the toasting station. It was caused by the quality requirements posed by the organization. Theoretically, it is possible to increase the speed of the motors in the toaster to speed up the process. Unfortunately, then the quality of rolls may decrease. The histogram itself does not include the times of passing between the stations. The time was reduced from 44 to 30 s. To better illustrate the improvement in performance, a new material stream flow map was created (Figure 10). The map refers to the previous case.
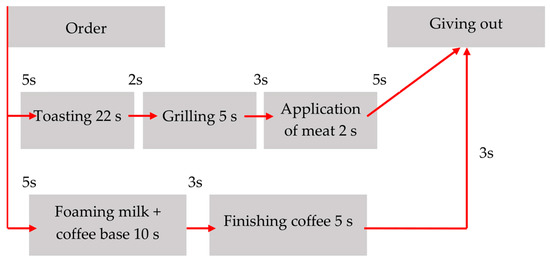
Figure 10.
New VSM after the introduction of Lean tools.
The system of placing stickers on drinks was abandoned. As a result, one of the bottlenecks was eliminated. Mainly, the times of material passing between the stations was shortened. It was possible thanks to the ordering of the work stations and changing the position of some tools and packaging. The principle of packaging administration also had a great impact.
5. Conclusions
The presented research methods give the opportunity to check and improve work organization at the outlet. The conducted research provided measurable and appreciable benefits in the researched restaurant. Lots of the solutions were introduced permanently. Some, after presenting this work, are still consulted with the highest management level of the company.
- As presented in the research results, it is possible to apply many Lean Management tools at the examined outlet. They allow for speeding up the entire production cycle by up to 23%. Creating a value stream map (VSM) allowed to eliminate some activities that significantly prolonged the process. In some cases, the Lean tools have reduced the operating time by almost 70% at the work station.
- It should be emphasized that the key element of implementing Lean Management in the area of production is to understand the flow of how materials move between workstations in the production process. The flow maps presented in the manuscript provided information on what the production looks like today and how it can look, and which parts of the process are flowing smoothly and which require higher level control.
- During the research, it was noticed that the production system itself used by the organization has a number of Lean Management features. Ongoing production is applied. This allows to reduce losses and waste of raw material. The system applied in the kitchen area is a suction system. This means that the material is fed further without going back to other stations. As Kaizen philosophy says, everything is improving. The manuscript proves the sense of this philosophy. Before carrying out the research, the system seemed to already be good. However, it turned out that it could be even better.
- Lean Management also allowed to reduce energy consumption at the outlet. The result of 3.8% less energy consumption, compared to analogous days with the same or similar number of transactions, is satisfactory. Considering the total energy consumption in the company, this gives appreciable profits. Funds obtained in this way can be allocated for further development.
- Scheduling the operation of equipment to reduce electricity consumption has shown great potential for cost reduction in this area of business. Please note that the tools presented in the manuscript were selected individually. Something that is good in one restaurant does not necessarily work in another. Thanks to the fact that all options for setting the work tools and necessary accessories were consulted with the employees, the most optimal and ergonomic positions were achieved. This contributed to a significant improvement in work.
- The reduction of energy consumption is also associated with the reduction of carbon dioxide emissions. The Lean Management procedures implemented globally would have important contributions to mitigation of carbon dioxide emissions.
- Questioning the sense of operation of all devices during the opening hours of the restaurant was discussed by the company’s management. It was met with various opinions, from positive ones to rejections. The success is just triggering a discussion on the topic.
- It should be noted that thanks to the application of Lean Management solutions the company gains at every stage. It responds faster to customer demand and delivers a finished product that costs less. As a result, the company also has smaller losses or limits them to zero. As a result, the Company is more competitive on the market. It should be stressed that the effectiveness of Lean Management solutions will be particularly visible during the crisis in the industry.
In the future, the authors will try to develop the ideas presented in the manuscript in the context of an attempt to implement them and the organizational and technical problems encountered. The lack of understanding of the idea of Lean Management and dissatisfaction with the proposed solutions result from the lack of compliance with the principle that the most important signal about the problem comes from the source, i.e., from the employee from a given position. This signal can never be underestimated. It would be also worth elaborating the application of Artificial Intelligence tools for controlling the working schedules of appliances according to previously determined, and actually adjusted, time dependencies of the number of customers appearing for service.
Author Contributions
Conceptualization, K.T., O.O., M.P.; Methodology, K.T., O.O., M.P.; Validation, K.T., M.P.; Investigation, O.O.; Writing—original draft preparation, K.T., O.O., M.P.; Funding acquisition, O.O. All authors have read and agreed to the published version of the manuscript.
Funding
The research was carried out under financial support obtained from the research subsidy of the Faculty of Engineering Management (WIZ) of Bialystok University of Technology. From the grant No. WZ/WIZ/4/2019 (Olga Orynycz).
Conflicts of Interest
The authors declare no conflict of interest. The funders had no role in the design of the study; in the collection, analyses, or interpretation of data; in the writing of the manuscript; or in the decision to publish the results.
References
- Unver, U.; Kara, O. Energy efficiency by determining the production process with the lowest energy consumption in a steel forging facility. J. Clean. Prod. 2019, 215, 1362–1370. [Google Scholar] [CrossRef]
- Huang, D.; Lv, J. Run-to-run control of batch production process in manufacturing systems based on online measurement. Comput. Ind. Eng. 2020, 106298. [Google Scholar] [CrossRef]
- Nazarko, J.; Czerewacz-Filipowicz, K.; Kuźmicz, A.K. Comparative analysis of the Eastern European countries as participants of the new silk road. J. Bus. Econ. Manag. 2017, 18, 1212–1227. [Google Scholar]
- Kapliński, O.; Peldschus, F.; Nazarko, J.; Kaklauskas, A.; Baušys, R. MCDM, operational research and sustainable development in the trans-border Lithuanian–German–Polish co-operation. Eng. Manag. Prod. Serv. 2019, 11, 7–18. [Google Scholar] [CrossRef]
- Tucki, K.; Orynycz, O.; Świć, A.; Mitoraj-Wojtanek, M. The Development of Electromobility in Poland and EU States as a Tool for Management of CO2 Emissions. Energies 2019, 12, 2942. [Google Scholar] [CrossRef]
- Mikielewicz, D.; Kosowski, K.; Tucki, K.; Piwowarski, M.; Stepien, R.; Orynycz, O.; Wlodarski, R. Gas Turbine Cycle with External Combustion Chamber for Prosumer and Distributed Energy Systems. Energies 2019, 12, 3501. [Google Scholar] [CrossRef]
- Tucki, K.; Mruk, R.; Orynycz, O.; Gola, A. The Effects of Pressure and Temperature on the Process of Auto-Ignition and Combustion of Rape Oil and Its Mixtures. Sustainability 2019, 11, 3451. [Google Scholar] [CrossRef]
- Chiaramonti, D.; Goumas, T. Impacts on industrial-scale market deployment of advanced biofuels and recycled carbon fuels from the EU Renewable Energy Directive II. Appl. Energy 2019, 251, 113351. [Google Scholar] [CrossRef]
- Vanhala, P.; Bergström, I.; Haaspuro, T.; Kortelainen, P.; Holmberg, M.; Forsius, M. Boreal forests can have a remarkable role in reducing greenhouse gas emissions locally: Land use-related and anthropogenic greenhouse gas emissions and sinks at the municipal level. Sci. Total Environ. 2016, 557, 51–57. [Google Scholar] [CrossRef]
- Menten, F.; Chèze, B.; Patouillard, L.; Bouvart, F. A review of LCA greenhouse gas emissions results for advanced biofuels: The use of meta-regression analysis. Renew. Sustain. Energy Rev. 2013, 26, 108–134. [Google Scholar] [CrossRef]
- Venturi, S.; Tassi, F.; Cabassi, J.; Gioli, B.; Baronti, S.; Vaselli, O.; Caponi, C.; Vagnoli, C.; Picchi, G.; Zaldei, A.; et al. Seasonal and diurnal variations of greenhouse gases in Florence (Italy): Inferring sources and sinks from carbon isotopic ratios. Sci. Total Environ. 2020, 698, 134245. [Google Scholar] [CrossRef] [PubMed]
- Lu, Q.; Chai, J.; Wang, S.; Zhang, Z.G.; Sun, X.C. Potential energy conservation and CO2 emissions reduction related to China’s road transportation. J. Clean. Prod. 2020, 245, 118892. [Google Scholar] [CrossRef]
- Caban, J.; Droździel, P.; Vrábel, J.; Šarkan, B.; Marczuk, A.; Krzywonos, L.; Rybicka, I. The research on ageing of glycol-based brake fluids of vehicles in operation. Adv. Sci. Technol. Res. J. 2016, 10, 9–16. [Google Scholar] [CrossRef]
- Kikolski, M.; Ko, C.H. Facility layout design—Review of current research directions. Eng. Manag. Prod. Serv. 2018, 10, 70–79. [Google Scholar] [CrossRef]
- Pereira, O.; Rodríguez, A.; Barreiro, J.; Fernández-Abia, A.I.; De Lacalle, L.N.L. Nozzle design for combined use of MQL and cryogenic gas in machining. Int. J. Precis. Eng. Manuf. Green Technol. 2017, 4, 87–95. [Google Scholar] [CrossRef]
- Pereira, O.; Rodríguez, A.; Fernández-Abia, A.I.; Barreiro, J.; De Lacalle, L.N.L. Cryogenic and minimum quantity lubrication for an eco-efficiency turning of AISI 304. J. Clean. Prod. 2016, 139, 440–449. [Google Scholar] [CrossRef]
- Manan, Z.A.; Nawi, W.N.R.M.; Alwi, S.R.W.; Klemeš, J.J. Advances in Process Integration research for CO2 emission reduction—A review. J. Clean. Prod. 2017, 167, 1–13. [Google Scholar] [CrossRef]
- Henao, R.; Sarache, W.; Gómez, I. Lean manufacturing and sustainable performance: Trends and future challenges. J. Clean. Prod. 2019, 208, 99–116. [Google Scholar] [CrossRef]
- Sousa, P.; Tereso, A.; Alves, A.; Gomes, L. Implementation of project management and lean production practices in a SME Portuguese innovation company. Procedia Comput. Sci. 2018, 138, 867–874. [Google Scholar] [CrossRef]
- Kosowski, K.; Tucki, K.; Piwowarski, M.; Stępień, R.; Orynycz, O.; Włodarski, W. Thermodynamic cycle concepts for high-efficiency power plants. Part B: Prosumer and distributed power industry. Sustainability 2019, 11, 2647. [Google Scholar] [CrossRef]
- Wong, D.T.W.; Ngai, E.W.T. Critical review of supply chain innovation research (1999–2016). Ind. Mark. Manag. 2019, 82, 158–187. [Google Scholar] [CrossRef]
- Cherrafi, A.; Garza-Reyes, J.A.; Kumar, V.; Mishra, M.; Ghobadian, A.; Elfezazi, S. Lean, green practices and process innovation: A model for green supply chain performance. Int. J. Prod. Econ. 2018, 206, 79–92. [Google Scholar] [CrossRef]
- Dziallas, M.; Blind, K. Innovation indicators throughout the innovation process: An extensive literature analysis. Technovation 2019, 80–81, 3–29. [Google Scholar] [CrossRef]
- Calabrese, A.; Castaldi, C.; Forte, G.; Levialdi, N.G. Sustainability-oriented service innovation: An emerging research field. J. Clean. Prod. 2018, 193, 533–548. [Google Scholar] [CrossRef]
- Orji, I.J.; Liu, S. A dynamic perspective on the key drivers of innovation-led lean approaches to achieve sustainability in manufacturing supply chain. Int. J. Prod. Econ. 2018, 107228, in press. [Google Scholar] [CrossRef]
- Ball, P.; Lunt, P. Lean eco-efficient innovation in operations through the maintenance organization. Int. J. Prod. Econ. 2018, 107091. [Google Scholar] [CrossRef]
- De, D.; Chowdhury, S.; Dey, P.K.; Ghosh, S.K. Impact of Lean and Sustainability Oriented Innovation on Sustainability Performance of Small and Medium Sized Enterprises: A Data Envelopment Analysis-based framework. Int. J. Prod. Econ. 2018, 107087. [Google Scholar] [CrossRef]
- Salim, N.; Rahman, M.N.A.; Wahab, D.A. A systematic literature review of internal capabilities for enhancing eco-innovation performance of manufacturing firms. J. Clean. Prod. 2019, 209, 1445–1460. [Google Scholar] [CrossRef]
- Potrich, L.; Cortimiglia, M.N.; De Medeiros, J.F. A systematic literature review on firm-level proactive environmental management. J. Environ. Manag. 2019, 243, 273–286. [Google Scholar] [CrossRef]
- Carney, M.; Zhao, J.; Zhu, L. Lean innovation: Family firm succession and patenting strategy in a dynamic institutional landscape. J. Fam. Bus. Strategy 2019, 10, 1–13. [Google Scholar] [CrossRef]
- Wang, D.D.; Sueyoshi, T. Climate change mitigation targets set by global firms: Overview and implications for renewable energy. Renew. Sustain. Energy Rev. 2018, 94, 386–398. [Google Scholar] [CrossRef]
- Kosowski, K.; Tucki, K.; Piwowarski, M.; Stępień, R.; Orynycz, O.; Włodarski, W.; Bączyk, A. Thermodynamic Cycle Concepts for High-Efficiency Power Plans. Part A: Public Power Plants 60+. Sustainability 2019, 11, 554. [Google Scholar] [CrossRef]
- Mohanty, B. Standby Power Losses in Household Electrical Appliances and Office Equipment. Available online: https://www.un.org/esa/sustdev/sdissues/energy/op/clasp_mohanty.pdf (accessed on 22 February 2020).
- New York State Restaurant Association Education Foundation (NYSRAEF). Green Hospitality Initiative. Available online: http://www.nysra.org/uploads/8/4/9/2/84927158/ghi_green_workbook_updated.pdf (accessed on 22 February 2020).
- Tucki, K.; Orynycz, O.; Wasiak, A.; Świć, A.; Dybaś, W. Capacity market implementation in Poland: Analysis of a survey on consequences for the electricity market and for energy management. Energies 2019, 12, 839. [Google Scholar] [CrossRef]
- The State of Restaurant Sustainability 2018. National Restaurant Association. Available online: https://restaurant.org/Downloads/PDFs/Research/sustainability_report_2018.pdf (accessed on 22 February 2020).
- U.S. Energy Information Administration. The Commercial Buildings Energy Consumption Survey (CBECS). Available online: https://www.eia.gov/consumption/commercial/about.php (accessed on 22 February 2020).
- Wang, Y.F.; Chen, S.P.; Lee, Y.C.; Tsai, C.T. Developing green management standards for restaurants: An application of green supply chain management. Int. J. Hosp. Manag. 2013, 34, 263–273. [Google Scholar] [CrossRef]
- Tekez, E.K.; Taşdeviren, G. A Model to Assess Leanness Capability of Enterprises. Procedia Comput. Sci. 2016, 100, 776–781. [Google Scholar] [CrossRef]
- Reduction of Energy Costs. Available online: http://serwis-restauratorski.gastrona.pl/art/article_8982.php (accessed on 22 February 2020).
- Energy-Smart Food for People and Climate—FAO. Available online: http://www.fao.org/3/a-i2454e.pdf (accessed on 22 February 2020).
- Energy Efficiency. 2019. Available online: http://www.biee.org.cn/ueditor/php/upload/file/20191105/1572916632116667.pdf (accessed on 22 February 2020).
- CEO Presentation at EPG 2019—Schneider Electric. Available online: https://www.se.com/ww/en/assets/564/document/15839/epg-presentation-2019.pdf (accessed on 22 February 2020).
- Schubert, F.; Kandampully, J.; Solnet, D.; Kralj, A. Exploring Consumer Perceptions of Green Restaurants in the US. Tour. Hosp. Res. 2010, 10, 286–300. [Google Scholar] [CrossRef]
- Iamkovaia, M.; Arcila, M.; Cardoso Martins, F.; Izquierdo, A. Sustainable Development of Coastal Food Services. Sustainability 2019, 11, 3728. [Google Scholar] [CrossRef]
- Sarmiento, C.V.; Hanandeh, A.E. Customers’ perceptions and expectations of environmentally sustainable restaurant and the development of green index: The case of the Gold Coast, Australia. Sustain. Prod. Consum. 2018, 15, 16–24. [Google Scholar] [CrossRef]
- Filimonau, V.; Lemmer, C.; Marshall, D.; Bejjani, G. Restaurant menu re-design as a facilitator of more responsible consumer choice: An exploratory and preliminary study. J. Hosp. Tour. Manag. 2017, 33, 73–81. [Google Scholar] [CrossRef]
- Nonaka, T.; Shimmura, T.; Fujii, N.; Mizuyama, H. Energy Consumption in the Food Service Industry: A Conceptual Model of Energy Management Considering Service Properties. In Advances in Production Management Systems: Innovative Production Management Towards Sustainable Growth. IFIP Advances in Information and Communication Technology; APMS 2015; Umeda, S., Nakano, M., Mizuyama, H., Hibino, H., Kiritsis, D., von Cieminski, G., Eds.; Springer: Cham, Switzerland, 2015; Volume 460, Available online: https://link.springer.com/chapter/10.1007/978-3-319-22759-7_69 (accessed on 22 February 2020).
- Mikielewicz, J.; Piwowarski, M.; Kosowski, K. Design analysis of turbines for co-generating micro-power plant working in accordance with organic rankine’s cycle. Pol. Marit. Res. 2009, 1, 34–38. [Google Scholar] [CrossRef]
- Goranczewski, B. The energy management systems according to PN-EN ISO 50001:2011 as a tool for rationalising energy management in the commune. J. Mech. Transp. Eng. 2013, 65, 23–35. [Google Scholar]
- Pulakka, S.; Vares, S.; Nykänen, E.; Saari, M.; Häkkinen, T. Lean Production of Cost Optimal Wooden Nzeb. Energy Procedia 2016, 96, 202–211. [Google Scholar] [CrossRef][Green Version]
- Comparison of Consumer Perceptions and Preference Toward Organic Versus Conventionally Produced Foods: A Review and Update of the Literature. Renewable Agric. Food Syst. 2005, 20, 193–205. [CrossRef]
- Vukadinovic, S.; Macuzic, I.; Djapan, M.; Milosevic, M. Early management of human factors in lean industrial systems. Saf. Sci. 2019, 119, 392–398. [Google Scholar] [CrossRef]
- Salehi, F.; Yaghtin, A. Action Research Innovation Cycle: Lean Thinking as a Transformational System. Procedia Soc. Behav. Sci. 2015, 181, 293–302. [Google Scholar] [CrossRef][Green Version]
- Barwitz, N. The relevance of interaction choice: Customer preferences and willingness to pay. J. Retail. Consum. Serv. 2020, 53, 101953. [Google Scholar] [CrossRef]
- Wiśniewski, C. The influence of implementation Lean Manufacturing principles on production efficiency and quality. Probl. Eksploat. 2010, 2, 35–42. [Google Scholar]
- Singh, S.; Kumar, K. Review of literature of lean construction and lean tools using systematic literature review technique (2008–2018). Ain Shams Eng. J. 2019. [Google Scholar] [CrossRef]
- Pearce, A.; Pons, D. Advancing lean management: The missing quantitative approach. Oper. Res. Perspect. 2019, 6, 100114. [Google Scholar] [CrossRef]
- Czerska, J. Doskonalenie Strumienia Wartości, 2nd ed.; Difin: Warszawa, Poland, 2014; pp. 22–300. [Google Scholar]
- The Program on Vehicle and Mobility Innovation (PVMI). Available online: https://pvmi.wharton.upenn.edu/ (accessed on 31 January 2020).
- Beau, K.; Drew, L. The Complete Lean Enterprise. Value Stream Mapping, 1st ed.; Productivity Press: New York, NY, USA, 2015; pp. 10–143. [Google Scholar]
- Costa, L.B.M.; Filho, M.G.; Fredendall, L.D.; Ganga, G.M.D. The effect of Lean Six Sigma practices on food industry performance: Implications of the Sector’s experience and typical characteristics. Food Control 2020, 112, 107110. [Google Scholar] [CrossRef]
- Costa, L.B.M.; Filho, M.G.; Fredendall, L.D.; Paredes, F.J.G. Lean, six sigma and lean six sigma in the food industry: A systematic literature review. Trends Food Sci. Technol. 2018, 82, 122–133. [Google Scholar] [CrossRef]
- Solaimani, S.; Talab, A.H.; Van der Rhee, B. An integrative view on Lean innovation management. J. Bus. Res. 2019, 105, 109–120. [Google Scholar] [CrossRef]
- Kiran, D.R. Total Quality Management. Key Concepts and Case Studies, 1st ed.; Butterworth-Heinemann: Oxford, UK, 2017; pp. 363–372. [Google Scholar]
- Taghizadegan, S. Essentials of Lean Six Sigma, 1st ed.; Butterworth-Heinemann: Oxford, UK, 2017; pp. 59–101. [Google Scholar]
- Schonberger, R.J. The disintegration of lean manufacturing and lean management. Bus. Horiz. 2019, 62, 359–371. [Google Scholar] [CrossRef]
- Marić, B.; Medaković, V. Integration of simulation and lean tools in process of technical systems overhaul—Case study. Ann. Fac. Eng. Hunedoar Int. J. Eng. 2018, 16, 1–4. [Google Scholar]
- Möldner, A.K.; Garza-Reyes, J.A.; Kumar, V. Exploring lean manufacturing practices’ influence on process innovation performance. J. Bus. Res. 2020, 106, 233–249. [Google Scholar] [CrossRef]
- Masuti, P.M.; Dabade, U.A. Lean manufacturing implementation using value stream mapping at excavator manufacturing company. Mater. Today Proc. 2019, 19, 606–610. [Google Scholar] [CrossRef]
- Deshkar, A.; Kamle, S.; Giri, J.; Korde, V. Design and evaluation of a Lean Manufacturing framework using Value Stream Mapping (VSM) for a plastic bag manufacturing unit. Mater. Today Proc. 2018, 5, 7668–7677. [Google Scholar] [CrossRef]
- Romero, L.F.; Arce, A. Applying Value Stream Mapping in Manufacturing: A Systematic Literature Review. IFAC-PapersOnLine 2017, 50, 1075–1086. [Google Scholar] [CrossRef]
- De Steur, H.; Wesana, J.; Dora, M.K.; Pearce, D.; Gellynck, X. Applying Value Stream Mapping to reduce food losses and wastes in supply chains: A systematic review. Waste Manag. 2016, 58, 359–368. [Google Scholar] [CrossRef]
- Morlock, F.; Meier, H. Service Value Stream Mapping in Industrial Product-Service System Performance Management. Procedia CIRP 2015, 30, 457–461. [Google Scholar] [CrossRef]
- Azizi, A.; Manoharan, T. Designing a Future Value Stream Mapping to Reduce Lead Time Using SMED-A Case Study. Procedia Manuf. 2015, 2, 153–158. [Google Scholar] [CrossRef][Green Version]
- Bellgran, M.; Kurdve, M.; Hanna, R. Cost driven Green Kaizen in pharmaceutical production—Creating positive engagement for environmental improvements. Procedia CIRP 2019, 81, 1219–1224. [Google Scholar] [CrossRef]
- Knechtges, P.; Decker, M.C. Application of Kaizen Methodology to Foster Departmental Engagement in Quality Improvement. J. Am. Coll. Radiol. 2014, 11, 1126–1130. [Google Scholar] [CrossRef] [PubMed]
- Veres, C.; Marian, L.; Moica, S.; Al-Akel, K. Case study concerning 5S method impact in an automotive company. Procedia Manuf. 2018, 22, 900–905. [Google Scholar] [CrossRef]
- Recht, R.; Wilderom, C. Kaizen and culture: On the transferability of Japanese suggestion systems. Int. Bus. Rev. 1998, 7, 7–22. [Google Scholar] [CrossRef]
- Maarof, M.G.; Mahmud, F. A Review of Contributing Factors and Challenges in Implementing Kaizen in Small and Medium Enterprises. Procedia Econ. Financ. 2016, 35, 522–531. [Google Scholar] [CrossRef]
- Mano, Y.; Akoten, J.; Yoshino, Y.; Sonobe, T. Teaching KAIZEN to small business owners: An experiment in a metalworking cluster in Nairobi. J. Jpn. Int. Econ. 2014, 33, 25–42. [Google Scholar] [CrossRef]
- Glover, W.J.; Farris, J.A.; Van Aken, E.M.; Doolen, T.L. Critical success factors for the sustainability of Kaizen event human resource outcomes: An empirical study. Int. J. Prod. Econ. 2011, 132, 197–213. [Google Scholar] [CrossRef]
- Leming-Lee, T.S.; Polancich, S.; Pilon, B. The Application of the Toyota Production System LEAN 5S Methodology in the Operating Room Setting. Nurs. Clin. N. Am. 2019, 54, 53–79. [Google Scholar] [CrossRef]
- Omogbai, O.; Salonitis, K. The Implementation of 5S Lean Tool Using System Dynamics Approach. Procedia CIRP 2017, 60, 380–385. [Google Scholar] [CrossRef]
- Abu, F.; Gholami, H.; Saman, M.Z.M.; Zakuan, N.; Streimikiene, D. The implementation of lean manufacturing in the furniture industry: A review and analysis on the motives, barriers, challenges, and the applications. J. Clean. Prod. 2019, 234, 660–680. [Google Scholar] [CrossRef]
- The European Environment Agency (EEA). Available online: https://www.eea.europa.eu/data-and-maps/figures#c0=15&c5=&c15=all&b_start=0 (accessed on 31 January 2020).
- Global Energy & CO2 Status Report 2019. Available online: https://www.iea.org/reports/global-energy-and-co2-status-report-2019/emissions (accessed on 31 January 2020).
- The World’s Largest Fast Food Restaurant Chains. Available online: https://www.worldatlas.com/articles/the-world-s-largest-fast-food-restaurant-chains.html (accessed on 31 January 2020).
© 2020 by the authors. Licensee MDPI, Basel, Switzerland. This article is an open access article distributed under the terms and conditions of the Creative Commons Attribution (CC BY) license (http://creativecommons.org/licenses/by/4.0/).