Article

How Much Energy Efficient are Renewable Energy Sources Cooperatives’ Initiatives?

1
Renewable and Sustainable Energy Systems Lab, School of Environmental Engineering, Technical University of Crete, Kounoupidiana Campus, 73100 Chania, Greece
2
School of Environmental Engineering, Technical University of Crete, Kounoupidiana Campus, 73100 Chania, Greece
*
Author to whom correspondence should be addressed.
Energies 2020, 13(5), 1136; https://doi.org/10.3390/en13051136
Submission received: 2 January 2020 / Revised: 17 February 2020 / Accepted: 25 February 2020 / Published: 3 March 2020
(This article belongs to the Special Issue Sustainable Buildings for Citizens, Cities and Communities)

Abstract

:
In this paper is provided a systematic, in-depth, behavioral analysis of renewable energy sources cooperatives’ members. The analysis proved that in, on hand, there was a noticeable difference in the portion of affection of each proposed intervention on the actual energy consumption, which may be to even ten times more in some cases, and on the other hand, the difference in energy consumption between the analyzed groups was noticeable as well. So, implementing energy efficiency interventions of various types, such as technical support, special tariffs, energy generation schemes, and smart meters, seems to lead to substantial energy reductions to even more than 10%, cumulatively, and reduces the environmental footprint. Additionally, the majority of energy efficiency interventions applied by the renewable energy sources cooperatives are proved to be effective in achieving their primary goal, sensitizing members, and leading them to a more efficient energy consumption behavior (“greener”). The results of the analysis showed that each proposed intervention had played a different but nonetheless significant role in the diminishing of the energy consumption of the members and that there was a noticeable difference in energy consumption between the analyzed groups. The results of the analysis demonstrated more than 22 GWh totally in green consumption, and almost 4500 tons of CO2 saved.

1. Introduction

Energy poverty is proportionally connected to low-income households, energy-inefficient buildings, and high energy costs due to conventional and old-fashioned energy production systems. A typical problematic occurrence is that the energy costs are continually increasing, having a massive effect on the household incomes of vulnerable social groups [1]. Thus, the need to adopt alternative energy sources to supplement and relieve the energy grid is inevitable. The transition towards an energy system powered by renewable energy sources (RES) is ongoing and is reinforced by remarkable progress and achievements in the field of renewable power generation. Such a transition regarding energy infrastructures is a large-scale one and is beyond the control of a single sector or entity [2].
Τhis is where renewable energy systems cooperatives (REScoops) can play a significant and determinant role [3,4]. RES are exploited in households and commercial buildings through several REScoops’ initiatives and are endorsed by their policy agenda. Cooperatives have several competitive benefits in producing, providing, and distributing energy.
The definition of REScoops has been adopted from the International Cooperative Alliance (ICA) Statement on Cooperative Identity 1995. They are usually community-based organizations, and consequently, they deliver local democratic control over energy issues [5,6].
REScoops started to form in the European Union several years ago, offering to their members the opportunity to purchase green energy, such as renewably generated electricity, at reasonable prices. Besides, they were able to become autonomous and independent concerning energy availability. Last, but not least, their members could interact democratically with other members and co-decide the cooperative’s future [7,8].
Furthermore, REScoops offer to discrete populations and companies the opportunity to become renewable power producers and to actively participate in cooperative energy consumption [9,10]. Additionally, REScoops suggest the established framework in order to implicate citizens with social, political, and nevertheless, financial features of RES distribution [11,12]. Last, but not least, there are several cases where REScoops enhance the effort of other systems relevant to RES systems, such as intelligent transportation one [13].
As observed, the members of the contributing REScoops altered their behavior, reducing their final energy consumption, and invested money in order to produce green energy through RES [14,15]. Within the frame of the H2020 REScoop Plus Project, a better understanding is considered, and REScoops fostered this behavioral change employing the actions mentioned above. Energy consumers’ dynamic contribution to conservation activities, and in self-production processes as well, seems to be the primary way to meet the European Commission’s targets for near-zero carbon footprint, 100% green energy consumption, and energy democracy. As the transition to RES is primarily enforced politically, there are immense conflicting interests for value creation locally. This is especially critical given the diverse nature of electricity systems amongst the EU Member States [5,16].
In 2020, the number of REScoops is more than 2,400 worldwide; their members will exceed 650,000 people [17,18,19]. Due to the REScoops’ activity, citizens are finally a key player in the investments and operations regarding RES in several European countries [20]. The number of residential solar system installations is continuously increasing and is going to be increased further due to REScoops activity. There is a typical example of sharing education courses and the experiences acquired through them from several Spanish REScoops that cooperate in such instances. In the meantime, they are also attempting to share and implement new suggestions at both social and political levels. However, they still have a minor presence in their national energy system [4,21].
REScoops have gathered raw data from their attempts during all these years. There is a significant gap regarding the analysis of these specific data and the main conclusions for the effectiveness of the applied practices. This research work attempts to fill this gap by taking advantage of the data of five REScoops, analyzing them, and extracting several statistically proven conclusions. An evaluation of the proposed practices is presented about both the effectiveness of each proposed intervention and for the different categories of data, such as demographic, meteorological, and several more.
The main goals of this research work are:
(a)
to further statistically analyze and evaluate the differentiation of the proposed energy efficiency (EE) interventions in terms of energy consumption amongst the clustered demographic and climate energy-related groups;
(b)
to identify various factors strongly connected with energy consumption, quantifying this correlation. Typical factors are the demographic categories, the meteorological zones, and the proposed interventions of each REScoop, which are presented analytically in this paper;
(c)
to provide a forward-thinking approach employing a systematic, in-depth, analysis of REScoops’ customers and clarify their behavioral details and uncertainties;
(d)
to quantify the share of each proposed intervention for each participated REScoop regarding energy consumption through linear regression models.

2. Presentation of the Methodology

Within this research work, the determined differences in actual consumption are the possible impacts of the assessed EE interventions and are to subsequently reveal and clarify the behavioral characteristics regarding REScoops’ customers and members. A summary of the methodology followed is depicted in Figure 1 (a detailed description of the methodology is given in [12]).
In addition to the existing typical data analysis methodology, our research team organized peer-to-peer meetings with all the involved REScoops to navigate the data mining towards a common data format by supporting, also, the REScoops to improve their organizational data structure; besides, additional missing essential data (meteorological, demographics, geographical, etc.) were collected by official resources or extracted by tools like METEONORM; In order to make secure the data transfer, an individual contract and an FTP file server platform were agreed and established.

2.1. Data Collection and Pre-Processing

A crucial part of the research was REScoops’ data acquisition/collection over a long period (more than a year, at least). For the needs of this work, the research team selected five REScoops, namely: (1) SEV from Italy, (2) Coopernico from Portugal, (3) Som Energia from Spain, (4) Ecopower from Belgium, and (5) Enercoop from France. [17] The data collection process included questionnaire surveys, interviews, meetings with the REScoops’ data collectors/experts, literature review, etc. The process highlighted the importance of the adoption of a common data format (for statistical comparison reasons) by the participating REScoops. The identical proposed data format for all the REScoops ensured the statistical analysis process pragmatics was created by the team and provided to the REScoops. The research team handled the data transmission through an encrypted FTP server, on which only the REScoops’ experts and the research team could have access.

2.2. The Challenges Confronted by REScoops

First, as already mentioned, the most crucial challenge that the research team faced was the heterogeneous format of the recorded data acquired from the REScoops. As an example, the granularity of the stored measurements varied, from 15-min intervals to yearly values, so the proper conversions were to be made.
Another difficulty the research team (and REScoops) had to cope with was the acquisition of several meteorological data. As REScoops are mainly energy companies, they rarely handled and stored weather data such as air temperature, precipitation, and degree days (heating/cooling). Thus, third-party services had to be incorporated to serve such purposes (e.g., exploitation of globally accepted tools, such as METEONORMTM software [12]). REScoops supported, when possible, the efforts of the research team with the submission of several data regarding the weather and the climate of each region.
Besides, there were several problems regarding the demographic data that REScoops provided the research team. Data such as the building’s surface in square meters and the number of residents were crucial for acquiring the normalized consumption indices (compare data of different scales). Such data are not usually publicly available and had to be retrieved with proper-formatted questionnaires sent to each individual household/business. The research team filled in (whenever possible) the missing demographic data using several databases and past research works.
In all cases, the personal data were coded following the General Data Protection Regulation (GDPR), and a particular FTP server procedure was applied for their transfer. The datasets provided by the REScoops are depicted in Table 1.

2.3. Statistical Analysis

The next section describes the statistical methods applied in the analysis; the typical values computed; the variables/characteristics according to which specific clustering of the population were performed; and how the electricity consumption, concerning several ΕΕ interventions (technical support, software solutions, engagement activities, etc.) and implemented/characteristics, was estimated.

Statistical Analysis Tools

First, the (unweighted) mean energy consumption in kWh for various population classifications/groups was calculated. Additionally, it was normalized with respect to other characteristics, e.g., heating degree days (HDDs), which quantified the required energy to heat a building, and it is the number of degrees that a day’s average temperature is below 18oC (base temperature below which buildings need to be heated), building area (m2), etc.
The statistical analysis, mainly on the energy consumption, was based on two main types of classification factors/variables: (1) the EE interventions applied by the REScoops and (2) the available demographic and meteorological data. An in-depth presentation of the results has already been published by the research team [12]. The data were also classified and statistically analyzed concerning characteristics such as:
  • Cooperative and non-cooperative members;
  • Prosumers or non-prosumers;
  • Demographics (number of residents, building area, and building insulation);
  • Meteorological region/zone;
  • Proposed interventions (promotion by using leaflets, technical support, software solutions, engagement activities—such as generation action, empowering action, Dr. Watt, smart meter installation (SMI), etc.);
  • Tariffs (special, flat, or time of use (TOU), baixa tensao normal (BTN) simple, bi- Horário, and tri-Horário);
  • Contract types (residential/commercial);
So, in order to estimate the possible impact of the proposed interventions, the energy consumption between several customer groups/categories was calculated.
The main statistical tools used in the analysis were:
1)
Correlation coefficients: assuming values in the range from −1 to +1, where +1/ −1 indicates the most robust possible “agreement”. Two correlation coefficients were used:
  • The Pearson product-moment correlation coefficient (r and R), a degree of the strength and direction of the linear relationship between two quantitative variables (i.e., monthly bill and heating/cooling degree days);
  • Kendall’s tau (nonparametric), to measure the relationship between rankings of ordinal variables.
2)
Linear regression models:
  • Simple (linear) regression models, to check if there is a relation between two quantitative variables (e.g., actual consumption and average monthly temperature) and to describe the type and the strength of this relationship;
  • Multiple (linear) regression models to check if there is a relationship between a quantitative variable and quantitative/qualitative (categorical) variables. The categorical variables/characteristics (e.g., member or not of the cooperative) are either dichotomous (two possible values) and they are coded as 0 and 1 (if a customer has the characteristic or not) or with at least three distinct values (in this case, a recoding takes place; the new variables resulted are also dichotomous). (All the models constructed and their coefficients are statistically significant at an a = 0.05 significance level.);
3)
ANOVA tests on whether the means of several groups/treatments are different;
4)
The non-parametric chi-square test of independence, in order to determine if there is a significant connection between two nominal (categorical) variables (i.e., meteorological region and SMI users) [22,23].
Besides, regarding the CO2eq, the CO2 emissions embedded in renewable energy technologies are taken into account for the cases of cooperatives that provided data regarding energy production (prosumers). On the other hand, some cooperatives did not have such data, so these emissions are not taken into account. Besides, they could be estimated through a life cycle analysis, which is not among the scopes of this specific study.
The statistical analysis was performed using the statistical software SPSS, version 20 [24,25]).

3. Results

3.1. SEV—Italy

SEV provided data for two (2) representative customers, named school one and school two. Their proposed interventions were a combination of (a) SMI (a software as a service (SaaS) platform to help families and organizations to manage their energy) and (b) the hydraulic balance of optimal temperature (a measure of return flow temperature optimization to optimize the district heating system of the customers and save energy). Data included: (i) school one: 156 monthly measurements, 102 of which were under their proposed intervention use and (ii) school two: 190 monthly measurements, with 139 under the intervention use.
The main conclusions, for both schools, are:
1)
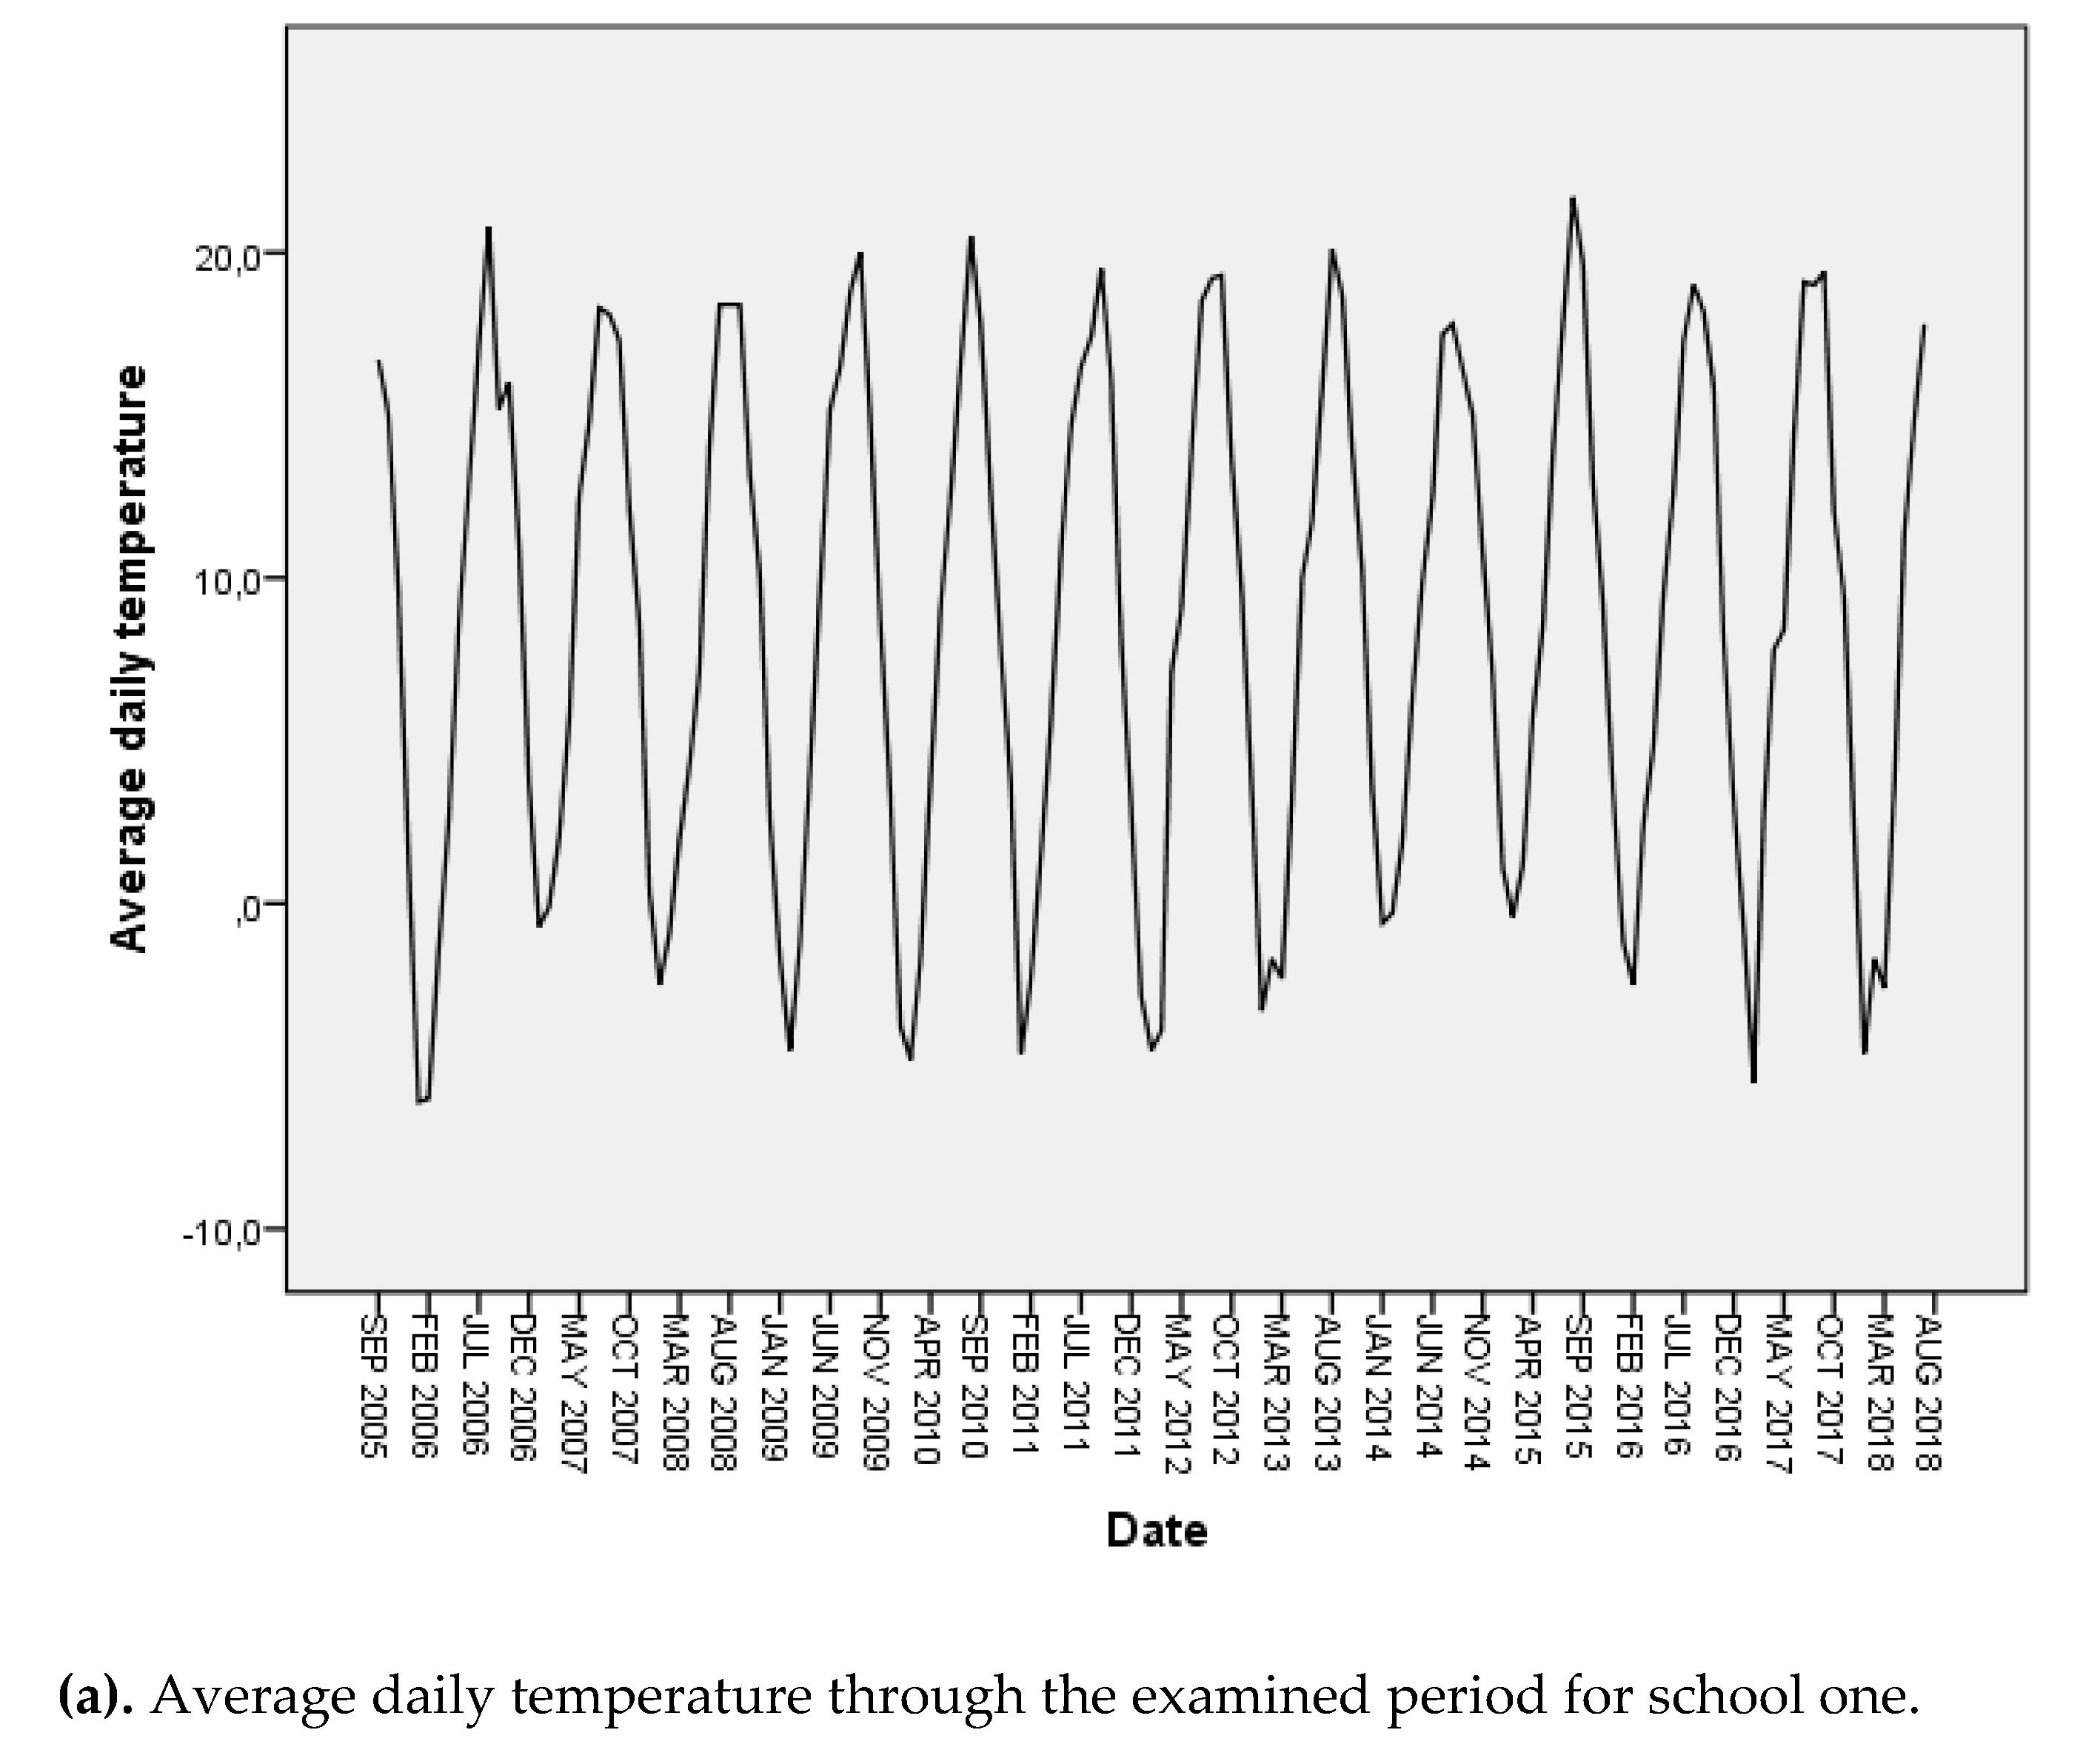
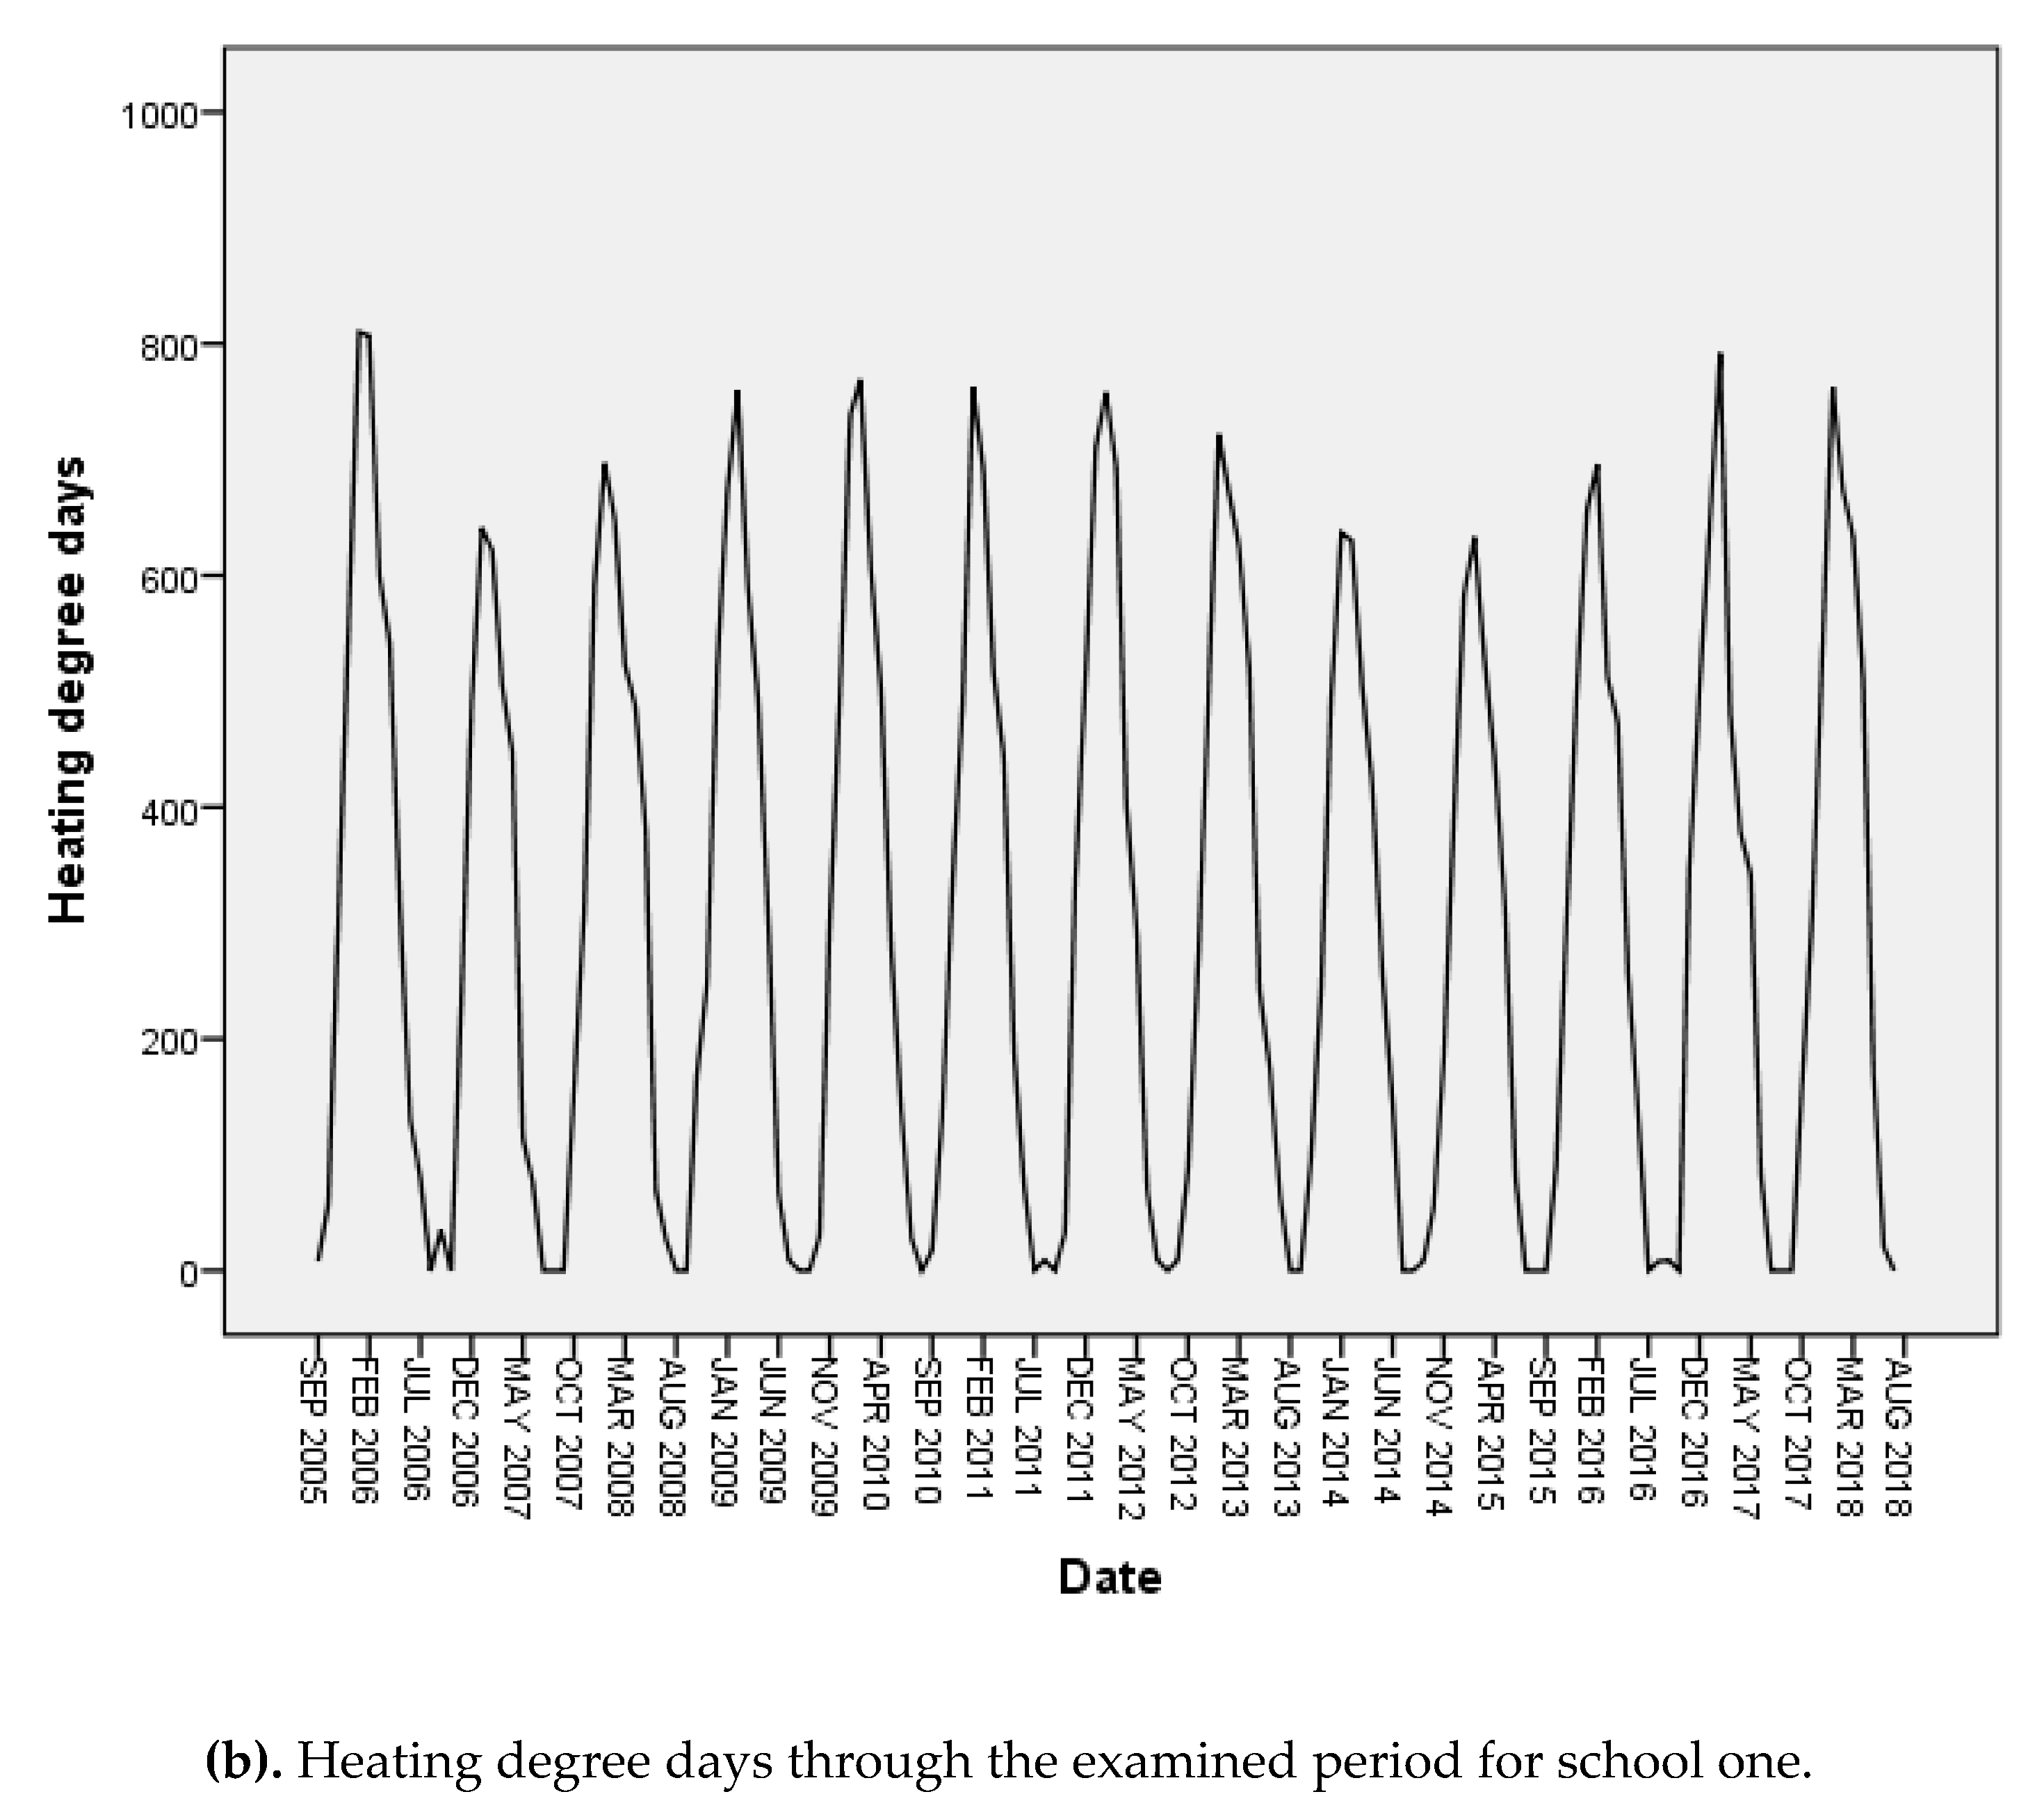
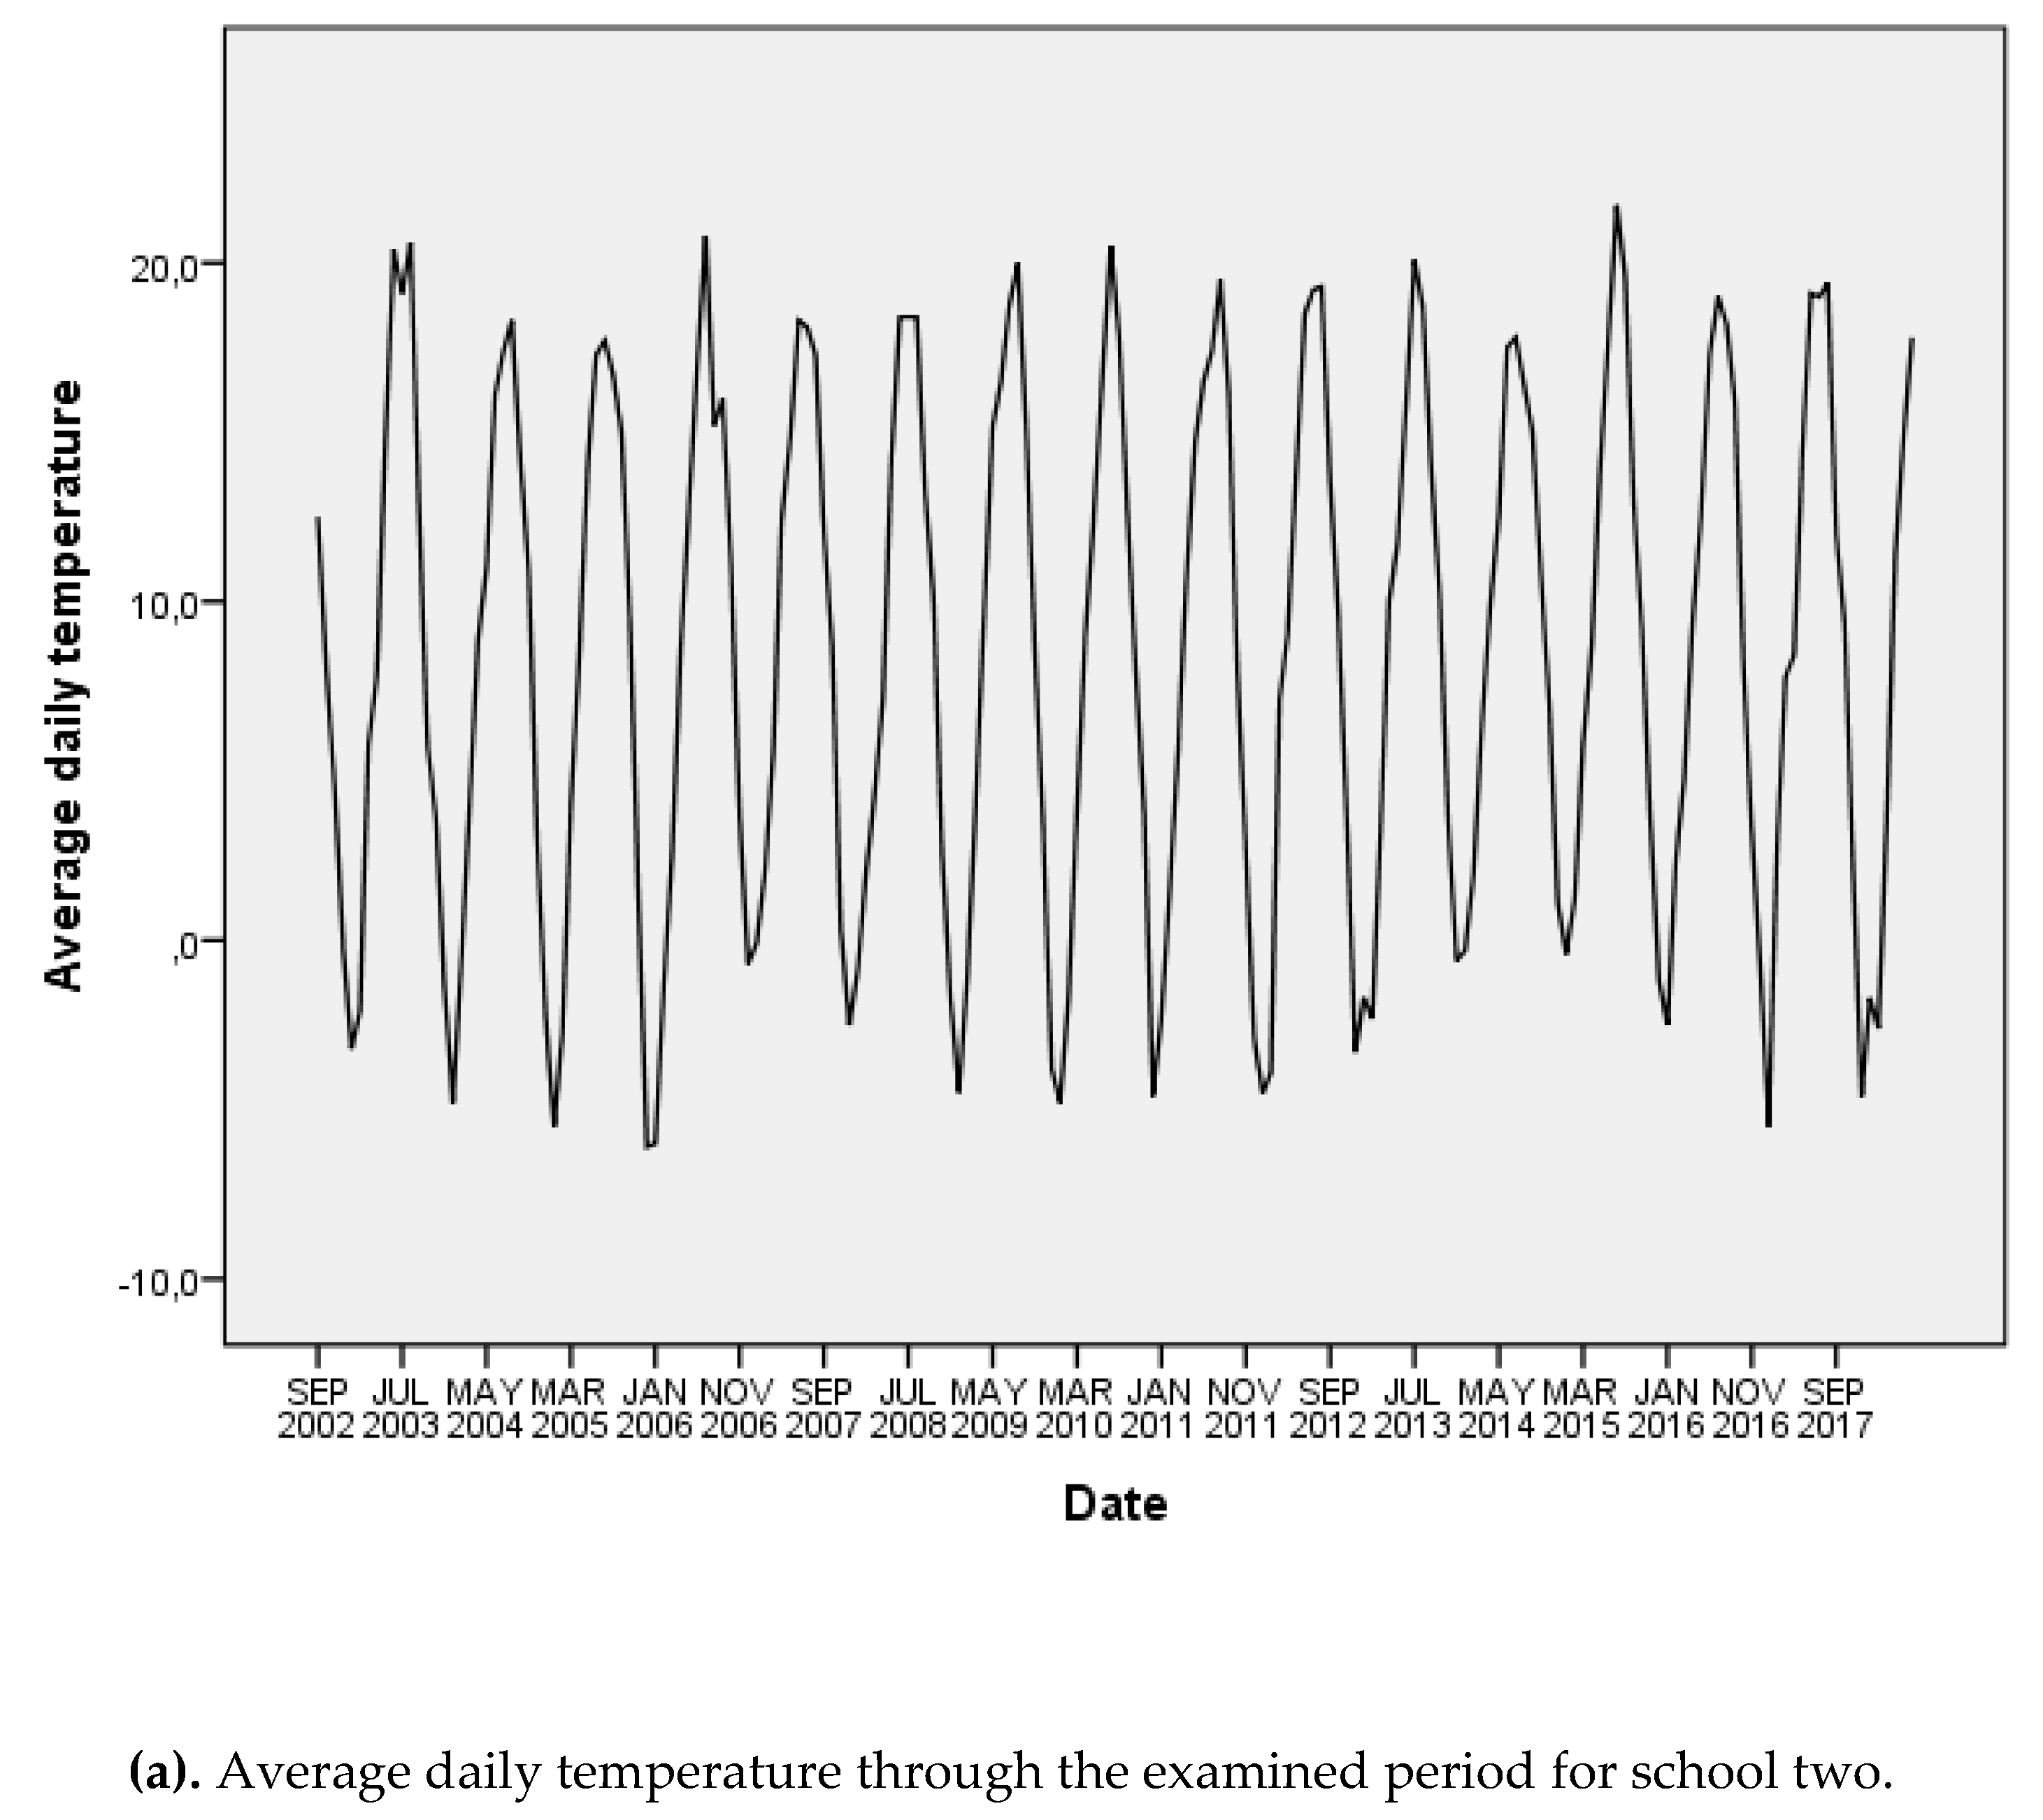
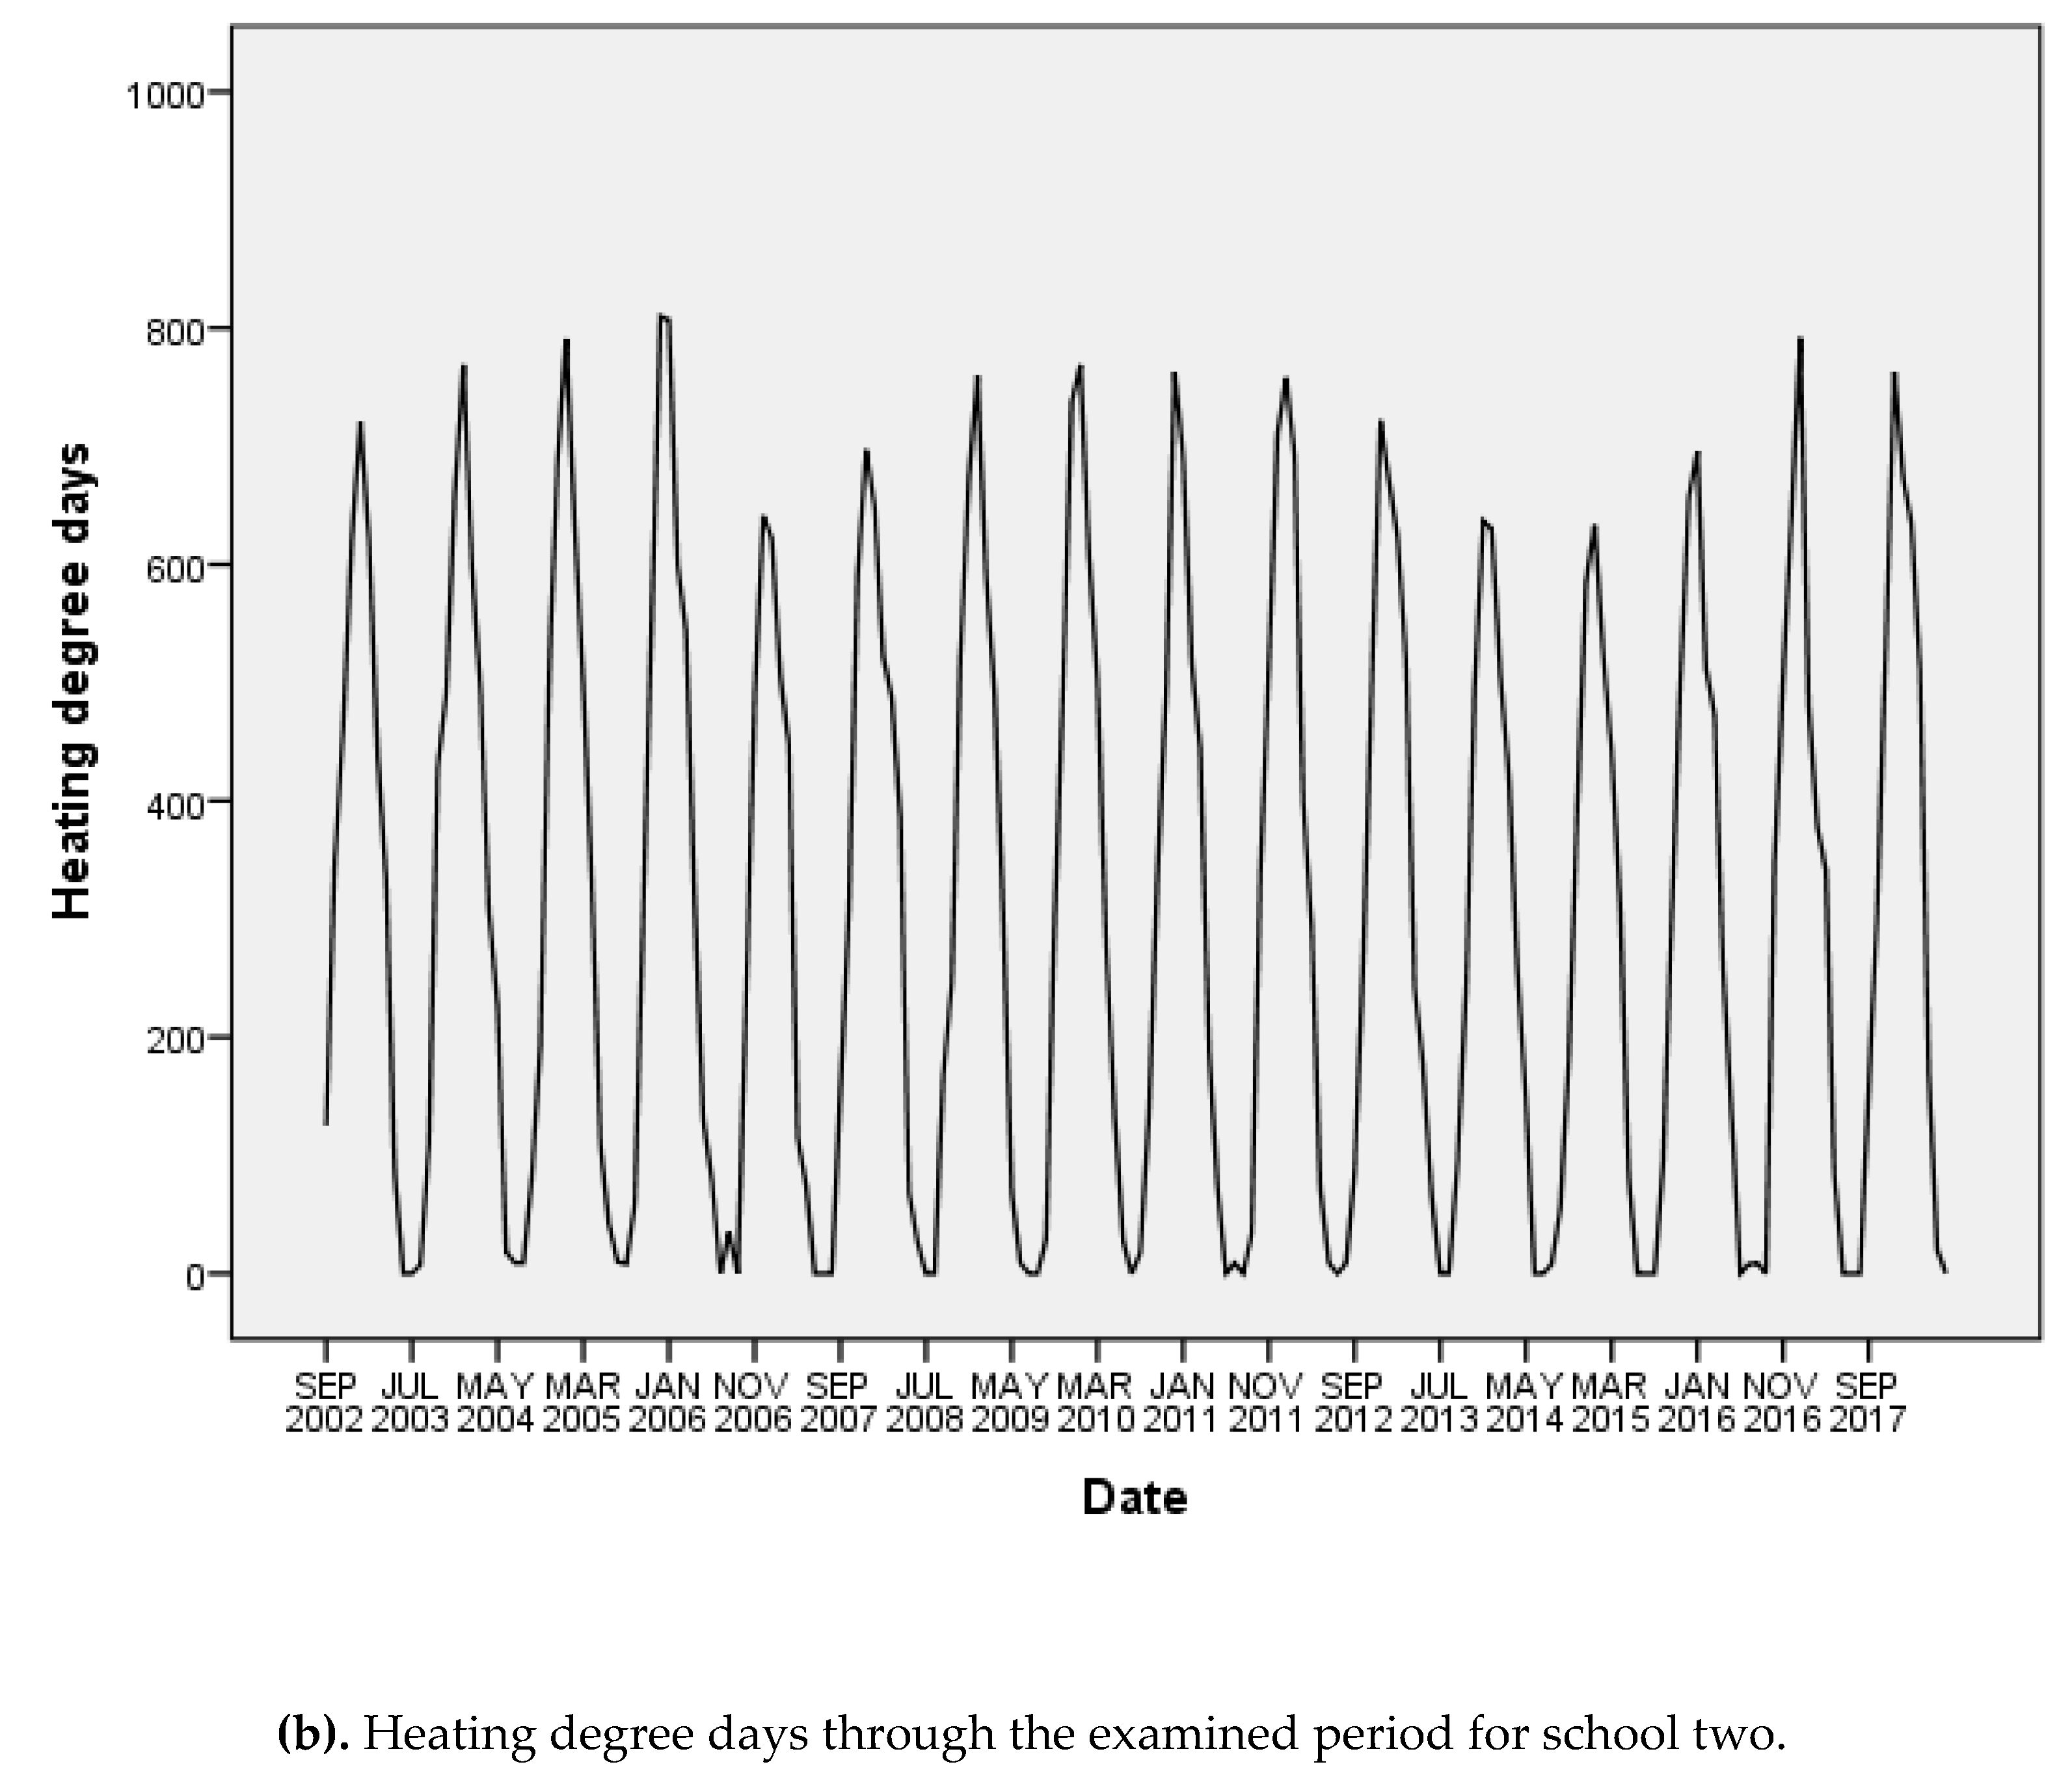
Average daily temperature and HDDs are two (“perfect”) periodic time series (Figure 2a,b and Figure 3a,b). They tend to be reversely proportional, as expected, since HDD indicates the need for heating, and when the temperature increases, this need usually decreases. The lowest temperatures are being observed in December/January and the highest in June; the exact opposite applies to HDDs;
2)
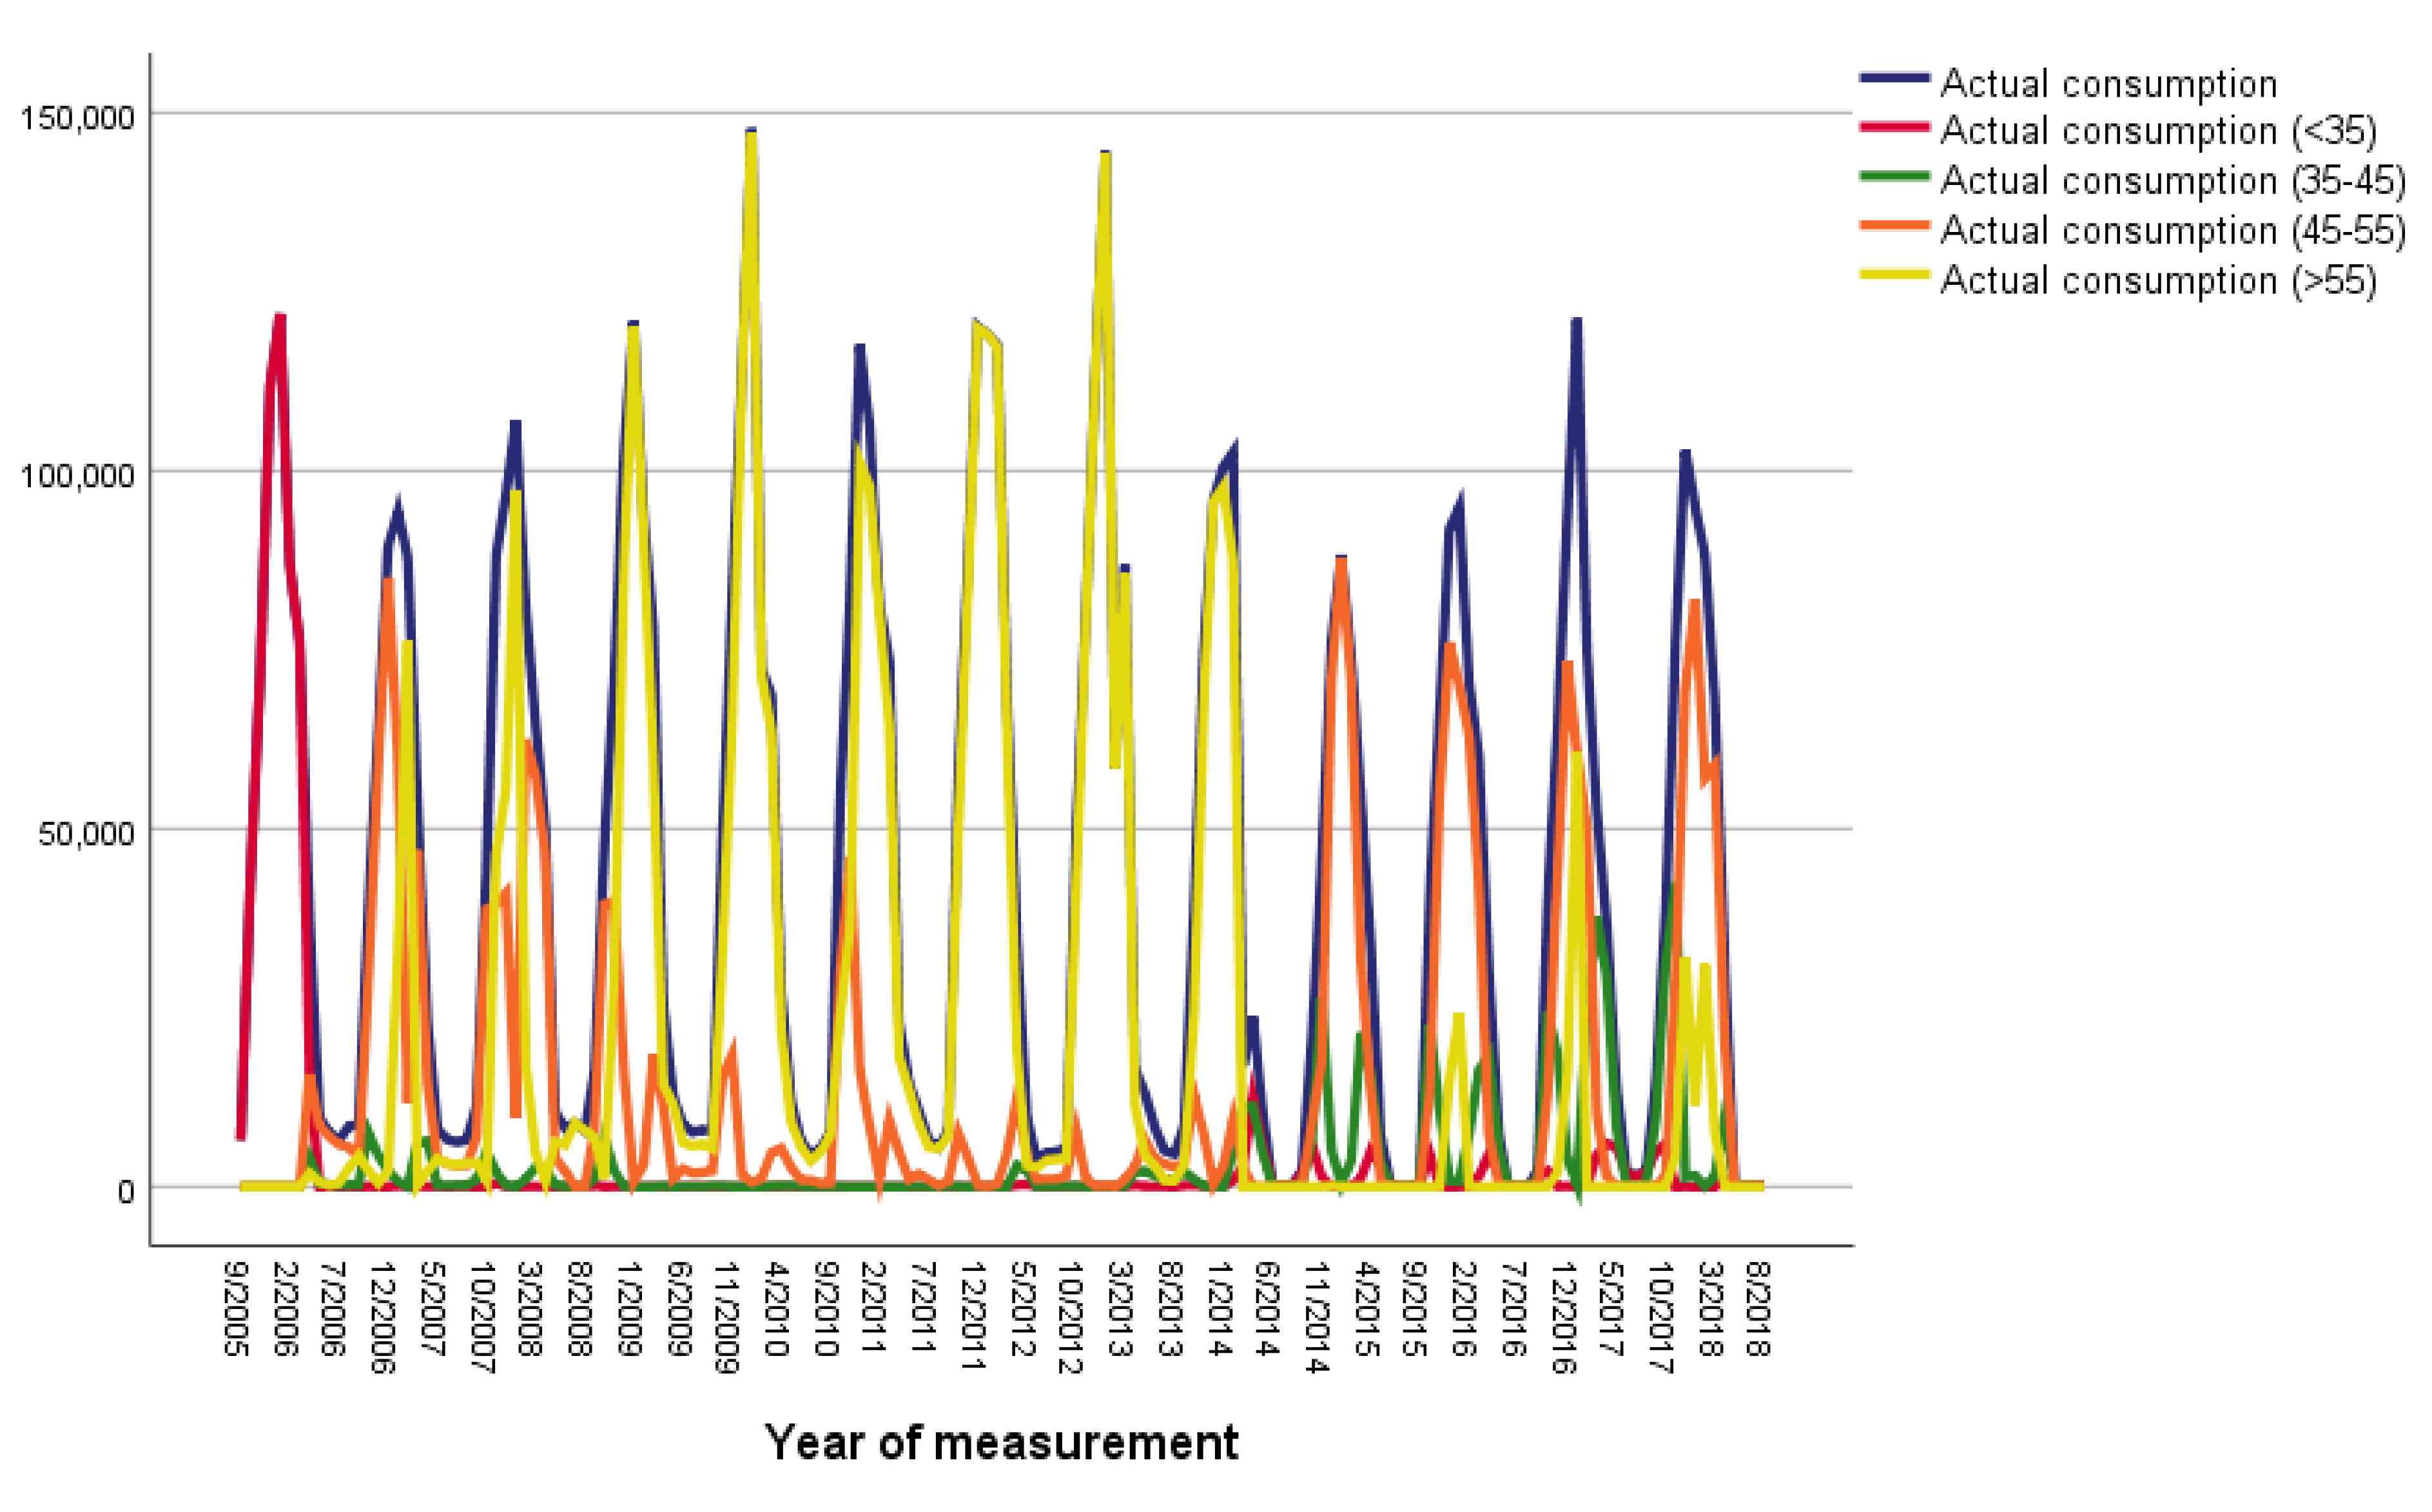
Actual consumption is also a 12-month periodic time series, with the minimum in June and maximum in December/January. The decrease in actual consumption in 2014, 2015, and 2016 winters is noticeable with an unaided eye (Figure 4 and Figure 5);
By observing the figures, it is noticeable, the (expected) strong correlation and synchronization between the average daily temperature/HDDs with the actual consumption.
To review the effectiveness of the applied intervention, the mean actual consumptions before and after the implementation of the intervention were compared (Table 2).

3.2. Coopérnico—Portugal

Coopérnico used for (energy) billing purposes three types of special tariffs: (a) BTN simples, (b) BTN bi-Horário, and (c) BTN tri-Horário.
In order to obtain meaningful results, the population was clustered (strata) concerning specific characteristics such as:
1)
Type of customers;
2)
Meteorological region—zone;
3)
Energy cost—tariffs;
4)
Contracted power.
First, two customer types were provided: (a) particular, 86.2% of Coopérnicos’ members/customers, and (b) commercial, 13.8% of its members/customers (year 2018). Commercial customers consume four times more energy than particular ones (773 to 206 kWh), the difference statistically significant (significance = 0.000, year 2017).
Furthermore, two meteorological regions were examined: zone A and zone B. There is a significant difference in actual consumption between zone A and zone B customers (significance = 0.000, year 2017). Customers located in region A consume almost 31% more energy than those of region B (367.8 kWh for zone A to 252.8 kWh for zone B). Additionally, 87.9% of the customers in zone A are particular ones, and the rest (12.1%) are of commercial category. Regarding zone B, the majority are particular ones (83.8%), while the commercial is 16.2% of the customers.
The relation between the variables “zone” and “tariff” is a dependent one, meaning that the tariff type a customer is treated by depends on the zone he/she belongs (significance = 0.000). The majority of the customers in both zones are simples (64.3% for zone A and 62.4% for zone B).
Dependent are also the variables “customer type” and “tariff type,” meaning that the tariff type a customer is treated by depends on his/her type (significance = 0.000), as shown in Table 3.
Moreover, there was an additional classification of the customers concerning the “contracted power”. It was observed that, as expected, when the contracted power increases, the actual consumption increases also (difference between the groups statistically significant, significance = 0.000, year 2017). The most energy-demanding category is the one with the 41.4 kW contracted power, while the least is the category of the 3.45 kW.
Finally, the variables “contracted power kWh” and “zone” are dependent, which means that if a customer belongs to a particular category of contracted power depends on the zone he/she is located (significance = 0.000). The majority of the customers, in both zones, belong to the 6.9 kWh category.

3.3. Som Energia – Spain

This REScoop provided the actual energy consumption data per customer, their meteorological region-zone, their monthly bill, and data for five types of applied interventions, including (a) special tariffs, (b) promotion by using EE leaflets, (c) SMI, (d) generation action, and (e) empowering action.
Table 4 shows the overall average actual consumption (for cooperative members and non-members). There is a stabilization of the actual consumption, probably due to the implementation of the interventions proposed by the REScoop.
There are two customer types, contract type A and contract type B. (Type A are residential customers and type B are commercial ones.) There is a significant difference (significance = 0.000) on the average consumption between type A and type B customers. Type B customers consume four times more (825 to 214 kWh for type A).
Som Energia members (93.3%) are type A customers and 6.4% type B (for nonmembers, the percentages are 91.6% and 8.4%, respectively).
Furthermore, for the variable “members or not,” possible correlations can be examined regarding the proposed interventions:
(a)
As for “generation action (contract has invested in power plants)”, 6.7% of the total Som Energia members have taken part in generation action (2.4% for nonmembers), which means that the members of the cooperative take part in action 2.5 times more often;
(b)
As for “empowering action (contracted clients have received ΕΕ reports)”, 30.7% of the total Som Energia customers have taken part in empowering action (27.9% for nonmembers), which means that members of the cooperative take part also in empowering action more often;
(c)
As for “tariff type”, the variables special tariffs and member are dependent (significance = 0.000), meaning that the tariff type a customer is being charged by depends if he/she is a member or not. Of those charged with special tariffs, 75.4% are members (70.6% for nonmembers).
Besides, the possible relation between the interventions implemented and the actual consumption was examined.
First, there is a significant difference (significance = 0.000) on the average consumption between SMI users and non-users. SMI users consume on an average 30 kWh less (244 to 272.7 kWh for non-users), and this can be translated to 12.12 kgCO2 per customer.
SMI users (93.4%) are type A (residential), and 6.6% are type B (commercial) (for non-SMI users, the percentages are 92.5% and 7.5%, respectively).
Second, the variable/intervention “charged with special tariffs” is dependent on variables such as:
(a)
SMI (significance = 0.000), meaning that if a consumer is using a smart meter or not, it depends on the tariff type he/she is being charged by; 61.8% of those charged with special tariffs are using SMI (52.4% for those charged without special tariffs);
(b)
“Generation action” (significance = 0.000); i.e., if a consumer is taking part in generation action depends on the tariff type he/she is being charged by; those charged with special tariffs take part in generation action more often (8% to 4.9% for those charged without special tariffs (s.t.));
(c)
“Empowering action” (significance = 0.000); i.e., if a consumer is taking part in empowering action depends on the tariff type he/she is being charged by; those charged with special tariffs take part in empowering action more often (34.3% to 28.9% for those charged without s.t.).
A summary of the difference in actual consumption and the monthly bill charged between the groups with the proposed interventions implemented and those without the interventions can be seen in Table 5.

3.4. Ecopower—Belgium

Ecopower provided the actual energy consumption data per customer; its type; and some demographics (number of residents and building area, etc.). They initiated two types of interventions, namely: (a) promotion by using EE leaflets and (b) EnergieID (smart metering software).
Since the data contain actual consumption of the size (more than) 20,000 kWh/month, the actual median consumption was used (the mean actual consumption is not a reasonable indication/estimate of the actual consumption in this case).
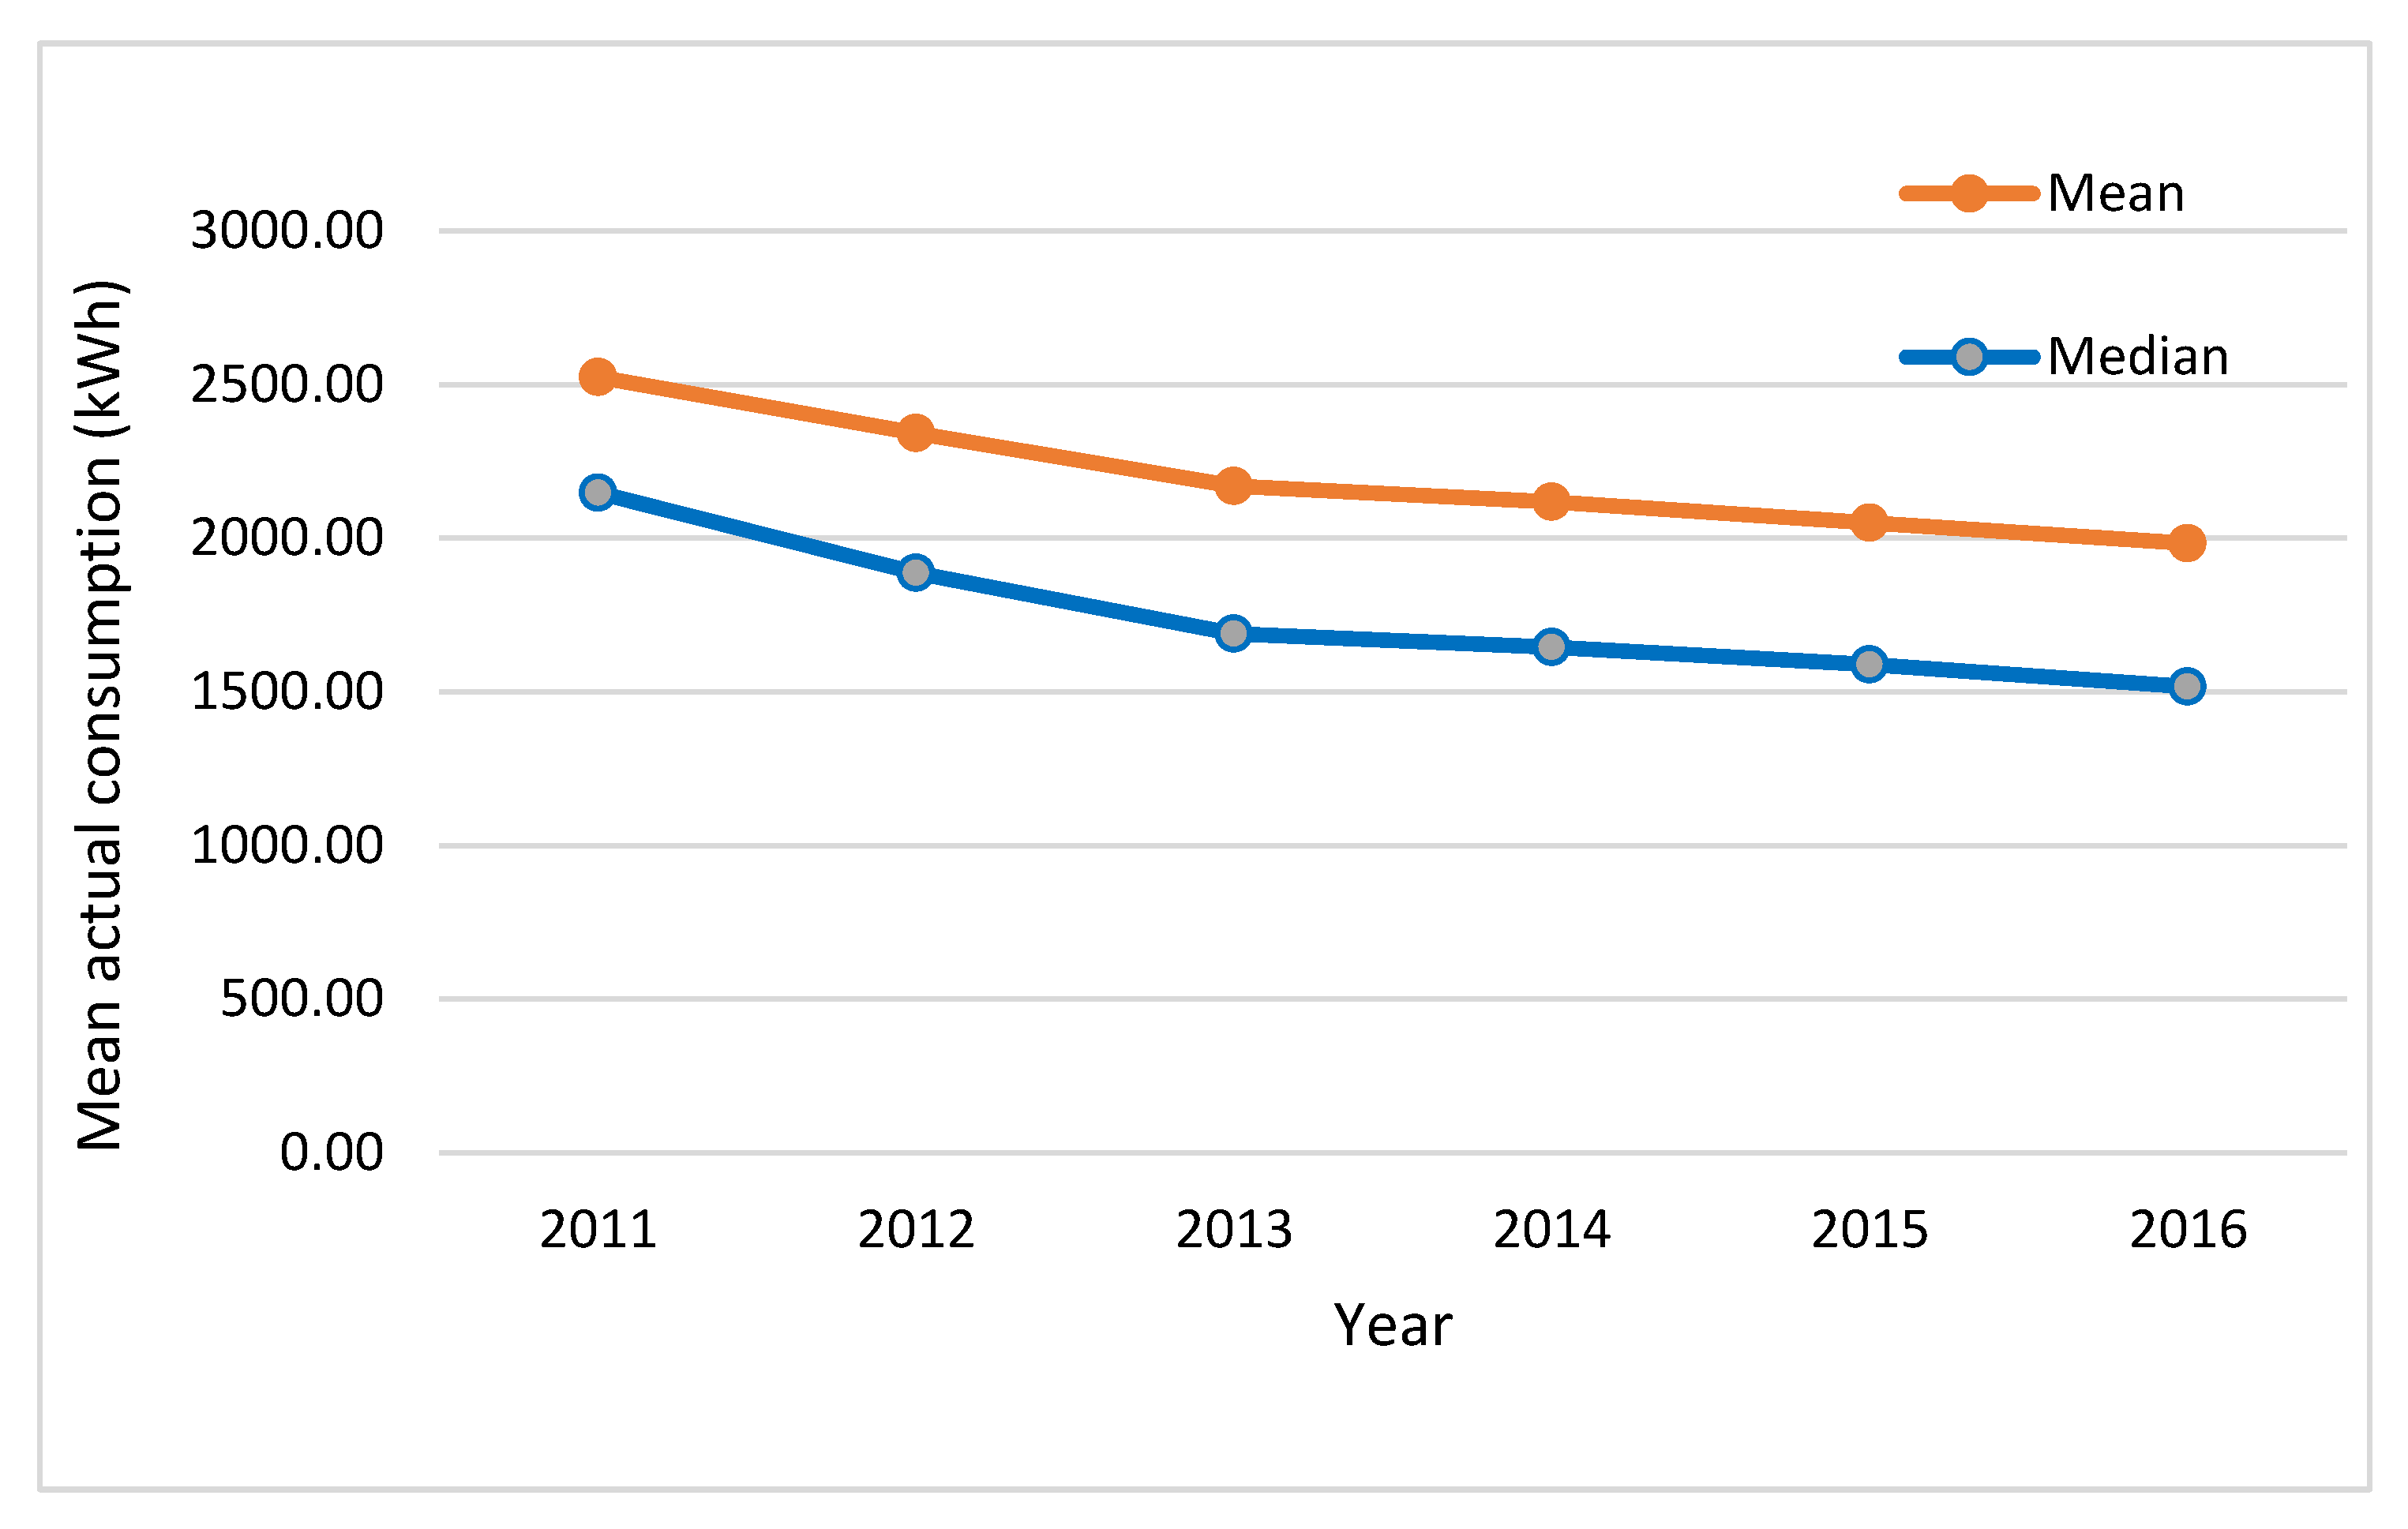
The interventions probably had an impact on customers’ energy consumption (Figure 6), as consumption was reduced by almost 30% since 2012, from 2147 kWh to 1517 kWh (254.52kg CO2 per customer annually).
Furthermore, there is a weak, positive, and significant relationship between the actual consumption and the number of residents (r = 0,148, significance = 0.000). More residents do not necessarily mean a (significant) increase in the actual consumption.
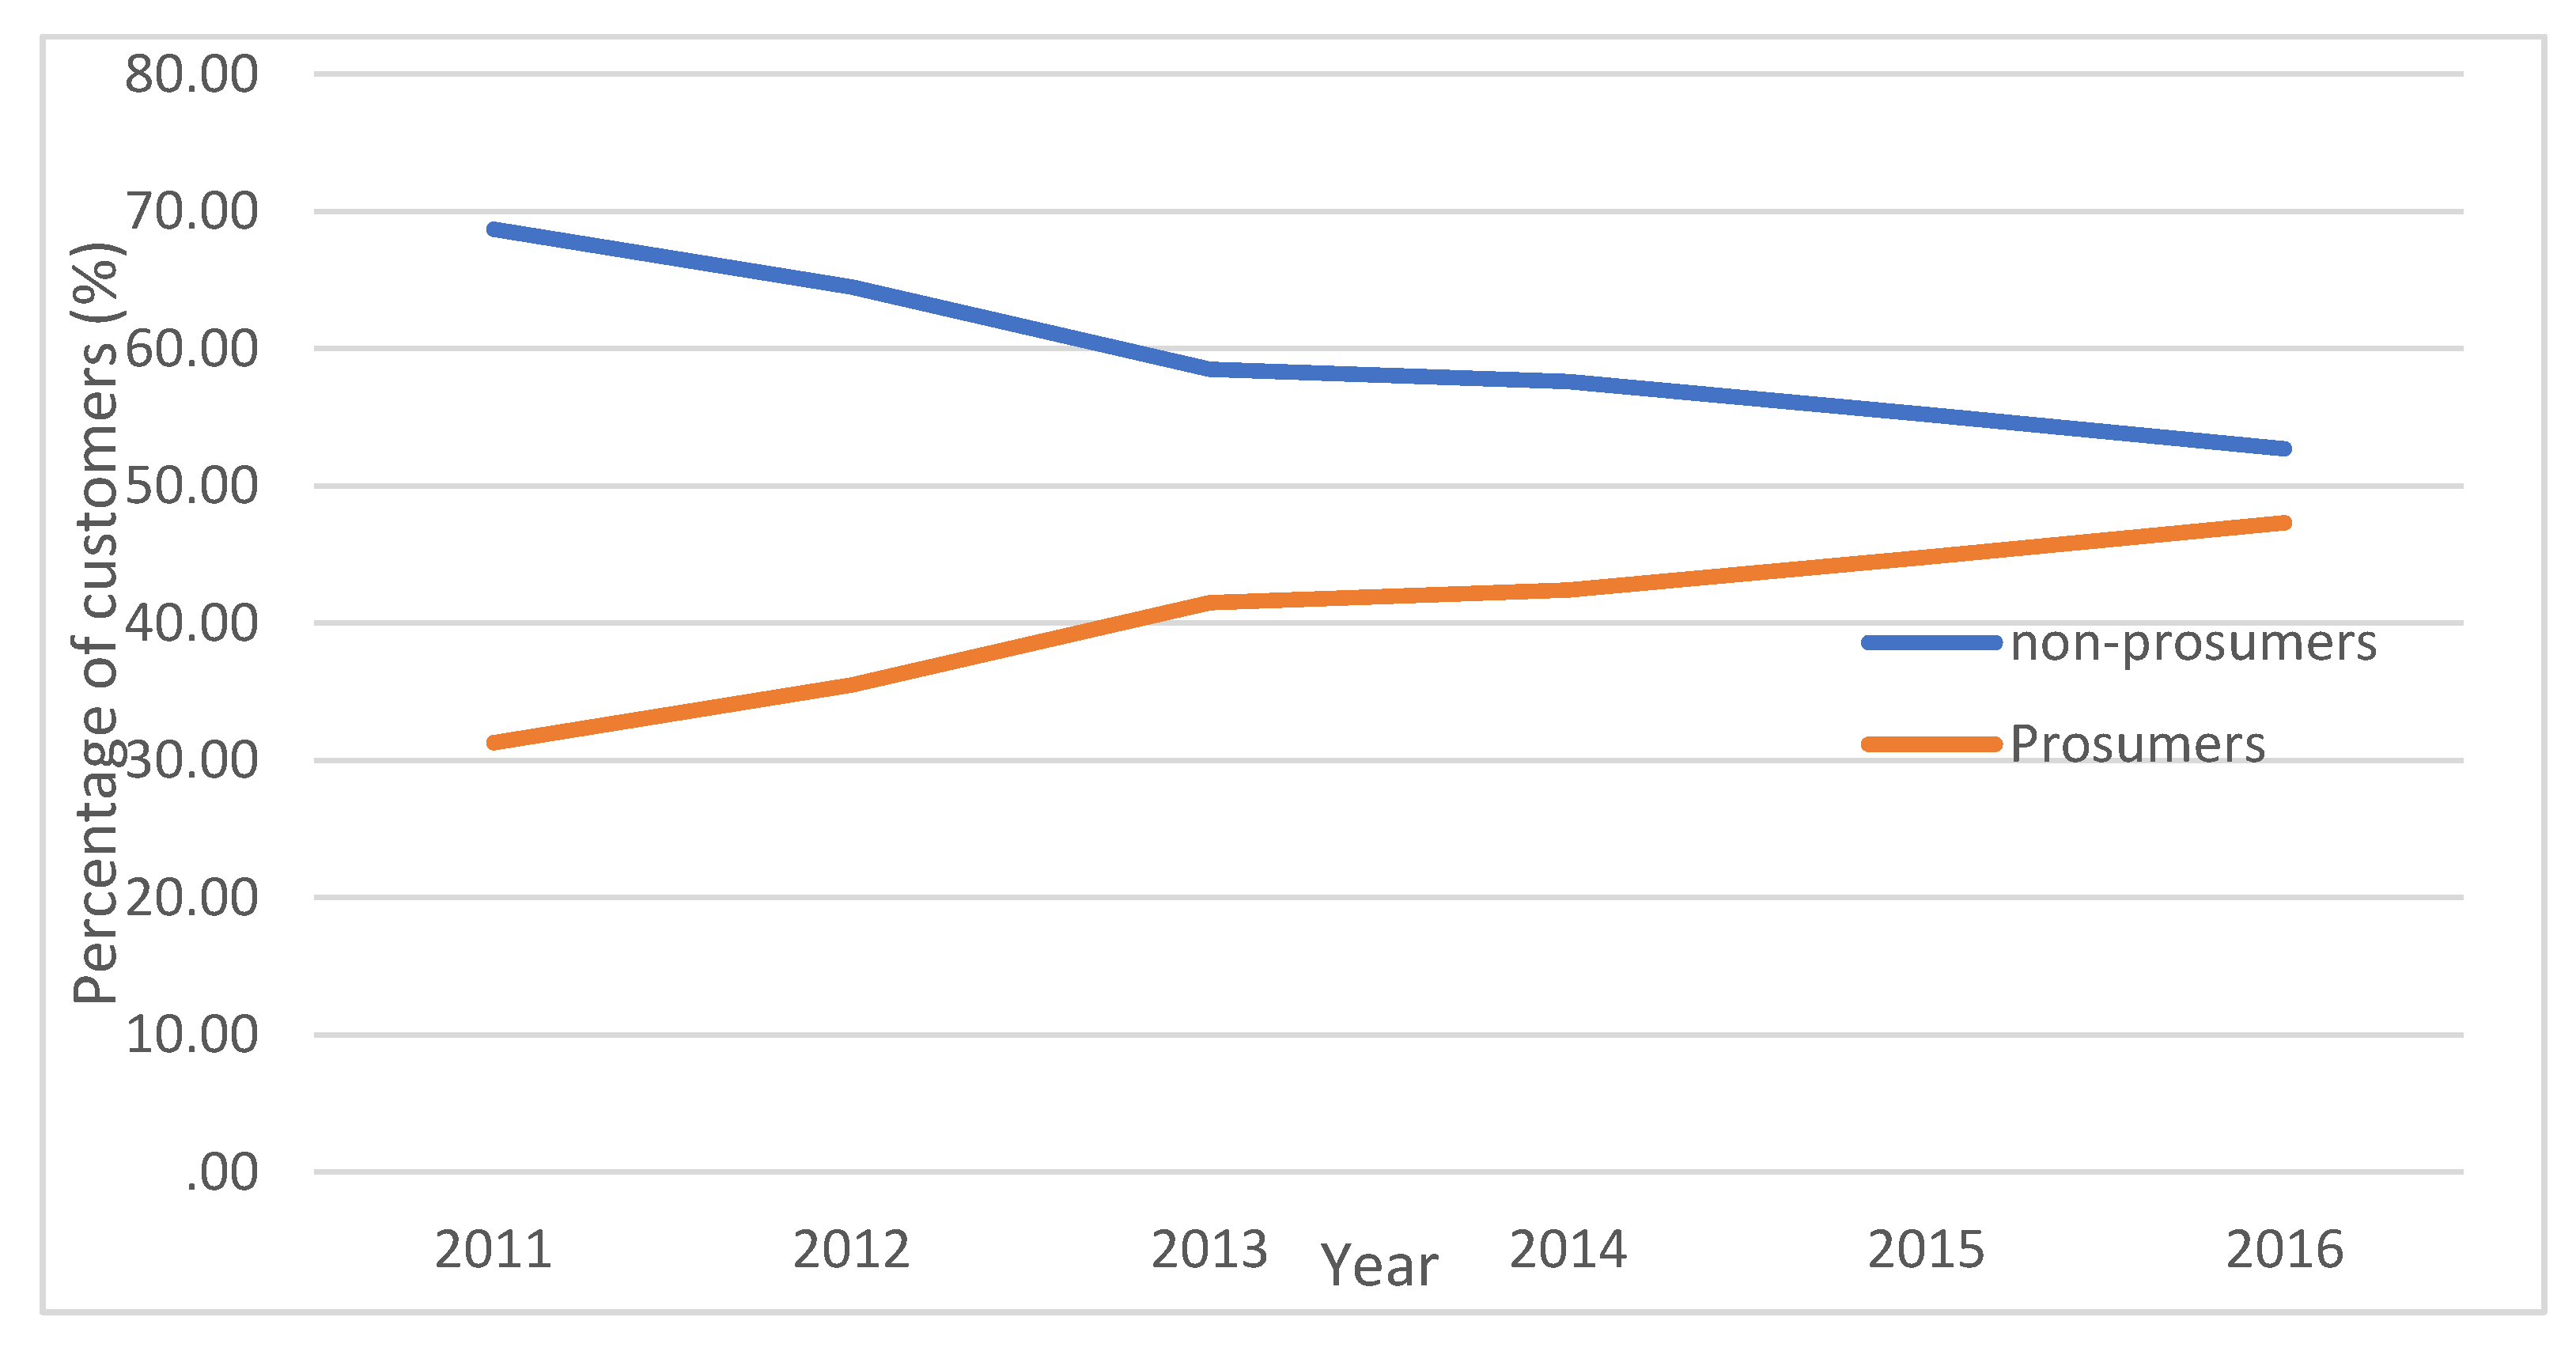
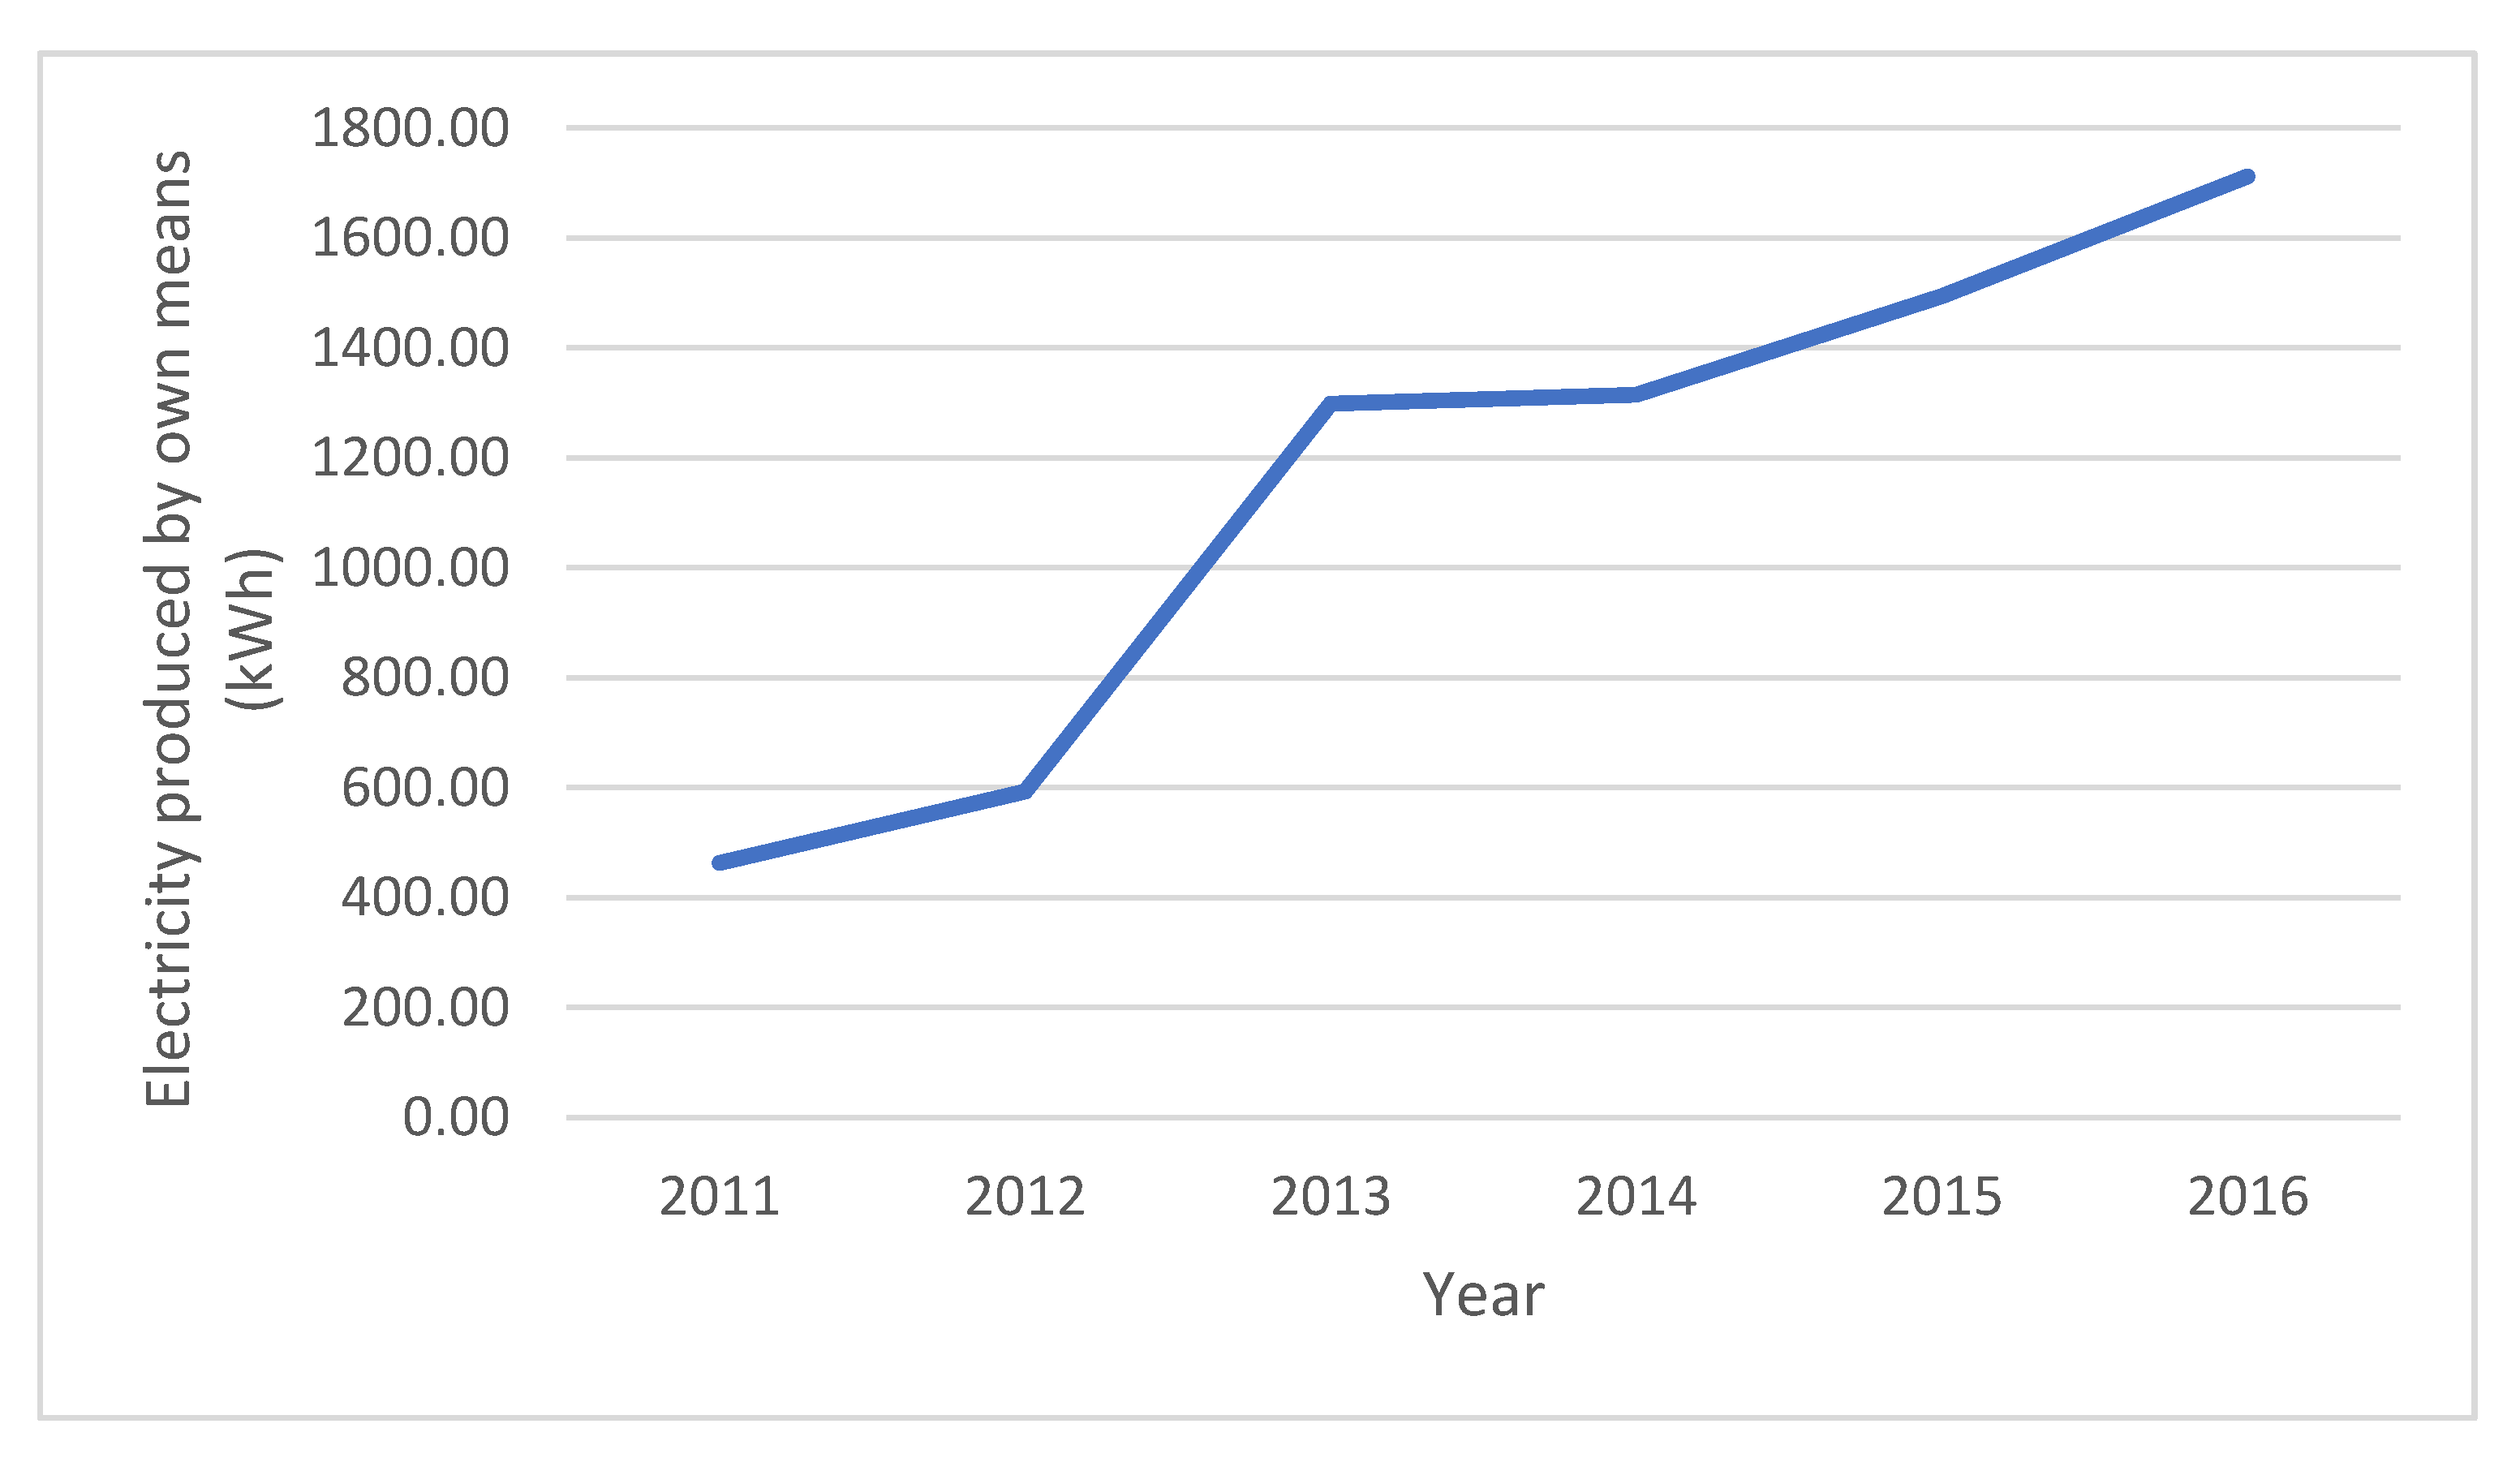
Prosumers (customers who produce energy by their own means, like solar panels) were only 31.3% in 2012 and have reached almost half of the customers (47.3%) in 2016 (Figure 7). Prosumers tend to produce yearly more and more electricity (from an average of 462 kWh to an average of 1711 kWh, an increase of 370% (Figure 8). By producing their own electricity, they become less and less dependable on the electricity/energy provided by the electricity grid.
There is also a significant difference in the actual consumption between prosumers and non-prosumers (significance = 0.000). Prosumers consume much less electricity (actual consumption 1010 to 2999 kWh for non-prosumers). They also consume (require) less electricity provided by the (electricity) grid (sometimes, their energy consumption is probably higher, since their total energy consumption is the sum of the electricity used by the network and the one produced by their own means). As a result, the electricity used was derived from RES.
Also, there is a significant difference between the number of residents of a household and if the customer/owner is a prosumer or not (significance = 0.000). Prosumers’ households have, in general, more residents (3.2 to 2.3 for non-prosumers).
There were 3 contract types: (a) residential (93.7%), (b) commercial (4%), and (c) social (2.3%) (2016).
1)
The variables “prosumer” and “contract type” are dependent, which means that the contract type you belong to depends on if you are prosumer or not (the most energy-responsible customers seem to be those of contract-type residentials; 48.6% are prosumers).
2)
Furthermore, there is a significant difference in the amount of electricity produced by own means amongst the contract-type groups (significance = 0.000). The highest (mean) amount of electricity produced by own means is for contract type A (residential): 1750 kWh (2016).
Finally, as for the interventions: (a) customers who have received EE leaflets tend to consume two times more electricity (7524 kWh to 3452 kWh), and (b) customers with EnergieID consume less electricity (2023 kWh to 2193 for those with no EnergieID), which is translated to almost 70 kgCO2 per customer per year. Additionally, there is a significant difference in electricity produced by own means between the customers with EnergieID and those with no EnergieID (significance = 0.000). Customers with EnergieID produce more electricity (1,476 to 1,204 kWh for those with no EnergieID).

3.5. Enercoop—France

Enercoop provided data regarding energy production, energy consumption, heating and cooking, meteorological region, contract-type data, and also data for the two proposed interventions. They initiated the interventions: (i) Dr. Watt (an online tool including an offline training course to help consumers make a self-diagnosis of their specific electricity consumption, as well as an online wiki on energy savings) and (ii) SMI.
The results of the analysis are grouped into two parts: (i) energy production and (ii) energy consumption.

3.5.1. Energy Production

There were five meteorological regions, and the average energy production in each region is shown in Table 6. There is a significant difference (significance = 0.000) in energy production between the five regions (A, B, C, D, and E). Regions D and E produce, on average, 45% and 38%, respectively, of the energy produced.
In Figure 9, the percentage of contribution in energy production of each type of generators, for each one of the meteorological regions, is depicted.

3.5.2. Energy Consumption

For the statistical analysis, the variable “total consumption” was formulated as the sum of the actual consumption, cooking, and electricity produced variables. Additionally, the customers were classified according to if they are a cooperative member or not, their contract type, meteorological region, SMI installation or not, and Dr. Watt program participation or not.
Regarding SMI, 86.5% of nonmembers have not installed SMI, and 88.6% of the members and the variables’ cooperative members (47% of the customers) and SMI are dependent (significance = 0.000).
Besides, the variables “cooperative member” and “meteorological region” are dependent (significance = 0.000), meaning that if a customer is a member of the cooperative or not depends on the meteorological region he/she lives in. Most of the members live in regions A and B (39.1% and 20.2%, respectively). The same happens for the nonmembers, as well (36.4% and 20.8%, respectively).
Regarding contract types (an online tool including an offline training course to help consumers make a self-diagnosis of their specific electricity consumption, as well as an online wiki on energy savings), two types were included, A and B, and the differences in total consumption were examined. There is a significant difference (significance = 0.000) on total consumption between the two types; contract type A members consume less (311 kWh to 380.5 kWh for type B members).
Additionally:
1)
The variables “cooperative member” and “contract type” are dependent (significance = 0.000), which means that if you are contract type A or B depends on whether you are a member of Enercoop or not. Thirty-two point eight percent of the members are type A and 67.2% are type B (the % for nonmembers are 53.1% type A and 46.9% type B);
2)
The variables “contract type” and “SMI” are dependent (significance = 0.000). Fifteen point eight percent of contract type A customers have SMIs in comparison to 10% of contract type B customers, who have installed meters;
3)
The variables “contract type” and “Dr. Watt” are also dependent (significance = 0.000). Zero point nine percent of contract type A members took part in the Dr. Watt program and 0.8% of contract type B took part in the program.
Moreover, the differences in the total consumptions amongst the five meteorological regions are depicted in Table 7.
There is a significant difference (significance = 0.000) in total consumption between the regions. Customers of region E consume the most and customers of region A the least.
As for the interventions and the meteorological region, the following conclusions can be drawn:
1)
The variables “meteorological region” and “SMI” are dependent (significance = 0.000); i.e., if a customer has an SMI, it depends on the meteorological region he/she lives in. The percentage of those who have SMIs ranges from 9.8% for region A customers to 17.4% of region D customers;
2)
The variables “meteorological region” and “Dr. Watt” are dependent (significance = 0.000). Customers of regions D and E take part in the program in more significant numbers (1.8% and 1.2%, respectively).
The central part of the study for Enercoop is the statistical analysis of the total consumption concerning each one of the two interventions proposed.
As for Dr. Watt, only 0.8% of the customers took part, and there is a significant difference (significance = 0.000) in total consumption between those who did and those who did not. The customers who took part in the Dr. Watt program consumed an average of 45 kWh less (305 kWh to 350 kWh for those who did not take part), which can be translated to almost 35kgCO2 per customer.
The variables “SMI” and “Dr. Watt” are dependent (significance = 0.000). Customers taking part in the Dr. Watt program have SMIs in higher numbers (15.6% to 12.5% who did not have SMIs).
As for the second intervention (SMI), customers who have SMIs consume an average of 25% less energy (difference statistically significant).

3.6. Regression Models

In order to depict quantitatively the performance of the consumers, several regression models for all the REScoops were tested. The actual purpose of the unified regression model is to show the (quantitative) contribution (strength/degree), per REScoop-proposed intervention (e.g., actions, SMI, and use of PV panels/prosumers), to the energy saved. This was necessary, since the outcomes of the statistical analysis were case-sensitive (due to the different kind of data provided by the REScoops).
A specific coefficient (of a regression model), referring to an independent variable, gives the increase/decrease to the dependent variable due to the one unit increase of the independent variable. This specific coefficient of the (unified) regression model shows the amount of energy saved due to the unit increase of the proposed intervention on which the coefficient refers to (e.g., for prosumers, the coefficient referring to their variable shows the energy reduction for 1 kWh energy production/clean energy technology). Then the energy saved is converted into a CO2 emissions equivalent utilizing the appropriate coefficient depending on the country the REScoop is located.
Table 8 summarizes these regression models for the actual (total) consumption of a REScoop customer/member (for each one of the five REScoops) concerning intervention measures implemented and, also, customers’ characteristics.
As seen, all the model coefficients, referring to intervention measures, are negative numbers, indicating (significant) actual/total consumption reductions (probable efficiency of these measures). These coefficients also indicate the effect of each intervention or characteristic to the actual consumption, as the higher the coefficient is, the more it affects the actual consumption. For example, the coefficient p = −3.8 (referring to average daily temperature) for Som Energia means that an increase to the average daily temperature by one degree results in a 3.8 kWh decrease in energy consumption, and so on for the rest of the calculated coefficients.

4. Discussion and Conclusions

This research work takes advantage of the data provided by five REScoops regarding their applied practices and statistically evaluates real historical/raw data. The existing literature is limited concerning the analysis of this type of data (large databases), as there is minimal research work that exploits these types of data and extracts conclusions regarding the efficiency of such initiatives and applied interventions/practices.
The initial purpose of the analysis was to draw holistic knowledge regarding the efficiency of the REScoops’ initiatives. During the analysis, this appeared to be too ambitious, and the outcomes of the study were case-sensitive (due to the different data typology and keeping by the REScoops). The coefficients of the regression model show the contribution to energy consumption/reduction, on the one hand, of the responsible customers’ behavior (e.g., customers taking part in actions) and, on the other hand, to the use of clean energy resources (e.g., prosumers).
By analyzing such a large sample of heterogeneous data, the outcomes of the study are impartial and provide a general and well-based evaluation of the proposed interventions. As a result, the main objective of the research work, of drawing a holistic knowledge concerning the efficiency of the REScoops’ initiatives is being served and attempted through this analysis. In the case of SEV, the data were used due to their detailed characteristics and their exceptional capabilities and the opportunity they offer to the research team to compare results among two different customers (schools).
The correlation between the different types of statistical analysis/ conclusions is that the research team attempted to correlate the proposed interventions (taken by the REScoops) with energy savings and, consequently, with CO2eq emissions. The unified regression model relates the contribution of each one of the REScoops’ interventions to energy reduction. The contribution of the research team is that such big data are statistically analyzed for the first time, and the outcomes of the study are of high reliability and clarity. Based on the previous analysis, there is either stabilization or a significant (yearly) reduction in actual energy consumption among REScoops members (and this is probably due to the energy reduction intervention measures applied, since these are the only essential measures taken by the REScoops).
These results are also clear from the regression models constructed, since all their coefficients referring to intervention measures are negative (the coefficients show the size of the corresponding reduction).
1)
Prosumers not only increase in numbers but also produce more and more electricity/energy from RES (consume less and less energy produced by fossil fuels), even though prosumers’ buildings are being inhabited (on average) by more residents;
2)
More and more REScoops’ customers are taking part in energy reduction actions initiated by the cooperatives. Customers who participate in these actions tend to consume less energy;
3)
Members of the “implementation measures groups” take part in energy reduction actions more often. Consequently, they also tend to consume less and less electricity produced by fossil fuels.
More precisely, there is a noticeable difference in actual consumption, and consequently, in the average monthly bill charged, between the REScoops’ groups with the proposed interventions implemented and those without the interventions applied. There is a reduction in actual consumption concerning measures implemented by the REScoops, such as (a) “SMI”: in the case of Enercoop customers who have SMI consume 90 kWh less (267 kWh to 362 kWh than those who have not installed); (b) EnergieID: for Ecopower, customers receiving EnergieID consumed less electricity (2023 kWh compared to 2193 for those with no EnergieID), which translates to almost 70 kgCO2eq per customer per year; (c) generation or empowering actions: in the case of Som Energia, those who took part in empowering action consume 78 kWh less than those who have not, and this can be translated to 31.51 kgCO2eq per customer per year. Additionally, those who take part on the generation action consume 55 kWh less than those who do not (195 to 260 kWh); this can be translated to 22.22 kgCO2eq per customer per year; and (d) “Dr. Watt”: in the case of Enercoop, customers who take part in the Dr. Watt program consume 45 kWh less (305 kWh to 350 kWh for those who do not take part), with almost 35 kgCO2eq per customer per year.
In addition, actual consumption depends on factors such as HDDs, the member’s contracting power group, the meteorological region, customer’s contract type, tariff type charged, etc. Furthermore, there is a significant increase in energy production by cooperatives’ members during the examined period, e.g., in the case of Enercoop, from an average of 1,333,475 in 2015 to an average of 5,255,914 kWh (a 400% increase). Additionally, prosumers increase in numbers annually; e.g., for Ecopower, there were only 31.3% in 2012 and have reached 47.3% in 2016.
So, implementing EE interventions of various types, such as technical support, special tariffs, energy generation schemes, and SMIs, seems to lead to substantial energy reductions and, consequently, reduces the environmental footprint. Additionally, the majority of EE interventions applied by the REScoops are quite effective in inducing more efficient energy consumption behavior (“greener”).
The results of the analysis demonstrated that more than 22 GWh were saved in energy consumption and almost 4500 tons of CO2eq (Table 9).
This estimation is based on the extrapolation of the data in the same time frame and the same data sample extracted from the data acquired from the REScoops. The final results, referring to the end of the project, showed, after the initiation of these REScoops’ attempts, the total saved amount of energy and CO2eq. This analysis aimed to fill a crucial gap in the existing literature, as previous works did not analyze such real big data from five different cooperatives in order to extract conclusions and evaluate the proposed initiatives, both individually and as a whole.
The main conclusions drawn from this research paper:
  • could be useful for the REScoops as an evaluation tool for their practices on the different customer groups;
  • can further help the REScoops to improve or even substitute and replace practices with new ones (more effective);
  • could give a helping hand to eliminate or even fix data-recording methodological problems;
  • can help in evaluating the expectations and commitments of REScoops’ members as well;
  • could provide robust results in proving that REScoops are themselves a dynamically new investment tool in the 21st-century world by evaluating their efforts through statistically based methods.
Some recommendations for future research are the following:
  • even more REScoops to share their data to get even more reliable results and;
  • highly effective interventions need to be tested in different REScoops from different countries to assist the evaluation process, presented, to get more holistic outcomes.
Moreover, the main highlights of this research work are:
  • The majority of the proposed interventions had a negative correlation with energy consumption, leading to energy savings and GHG diminishing;
  • Prosumers not only increase in numbers but also produce more and more electricity/energy from RES;
  • There is a significant increase in energy production by cooperatives’ members. More than 22 GWh were totally saved in energy consumption and almost 4500 tons of CO2eq.
Last, but not least, the novelty of this research work is about the thorough analysis of existing big data on REScoops’ activity that were acquired and the clarification of various behavioral characteristics of REScoops’ members. As a result, after the statistical analysis of these big data, crucial gaps in the existing literature were filled, if someone takes in mind past research works, such as [26,27,28,29,30], which did not utilize such big data to draw their conclusions regarding REScoops and the efficiency of their initiatives.

Author Contributions

SEV, Coopernico, SomEnergia, Ecopower, and Enercoop, in collaboration with T.T., conceived and designed the experiments; SEV, Coopernico, SomEnergia, Ecopower, and Enercoop performed the experiments; N.S. and T.D. analyzed the data; and T.D. contributed reagents/materials/analysis tools. All authors wrote the paper. All authors have read and agreed to the published version of the manuscript.

Funding

This project has received funding from the European Union’s Horizon—2020 research and innovation program under grant agreement No. 696084.

Acknowledgments

The results and the research methodology presented in this paper are part of the H2020—REScoop Plus project. The sole responsibility for the content of this publication lies with the authors. It does not necessarily reflect the opinion of the European Union. Neither the EASME nor the European Commission is responsible for any use that may be made of the information contained therein. The authors would like to express their gratitude to all partners of the REScoop Plus project, especially to the REScoops, which, by following the General Data Protection Regulation (GDPR), allowed TUC to develop the above methodological analysis.

Conflicts of Interest

The authors declare no conflicts of interest.

References

  1. Boemi, S.; Papadopoulos, A.M. Energy & Buildings Energy poverty and energy efficiency improvements: A longitudinal approach of the Hellenic households. Energy Build. 2020, 197, 242–250. [Google Scholar]
  2. Batinge, B.; Musango, J.K.; Brent, A.C. Sustainable energy transition framework for unmet electricity markets. Energy Policy 2019, 129, 1090–1099. [Google Scholar] [CrossRef]
  3. Oteman, M.; Wiering, M.; Helderman, J. The institutional space of community initiatives for renewable energy: A comparative case study of the Netherlands, Germany and Denmark. Energy Sustain. Soc. 2014, 4, 1–17. [Google Scholar] [CrossRef] [Green Version]
  4. Heras-Saizarbitoria, I.; Sáez, L.; Allur, E.; Morandeira, J. The emergence of renewable energy cooperatives in Spain: A review. Renew. Sustain. Energy Rev. 2018, 94, 1036–1043. [Google Scholar] [CrossRef]
  5. Sifakis, N.; Savvakis, N.; Daras, T.; Tsoutsos, T. Analysis of the Energy Consumption Behavior of European RES Cooperative Members. Energies 2019, 12, 970. [Google Scholar] [CrossRef] [Green Version]
  6. International Labour Organization. Providing Clean Energy and Energy Access through Cooperatives Providing Clean Energy and Energy Access; International Labour Office Cooperatives Unit (COOP): Geneva, Switzerland, 2013; ISBN 978-92-2-127528-2. [Google Scholar]
  7. Michalena, E. Local challenges in the promotion of renewable energy sources: The case of Crete. Energy Policy 2018, 37, 2018–2026. [Google Scholar] [CrossRef]
  8. Hills, J.M.; Evanthie, Μ.; Chalvatzis, K.J. Technological Forecasting & Social Change Innovative technology in the Pacific: Building resilience for vulnerable communities. Technol. Forecast. Soc. Chang. 2018, 129, 16–26. [Google Scholar]
  9. Hentschel, M.; Ketter, W.; Collins, J. Renewable energy cooperatives: Facilitating the energy transition at the Port of Rotterdam. Energy Policy 2018, 121, 61–69. [Google Scholar] [CrossRef]
  10. Bertheau, P.; Dionisio, J.; Jütte, C.; Aquino, C. Challenges for implementing renewable energy in a cooperative-driven off-grid system in the Philippines. Environ. Innov. Soc. Transit. 2019, 1–13. [Google Scholar] [CrossRef]
  11. Yildiz, Ö.; Rommel, J.; Debor, S.; Holstenkamp, L.; Mey, F.; Müller, J.R.; Radtke, J.; Rognli, J. Renewable energy cooperatives as gatekeepers or facilitators? Recent developments in Germany and a multidisciplinary research agenda. Energy Res. Soc. Sci. 2015, 6, 59–73. [Google Scholar] [CrossRef]
  12. Lehtonen, O.; Okkonen, L. Energy cost reduction creates additional socioeconomic benefits– The case of Eno Energy Cooperative, Finland. Energy Policy 2019, 129, 352–359. [Google Scholar] [CrossRef]
  13. Peng, Y.; Li, J.; Park, S.; Zhu, K.; Hassan, M.M.; Alsanad, A. Energy-efficient cooperative transmission for intelligent transportation systems. Futur. Gener. Comput. Syst. 2019, 94, 634–640. [Google Scholar] [CrossRef]
  14. Bauwens, T. Analyzing the determinants of the size of investments by community renewable energy members: Findings and policy implications from Flanders. Energy Policy 2019, 129, 841–852. [Google Scholar] [CrossRef]
  15. Moroni, S.; Alberti, V.; Antoniucci, V.; Bisello, A. Energy communities in the transition to a low-carbon future: A taxonomical approach and some policy dilemmas. J. Environ. Manag. 2019, 236, 45–53. [Google Scholar] [CrossRef] [PubMed]
  16. Haas, T. Struggles in European Union energy politics: A gramscian perspective on power in energy transitions. Energy Res. Soc. Sci. 2019, 48, 66–74. [Google Scholar] [CrossRef]
  17. Chalkiadakis, G.; Akasiadis, C. D2.1 Zero-point report on data of Supplying REScoops (Public Summary). 2017. Available online: http://www.rescoop-ee.eu/rescoop-plus (accessed on 15 January 2020).
  18. RESCOOP Plus Project Proposal, H2020-EE-2015-3-MarketUptake. 2015. Available online: http://www.rescoop-ee.eu/rescoop-plus (accessed on 25 January 2020).
  19. REScoop Plus Project, Deliverable D2.2-Methodology for Analysis. 2016. Available online: http://www.rescoop-ee.eu/rescoop-plus (accessed on 12 February 2020).
  20. Augustine, P.; McGavisk, E. The next big thing in renewable energy: Shared solar. Electr. J. 2016, 29, 36–42. [Google Scholar] [CrossRef]
  21. Capellán-Pérez, I.; Campos-Celador, Á.; Terés-Zubiaga, J. Renewable Energy Cooperatives as an instrument towards the energy transition in Spain. Energy Policy 2018, 123, 215–229. [Google Scholar] [CrossRef]
  22. Lohmann, G.; Heilmann, G.; Hacke, U.; Robinson, S. The ICT PSP Methodology for Energy Saving Measurement—A Common Deliverable from Projects of ICT for Sustainable Growth in the Residential Sector; Project Co-Funded by the European Commission within the ICT Policy Support Programme. Available online: https://cordis.europa.eu/docs/projects/cnect/6/250496/080/deliverables/001-ARES975520CIPCommondeliverableeSESH.pdf (accessed on 22 February 2020).
  23. DeGroot, M.H.; Schervish, M.J. Probability and Statistics, 4th ed.; Addison-Wesley: Boston, MA, USA, 2012. [Google Scholar]
  24. Apostolakis, I.; Daras, T.; Stamouli, M.A. Exercises in Applied Statistics in Health Sector, 2nd ed.; Papazisis: Athens, Greece, 2009. [Google Scholar]
  25. Terkenli, T.S.; Daras, T.; Maria, E.-A. Landscape Notions among Greek Engineering Students: Exploring Landscape Perceptions, Knowledge and Participation. Land 2019, 8, 83. [Google Scholar] [CrossRef] [Green Version]
  26. Proka, A.; Loorbach, D.; Hisschemöller, M. Leading from the Niche: Insights from a strategic dialogue of renewable energy cooperatives in the Netherlands. Sustainability 2018, 10, 4106. [Google Scholar] [CrossRef] [Green Version]
  27. Ropuszynska-Surma, E.; Weglarz, M. Profiling end user of renewable energy sources among residential consumers in Poland. Sustainability 2018, 10, 4452. [Google Scholar] [CrossRef] [Green Version]
  28. Fan, S.; He, G.; Jia, K.; Wang, Z. A novel distributed large-scale demand response scheme in high proportion renewable energy sources integration power systems. Appl. Sci. 2018, 8, 452. [Google Scholar] [CrossRef] [Green Version]
  29. Moroni, S.; Antoniucci, V.; Bisello, A. Local energy communities and distributed generation: Contrasting perspectives, and inevitable policy trade-offs, beyond the apparent global consensus. Sustainability 2019, 11, 3493. [Google Scholar] [CrossRef] [Green Version]
  30. Iris, Ç.; Lam, J.S.L. A review of energy efficiency in ports: Operational strategies, technologies and energy management systems. Renew. Sustain. Energy Rev. 2019, 112, 170–182. [Google Scholar] [CrossRef]
Figure 1. Overview of the REScoop plus research methodology. EE: energy efficiency.
Energies 13 01136 g001
Figure 2. Average daily temperature and heating degree days through the examined period (school one).
Energies 13 01136 g002aEnergies 13 01136 g002b
Figure 3. Average daily temperature and heating degree days through the examined period (school two).
Energies 13 01136 g003aEnergies 13 01136 g003b
Figure 4. Actual consumption through the examined period per heating group (school one).
Energies 13 01136 g004
Figure 5. Actual consumption through the examined period per heating group (school two).
Energies 13 01136 g005
Figure 6. Mean–median actual consumption through the examined period.
Energies 13 01136 g006
Figure 7. Percentage of prosumers.
Energies 13 01136 g007
Figure 8. Electricity produced by own means during the examined period.
Energies 13 01136 g008
Figure 9. Generators types per region.
Energies 13 01136 g009
Table 1. Summary of all REScoops’ datasets 1.
REScoop
(Sample Size)
Period of MeasurementsNumber of MonthsProduction DataInterventionMeteoDataDemographic DataMean Actual Consumption (kWh)Clustering Criteria/Groups
SEV
(346)
School109/2005–08/2018156NoSmart Meter Installation (SMI)

Optimization of the Return Flow
YesNo44,878actual consumption regarding the amount of heat, EE intervention (before and after)
School209/2002–06/201819042,915
Coopérnico
(9,441)
06/2015-06/201837NoSpecial TariffsYesNo301.34type, zones, tariffs, contracted power
Som Energia
(862,886)
01/2015–08/201844YesSMI
Special Tariffs
Generation action
Empowering action
Promotion by using EE leaflets
YesNo
  • 2015: 247.34
  • 2016: 259.47
  • 2017: 261.23
  • 2018: 260.64
members, EE interventions, type
Ecopower
(194,028)
01/2011–12/201672YesPromotion by using EE leaflets

EnergieID
NoYes
  • 2011: 2524.34
  • 2012: 2341.35
  • 2013: 2169.34
  • 2014: 2117.87
  • 2015: 2049.85
  • 2016: 1982.96
members, EE interventions, type, prosumers 2
Enercoop
(1,024,093)
01/2015–10/201845YesSMI

Dr. Watt
YesNo350members, meteorological region, contract type, EE interventions
1 All data were provided by the REScoops themselves. 2. Customers who produce energy by their own means, e.g., solar panels. EE: energy efficiency.
Table 2. Differences in consumption between school one and school two.
School OneSchool Two
Difference on actual consumption between the months without the EE intervention (SMI) and the ones with it
  • A statistically significant difference (significance = 0.042)
  • 49,659 to 35,847 kWh (−27.8%)
  • −5.57 tnCO2
  • A statistically significant difference (significance = 0.099 and α = 0.1)
  • 45,047 to 37,106 kWh (−17.6%)
  • −3.21 tnCO2
Table 3. Tariff type and customer type. BTN: baixa tensao normal.
Customer TypeTariff
BTN–BI-HorarioBTN–SimplesBTN–TRI-Horario
TypeParticular37.80%61.90%0.30%
Commercial12.80%73.30%13.90%
Table 4. Mean actual monthly consumption in Som Energia.
YearMean Actual Consumption (kWh)
2015247 (252 for members)
2016259 (264)
2017261(268)
2018260 (267)
Table 5. Proposed interventions, actual consumption, and monthly bill.
Proposed InterventionActual Consumption (Average)Monthly Bill (Average)
YesNoReductionYesNoReduction
SMI24427312%606610%
Promotion by using EE leaflets2562580.6%
Non-significant
62.362.90.9%
Non-significant
Generation action19526133%48.663.631%
Empowering action20228139%51.667.631%
Table 6. Produced energy per region.
RegionProduced Energy (GWh)
A (Île-de-France / Bourgogne - Franche-Comté)0.835
B (Normandie / Pays de la Loire / Bretagne)0.215
C (Nouvelle Aquitaine)0.615
D (Auvergne – Rhone-Alpes)4.699
E (Occitanie – PACA)3.462
Total9.827
Table 7. Mean energy consumption per region.
RegionMean Energy Consumption (kWh)
A (Île-de-France/Bourgogne—Franche-Comté329
B (Normandie/Pays de la Loire/Bretagne)352
C (Nouvelle Aquitaine)363
D (Auvergne—Rhone-Alpes)350
E (Occitanie—PACA)395
Table 8. Regression Models.
Regression Equation (Combined)
C o n s u m p t i o n = C + a   x   H D D + b   x   T P + c   x   Z N + d   x   S N + e   x   H N + f   x   P S + g   x   L F + h   x   I D + i   x   R D + j   x   P R   + k   x   S T + l   x   S M I + m   x   G A + n   x   E A + o   x   C N + p   x   A D T + q   x   M B + r   x   A E P + s   x   D W
Consumption is either AC = actual consumption or TC = total consumption, HDD = heating degree days, TP = type, ZN = zone, SN = simples new, HN = horario new, PS = prosumer, LF = EE leaflets, ID= EnergieID, RD = residents, PR = precipitation, ST = special tariffs, SMI = smart metering installation, GA = generation action, EA = empowering action, CN = contract new, ADT = average daily temperature, MB = member, AEP = amount of electricity produced by own means, and DW = Dr. Watt.
REScoopRegression Equation coefficients 1Correlation Coefficient
SEV2 / School 1C = 9999.5, a = 124.7 (before SMI) //C = 2394.6, a = 116.4 (After SMI)R2 = 0.64 // R2 = 0.67
SEV2 / School 2C = 16,557, a = 87.7 (before SMI) //C = 11,500, a = 89.5 (After SMI)R2 = 0.63 // R2 = 0.62
Coopernico 2C = 3292.9, b = 218.8, c = −33.6, d = −3108.7, e = −2,993.7R2 = 0.51
Ecopower 2C = 1853.8, f = −2035.7, g = 4222.3, i = 427, r = 0.9
(EnergieID and contract type are not significant and cannot be included)
R2 = 0.43
Som Energia 3C = 228.9, g = 22.9, k = 278.2, l = −11.5, m = −49.3, n = −66.4,
o = 579.2, p = −3.8, q = 26.8
(Precipitation is not significant and cannot be included)
R2 = 0.03
Enercoop
C = 469.1, l = −72.7, o = 81, p = −11 q = −29.1, r = 1.5
(Dr Watt is not significant and cannot be included)
R2 = 0.11
1 All the coefficients are statistically significant at a = 0.05 level of significance (p-value < 0.05);2 Refers to total consumption.; 3 Refers to actual consumption.
Table 9. The effectiveness of the proposed interventions.
REScoopSEV
Italy
Coopérnico
Portugal
Som Energia
Spain
Ecopower
Belgium
Enercoop
France
Measuring period09/2005–08/201809/2002-06/2018 06/2015–06/2018 01/2015–08/2018 2011–2016
01/2015–10/2018
No. of consumers 2016782 (13,000)782 (13,000) 559 30,006 50,393 27,000 (42,500)
No. of consumers 2018782 (13,000)782 (13,000) 1,205 55,660 56,333 37,000 (70,000)
Interventions (datasets provided)Optimize return flowOptimize return flow EnergieID
Dr. Watt
Promotion by using EE leaflets
Dr. Watt
Infoenergia
Promotion by using EE leaflets EnergieID
One tariff system
Dr. Watt
Total energy savings (kWh/year)(*)(*) 441,897 50,094 7,266,957 12,432,000
Total energy savings (GWh/year)(*)(*) 0.44 0.05 7.3 12.4
CO2eq (tns/year)(*)(*) 222.5 21.5 1851 1146