Abstract
Released green building evaluation standards for operation stage include a huge number of indicators, which are very comprehensive and systematic. However, the indicators of these standards are very complicated and a large amount of time and manpower are consumed for their evaluation. To evaluate the operational performance of green buildings more practically and efficiently, some studies collect the operational data for part of the indicators (mainly focusing on building energy performance, indoor environmental quality or occupant satisfaction), which are too rough to evaluate the performance of green building. This paper proposed a total of 27 key performance indicators (KPIs) for green building operations monitoring. The number of proposed indicators is much fewer than the evaluation standards, as well as suitable for long-term monitoring, which can dramatically reduce evaluation time and cost. On the other hand, the indicators involving Outdoor environmental quality, Indoor environmental quality, HVAC system, P&D system, Renewable energy system, Total resource consumption and User behavior, which are more comprehensive and systematic than the conventional monitoring studies for operational performance of green building. Firstly, an indicators library for operations monitoring of green building was established based on relevant standards and literature review in this field. Secondly, “SMART” principle and Delphi method were adopted to select the key performance indicators for green building operations monitoring. Different background experts regarding green building industry were chosen to screen the most relevant, accessible and measurable indicators. Subsequently, two projects in China were selected for case study of key performance indicators proposed in this paper for green building operations monitoring to validate the feasibility and advancement.
1. Introduction
Green buildings, which are environmentally responsible and resource-efficient, have witnessed tremendous growth in these years [1,2]. In spite of the rapid development of green buildings worldwide, more and more researchers have found that numerous green buildings underperform compared with their design phase specifications. Newsham et al. [3] found that 28%–35% of the buildings with LEED certification showed more energy consumption than non-green buildings. Research by Scofield reported that the buildings with LEED certification did not save energy compared with their conventional counterparts [4]. Davies et al. [5] concluded that the indoor environmental qualities of certain green buildings in the UK were below expectations. To explore the performance gap, it is necessary to conduct green building data collection of operational performance. A set of indicators is an important means to evaluate the operational performance [6].
Some countries have released green building evaluation standards for the operation stage including a quantity of indicators, and Table 1 lists the type and number of indicators proposed by typical green building evaluation standards for this stage [7,8,9,10,11].

Table 1.
The summary of type and number of indicators proposed by typical green building evaluation standards for operation stage.
On the one hand, the indicators proposed in the evaluation standard are very comprehensive and systematic. On the other hand, huge amounts of indicators proposed in the evaluation standard are very complicated and a large amount of time and manpower were consumed for their evaluation, and additionally, they are not suitable for long-term monitoring [12]. To evaluate the operational performance of green buildings more practically and efficiently, some studies collect the operational data for part of the indicators, Table 2 lists the type and number of indicators utilized to evaluate operational performance of green buildings in some typical studies. In terms of the type of evaluated indicators, Jing et al. [13] and Diamond et al. [14] mainly focus on energy performance. Christensen et al. [15] and Pei et al. [16] mainly focus on Indoor Environmental Quality (IEQ). Reference [17] mainly focuses on occupant satisfaction. Other studies [18,19,20] evaluated combinations of the three aspects. The number of indicators is much fewer than the standards, which is more practical and cost-saving. As the communication and network technologies developed rapidly, the process of collecting operational data has become more efficient and less expensive [21,22], making it possible to collect more data for other types of indicators in the long term, such as outdoor environmental quality, water usage, renewable energy usage [12]. Furthermore, building energy usage, indoor environmental quality and user satisfaction are merely the operational results, it is more important to monitor the indicators that influence these operational results. For example, the operational efficiency of an HVAC system affects the energy consumption [23]. Similarly, the users’ behaviors can impact the building energy consumption [24] and IEQ significantly [25].
Table 2.
The summary of type and number of indicators utilized by typical studies to evaluate the operational performance of green buildings.
Key performance indicators (KPIs) are widely used as target-based quantitative management indicators in performance management systems for different industries, for example the manufacturing industry [26], business industry [27] and academia [28]. In terms of the method of establishment of key performance indicators, existing studies do not adequately illustrate the establishing process for operational performance indicators of green building industry. However, method studies regarding establishing key performance indicators for other industries still can be referred. For the selection method of KPIs, the “SMART” principle is generally used to screen and distinguish the key indicators [29], and the application of this principle was proved to be effective and practical [30]. For the execution of selection of KPIs, the Delphi method has been proved to be effective in achieving consensus when there is uncertain information or lack of empirical evidence for different industries [31].
This paper aims to propose a set of key performance indicators (KPIs) for green building operations monitoring, that is more practical and efficient than the evaluation standards, and also more comprehensive and systematic than the conventional monitoring studies for operational performance of green building. These proposed KPIs can be used to identify the whole picture of operational performance of green building, and provide foundation for further specific diagnosis.
2. Methodology
Firstly, an indicators library for operations monitoring of green building was established based on relevant standards and literature review in this field. Secondly, “SMART” principle and Delphi method were adopted to select the key performance indicators for green building operations monitoring. Subsequently, two projects in China were selected for case study of key performance indicators for green building operations monitoring to validate the feasibility and advancement. See Figure 1 for an illustration of the research process undertaken.
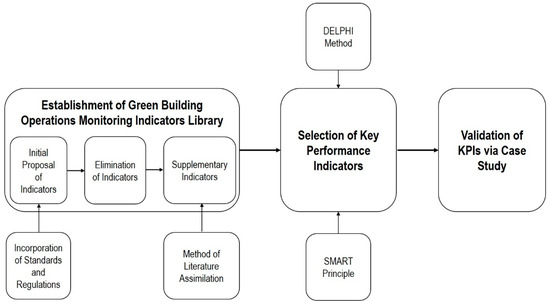
Figure 1.
Illustration of the research methodology.
2.1. Establishment of Green Building Operations Monitoring Indicators Library
2.1.1. Initial Proposal of Indicators by Incorporation of Standards and Regulations
To establish an authoritative and comprehensive library of operations monitoring indicators for green buildings in China, relevant standards and regulations were researched initially. Upon searching the current Chinese standards for green buildings at the national public service platform for standards information of China, 547 standards and related regulations were obtained and researched. However, no standard or regulation appeared to have been released specifically for operations monitoring of green building.
Among the researched green building standards and regulations, the most authoritative and widely used national standard in the field of green buildings in China is GB/T 50378-2014 “Assessment standard for green building” [10]. Other local, industrial, or association assessment standards of green buildings have been established by referring to this national standard. Although this assessment standard does not specify the green building dynamic operations monitoring system, some credit requirements of the standard involve several quantitative performance evaluation indicators that could be used for long-term dynamic monitoring during the operational stage of a building, such as cooling and heating source system efficiency, non-potable water source utilization rate, and renewable energy utilization rate. The association standard of China CSUS/GBC 05-2014 “Green Building Inspection Technical Standards” [11] has the same goal as the green building dynamic monitoring, which is used to verify the actual performance of the green building after its operationalization. The framework of the inspection is comprehensive and systematic. Although the “inspection” is a static verification rather than dynamic monitoring, this standard still has great relevance for research on the establishment of green building operations monitoring indicators library. Therefor these two standards were shortlisted for a deeper study for the initial proposal for green building inspection or assessment indicators. The indicator framework of CSUS/GBC 05-2014 is more similar to the monitoring system proposed in this study, which included seven primary indicators and 32 secondary indicators. According to GB/T 50378-2014 [10], 22 quantitative indicators can be extracted from the credit requirements, which can be integrated with the secondary indictors of CSUS/GBC 05-2014. Thus, the initially proposed primary indicators were inspired by the “Green Building Inspection Technical Standards (CSUS/GBC 05-2014)”, while the secondary indicators were inspired by both the standards, GB/T 50378-2014 and CSUS/GBC 05-2014.
2.1.2. Elimination of Indicators
Based on the initially proposed green building operations inspection or assessment indicators inspired by the aforementioned standards and regulations, an elimination of less relevant indicators was conducted following two principles:
(1) Firstly, certain inspection indicators are relevant at the time of site selection stage, construction stage, or completion acceptance stage, which are not really related to the long-term operation of the building. For example, the indicator related to sewage discharge from the construction sites is relevant during the construction stage only. Similarly, the indicator related to electromagnetic radiation around buildings and soil radon concentration needs to be inspected during the site selection stage to make sure that the project site is suitable for construction and use.
(2) Secondly, certain inspection indicators are relevant only at the beginning of the building operations. The operational performance of these indicators will nearly not vary during the operations stage unless a retrofitting takes place, and there is no need for long-term monitoring of such indicators. Examples include natural daylight environment, lighting power density, thermal performance of the building envelope, etc.
2.1.3. Supplementary Indicators
After the elimination of the irrelevant indicators, the remaining indicators could be preliminarily considered for long-term monitoring during the operational stage of the green building. To establish a comprehensive monitoring indicators library, the method of literature assimilation was used to develop supplementary indicators, in which the standards and regulations were not involved.
According to the purpose of this study, the keywords “green building”, “operating performance”, “operation monitoring” and “post-occupancy evaluation” were used for the literature search for the past five years. Search engines including Web of Science [32] and Scopus [33] were chosen to find relevant literatures which were considered as frequently-used for research. A total of 625 relevant articles were found as the initial literature database. After creating the initial database of articles, the further selection principles are from three aspects:
- (1)
- Only articles from international journals with high citations were included.
- (2)
- Only articles with specific operational data of green buildings were included.
- (3)
- Articles without significance test were excluded for further review.
Thus 86 articles were identified for further analysis. On the basis of purpose of the literature review, these 86 most relevant articles on green building operational performance monitoring could be summarized in two categories. One category was with regard to monitoring or investigating the building energy or water consumption and comparing the data with design objectives. The other category was related to the IEQ performances of green buildings by objective monitoring or subjective survey. As for the subjective survey, since China is still a developing country, the credit system is not complete, and also because of the tolerance culture, the results of occupant survey are not reliable enough. The indicators concerned with IEQ were already included in the library. Indicators concerned with building energy and water consumption were added as supplementary to the library.
Moreover, the users’ behaviors can impact the building energy consumption [24] and IEQ [25] significantly. Monitoring users’ behaviors can improve the efficiency of Heating, Ventilation, and Air-Conditioning (HVAC) systems [34] and indoor environment quality [35]. Therefore, the indicators in terms of users’ behaviors were also added to the library. After adding the indicators, the green building operations monitoring indicators library was established, which consisted of some primary and some secondary indicators.
2.2. Selection of Key Performance Indicators for Green Building Operations Monitoring
In this study, KPIs are used to evaluate the key performance of the green building operations and reflect the actual effect of green building operations intuitively and comprehensively. The primary criterion for selecting the KPIs is that they should play a key role in saving resources and improving the environmental quality during the operations.
Referring to the studies of other industries, “SMART” principle was introduced for the selection of the KPIs for the green building operations monitoring indicators library. The “SMART” principle was interpreted as follows: S stands for ‘specific’. These KPIs can be used for monitoring all types of green buildings during the operations phase. To maintain flexibility, reduce monitoring costs, and improve implementation, the KPIs can be appropriately reduced according to the specific conditions of the project. M stands for ’measurability’ and indicates long-term accuracy, layout difficulty, and remote transmission capability of the monitoring equipment installed. A stands for ‘accessibility’ and indicates the ease of obtaining the data related to the indicator parameters and whether it has the possibility of installing the monitoring equipment. R stands for ‘relevance’ and indicates the degree of correlation and irreplaceability of indicators with green building operations monitoring targets. T stands for ‘time bounded’ and indicates the sampling frequency requirements of the indicators monitoring. This study selected each indicator of the library based on the three principles, namely relevance, accessibility, and measurability (RAM) of the SMART principle. The T and S (‘time bounded’ and ‘specific’) principles were applied for the KPI implementation and not for the KPI selection.
Each secondary indicator was evaluated from the aforementioned three aspects (RAM) and was scored on a scale of 1 to 5 integer points for every aspect to reflect its degree. For example, 1 point for relevance means the indicator only weakly reflects the operational performance of the green building, whereas 5 points means the indicator has strong correlation with the operational performance of the green building. The total score for each secondary indicator was the sum of the scores on the three aspects. The formula is as follows:
where ST—Total score for each secondary indicator; SR—Score of relevance; SA—Score of accessibility; and SM—Score of measurability.
ST = SR + SA + SM
The Delphi method was used to score the indicators reasonably and select the final candidates. Twenty green building experts were asked to score each secondary indicator from the three aspects, i.e., RAM, using the 1–5 scale according to their knowledge and experience. The characteristics of experts are shown in Table 3. After each indicator was assigned the scores, the average scores for the three aspects from the scores of the experts for each indicator were calculated and rounded to the nearest integer. Then, the scores for each secondary indicator were added. If the total score was greater than 9 points (which indicates a scoring rate more than 60%), the indicator was retained; otherwise the indicator was eliminated. Thus, the KPIs for the green building operations monitoring were finalized.
Table 3.
Experts and their characteristics.
2.3. Case Study of KPIs for Green Building Operations Monitoring
Two projects were selected for case study of key performance indicators proposed in this paper for green building operations monitoring to validate the feasibility and advancement. The two case projects are all in Liangjiang New District, Chongqing city, located in Southwest China and belongs to the Hot-Summer-Cold-Winter region. The projects are all certified green office buildings by China Green Building Label and named as YL, LJ respectively in this paper. The specifications of the two projects are described in Table 4.
Table 4.
The specifications of the two projects for case study.
The typical floor plan of project YL is shown in Figure 2 and the typical floor plan of project LJ is shown in Figure 3. The rooms marked with room number represent placement of indoor environmental quality monitoring device in the room.
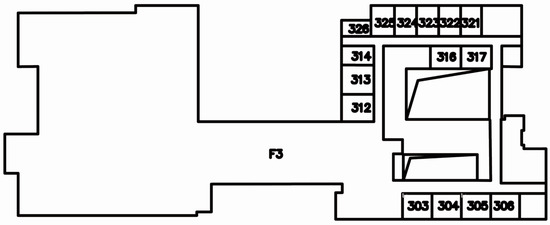
Figure 2.
Typical floor plan of project YL.
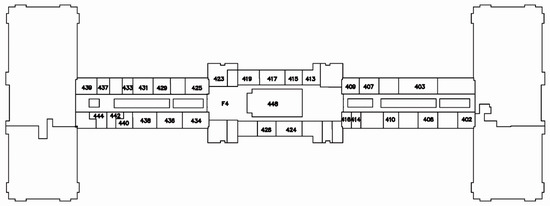
Figure 3.
Typical floor plan of project LJ.
For outdoor environmental quality monitoring, an integrated outdoor environment monitoring device called CESMS with multi-functional sensors was used which can collect outdoor temperature and relative humidity, wind speed, wind direction, SO2, NO2, PM2.5, noise with 5 min sensing intervals. The outdoor environment monitoring device were installed on the lighting poles of site boundaries at a height of about 2.5 m. The measured range and accuracy of CESMS sensors are listed in Table 5. For indoor environmental quality monitoring, an integrated indoor environment monitoring device called IBEM with multi-functional sensors was used which can collect indoor temperature and relative humidity, CO2, PM2.5, and illuminance data in 5 min sensing intervals. The indoor environment monitoring devices were installed on the central desks of offices. The measured range and accuracy of IBEM sensors are listed in Table 6.
Table 5.
The measured range and accuracy of CESMS sensors.
Table 6.
The measured range and accuracy of IBEM sensors.
The CESMS and IBEM sensors have been calibrated and examined by China National Institute of Metrology and the reliability for long-term monitoring can be guaranteed according to the corresponding national standards of China. For other indicators monitoring such as HVAC, P&D, Renewable energy system, and User behavior, the conventional remote transmission meters and sensors were installed and will not be further described in this paper. Since the two projects have been put into use, according to the “S” (Specific) in the SMART principle, and the actual situation of the projects, the dynamic monitoring data for part of green KPIs were collected and listed in Table 7.
Table 7.
The KPI obtained of two projects for case study.
This paper takes the monitoring data of the typical working week of two office buildings in the cooling season (31 July 2017 to 4 August 2017) as an example, the KPI monitoring data involved in the two projects are comparatively analyzed, and also compared with the values of national standards.
3. Results
3.1. Establishment of Green Building Operations Monitoring Indicators Library
3.1.1. Initial Proposal of Indicators by Standards and Regulation Induction
According to the method of standards and regulation incorporation, seven primary indicators and 36 secondary indicators were introduced based on two standards, CSUS/GBC 05-2014 (“Green Building Inspection Technical Standards”) and GB/T 50378-2014 (“Assessment standard for green building”). The indicators are listed in Table 8.
Table 8.
Primary and secondary indicators proposed by standard and regulation incorporation.
3.1.2. Elimination of Indicators
Based on the two principles proposed in Section 2.1.2, 10 secondary indicators were eliminated. Because all the secondary indicators of “artificial lighting and electrical system” and “building envelope” were eliminated, these two primary indicators were also eliminated. The eliminated indicators are listed in Table 9.
Table 9.
Estimated indicators based on the two principles proposed in the Section 2.1.2.
3.1.3. Supplementary Indicators
Based on a literature research using the key words “green building”, “operating performance”, “post-occupancy evaluation”, and “operation monitoring”, the most researched aspects appeared to be building energy consumption and indoor environmental quality. The indicators in terms of IEQ were proposed in the initially established library of this study. For building performance evaluation, energy saving is considered one of the most important aspects and the initial driving factor for the development of green buildings. Energy-saving designs are involved largest credits in nearly all evaluation standards of green building. The total building energy consumption monitored or collected mainly includes electricity [36], water [37], and gas [38]. Thus, the indicators of “Electricity consumption”, “Water consumption”, and “Gas consumption” were added to the library.
With the rapid development of China’s green buildings, more and more researchers have investigated the green buildings’ actual energy consumption in China. Apart from monitoring the total energy consumption, Jing et al. [13] analyzed the energy breakdown of 30 Hong Kong office buildings and concluded that, HVAC systems consumed 68% of the total energy consumption, lighting systems consumed 14%, and 18% for other systems. Therefore, more attention needs to be paid to the energy consumption of HVAC and artificial lighting systems to save more energy specifically. Thus, the indicators of “HVAC system power consumption” and “Lighting system power consumption” were added to the library.
According to the analysis presented in Section 2.1.3, the users’ behaviors have very significant impact on the building energy consumption and the indoor environmental quality. The users’ behaviors during the operation of the building mainly include the occupancy status [39], air conditioners [40], lamps [41], control behavior of the doors and windows [42], and curtains [43].
After supplementing the indicators related to the building energy consumption and user behavior, this study proposed a finalized green building operations monitoring indicators library. This library includes seven primary indicators and 38 secondary indicators of green building operations monitoring. The library and its monitoring parameters are shown in Table 10.
Table 10.
Green building operation monitoring indicators library and monitoring parameters.
3.2. Selection of KPIs for Green Building Operations Monitoring
Twenty experts of green building industry were asked to score each secondary indicator from three aspects (relevance, accessibility, and measurability) using a scale of 1 to 5. The average scores for the three aspects of each indicator were calculated, and rounded to the nearest integer. Then the total score for each secondary indicator was summed up, and the results are listed in Table 11.
Table 11.
Average score results (round to the nearest integer) of each aspect and total scores for secondary indicators according to twenty green building experts’ knowledge and experiences.
According to the scores obtained for each secondary indicator by the Delphi method, the total scores of 27 indicators were greater than nine points, while 11 indicators had scores equal to or less than nine points. The finalized green building operation monitoring KPIs, comprising seven primary indicators and 27 secondary indicators, are shown in Figure 4.
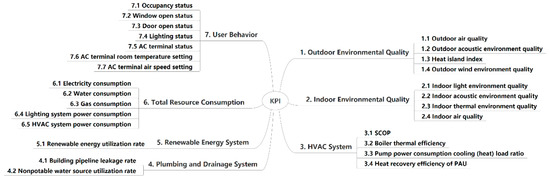
Figure 4.
Key Performance Indicators (KPIs) for green building operations monitoring.
3.3. Case Study of KPIs for Green Building Operations Monitoring
3.3.1. Evaluation Results Using Monitoring Data of Conventional Indicators
The conventional indicators mainly include energy performance and IEQ [12], the monitoring data of the two projects during the week of cooling season (31 July 2017 to 4 August 2017) was firstly compared regarding conventional indicators. The evaluation results are listed in Table 12.
Table 12.
The monitoring data of conventional indicators for two case projects.
3.3.2. Evaluation Results Using Monitoring Data of Key Performance Indicators in This Paper
Apart from the indicators of Total Resource Consumption and Indoor Environmental Quality, monitoring data of other key performance indicators such as Outdoor Environmental Quality, HVAC system, User behavior also collected and compared, the results are listed in Table 13.
Table 13.
The monitoring data of other key performance indicators for two case projects.
3.3.3. Analysis of Evaluation Results
As it is shown in Table 12, if the evaluation was conducted only using conventional indicators (Total Resource Consumption and Indoor Environmental Quality), the operational performance of the two projects would be considered very close, because the difference ratios for the two projects in terms of the conventional indicators are no more than 5%. However, if more key performance indicators such as Outdoor Environmental Quality, HVAC system, User behavior introduced for evaluation, the conclusion would be contradictory, because most of the difference ratios for the two projects in terms of the other key performance indicators are significant in [13]. For example, although the indoor environmental quality of YL is slightly better than LJ, the outdoor environmental quality of YL is worse than LJ for 8.5%–26.8%. The average value of occupancy rate, window opening rate and door opening rate of YL are all significantly larger than LJ, which means much more cooling load will be generated from the offices in YL, whereas the air conditioning system power consumption per building area of YL is lower than LJ, which can be inferred that the operational performance of air conditioning system of LJ needs to be optimized more urgently. The monitoring data of HVAC system for the two projects also can prove the inference. Therefore, it is necessary to apply a set of key performance indicators (KPIs) for green building operations monitoring, that is more comprehensive and systematic than the conventional monitoring studies, and will provide a whole picture for operational performance of green building.
4. Discussion
4.1. Universality of the Methodology
Although this study initially established an indicators library for operations monitoring of green building based on Chinese green building standards. The method of proposal and elimination of indicators by standards and regulations induction can be applied to other areas around the world. Firstly, the researcher should select the most relevant local standards and regulations in terms of operation stage for green building. The method of incorporation of standards and regulation can be used to initially propose a local indicators library. Secondly, the two principles proposed in Section 2.1.2 in this paper can be introduced to eliminate the less relevant indicators for green building operations monitoring.
As for the supplementary indicators, as discussed in the above section, the indicator in terms of occupant satisfaction is not adapted to China’s national conditions at the present stage. However, it is suggested to supplement the indicator of occupant satisfaction to the key performance indicators of green buildings for the developed regions, such as North America, Europe and Japan.
In terms of selection of KPIs for green building operations monitoring, local experts with different background (include but not limit to research, design, consulting, monitoring and management of green building) should be carefully chosen. Based on the SMART principle proposed in Section 2.2 of this paper, the local experts can screen the key performance indicators most adapted to local development conditions of green building.
4.2. Limitations and Future Works
This study mainly focused on the establishment process of key performance indicators for green building operations monitoring. The methodology can be used for other researchers to propose KPIs according to local development situation and preference of green building. However, there are still some limitations of this work.
Firstly, how to utilize the key performance indicators proposed in this study for overall assessment of green building operation should be studied in the future. For example, the assessment method of the LEED [7] and BREEAM [8] standard is assigning the credits different scores, and accumulating the scores directly for an overall evaluation score. While the assessment method of the Assessment standard for green building in China [10] is accumulating the scores with different weights. The assessment method of CASBEE standard [9] is relatively complex, the overall evaluation result defined as Built Environment Efficiency (BEE). The value of BEE is calculated from the Environmental Quality of Building (Q) score divided by the Environmental Load of Building (LR) score. Accordingly, the indicators of CASBEE have been incorporated into two categories, which are Q and LR. There are strengths and weakness for different methods. Method selection for overall evaluation of KPIs for green building operations monitoring needs to be further studied in the future. Subsequently, to obtain an overall evaluation result, the weight (or specific score) for each key performance indicator needs to assign reasonably. According to the SMART principle, it is strongly recommended that the management team of building to specifically assign weights for KPIs considering the building operations condition and user demands.
Secondly, the indicators in terms of user behaviors cannot be used for evaluating the building operations performance directly. However, the conjoint analysis method between monitoring data of user behaviors and other indicators (building energy performance, HVAC system, IEQ, etc.) could be further studied to further reveal the practical values of indicators regarding user behaviors. For example, several typical behavior patterns can be classified, such as “energy efficient behavior pattern”, “normal behavior pattern”, “energy wasting behavior pattern”, to explore the detailed relationship behind monitoring data of user behavior and building energy performance. Moreover, the relationship between window (door)-opening behaviors and indoor air quality and thermal comfort might be adverse. The window or door kept opening may improve the indoor air quality, yet would make the indoor temperature and humidity rather difficult to be controlled in a comfortable range. How to take advantage of monitoring data of user behavior indicators to improve the indoor environmental quality comprehensively should be studied in the future.
5. Conclusions
This study established an indicators library for operations monitoring of green building based on relevant standards and literature review in this field. “SMART” principle and the Delphi method were adopted to select and propose a more comprehensive and systematic KPIs more practical and efficient than the evaluation standards, and also more comprehensive and systematic than the conventional monitoring studies for operational performance of green building. Subsequently, two projects in China were selected for case study of key performance indicators for green building operations monitoring to validate the feasibility and advancement. Based on the analyses, the following conclusions may be drawn:
- (1)
- The KPIs for green building operations monitoring proposed in this study give consideration to both integrity and flexibility, and can be applied to different green buildings. They can contribute to intuitive understanding of green building operation status for the building owner, management team, and especially, the building users.
- (2)
- The monitoring data of the KPIs can be utilized for preliminary evaluation of the building performance, which can provide foundation for further specific diagnosis.
- (3)
- The KPIs can provide some enlightenment and reference for systematic evaluation of the “green degree” of green building operations and improvement of the green building operations performance.
Author Contributions
Conceptualization, J.L. and H.Z.; methodology, J.L.; validation, J.L. and H.Z.; formal analysis, J.L.; writing—original draft preparation, J.L.; writing—review and editing, J.L.; supervision, Q.W.; funding acquisition, Q.W. All authors have read and agreed to the published version of the manuscript.
Funding
This study is supported by the China National Key R&D Program (Grant No.2018YFC0704806, Grant No.2018YFF0215804), Capital Airports Holding Company Science and Technology Program (Grant No.XJC[2019]-KY-024), National Science and Technology Support Program (Grant No.2015BAJ04B02).
Conflicts of Interest
The authors declare no conflict of interest. The funders had no role in the design of the study; in the collection, analyses, or interpretation of data; in the writing of the manuscript, or in the decision to publish the results.
References
- Zuo, J.; Zhao, Z.-Y. Green building research–current status and future agenda: A review. Renew. Sustain. Energy Rev. 2014, 30, 271–281. [Google Scholar] [CrossRef]
- Chinese Society for Urban Studie. China Green Building 2018; China Architecture & Building Press: Beijing, China, 2018. (In Chinese) [Google Scholar]
- Newsham, G.R.; Mancini, S.; Birt, B.J. Do LEED-certified buildings save energy? Yes, but…. Energy Build. 2009, 41, 897–905. [Google Scholar] [CrossRef]
- Scofield, J.H. Efficacy of LEED-certification in reducing energy consumption and greenhouse gas emission for large New York City office buildings. Energy Build. 2013, 67, 517–524. [Google Scholar] [CrossRef]
- Davies, M.; Oreszczyn, T. The unintended consequences of decarbonising the built environment: A UK case study. Energy Build. 2012, 46, 80–85. [Google Scholar] [CrossRef]
- Asmone, A.S.; Conejos, S.; Chew, M.Y. Green maintainability performance indicators for highly sustainable and maintainable buildings. Build. Environ. 2019, 163, 106315. [Google Scholar] [CrossRef]
- Green Building Council. LEED v4 OM&EM, Released by U.S. Available online: www.usgbc.org (accessed on 1 October 2014).
- BRE Group. BREEAM In-Use International 2015. Available online: https://www.breeam.com (accessed on 1 September 2015).
- Institute for Building Environment and Energy Conservation. CASBEE for Existing Buildings v2014. Available online: http://www.ibec.or.jp/CASBEE/certification/building_certification.html (accessed on 8 July 2014). (In Japanese).
- Ministry of Housing and Urban-Rural Development of the People’s Republic of China. Assessment Standard for Green Building (GB/T50378-2014); China Architecture & Building Press: Beijing, China, 2014. (In Chinese)
- Chinese Society for Urban Studie. Green Building Inspection Technical Standard (CSUS-GBC 05-2014); Chinese Society for Urban Studie: Beijing, China, 2014. (In Chinese) [Google Scholar]
- Geng, Y.; Ji, W.; Wang, Z.; Lin, B.; Zhu, Y. A review of operating performance in green buildings: Energy use, indoor environmental quality and occupant satisfaction. Energy Build. 2019, 183, 500–514. [Google Scholar] [CrossRef]
- Jing, R.; Wang, M.; Zhang, R.; Li, N.; Zhao, Y. A study on energy performance of 30 commercial office buildings in Hong Kong. Energy Build. 2017, 144, 117–128. [Google Scholar] [CrossRef]
- Diamond, R.; Opitz, M.; Hicks, T.; von Neida, B.; Herrera, S. Evaluating the Energy Performance of the First Generation of LEED-Certified Commercial Buildings; Office of Scientific & Technical Information Technical Reports: Washington, DC, USA, 2011.
- Christensen, J.E.; Chasapis, K.; Gazovic, L.; Kolarik, J. Indoor Environment and Energy Consumption Optimization Using Field Measurements and Building Energy Simulation. Energy Procedia 2015, 78, 2118–2123. [Google Scholar] [CrossRef]
- Pei, Z.; Lin, B.; Liu, Y.; Zhu, Y. Comparative study on the indoor environment quality of green office buildings in China with a long-term field measurement and investigation. Build. Environ. 2015, 84, 80–88. [Google Scholar] [CrossRef]
- Altomonte, S.; Schiavon, S. Occupant satisfaction in LEED and non-LEED certified buildings. Build. Environ. 2013, 68, 66–76. [Google Scholar] [CrossRef]
- Lin, B.; Liu, Y.; Wang, Z.; Pei, Z.; Davies, M. Measured energy use and indoor environment quality in green office buildings in China. Energy Build. 2016, 129, 9–18. [Google Scholar] [CrossRef]
- Xia, H. Analysis of energy consumption data of a green office building based on energy consumption and environmental monitoring system. Shanghai Energy Conserv. 2013, 10, 4–9. [Google Scholar]
- Brown, C.; Gorgolewski, M. Assessing occupant satisfaction and energy behaviours in Toronto’s LEED gold high-rise residential buildings. Int. J. Energy Sect. Manag. 2014, 8, 492–505. [Google Scholar] [CrossRef]
- Martín-Gómez, C.; Vidaurre-Arbizu, M.; Eguaras-Martínez, M. Sensor Placement for BPM Analysis of Buildings in Use to Implement Energy Savings through Building Performance Simulation. J. Eng. Archit. 2014, 2, 119–133. [Google Scholar]
- Bandera, C.F.; Ruiz, G.R. Towards a New Generation of Building Envelope Calibration. Energies 2017, 10, 1587. [Google Scholar] [CrossRef]
- Hensen, J. Building Performance Simulation for Design and Operation; Informa UK Limited: London, UK, 2012. [Google Scholar]
- Eguaras-Martínez, M.; Vidaurre-Arbizu, M.; Martín-Gómez, C. Simulation and evaluation of Building Information Modeling in a real pilot site. Appl. Energy 2014, 114, 475–484. [Google Scholar] [CrossRef]
- Attia, S.; De Herde, A.; Gratia, E.; Hensen, J. Achieving informed decision-making for net zero energy buildings design using building performance simulation tools. Build. Simul. 2013, 6, 3–21. [Google Scholar] [CrossRef]
- Ding, S.X.; Yin, S.; Peng, K.; Hao, H.; Shen, B. A Novel Scheme for Key Performance Indicator Prediction and Diagnosis With Application to an Industrial Hot Strip Mill. IEEE Trans. Ind. Inform. 2012, 9, 2239–2247. [Google Scholar] [CrossRef]
- Zhang, K.; Hao, H.; Chen, Z.; Ding, S.X.; Peng, K. A comparison and evaluation of key performance indicator-based multivariate statistics process monitoring approaches. J. Process. Control 2015, 33, 112–126. [Google Scholar] [CrossRef]
- Mahmoud, A.S.; Sanni-Anibire, M.O.; Hassanain, M.A.; Ahmed, W. Key performance indicators for the evaluation of academic and research laboratory facilities. Int. J. Build. Pathol. Adapt. 2019, 37, 208–230. [Google Scholar] [CrossRef]
- Mackrill, T.; Ebsen, F.; Antczak, H.B.; Svendsen, I.L. Care planning using SMART criteria in statutory youth social work in Denmark: Reflections, challenges and solutions. Nord. Soc. Work. Res. 2017, 8, 64–74. [Google Scholar] [CrossRef]
- Bexelius, A.; Carlberg, E.B.; Löwing, K. Quality of goal setting in pediatric rehabilitation-A SMART approach. Child Care Health Dev. 2018, 44, 850–856. [Google Scholar] [CrossRef] [PubMed]
- Balasubramanian, R.; Agarwal, D. Delphi technique—A review. Int. J. Public Health Dent. 2013, 3, 16–25. [Google Scholar]
- Mckenzie, D. Web of Science. Bull. Med. Libr. Assoc. 1998, 86, 629–631. [Google Scholar]
- Bakkalbasi, N.; Bauer, K.; Glover, J.; Wang, L. Three options for citation tracking: Google Scholar, Scopus and Web of Science. Biomed. Digit. Libr. 2006, 3, 7. [Google Scholar] [CrossRef]
- Dong, J.; Winstead, C.; Nutaro, J.; Kuruganti, T. Occupancy-Based HVAC Control with Short-Term Occupancy Prediction Algorithms for Energy-Efficient Buildings. Energies 2018, 11, 2427. [Google Scholar] [CrossRef]
- Wang, F.; Feng, Q.; Chen, Z.; Zhao, Q.; Cheng, Z.; Zou, J.; Zhang, Y.; Mai, J.; Li, Y.; Reeve, H. Predictive control of indoor environment using occupant number detected by video data and CO2 concentration. Energy Build. 2017, 145, 155–162. [Google Scholar] [CrossRef]
- Fowler, K.M.; Rauch, E.M.; Henderson, J.W.; Kora, A.R. Re-Assessing Green Building Performance: A Post Occupancy Evaluation of 22 GSA Buildings; Pacific Northwest National Lab: Richland, WA, USA, 2010.
- Baylon, D.; Storm, P. Comparison of Commercial LEED Buildings and Non-LEED Buildings within the 2002–2004 Pacific Northwest Commercial Building Stock; American Council for an Energy-Efficient Economy: Washington, DC, USA, 2008. [Google Scholar]
- Turner, C. LEED Building Performance in the Cascadia Region: A Post Occupancy Evaluation Report; USGBC: Washington, DC, USA, 2006. [Google Scholar]
- Jia, M.; Srinivasan, R.; Raheem, A. From occupancy to occupant behavior: An analytical survey of data acquisition technologies, modeling methodologies and simulation coupling mechanisms for building energy efficiency. Renew. Sustain. Energy Rev. 2017, 68, 525–540. [Google Scholar] [CrossRef]
- Gunay, H.B.; O’Brien, W.; Beausoleil-Morrison, I. A critical review of observation studies, modeling, and simulation of adaptive occupant behaviors in offices. Build. Environ. 2013, 70, 31–47. [Google Scholar] [CrossRef]
- Klein, L.; Kwak, J.-Y.; Kavulya, G.; Jazizadeh, F.; Becerik-Gerber, B.; Varakantham, P.; Tambe, M. Coordinating occupant behavior for building energy and comfort management using multi-agent systems. Autom. Constr. 2012, 22, 525–536. [Google Scholar] [CrossRef]
- Tanner, R.A.; Henze, G.P. Stochastic control optimization for a mixed mode building considering occupant window opening behaviou. J. Build. Perform. Simul. 2014, 7, 427–444. [Google Scholar] [CrossRef]
- Alfakara, A.; Croxford, B. Using agent-based modelling to simulate occupants’ behaviours in response to summer overheating. In Proceedings of the Symposium on Simulation for Architecture and Urban Design, Society for Computer Simulation International, Tampa, FL, USA, 13–16 April 2014; p. 13. [Google Scholar]


© 2020 by the authors. Licensee MDPI, Basel, Switzerland. This article is an open access article distributed under the terms and conditions of the Creative Commons Attribution (CC BY) license (http://creativecommons.org/licenses/by/4.0/).