Abstract
Heat pumps in combination with a photovoltaic system are a very promising option for the transformation of the energy system. By using such a system for coupling the electricity and heat sectors, buildings can be heated sustainably and with low greenhouse gas emissions. This paper reveals a method for dimensioning a suitable system of heat pump and photovoltaics (PV) for residential buildings in order to achieve a high level of (photovoltaic) PV self-consumption. This is accomplished by utilizing a thermal energy storage (TES) for shifting the operation of the heat pump to times of high PV power production by an intelligent control algorithm, which yields a high portion of PV power directly utilized by the heat pump. In order to cover the existing set of building infrastructure, 4 reference buildings with different years of construction are introduced for both single- and multi-family residential buildings. By this means, older buildings with radiator heating as well as new buildings with floor heating systems are included. The simulations for evaluating the performance of a heat pump/PV system controlled by the novel algorithm for each type of building were carried out in MATLAB-Simulink® 2017a. The results show that 25.3% up to 41.0% of the buildings’ electricity consumption including the heat pump can be covered directly from the PV-installation per year. Evidently, the characteristics of the heating system significantly influence the results: new buildings with floor heating and low supply temperatures yield a higher level of PV self-consumption due to a higher efficiency of the heat pump compared to buildings with radiator heating and higher supply temperatures. In addition, the effect of adding a battery to the system was studied for two building types. It will be shown that the degree of PV self-consumption increases in case a battery is present. However, due to the high investment costs of batteries, they do not pay off within a reasonable period.
1. Introduction
In order to stop global warming by reducing greenhouse gas emissions as jointly decided by the Paris Agreement from 2015 [1,2] as in many other countries Germany’s energy system is undergoing a transformation: away from conventional energy sources towards renewable energy. A noticeable share of renewable energy has already been established, especially in the electricity sector. In 2018, renewable energy accounted for 37.8% of gross electricity consumption in Germany [3]. The fact that this transformation is not only attributed to the electricity sector, but also to the heating and the mobility sectors, emphasizes the need to transfer renewable electricity to the heating and mobility sectors, which can be achieved by heat pumps (HP) and e-mobility. In this respect, a combined system of heat pump and photovoltaics (PV) is a suitable application for heating purposes in the residential sector. However, a proper control algorithm is needed in order to shift the periods of heat pump operation to times of PV generation by the help of energy storage systems as best as possible. This benefits the transformation of the energy system twice: firstly, the aforesaid goal of transferring renewable electricity to the heating sector is met; secondly, due to the direct utilization of PV electricity within the building, the load on the grid is significantly reduced.
This paper examines to what extent PV electricity can be utilized directly for residential heat pumps in the building sector by applying a proper control algorithm. For this purpose, the dimensioning of heat-pump systems in combination with photovoltaics will be presented for four types of reference buildings differing by the year of construction for both single- and multi-family houses. Afterwards, the results of simulations will be outlined and discussed, in order to reveal the potential fraction of PV electricity consumption by the heat pump for each building type. By this means, the paper is intended to provide a database for the analysis of entire regions mainly equipped with heat pumps for covering the heat demand of residential buildings.
2. Literature
A notable number of publications dealing with control algorithms for heat pumps are available in the open literature, and a selection of publications closely related to the topics discussed in this paper are presented in the following.
The paper by Akmal et al. [4] describes a simulation model in MATLAB-Simulink®, which uses the thermal capacity of a floor heating system for providing flexibility for a HP. Different control strategies for scheduling the heat pump were applied and validated by laboratory experiments. In addition, the model presented offers the option to identify building temperatures and include them in the demand-side management. However, this study only examines the flexibility of floor heating systems, which are almost exclusively found in new buildings. This paper examines the flexibility of hot water tanks serving as thermal energy storage (TES), since they can be installed in existing buildings without too much effort. Allison et al. [5] present a control system with predictive load shifting for heat pumps, which has been installed in a low-carbon test house near Glasgow. The control system predicts the start and stop times of the heat pump for the day ahead based on forecasts for air temperatures and solar radiation. The controller was able to maintain indoor temperatures between 18 and 23 °C for 87% of the hours between 7 am and 10 pm, but the overall performance of the system was quite poor, since an electric immersion heater covered most of the heat demand. The simulation model published by Allouhi et al. [6] combines a MATLAB model of a thermoelectric heat pump with meteorological data as well as a TRNSYS (TRaNsient SYstems Simulation) model to identify the heat load of a small office building. The simulations showed that the thermoelectric heat pump was able to fully respond to the heating demand of the office building performing on the coldest day of the year with a coefficient of performance (COP) of 2.49. This study combines a heat pump to a building model without any additional storage capacities like TES. Jonas et al. [7] carried out a simulation study on how a heat pump combined with solar thermal collector performs, and they quantify the environmental impact of such a system. In moderate climates, depending on the chosen concept, a heat-pump solar thermal system can save up to 87% of the cost compared to a conventional gas-fired heating system. Additionally, 33% to 69% savings in primary energy were achieved with such systems as well as a reduction of CO2 emissions in the range of 52% and 78%. The combination of a heat pump with a photovoltaic system is not examined. In the paper of Mastouri et al. [8], a predictive control for building heating systems is introduced for systems with heat pump, solar thermal collectors and a thermal energy storage tank. Simulations were carried out over a time period of 24 h and the results showed that the investigated system performed quite well and the electricity consumption of the heat pump did not exceed 2.5 kW. Longer periods of operation such as an entire year for covering seasonal effects in addition were not carried out. Péan et al. tested control strategies for a variable speed heat pump experimentally [9]. With a model predictive control (MPC), the developed strategies were tested in a controlled climate chamber where loads of virtual buildings were applied. The aim was to minimize the thermal energy demand of the building as well as the operational costs of the heat pump and its CO2 emissions. The results reveal, that by introducing a TES to the system, flexibility was provided and the operational costs were reduced by 1% to 7% and the CO2 emissions by 3% to 17%. Rimbala et al. [10] analyzed in their work how accurate the calculation of the necessary energy demand for heating of residential buildings equipped with heat pumps need to be. Reference values obtained by solving partial differential equations for heat losses and heat consumption with respect to actual temperature profiles in time were compared to a static wall model without heat capacity together with average daily and monthly temperatures. The results show that the error of the calculations for COP is less than 2.5%. In their analysis of micro-grid integration, Song et al. [11] performed DeST (Designer’s Simulation Toolkits) simulations for a system with PV, thermal energy storage, and heat pumps. Taking mechanical and heat losses, delay times and other factors into account, the economic benefits were greatly improved after applying their micro-grid simulation. This study of Song et al. simulated the performance of a specific building, the Hebei Electric Power Research Institute main building. Tangwe et al. [12] predict the COP of an air-source heat pump for heating domestic hot water by simulations. The relevant input data was taken from experiments where data was recorded from the heat pump cycle and at domestic hot-water generation. The COP of the heat pump during the experiments was on average above 2. Two scenarios were applied: at first, no domestic hot water was drawn while the heat pump was running; second, hot water was drawn any time regardless of the operation of the heat pump. With multiple linear surface fitting models in combination with simulation models, it was demonstrated that there was no significant difference of COP in both scenarios. Verbruggen et al. [13] developed grid impact indicators for evaluating the performance of control mechanisms for net-zero energy buildings on the power grid without simulation of the grid itself. Heat pumps together with thermal energy storage were used to shift the exchange of electricity between the building and the grid. The modelling of the simulation was done in Modelica. Different indicators like the load match index or the loss-of-load probability were investigated and rated. These indicators are easy to determine and, by this means, they are able to serve as a useful tool for preliminary performance evaluations of controls. To provide flexibility for the operation of the heat pump in combination with PV, a TES is added to the heat pump system in the presented paper. This is a common way even in other research fields like concentrated solar power plants. Rashid et al. [14,15] carried out simulations of a (concentrated solar power) CSP plant with an additional TES and the simulation showed that with the utilization of a TES, the share of solar fraction of the CSP was increased.
As in the paper by Verbruggen et al., many authors refer to the interaction of the heat pump with the power grid and focus on controlling a system of multiple heat pumps combined in a micro grid. In contrast, in our paper we concentrate on the building itself by trying to maximize the amount of PV electricity generated onsite for driving the heat pump. In other words, our intention is to minimize the exchange of electricity with the power grid and by this means reduce the load on the grid. In this context, this paper is structured as follows: in Section 3 we present the definition of reference buildings and related load profiles, and we introduce the system components like heat pump, PV plant, thermal energy storage and battery. In addition, we supply a short description of the simulation model and the control algorithm utilized to maximize the onsite utilization of PV electricity. Section 4 is attributed for display and discussion of the results from the simulations. A detailed overview is presented revealing the performance of the heat pump/PV systems in 8 reference buildings, 4 single-family and 4 multi-family houses, of different years of construction. Moreover, results are given in two categories regarding the type of heat pump: air-source and ground-source heat pumps were applied. At the end of Section 4, appropriate systems in terms of heat-pump size are proposed for all building categories and for both types of heat pumps. Finally, it will be outlined how the application of a battery will help to increase the share of onsite consumption of PV electricity, and adequate battery sizes are selected. Section 5 contains the conclusion of the findings presented in the paper, and further research topics are outlined.
3. Methodology
3.1. Reference Buildings and Demand Data
As outlined above, it is intended to characterize the building structure in the residential sector by the definition of reference buildings, which represent different categories with respect to insulation standards resulting in different levels of heat demand for space heating. Evidently, the insulation standard can be attributed to the year of construction, and the following categories were selected (The definition of the categories 1–4 for the reference buildings has been carried out by our project partner, the Institute of Energy Economics and Rational Energy Use (IER) of the University of Stuttgart.):
- Construction before 1979.
- Construction between 1979 and 2001.
- Construction between 2002 and 2015.
- Construction after 2015.
The four aforesaid categories are applied to both, single-family and multi-family houses resulting in a total number of 8 reference buildings.
With respect to the year of construction, different heating systems with different supply temperatures are defined. Category 4 buildings are assumed to be heated by a floor-heating system; instead, existing buildings of categories 1–3 comprise a radiator-heating system. This assumption is based on the fact that the existing heating system will still be used, because retrofitting a radiator-heating system by a floor heating system in existing buildings is not appropriate, at least due to high cost. However, in order to enable radiator-heating systems operating at lower supply temperatures with respect to the use of a heat pump, the radiator areas need to be increased. Within the analysis a factor of 1.3 was used in this respect, resulting in maximum supply temperatures of 55 °C. Floor-heating systems are analyzed at a supply temperature of 35 °C; return temperatures are 35 °C and 25 °C, respectively. Another restriction for running a heat pump in existing buildings is attributed to the insulation standard. It is assumed that the specific heat demand for space heating needs to be lower than 70 kWh/m2/a for a single-family house (SFH) and lower than 50 kWh/m2/a for a multi-family house (MFH), in order to qualify for a heat pump. Higher heat demands cannot be covered by a heat pump even with an increased area of the radiators, because the supply temperature will be too high to be met by a heat pump at a reasonable COP.
Yearly energy demands for the reference buildings are determined with the help of the heat atlas of Baden-Württemberg, Germany [16]. For over 1000 municipalities and unincorporated areas in Baden-Württemberg, the atlas contains data on their demographic characteristics (e.g., number of inhabitants or employees per municipality and development), the building stock is divided into residential buildings and non-residential buildings with respect to the year of construction as well as settlement area and their distribution according to settlement types. This data can be condensed to mean building size, mean number of residents per building and mean specific heat demand for space heating. This data can be summarized for each category of the reference buildings listed above, which finally serves for deriving mean yearly demands for space heating, domestic hot water (DHW) and electricity for each category. It should be noted that only buildings are taken from the data source, which do not exceed the aforesaid limits regarding specific heat demand for space heating, in order to ensure that the reference buildings are eligible for installation of a heat pump.
As the method described so far results in energy demands for the present status of the year 2020, it is obvious that space heat demand in particular will decline in the future due to further efforts in insulation. For that reason, within this research another perspective is made up by extrapolating space heating demand up to the year 2050. In detail, it is assumed that there is a retrofit of the windows every 30 years, insulation of the facade every 40 years and renewal of roofs or roof areas every 50 years. In addition, energy demand for DHW is reduced as well due better insulation of pipes and hot water tanks. This results in lower demand data for the reference buildings in 2050 along with lower supply temperatures. Instead of 55 °C, the maximum supply temperature for radiator-heating systems is reduced to 45 °C in 2050. Moreover, by this means the number of buildings eligible for heat pumps will increase until 2050.
The daily demand profiles for the reference buildings regarding space heating, DHW and electricity are created by a load profile generator developed at the University of Stuttgart [17]. This generator is based on a tool for analyzing electrical load profiles by Markov chains, and it was combined with a tool for the generation of thermal load profiles based on the technical rule VDI (Association of German Engineers) 4655 [18]. In addition, statistical data for the presence of people in households with full-time, part-time or no working persons during the day is added to the generator. The latter serves as the basis for the electrical load profile as well as for domestic hot water consumption. The resolution of the load profiles is 15 min. Based on the yearly demands for space heating, DHW and electricity the load profiles are adapted to each reference building. Figure 1 shows an example of the load profiles for a single-family house.
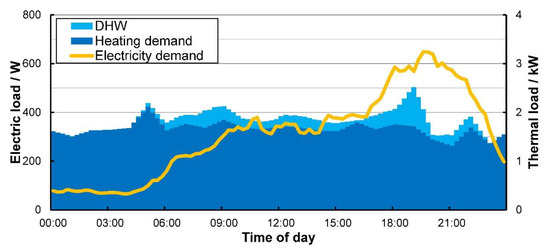
Figure 1.
Daily load profiles for a single-family house (SFH) showing demands for space heating, domestic hot water (DHW, cumulative to space heating) and electricity demand.
The table in Appendix A lists all data regarding yearly energy demands for space heating, DHW and electricity, heating systems together with supply and return temperatures for all reference buildings in the year 2020 as well as in the year 2050.
3.2. Heat-Pump System
The heat-pump systems investigated in the simulations consist of either a ground source brine–water heat pump (BWHP) or an air–water heat pump (AWHP), a TES and an electric heater to assist the heat pump to cover load peaks for DHW or space heating. Moreover, a battery is added to the system, in order to study the impact of an additional energy storage for electricity.
As mentioned before, this paper focuses on BWHP and AWHP, as these are nowadays the most common heat pump technologies installed in residential buildings [19]. Other heat pump types such as absorption type heat pumps or heat pumps using CO2 as refrigerant are not considered. The heat pumps are implemented for monoenergetic operation; hence, the electric heater supports the heat pump only in case of peak load, which cannot be covered by heat pump and TES.
As there are many heat pumps available on the market, it is important to find good correlations for thermal and electric power, in order to provide an appropriate basis for the simulation. For that reason, data sheets from various heat pump suppliers were studied with respect to thermal and electric power at different temperatures for both BWHP and AWHP. In detail, for SFH the data covers heat pumps from 5 to 18 kW thermal power; for MFH heat pumps range from 18 to 35 kW. After collecting data for as many as 65 different heat pumps, the data was transferred to the “Curve Fitting Tool” in MATLAB, in order to develop correlations for thermal and electric power as a function of air or brine temperature and heating system supply temperature. Details as well as final correlations are summarized in a separate publication [20].
In order to reveal the impact of heat pump size on overall system performance, especially with respect to the fraction of PV electricity, which can directly be utilized by the heat pump, heat pumps of different sizes are implemented in the simulation model. After a first, rough classification of necessary heat pump thermal power for SFH and MFH based on [21], in the case of SFH reference buildings, heat pumps with a nominal thermal power of 6, 8, 10 and 17 kW are implemented. For MFH reference buildings simulations are carried out with heat pumps of 10, 17, 25, 30 and 35 kW thermal power with one exception as follows: since the demand for space heating for category 4 MFH buildings becomes quite small in 2050, in this case heat pumps of 6 to 17 kW thermal power are implemented. The power of the auxiliary electric heater is fixed at 3 kW for SFH and at 5 kW for MFH.
As already mentioned in the introduction, a control algorithm is introduced for shifting the periods of heat pump operation to peak times of photovoltaic generation by energy storages. In a first attempt, it is intended to utilize the TES made up by a hot water tank, which usually comes along with a heat-pump system. In the simulation, a common water tank is implemented for serving both space heating and DHW. The obstacle in finding a proper dimensioning of the TES is, on the one hand, that the TES should not become too small, in order to provide reasonable flexibility for shifting the periods of the heat pump operation. On the other hand, the TES is restricted in size as there is often limited space in residential buildings, especially in SFH. However, in order to study the effect of TES size, different volumes are applied in the simulation as follows: For SFH the volume of the TES differs between 300 and 1600 L for space heating and between 100 and 1000 L for DHW. TES size for MFH varies between 300 and 3000 L for space heating and from 200 to 2000 L for DHW.
3.3. PV Plant and Battery
Besides the data for heat demand and building size, the heat atlas [16] as well provides data for roof surfaces for the reference buildings, which is used to calculate the peak power of a potential rooftop PV plant. According to [22,23], an average factor of 7.5 m2 roof surface per kWp can be applied for conversion. In case of SFH, the roof surface for the reference buildings does not differ much between the four categories. Hence, a PV plant comprising a peak electric power of 6 kWp is established for all SFH reference buildings. In the case of MFH, the peak electric power of the plants applied range from 22 to 33 kWp (see Appendix A). The peak power of the PV plants becomes smaller in newer buildings as the size of the buildings in general decreases according to reference [16].
Data for PV electricity generation profiles is taken from real measurements at a PV plant near Stuttgart with a resolution of 15 min. Since this plant shows a peak power of 540 kWp, the data are normalized to a plant with a nominal power of 1 kWp and scaled afterwards to the size of the plants selected for the reference buildings.
As stated before, a battery was added to the system in order to investigate its additional effect on onsite PV electricity utilization. Regarding the control algorithm, the battery is implemented as follows: whenever there is a surplus of PV electricity beyond the demand of heat pump and household, the battery is charged. Only in the case when the battery is fully charged will any PV electricity be fed into the grid. In the case of no or low PV electricity generation, heat pump and household demand are covered from the battery until the battery is fully discharged. Only afterwards, electricity is taken from the grid to cover any remaining demand. By this means, the chance for running the heat pump on PV electricity in times with low or no PV generation increases and, therefore, the fraction of PV electricity utilized onsite raises.
While PV systems with battery storages are increasingly being offered on the market for SFH, such systems are less popular for MFH, since they need to be large in order to generate a significant added value, which is contradicted by high battery cost. For that reason, the studies presented in this paper are limited to SFH, and battery size is varied between 2 and 30 kWh.
3.4. Simulation Model
The simulation model is developed in MATLAB-Simulink®. Basically, the model consists of four main blocks: Forecast, Optimization, Internal Control and Dynamic Models (see Figure 2).
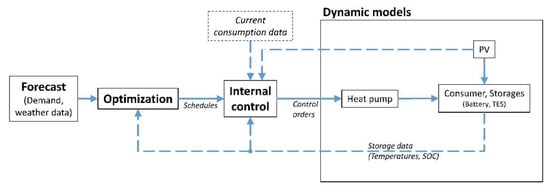
Figure 2.
Schematic flowchart of the simulation model.
For simplification, the forecast module is neglected here and perfect foresight is applied. The optimization block contains the control algorithm, which is implemented by a heuristic Monte Carlo algorithm with a target function for maximizing the PV electricity utilization onsite for covering heat-pump and household demand. The algorithm is embedded in the Simulink model as a MATLAB-Function block. With respect to the Monte Carlo method, the algorithm generates 1000 schedules by random for an optimization horizon of 24 h. Minimum and maximum storage capacity of the TES as well as minimum runtime and minimum resting time of the heat pump serve as boundary conditions, in order to force the generation of schedules by random into practical limits. Afterwards, all schedules are sorted by the share of onsite PV utilization. From the 10 best schedules in this respect, the schedule offering the smallest number of start/stops of the heat pump is finally selected. By this means, the number of start/stops of the heat pump can be limited, which benefits its lifetime. The final schedule is forwarded to the internal control (IC) block, which is executed within the Stateflow environment of MATLAB. The IC processes the schedule and operates the heat pump with respect to the data arising from the entire system, such as demand data, TES temperatures, supply and return temperatures from the heating circuits. Within the model it is intended that the internal control acts in the same way as the control of an existing heat pump. The dynamic models represent the components of the heat-pump system like the heat pump itself, the TES or the PV plant. In order to evaluate these components, the models of the CARNOT (Conventional and Renewable eNergy Optimization Toolbox) Blockset [24] are used, partly improved by further data and correlations as i.e., the correlations for thermal and electric power of the heat pump introduced above. Originally, the model was developed for combined heat and power plants (CHP) and, therefore, a detailed description of the basic model can be found in [25,26]. The model was afterwards adapted for heat pumps and a more detailed description of the model is provided in [27]. The difference between the model used for the current study and the model described in the literature [27] is the replacement of a single-node model of a house, where the floor serves as TES, by two TES-models made up by hot water tanks from CARNOT-Blockset [24], one for space heating and one for DHW. The demand profile for space heating, as described in Section 3.1 is applied for the heating TES as a lookup table in Simulink with respect to ambient temperature and heating curve. The DHW demand profile is processed in a similar way. The logic of the internal control block controls the heat pump according to the schedule and, with a higher priority, according to the temperatures of the TES, in order to maintain comfort in terms of space heating and DHW to the residents of the building at any time. As depicted in Figure 2, the temperatures of the TES are fed back to the internal control block, and if the required supply temperature according to the heating curve can no longer be maintained, the heat pump is turned on. In this case, the internal control block will ignore the schedule’s proposed operation, since the comfort of the residents is violated. Whenever the temperature in the TES reaches the preselected maximum temperature plus a hysteresis of 2 K for taking heat losses into account, the heat pump turns off. While maximum supply temperatures for space heating result from the heating curve as a function of outdoor temperature, the maximum temperature in the DHW TES is set at 50 °C for SFH according to [28], and at 60 °C for MFH.
4. Results
The following section presents the results from the various simulations carried out. At first, the effect of the TES volume is studied, and an appropriate storage size is selected for the reference buildings as a good compromise for providing sufficient flexibility for the heat pump operation, on the one hand, and to meet the special restrictions in residential buildings, on the other hand. Afterwards, the results for a proper dimensioning of the heat pump systems in the reference buildings are presented. Within this section, detailed results will be given for two exemplary buildings followed by a summary of main results for all reference buildings. Finally, the impact of a battery for further improving the share of PV electricity for onsite utilization is revealed.
Since the main target of this study is a maximum share of onsite PV electricity utilization, the parameter for measuring this share is defined as self-sufficiency level (SSL). Since the simulations are carried out for an entire year in order to cover seasonal effects, SSL is calculated based on yearly onsite PV electricity consumption divided by total yearly electricity demand including the heat pump, as given by Equation (1). In addition, it is important to keep an eye on heat pump performance itself, which is given by the well-known seasonal performance factor. However, in this study seasonal performance factor (SPF) for the heat pump only and for heat pump plus auxiliary electric heater (SPF_EH) are distinguished according to Equations (2) and (3).
4.1. Variation of Thermal Energy Storage (TES) volume
As mentioned above, the TES is an important component for the heat pump system as it provides flexibility for the operation of the heat pump and by this means helps to increase the share of onsite PV electricity utilization. In order to find the proper volume of the TES, simulations are carried out at different TES volumes. Figure 3 presents the results of the simulation for category 1 SFH for year 2020 equipped with a BWHP of 8 kW thermal power in terms of the three parameter SSL, SPF and SPF_EH introduced beforehand.
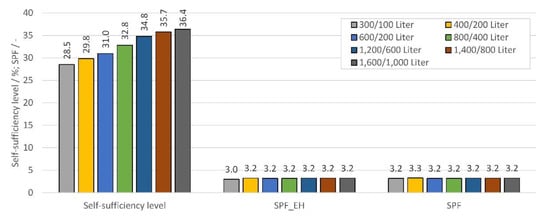
Figure 3.
Results of the thermal energy storage (TES) volume variation for SFH category 1 reference building for year 2020.
Regarding the labelling of the different volumes, i.e., “400/200 L” refers to a 600 L tank with 400 L attributed to space heating and 200 L to DHW. The diagram shows that self-sufficiency level raises with increasing volume of the TES. This result was expected, because a bigger TES enables the heat pump for more flexible operation and by this means for longer periods of operation during times of high PV generation. However, it can be seen that the surplus in SSL becomes smaller at high TES volumes. This effect is well-known for the variation of storage capacity in general [29]. If storage capacity is increased, system performance rises but always less than proportional; hence, system performance is limited even for storage capacity reaching infinity. For that reason, the size of the TES can be limited at a reasonable SSL, where any further increase in SSL requires a non-adequate rise in TES volume. At this point, further restrictions should be considered, which in terms of TES volume is limited space, especially in SFH. Looking at single-tank solutions, a total volume of 800 L is a limit for tanks coming as one piece simply due to width and height of doors within the building. Therefore, within this study all SFH reference building are equipped with an 800 L TES comprising of 600 L for space heating and 200 L for DHW. Regarding Figure 3, SSL can be further increased by a bigger tank, i.e., from 31% for the 800 L tank as selected to 34.8%, but for a tank of more than double size, which is not adequate. Moreover, Figure 3 shows that SPF and SPF_EH are hardly affected by TES volume variation except for the smallest storage, which does not provide enough flexibility for the heat pump and, therefore, forces the heat pump to turn on and off more frequently to serve the thermal demand.
In MFH, limitations of TES volume due to spatial restrictions are of minor importance. For that reason, selection of a proper TES size can focus on system performance to a higher extent. Figure 4 presents results for TES volume variation from the simulation for category 1 MFH for year 2020 equipped with a BWHP with a nominal thermal power of 25 kW. The diagram reveals the same trend as discussed before. System performance in terms of SSL increases with TES size, but the surplus in SSL becomes smaller at higher tank volumes. In addition, a decrease in heat pump performance, given by SPF and SPF_EH, can be observed, if TES volumes are too small. With respect to an adequate value for SSL, the tank of 3000 L volume, 2000 for space heating and 1000 for DHW, is selected for all MFH reference buildings within this study, since a bigger tank of 4000 L provides an increase in SSL from 31.8% to 32.0%, only.
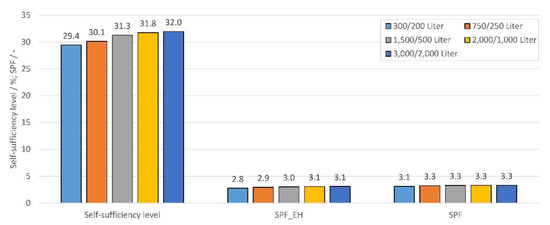
Figure 4.
Results of the TES volume variation for multi-family house (MFH) category 1 reference building for year 2020.
4.2. Variation of Heat-Pump Size
The main purpose of this study is to provide optimal heat-pump sizes for the reference buildings as a guideline. For that reason, in this section the procedure for selection of the most adequate heat pump is outlined based on results from the simulations, which will be displayed and discussed in detail. Thereafter, in the following section tables with major results for all eight reference buildings are presented for BWHP as well as AWHP and for the two years of interest with respect to energy demands, 2020 and 2050.
Exemplary, results are presented for a category 1 MFH building before 1979 and equipped with a BWHP regarding year 2020. With respect to last section, this building consists of a TES providing 3000 L volume, 2000 for space heating and 1000 for DHW. Figure 5 shows the results for SSL, SPF_EH and SPF for different sizes of the BWHP. It can be seen that highest SSL is achieved for the heat pump with 17 kW thermal power. However, SPF_EH is a little higher for bigger heat pumps, because there is less need for the electric heater. For that reason, the BWHP proving 25 kW thermal power is better suited for this reference building.
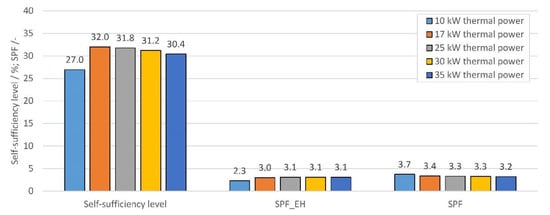
Figure 5.
Self-sufficiency level and seasonal performance factors of MFH category 1 reference building for year 2020 with variation of brine–water heat pump (BWHP) size.
Heat pumps with a thermal power of 30 and 35 kW achieve smaller SSL, since electric power consumption is too high compared to PV electric power, especially in wintertime. One the other hand, the heat pump with 10 kWth is too small for the building. The small heat pump does not provide enough thermal energy to cover the heat demand. In consequence, operating hours of the electric heater rise, which can be seen from power consumption of the electric heater in Figure 6. Evidently, this verifies the explanation given above for the decline of SPF_EH for small heat pumps. In addition, the advantage of the 25 kW heat pump becomes more obvious, since electricity consumption of the electric heater is significantly smaller by at least 1200 kWh/a compared to the 17 kW heat pump.
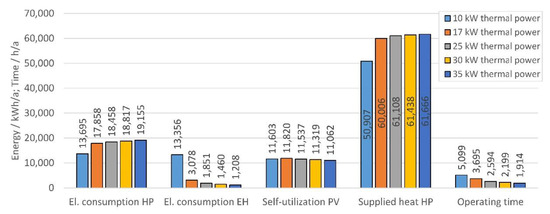
Figure 6.
Electricity consumption of heat pump and electric heater, self-utilization of PV electricity, supplied heat by the heat pump and yearly operating hours for different BWHP systems in MFH category 1 reference building for year 2020.
For comparison, Figure 7 shows results for a SFH category 1 reference building equipped with a BWHP for the year 2020. Again, it can be seen that SSL drops with increasing heat pump size. Since SPF as well as SPF_EH shows a decline for smaller heat pumps, there is no need to apply further heat pumps with even smaller thermal power. Figure 7 indicates that selection of an adequate size of the heat pump ends up in a compromise between SSL and SPF, especially SPF_EH. In this case, heat pumps of 6, 8 and 10 kW thermal power are adequate for the building. While the smallest heat pump provides highest SSL, the heat pump with 10 kW thermal power reaches highest SPF_EH. Hence, the heat pump in between with a thermal power of 8 kW provides the best compromise between SSL and SPF_EH and is for that reason selected as an adequate heat pump for SFH category 1 reference buildings.
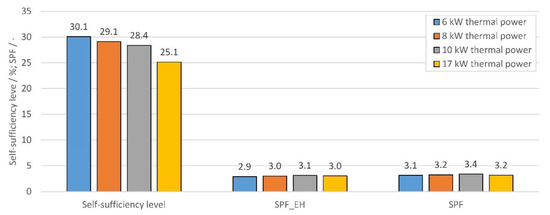
Figure 7.
Self-sufficiency level and seasonal performance factors of SFH category 1 reference building for the year 2020 with variation of BWHP size.
4.3. Summary for Reference Buildings
The following tables summarize the results of the simulations for each reference building. Table 1 reveals results for SFH and Table 2 for MFH. Both tables represent results for both, BWHP and AWHP, as well as for both years considered, 2020 and 2050.

Table 1.
Summary of simulation results for SFH reference buildings for BWHP and air–water heat pump (AWHP) as well as for 2020 and 2050.
Table 2.
Summary of simulation results for MFH reference buildings for BWHP and AWHP as well as for 2020 and 2050.
Table 1 reveals that the adequate size of heat pumps for SFH for both BWHP and AWHP is 8 kW nominal thermal power. According to the literature, in 2017 the average installed thermal power of heat pumps in residential buildings was 10 kW in terms of BWHP and 9.7 kW in terms of AWHP [19]. In addition, it is stated that the thermal power of heat pumps will decrease in future due to increasing efficiencies of heat pumps and due to higher refurbishment rates of buildings. In this respect, the results presented in Table 1 are in accordance with the literature. In addition, SFH reference buildings require an electric heater of 3 kW nominal power to cover peak loads.
Regarding SSL, the data groups around 30%. Hence it can be generally stated, that in SFH equipped with heat pump, PV and TES around 30% of the electricity consumption needed to drive the heat pump and for the household itself can be supplied by the PV plant. A closer look at the results reveals that heat pumps tend to achieve higher SSL in 2050 compared to 2020. This is mainly caused by lower supply temperatures of the heating systems resulting in higher heat pump efficiencies. As a result, the heat pump consumes less electricity, which can more easily be covered by PV generation. The highest level of self-sufficiency of 34.3% is achieved in modern category 4 reference buildings equipped with a BWHP. An AWHP generally achieves lower degrees of self-sufficiency than the BWHP due to its lower efficiency. This fact is verified by the data given for SPF_EH in Table 1, which is predominantly higher for BWHP than for AWHP. In particular in modern buildings of category 4, BWHPs reach seasonal performance factors up to 3.9 including the electric heater, which is mainly attributed to reduced supply temperatures due to floor heating; for radiator heating systems BWHPs reach SPF_EH between 3.0 and 3.5. The small SPF_EH for category 2 buildings in 2050 is caused by the fact that supply temperature of the heating system is still at 55 °C, while for category 1 and 3 buildings this temperature is only at 45 °C in 2050. AWHP show smaller values for SPF_EH between 2.4 and 2.9; highest SPF_EHs are again reached for category 4 buildings.
In a comprehensive study [30] over three years, the Fraunhofer ISE (Institute for Solar Energy Systems) investigated the practical use of heat pump systems in existing single-family houses and determined the SPF achieved. It was found that the average SPF for BWHP is 4.0 with a range between 3.0 and 5.4. For AWHP the average SPF is 3.1 with a range from 2.2 to 4.2. The decisive factor for the SPF according to [30] is the temperature difference of the heat pump between heat source and heat sink in the respective systems: the lower the temperature difference, the more efficient is the heat pump. This corresponds to the results of our study: Buildings in categories 1 to 3 show a higher temperature difference compared to category 4 buildings with underfloor heating. The results of our simulations regarding SPF are in line with the average SPF of [30], although the results of our simulations are a little lower. This is attributed to the fact that our simulations were carried out for average buildings from old to new constructions mainly equipped with radiator heating systems. In contrast, the buildings analyzed in [30] are mainly heated by underfloor systems, which provide lower supply temperatures resulting in higher numbers of SPF.
The thermal power of the adequate heat pumps in MFH reference buildings varies between 8 and 25 kW (see Table 2). Heat pumps providing higher values for thermal power are mainly required for older category 1 and 2 buildings in 2020, as they show higher heat demand at elevated supply temperatures of 55 °C. For modern buildings, the thermal output of the heat pump can be much smaller. In 2050, the category 4 MFH reference buildings require a heat pump of 8 kW (BWHP) and 10 kW (AWHP) nominal thermal power, only. This is again attributed to a reduced heat demand for space heating and to a floor-heating system running at low supply temperatures. For that reason, the size of the TES can be reduced as well and, regarding the data in Table 2, 600 L are necessary for space heating and 500 L for DHW, only. For all MFH reference buildings, an electric heater of 5 kW power is sufficient for covering peak thermal load.
Similar to the results for SFH reference buildings, the newer the building, the higher is the level of self-sufficiency. There is also the trend for BWHP to achieve higher SSL than AWHP. However, compared to SFH, the MFH reference buildings reach higher values for SSL up to 41.0%. The impact of reduced supply temperatures in floor-heating systems is also noticeable for the MFH reference buildings, as modern category 4 buildings reach highest values for SSL and SPF_EH. It is interesting that in 2050, the SPF_EH of category 4 buildings is smaller compared to 2020. At first glance, this seems a paradox, but this phenomenon is caused by the raising ratio of DHW demand to space heating demand from 2020 to 2050. Due to higher standards for thermal insulation, the heating demand for space heating is reduced, while DHW demand remains almost constant. Since DHW generation requires higher supply temperatures—up to 60 °C in the case of MFH—the SPF of the heat pump decreases.
4.4. Increasing Self-Sufficiency Level (SSL) by Adding a Battery Storage
Evidently, the fraction of onsite PV electricity consumption can be increased by adding a battery storage to the system, and the impact of such battery will be discussed in the following. For this purpose, further simulation results will be presented referring to the SFH reference buildings of category 3 and 4.
In Figure 8, the results for SSL, SPF_EH and SPF are displayed for category 3 SFH reference buildings, which were built between years 2002 and 2015. In the simulation, the building is equipped with an 8 kW BWHP and results are given for different battery sizes with respect to the year 2020.
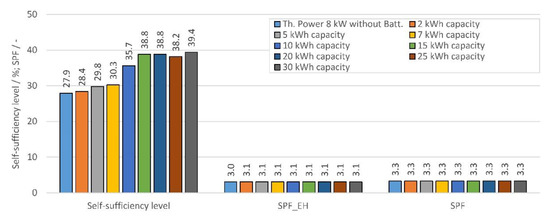
Figure 8.
Self-sufficiency level (SSL) and seasonal performance factors of SFH category 3 reference buildings equipped with a BWHP for year 2020 with variation of battery size.
Figure 8 reveals that SSL increases by more than 10% with the introduction of a battery storage with increasing capacity. The battery allows for storing PV electricity and discharging at times of small or no PV-generation for covering household demand and running the heat pump, which, obviously, benefits SSL. However, as already explained, when varying TES size SSL does not increase proportional to battery size. Instead, it can be seen that at a battery size of 15 kWh, SSL no longer rises. This implies that the capacity of the battery storage can be fixed at a certain value, where any higher capacity does not yield any significant increase in system performance. For that reason, a battery comprising a capacity of 15 kWh is adequate to increase the share of onsite PV electricity utilization from 27.9% to 38.8%, expressed by SSL, in the case of category 3 SFH reference buildings together with an 8 kW BWHP. In contrast, the battery does not affect SPF and SPF_EH at all, as Figure 8 illustrates. For the category 4 SFH building, the results are under the same conditions almost identical, as Figure 9 shows. Again, a battery of 15 kWh capacity is sufficient for boosting the value of SSL by more than 10% from 33.0% to 44.4%. Actually, in this case a battery of 10 kWh capacity may as well be sufficient with respect to gaining a significant increase in SSL. SPF and SPF_EH are again not affected by the battery.
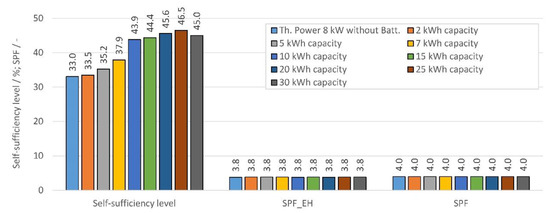
Figure 9.
Self-sufficiency level (SSL) and seasonal performance factors of SFH category 4 reference buildings equipped with a BWHP for year 2020 with variation of battery size.
In summary, the simulations proved the positive effect of a battery on SSL. However, it is questionable whether an investment in a battery of 10 or 15 kWh capacity is paying off in the SFH reference buildings analyzed. Assuming an electricity price of 0.29 € per kWh and a feed-in tariff for PV electricity of 0.10 €, the cost of operation for the heat pump system without battery adds up to 1406 € per year for the category 3 SFH building. In that case, a battery of 10 kWh is added to the system, the yearly cost of operation is reduced to 1282 €, which corresponds to cost savings of 124 € per year. With specific costs for the entire battery installation, including i.e., the alternating current/direct current (AC/DC) converter, of 1500 € per kWh for lithium ion batteries in PV installations according to [31,32], the static return on investment becomes 121 years. It is obvious that even at reduced prices as proposed by battery suppliers, an additional installation of a battery to a system comprising of heat pump, TES and PV plant is hardly likely to become economically beneficial.
5. Conclusions
This paper is intended to derive the maximum share of onsite PV electricity utilization for heat-pump systems in residential buildings. In order to cover the entire sector of residential buildings, single-family as well as multi-family houses were analyzed with respect to four categories in terms of the year of construction. For each category adequate thermal power of the heat pump were found for both brine–water and air–water heat pumps. Regarding further improvements in thermal insulation, results were presented for the status quo represented by year 2020 and for a future status in 2050.
Hence, the outcome of this paper is well suited to serve as a guideline for the design of heat-pump systems in general terms for residential buildings such as adequate nominal thermal power and appropriate size of thermal storage. Moreover, by recognizing the share of onsite PV electricity utilization for each category of the predefined reference buildings from the results in this paper, at a given structure of buildings i.e., in a municipality or an entire region, the additional need of electricity for operating the heat pumps can be derived easily. This number is extremely important in terms of converting the heating sector from using fossil fuels to electricity by the means of heat pumps, as proposed in the introduction as one of the necessary actions for limiting global warming. Knowing the amount of extra electricity needed by residential heat pumps helps to examine potentially required reinforcements of the grid, and it sets guidelines for the expansion of renewable energy, since it is essential to run heat pumps entirely on renewable electricity.
Regarding the heat pump system, it was pointed out that an appropriate energy storage is vital to increase the share of PV electricity utilization from a PV installation onsite. In a first attempt, any thermal energy storage should be exploited, since they are part of the heat pump system in any case. However, when designing heat-pump systems, special emphasis should be given to an adequate size of the thermal storage, in order to reach a good share of onsite PV electricity consumption. For single-family houses, a hot water tank of 800-L volume was found to be a good measure, while in multi-family houses the volume of the hot water tank should be in the range of 3000 L. Besides a hot water tank, the mass of the building can be utilized for thermal storage by i.e., floor or wall heating systems, which will evidently help to reduce the size of the required hot water tank. This option needs to be evaluated in further studies. However, applying thermal storage of the aforesaid size will enable utilization of 25.3% to 41.0% of yearly onsite PV electricity for covering the electricity demand of residential buildings including the heat pump.
Adding electrical storage will definitely help to further increase the share of onsite PV electricity utilization. For single-family houses this share can be raised by another 10%. However, a basic evaluation of the economic situation reveals that the costs of installation of battery storage will momentarily not pay off by the surplus in PV electricity utilization. Battery prices needs to drop significantly in order to break even in a reasonable period of time.
For future studies, it might be interesting to focus on the economics of the entire heat-pump system, since the results presented in this paper are mainly based on technical parameters. It will indeed be interesting to evaluate the economic parameters of the systems proposed, in order to compare to alternative solutions such as solar thermal- or biomass-based systems for heating residential buildings. Additionally, the comparison to the experimental study of the Fraunhofer ISE on the one hand showed that, on average, the results are comparable to values from existing buildings. On the other hand, the simulation model could be adapted to a more practical use case by applying real load profiles. However, it is necessary to consider simulation time, as it may increase with a more detailed model.
Coming back to the intention of the paper to analyze entire regions which will be mainly equipped with heat pumps in the future, the results can be used to draw conclusions on the necessary reinforcement of the electricity grid. In addition, the results can be used to deduce how much renewable electricity is required to operate the heat pumps, which can be incorporated into the expansion scenarios for wind and PV electricity.
Author Contributions
Conceptualization, T.K. and B.T.; Methodology, T.K. and B.T.; Software, T.K.; Writing—original draft, T.K.; Writing—review & editing, B.T. All authors have read and agreed to the published version of the manuscript.
Funding
The authors are grateful for the funding of the project “Heat4SmartGrid_BW” by the state of Baden-Württemberg, administrated by KIT Karlsruhe (PTKA) under grant no. BWSGF 17005-17006. The article processing charge was funded by the Baden-Württemberg Ministry of Science, Research and Culture in the funding programme Open Access Publishing.
Conflicts of Interest
The authors declare no conflict of interest.
Abbreviations
| Abbreviation | Description |
| AWHP | Air-water heat pump |
| BWHP | Brine-water heat pump |
| DHW | Domestic hot water |
| EH | Electric heater |
| HP | Heat pump |
| IC | Internal control |
| MFH | Multi-family house |
| SFH | Single-family house |
| SPF | Seasonal performance factor |
| SSL | Self-sufficiency level |
| TES | Thermal energy storage |
Appendix A
Table A1.
Summary of input data for reference buildings.
Table A1.
Summary of input data for reference buildings.
| SFH | MFH | |||||||
|---|---|---|---|---|---|---|---|---|
| Category 1 Before 1979 | Category 2 1979–2001 | Category 3 2002–2015 | Category 4 After 2015 | Category 1 Before 1979 | Category 2 1979–2001 | Category 3 2002–2015 | Category 4 After 2015 | |
| Heat demand 2020 [kWhth/a] | 7686 | 8553 | 9421 | 8160 | 43,135 | 31,716 | 25,255 | 9568 |
| Heat demand 2050 [kWhth/a] | 6395 | 7558 | 8943 | 5366 | 23,718 | 23,993 | 20,252 | 5675 |
| DHW demand 2020 [kWhth/a] | 1514 | 1514 | 1514 | 1514 | 11,771 | 9367 | 7265 | 5340 |
| DHW demand 2050 [kWhth/a] | 1915 | 1514 | 1514 | 1514 | 10,581 | 8196 | 7015 | 5346 |
| El. Demand [kWhel/a] | 4000 | 16,000 | ||||||
| Heating system | Radiator system | Floor heating | Radiator system | Floor heating | ||||
| Supply|Return Temperature Heating System for 2020 [°C] | 55|35 | 35|25 | 55|35 | 35|25 | ||||
| Supply|Return Temperature Heating System for 2050 [°C] | 45|35 | 55|35 | 45|35 | 45|35 | 45|35 | 55|35 | ||
| Th. Power el. heater [kW] | 3 | 5 | ||||||
| Power Photovoltaik for 2020 [kWp] | 6 | 30 | 31 | 25 | 22 | |||
| Power Photovoltaik for 2050 [kWp] | 24 | 33 | 23 | 22 | ||||
References
- United Nations Framework Convention on Climate Change. The Paris Agreement|UNFCCC, 29 January 2016. Available online: https://unfccc.int/files/meetings/paris_nov_2015/application/vnd.openxmlformats-officedocument.wordprocessingml.document/cp10a1_en.docx (accessed on 8 January 2020).
- Intergovernmental Panel on Climate Change IPCC, Summary for Policymakers of IPCC Special Report on Global Warming of 1.5 °C approved by governments, 8 October 2018. Available online: https://www.ipcc.ch/2018/10/08/summary-for-policymakers-of-ipcc-special-report-on-global-warming-of-1-5c-approved-by-governments/ (accessed on 8 January 2020).
- Umweltbundesamt, Erneuerbare Energien in Zahlen, 15 March 2019. Available online: https://www.umweltbundesamt.de/themen/klima-energie/erneuerbare-energien/erneuerbare-energien-in-zahlen#statusquo (accessed on 24 October 2019).
- Akmal, M.; Fox, B. Modelling and Simulation of Underfloor Heating System Supplied from Heat Pump. In Proceedings of the UKSim-AMSS 18th International Conference on Computer Modelling and Simulation (UKSim), Cambridge, UK, 6–8 April 2016. [Google Scholar] [CrossRef]
- Allison, J.; Cowie, A.; Galloway, S.; Hand, J.; Kelly, N.; Stephen, B. Simulation, implementation and monitoring of heat pump load shifting using a predictive controller. Energy Convers. Manag. 2017, 150, 890–903. [Google Scholar] [CrossRef]
- Allouhi, A.; Boharb, A.; Jamil, A.; Msaad, A.A.; Benbassou, A.; Kousksou, T. Simulation of a thermoelectric heating system for small-size office buildings in cold climates. In Proceedings of the 3rd International Renewable and Sustainable Energy Conference (IRSEC), Marrakech, Morocco, 10–13 December 2015. [Google Scholar] [CrossRef]
- Jonas, D.; Frey, G. Model-based analysis of the performance and the environmental impact of solar thermal and heat pump systems. In Proceedings of the 9th International Renewable Energy Congress (IREC), Hammamet, Tunisia, 20–22 March 2018. [Google Scholar] [CrossRef]
- Mastouri, M.; Bouguila, N. A methodology for thermal modelling and predictive control for building heating systems. In Proceedings of the 18th International Conference on Sciences and Techniques of Automatic Control and Computer Engineering (STA), Monastir, Tunisia, 21–23 December 2017. [Google Scholar] [CrossRef]
- Péan, T.; Costa-Castelló, R.; Fuentes, E.; Salom, J. Experimental Testing of Variable Speed Heat Pump Control Strategies for Enhancing Energy Flexibility in Buildings. IEEE Access 2019, 7, 37071–37087. [Google Scholar] [CrossRef]
- Rimbala, J.; Votava, J.; Kyncl, J. Assessment of Energy Consumption in the Residential Building with a Heat Pump. In Proceedings of the 20th International Scientific Conference on Electric Power Engineering (EPE), Kouty nad Desnou, Czech Republic, 15–17 May 2019. [Google Scholar] [CrossRef]
- Song, L.; Meng, L.; Han, Y.; Fan, H.; Yin, X.; Gao, F.; Jiao, Y.; Liu, Y. Analysis of micro-grid integration with PV, energy storage and ground-source heat pump based on DeST simulation. In Proceedings of the IEEE Conference on Energy Internet and Energy System Integration (EI2), Beijing, China, 26–28 November 2017. [Google Scholar] [CrossRef]
- Tangwe, S.; Simon, M.; Meyer, E.L. Prediction of coefficient of performance and simulation design of an air source heat pump water heater. J. Eng. Des. Technol. 2017, 15, 378–394. [Google Scholar] [CrossRef]
- Verbruggen, B.; Driesen, J. Grid Impact Indicators for Active Building Simulations. IEEE Trans. Sustain. Energy 2015, 6, 43–50. [Google Scholar] [CrossRef]
- Rashid, K.; Mohammadi, K.; Powell, K. Dynamic simulation and techno-economic analysis of a concentrated solar power (CSP) plant hybridized with both thermal energy storage and natural gas. J. Clean. Prod. 2019. [Google Scholar] [CrossRef]
- Rashid, K.; Safdarnejad, S.M.; Ellingwood, K.; Powell, K.M. Techno-economic evaluation of different hybridization schemes for a solar thermal/gas power plant. Energy 2019, 181, 91–106. [Google Scholar] [CrossRef]
- Wärmeatlas Baden-Württemberg—Erstellung eines Leitfadens und Umsetzung für Modellregionen. Available online: https://fachdokumente.lubw.baden-wuerttemberg.de/servlet/is/90488/?COMMAND=DisplayBericht&FIS=203&OBJECT=90488&MODE=METADATA (accessed on 27 February 2020).
- Türk, S. Erzeugung Konsistenter Elektrischer und Thermischer Lastgänge Für Typische Ein- und Mehrfamilienhäuser; Internal document University of Stuttgart: Stuttgart, Germany, 2019. [Google Scholar]
- VDI. VDI 4655, Reference Load Profiles of Single-Family and Multi-Family Houses for the Use of CHP Systems. Available online: https://standards.globalspec.com/std/1090927/VDI%204655 (accessed on 20 February 2020).
- Born, H.; Schimpf-Willenbrink, S.; Lange, H.; Bussmann, G.; Bracke, R. Analyse des Deutschen Wärmepumpenmarktes—Bestandsaufnahme und Trends—2 Aktualisierung der Studie; International Geothermal Centre: Bochum, Germany, 2017. [Google Scholar]
- Kemmler, T.; Thomas, B. Simulation von Wärmepumpensystemen auf der Grundlage von Korrelationsfunktionen für die Leistungsdaten der Wärmepumpe. In Proceedings of the 16th Symposium Energieinnovation, Graz, Austria, 12–14 February 2020. [Google Scholar]
- Platt, M.; Exner, S.; Bracke, R. Analyse des Deutschen Wärmepumpenmarktes—Bestandsaufnahme und Trends; International Geothermal Centre: Bochum, Germany, 2010. [Google Scholar]
- Acker, U. Solaranlage. eu—Photovoltaik & Solarthermie, Christian Münch GmbH. Available online: https://www.solaranlage.eu/photovoltaik/technik-komponenten/solarmodule/kwp (accessed on 11 October 2019).
- Madel, A. Solaranlage Ratgeber, Anondi GmbH. Available online: https://www.solaranlage-ratgeber.de/photovoltaik/photovoltaik-planung/photovoltaikanlage-dimensionierung (accessed on 11 October 2019).
- Versionsarchiv-Dateien-sciebo. Available online: https://fh-aachen.sciebo.de/index.php/s/0hxub0iIJrui3ED?path=%2FVersionsarchiv (accessed on 27 February 2020).
- Widmann, C.; Lödige, D.; Toradmal, A.; Thomas, B. Enabling CHP units for electricity production on demand by smart management of the thermal energy storage. Appl. Therm. Eng. 2017, 114, 1487–1497. [Google Scholar] [CrossRef]
- Lödige, D.; Thomas, B.; Widmann, C. Stromoptimierter Betrieb von KWK-Anlagen Durch Intelligentes Wärmespeichermanagement, May 2016. Available online: http://fachdokumente.lubw.baden-wuerttemberg.de/servlet/is/118201/bwe13002_abschlussbericht.pdf?command=downloadContent&filename=bwe13002_abschlussbericht.pdf&FIS=203 (accessed on 10 February 2020).
- Toradmal, A.; Kemmler, T.; Thomas, B. Boosting the share of onsite PV-electricity utilization by optimized scheduling of a heat pump using buildings thermal inertia. Appl. Therm. Eng. 2018, 137, 248–258. [Google Scholar] [CrossRef]
- VDI. VDI 4650, Calculation of the Seasonal Coefficient of Performance of Heat Pumps. Available online: https://standards.globalspec.com/standards/detail?docId=13216340 (accessed on 20 February 2020).
- Gerlach, H.; Thomas, B. Künftige Auslegung von KWK-Anlagen: Flexibler Betrieb Statt Dauerlauf, HLH Lüftung/Klima/Heizung/Sanitär/Gebäudetechnik; VDI Fachmedien GmbH & Co. KG: Düsseldorf, Germany, 2019; pp. 20–24. [Google Scholar]
- Günther, D.; Miara, M.; Langner, R.; Helmling, S.; Wapler, J. WP Monitor—Die Ergebnisse. 2011. Available online: https://wp-monitoring.ise.fraunhofer.de/wp-monitor-plus/download/endbericht_wp_monitor_klein.pdf (accessed on 10 February 2020).
- Scon-Marketing GmbH, Solar-Akku: Preise, Kosten und Wirtschaftlichkeit. Available online: https://www.solaranlagen-portal.de/solar-akku/solar-akku-preise-kosten.html (accessed on 6 November 2019).
- DAA Deutsche Auftragsagentur GmbH, Solarstromspeicher: Preis für einen Photovoltaik Speicher, 3 June 2019. Available online: https://www.solaranlagen-portal.com/photovoltaik/stromspeicher/preise (accessed on 7 November 2019).


© 2020 by the authors. Licensee MDPI, Basel, Switzerland. This article is an open access article distributed under the terms and conditions of the Creative Commons Attribution (CC BY) license (http://creativecommons.org/licenses/by/4.0/).