Abstract
Global warming caused by excessive emissions of CO2 and other greenhouse gases is one of the greatest challenges for mankind in the 21st century. China is the world’s largest carbon emitter and its transportation industry is one of the fastest growing sectors for carbon emissions. However, China is a vast country with different levels of carbon emissions in the transportation industry. Therefore, it is helpful for the Chinese government to formulate a reasonable policy of regional carbon emissions control by studying the factors influencing the carbon emissions of the Chinese transportation industry at the regional level. Based on data from 1997 to 2017, this paper adopts the logarithmic mean divisia index (LMDI) decomposition method to analyze the influencing degree of several major factors on the carbon emissions of transportation industry in different regions, puts forward some suggestions according to local conditions, and provides references for the carbon reduction of Chinese transportation industry. The results show that (1) in 2017, the total carbon emissions of the Chinese transportation industry were 714.58 million tons, being 5.59 times of those in 1997, with an average annual growth rate of 9.89%. Among them, the carbon emissions on the Eastern Coast were rising linearly and higher than those in other regions. The carbon emissions in the Great Northwest were always lower than those in other regions, with only 38.75 million tons in 2017. (2) Economic output effect is the most important factor to promote the carbon emissions of transportation industry in various regions. Among them, the contribution values of economic output effect to carbon emissions on the Eastern Coast, the Southern Coast and the Great Northwest continued to rise, while the contribution values of economic output effect to carbon emissions in the other five regions decreased in the fourth stage. (3) The population size effect promoted the carbon emissions of the transportation industry in various regions, but the population size effect of the Northeast had a significant inhibitory influence on the carbon emissions in the fourth stage. (4) The regional energy intensity effect in most stages inhibited carbon emissions of the transportation industry. Among them, the energy intensity effects of the North Coast and the Southern Coast in the two stages had obvious inhibitory influences on carbon emissions of the transportation industry, but the contribution values of the energy intensity effect in the Great Northwest and the Northeast were positive in the fourth stage. (5) Except for the Great Southwest, the industry-scale effects of other regions had inhibited the carbon emissions of transportation industry in all regions. (6) The influences of the carbon emissions coefficient effect on carbon emissions in different regions were not significant and their inhibitory effects were relatively small.
1. Introduction
Global climate change is a major challenge in the field of sustainable development for the world. Global CO2 emissions, influenced by rising energy demand, rose 1.7% in 2018 to a record 33.1 billion tons, according to the research report of “carbon emissions from fuel combustion” released by the International Energy Agency (IEA) [1]. In 2017, the carbon emissions of the transportation sector accounted for nearly a quarter of the global total, reaching 8.04 billion tons. According to IEA data, in 2007, Chinese CO2 emissions surpassed those of the United States and China became the world’s largest CO2 emitter [2]. The rapid growth of Chinese carbon emissions has attracted global attention. Based on IEA data, this paper calculates that Chinese carbon emissions reached 9.302 billion tons in 2017, accounting for 28.33% of the total in the world. Among them, the transportation industry accounts for 9.5% of Chinese total carbon emissions, becoming one of the industries with the fastest growth of carbon emissions in China [3].
In recent years, Chinese carbon reduction has also received extensive attention [4]. Furthermore, as one of the important sources of Chinese energy consumption and carbon emissions, still in a stage of rapid growth, the transportation industry is bound to become a key industry to achieve targets of carbon reduction in the future [5]. China is a vast country with different industrial structures between provinces and regions [6], as well as different levels of carbon emissions in the transportation sector. Therefore, it is of positive guiding significance for the Chinese government to scientifically identify the influence degree of major factors on the carbon emissions of Chinese regional transportation industry to formulate the policies of total carbon emissions control and distribution as well as carbon reduction.
Schipper of Lawrence Berkeley national laboratory was the first scholar to study the carbon emissions of the transportation industry [7]. Later, Chinese scholars Zhu et al. and Su et al. also carried out relevant studies [8,9]. At present, studies at home and abroad mainly focus on applying the STIRPAT (Stochastic Impacts by Regression on Population, Affluence, and Technology) model, Kaya identity and its extension model, etc., applying the Laspeyres index method or the logarithmic mean divisia index (LMDI) method to analyze the degree of key factors influencing on carbon emissions and using econometric analysis and other methods to study the influencing factors of carbon emissions. Timilsina and Shrestha (2009) used the LMDI method to study CO2 emissions of transportation sector in some Asian countries. The results showed that the change of GDP (gross domestic product) per capita, population growth and transport energy intensity were the main factors for the growth of carbon emissions; fiscal policy, fuel economy policy, and the policy of encouraging transferring into clean energy and energy-saving vehicles also played positive roles to curb carbon emissions [10,11]. Based on the Laspeyres index decomposition method, Zhang et al. (2017) selected China and other 6 countries as the research objects and constructed a secondary decomposition model for CO2 emissions of the roads and railways. The study found that the growth of GDP per capita is the most important reason for the growth of road and railway turnover; the improvement of energy intensity and energy structure can slow down the growth of CO2 emissions [12]. Du et al. (2017) analyzed the influencing factors of carbon emissions in the Chinese transportation industry and proposed a path analysis method based on multiple regression analysis. The results showed that economic level, transportation intensity, and energy intensity were the main factors influencing the carbon emissions of the transportation industry [13]. Talbi (2017) used the vector autoregressive model to study the relationship between CO2 emissions and energy consumption, energy intensity, economic growth and fuel efficiency in the road transportation sector in Tunisia [14]. Based on the panel data of nine provinces and two cities in the Yangtze River economic belt from 2005 to 2014 and combined with the extended Kaya identity, Lu et al. (2017) analyzed the influencing factors of CO2 emissions in the transportation industry through the LMDI decomposition method. The results showed that energy structure, energy consumption of per unit added value and turnover of per unit GDP inhibited CO2 emissions, while added value of per unit turnover, per capita GDP and population promoted CO2 emissions [15]. Based on the improved STIRPAT model, Fan et al. (2019) used ridge regression to explore the influences of passenger-freight turnover, per capita GDP, energy intensity, urbanization rate and private car ownership on traffic carbon emissions in the five Great Northwestern provinces. The result of ridge regression analysis showed that, except for Gansu Province, the contribution degrees of influence factors in the Great Northwest were all energy intensity > per capita GDP > urbanization rate > private car ownership > passenger-freight turnover [16]. In addition, in order to analyze the carbon emissions features of different regions, some scholars have also conducted studies on specific provinces and cities, such as Henan Province [17], Jiangsu Province [18] and Beijing [19].
To sum up, scholars at home and abroad further studied the influencing factors of carbon emissions in the transportation industry combining with different models from different perspectives. However, there are also the following problems: (1) the vast majority of scholars only focused on the national level [10,11,12,13,14], specific regions or provinces [15,16,17,18,19], ignoring the differences of CO2 emissions in the transportation industry between regions of a country [20]; (2) few scholars pay attention to the degree of the same factor influencing carbon emissions in transportation industry in different regions of a country. This paper divides 30 Chinese provinces into 8 regions, calculates and analyzes the current situation of carbon emissions of different regions in the transportation industry from 1997 to 2017, and uses the LMDI decomposition method to analyze the influencing factors on carbon emissions in the transportation industry of different regions. Finally, the paper puts forward some suggestions according to local conditions to provide references for the carbon reduction of the Chinese transportation industry.
2. Methods
2.1. Carbon Emissions Calculation Method
Carbon emissions indicate “the general term of greenhouse gases, which is presented by CO2 equivalent (CO2 eq)”, mainly including carbon dioxide, methane, nitrous oxide, and other carbon oxides. Among them, the proportion of CO2 emissions is more than 60% of that of greenhouse gas emissions [21]. For lacking comprehensive statistics of the latest global carbon emissions, most scholars apply the methods, provided by IPCC (Intergovernmental Panel on Climate Change) Guidelines on National Greenhouse Gas Inventories, and adopt the data of energy consumption to calculate carbon emissions. In the aspect of carbon emissions measurement of transportation industry, the common methods are “top-down” and “bottom-up” methods. The “top-down” method is based on the conversion factors of energy consumptions and energy carbon emissions coefficient of vehicles to calculate the carbon emissions of the transportation industry. The “bottom-up” method is to calculate the energy consumption of the transportation industry based on the data of different types of vehicles and fuel consumptions of traveled mileage and per unit of traveled mileage, etc., thus calculating the carbon emissions. Yang et al. (2014) and Ma et al. (2017) both used the “top-down” method to calculate the carbon emissions of the transportation industry in China and the Chinese Beijing-Tianjin-Hebei Region [22,23]. As for the “bottom-up” measurement method, Zhang et al. (2009) calculated CO2 emissions of different transportation modes for residents in Shanghai from 2002 to 2006 [24]. Wang et al. (2019) divided the Chinese comprehensive transportation system into four modes—road, railway, domestic water transportation and domestic civil aviation—and analyzed the factors of influencing carbon emissions change from 2003 to 2015 [25]. However, the “bottom-up” method needs to take into account such factors as the types of vehicles, influencing distance, energy consumption of per unit mileage, etc. At present, the relevant provincial and regional statistics in China are not yet perfect and moreover, the uncertainty is relatively large in the calculation [26]. Therefore, this paper adopts a “top-down” calculation method.
This paper, based on the data of terminal energy consumptions of industry, calculates the carbon emissions of the transportation industry in 30 provinces of China and selects 12 main types of energies according to the energy classification of IPCC. The energies include raw coal, cleaned coal, briquette coal, carbon coke, crude oil, gasoline, kerosene, diesel, fuel oil, liquefied petroleum gas and natural gas. The calculation formula of carbon emissions of fuel combustion recommended by IPCC is as follows:
In the formula, C represents the total CO2 emissions of the transportation industry in China or its certain region; Cij represents CO2 emissions of energy i in province j; i is the type of the fossil fuels (i = 1, 2, 3,⋯,12); Eij stands for the terminal consumption of fossil fuel i in province j; fi indicates for the CO2 emissions coefficient of carbon energy i; NCVi shows the mean low calorific value of energy i; CCi refers to the carbon per calorific value of energy i, that is, the carbon content per unit of heat; COFi is the carbon oxidation factor, namely, the carbon oxidation rate during energy combustion; and 44 and 12 are the molecular weights of CO2 and carbon [27].
The specific folding standard coal coefficients and carbon emissions coefficients for all energies are shown in Table 1.

Table 1.
Carbon emissions coefficient of transportation and energy.
2.2. Kaya Identity Extension
Firstly proposed by Yoichi Kaya in 1989 [28], the Kaya identity establishes the relationship between economic and demographic factors and CO2 emissions, decomposes the influencing factors of CO2 emissions and accurately quantifies the contribution degree of various influencing factors.
Kaya identity is simple in structure and easy to operate. Although it has been widely used in such fields as energy, environment and economy, etc., the identity is limited in the number of focused variables. In recent years, when studying influencing factors on carbon emissions of transportation industry, some scholars have found that the change of carbon emissions is also related to energy intensity, energy structure, added value of the transportation industry, etc. In view of this, this paper extends the Kaya identity to introduce the scale and energy intensity of the transportation industry. The specific expression is:
In the formula, C represents carbon emissions of transportation industry, E represents energy consumption of transportation industry, ADV represents added value of transportation industry, GDP represents gross regional product, and POP represents regional population size. Among them, is the energy carbon emissions coefficients of the transportation industry, represented by G; is the factor of energy intensity, namely, the energy consumption of per unit added value for the transportation industry, represented by S; is the industry scale, that is, the proportion of the added value of the transportation industry in the gross regional product, represented by A; is the factor of economic output, that is, regional GDP per capita, expressed by R;POP represents the factor of population size, expressed by P.
Thus, Equation (2) can be expressed as Equation (3):
In Equation (3), C, G, S, A, R, and P indicate the relationships between carbon emissions in transportation and factors of energy carbon emissions coefficients, energy intensity, industry size, economic output, and population size, etc.
2.3. Logarithmic Mean Divisia Index (LMDI) Decomposition Method Based on Extended Kaya Identity
In recent years, scholars have made great achievements in studying the relationships between energy consumptions and carbon emissions by means of decomposition analysis. Currently, the two relatively popular methods of decomposition are structural decomposition analysis (SDA) and index decomposition analysis (IDA). Based on the input-output table, SDA conducts a detailed analysis on various influencing factors [29]. In 1991, IDA expanded from the field of energy consumption to the study of carbon emissions related to energy consumption for the first time. Based on the aggregate data of departments and its time series analysis, IDA can make a meaningful decomposition for the industry and find out the deep factors that indirectly affect the total index [29,30].
Based on the comprehensive comparison of SDA and IDA methods, Ang et al. (1998) suggested that the Laspeyres index and Divisia index of the IDA method should be adopted when studying the decomposition analyses on factors of energy consumption and gas emissions [31]. However, the Laspeyres decomposition method will produce relatively large residuals during the decomposition process, which will have an influence on the results of decomposition analyses. On the contrary, LMDI in the Divisia index decomposition method solves the residual value and zero value problems inherent in the index decomposition method, which has the advantage of complete decomposition and a unique result, making the results more convincing [32,33]. Therefore, the LMDI decomposition method is finally adopted in this paper to analyze the carbon emissions of the Chinese regional transportation industry.
The LMDI decomposition method includes two forms, addition and multiplication. Their decomposition results can be inter-converted and are consistent for the two methods [32]. Therefore, this paper applies the method of “additive decomposition” to decompose the model in Equation (3). The specific formula is presented in Equation (4):
In Equation (4), DG indicates for the carbon emissions coefficient effect of energy, DS indicates for the energy intensity effect, DA indicates for the industry scale effect, DR indicates for the economic output effect, and DP indicates for the population size effect. Then, the expressions of each factor, which influences on carbon emissions, are respectively Equations (5)–(9). Similarly with those in reference [34], they are used for the detailed derivation process.
In Equations (5)–(9), C0 represents the base year’s carbon emissions of the transportation industry in China or its certain region; CT indicates for the carbon emissions of the transportation industry in year T in China or its certain region. G0, S0, A0, R0 and P0 respectively denote the base year’s carbon emissions coefficient of energy, energy intensity, industry scale, economic output and population size of the transportation industry; GT, ST, AT, RT and PT respectively indicate the energy carbon emissions coefficient, energy intensity, industry scale, economic output and population size of the transportation industry in year T.
2.4. Data Sources
The data range of this paper is from 1997 to 2017. Considering the completeness and availability of data, this study covers 30 provinces (autonomous regions and municipalities) in China, excluding Taiwan, Hong Kong, Macao and Tibet. Among them, the reference coefficients of conversion standard coal for energy and the energy consumption data of terminal transportation industry in each year of Chinese each province was derived from the China Energy Statistical Yearbook from 1998 to 2018. The factors of carbon emissions for the energies were derived from the General Principles for Calculation of Comprehensive Energy Consumption (GB/T 2589-2008) and the 2006 edition of the IPCC Guidelines for National Greenhouse Gas Emission Inventory. Population, GDP and ADV (added value of transportation industry) are all from the China Statistical Yearbook from 1998 to 2018. GDP and the added value of the transportation industry are constant price based on the base year 1997. In addition, individual missing data are obtained by interpolation, assuming the same annual growth rate.
In order to facilitate the research, this paper divides China into eight comprehensive regions according to the concept of regional division of comprehensive economy, proposed by the development research center of the state council of China [35]. They are respectively the Northeast (i.e., Liaoning, Jilin and Heilongjiang Provinces), the North Coast (i.e., Beijing, Tianjin, Hebei and Shandong), the Eastern Coast (i.e., Shanghai, Jiangsu and Zhejiang), the Southern Coast (i.e., Fujian, Guangdong and Hainan), the middle reaches of the Yellow River (i.e., Shaanxi, Shanxi, Henan, Inner Mongolia), the middle reaches of the Yangtze River (i.e., Hubei, Hunan, Jiangxi, Anhui), the Great Southwest (i.e., Yunnan, Guizhou, Sichuan, Chongqing, Guangxi), and the Great Northwest (i.e., Gansu, Qinghai, Ningxia, Xinjiang).
3. Variable Description and Analysis
3.1. Carbon Emissions Status of Chinese Transportation Industry
The “top-down” calculation method is used to calculate the total carbon emissions of Chinese transportation industry from 1997 to 2017 by using Equation (1), as shown in Figure 1.
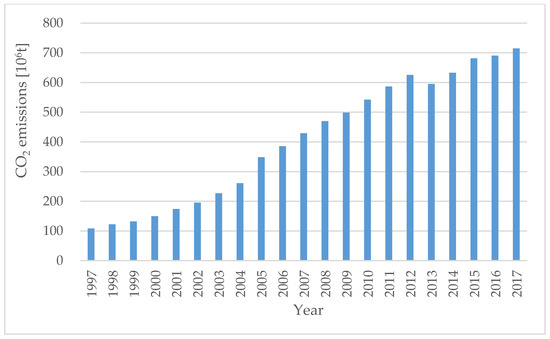
Figure 1.
Carbon emissions of Chinese transportation industry from 1997 to 2017.
From Figure 1, the total CO2 emissions in the Chinese transportation industry are on the rise year by year, that is, from 108.43 million tons in 1997 to 714.58 million tons in 2017, increasing 5.59 times, with an average annual growth rate of 9.89%. From 1997 to 2012, the average annual growth rate was as high as 12.39%, and then from 2012 to 2017, the growth rate slowed down to only 2.71%. This is mainly because the economic development of China grew rapidly from 1997 to 2012, with the average annual GDP growth rate of 11.61%. As a result, the rigid demand for transportation continued to increase and the total carbon emissions of transportation continued to grow at a high speed. After 2012, Chinese economic development turned into the new normal, from the pursuit of speedy growth to quality growth. Therefore, economic growth was slowing down. From 2012 to 2017, GDP grew by an average of 8.03% a year. The demand for transportation decreased due to the optimization of the Chinese industrial structure, the decline of traditional manufacturing, and the increasing proportions of the dominating service industry of financial, information, etc. Therefore, carbon emissions growth slowed down for the Chinese transportation industry from 2012 to 2017.
CO2 emissions from transportation industry in the eight regions of China are shown in Figure 2 and Table 2. Overall, carbon emissions in all the regions were on the rising trend. Among them, the carbon emissions on the Eastern Coast rose sharply and were higher than that in other regions. Its carbon emissions increased from 19.56 million tons in 1997 to 123.36 million tons in 2017, with an average annual growth rate of 9.64%. The Eastern Coast is located in a favorable geographical position. Its economic development has always been at a high level and its demand for transportation continues to increase, so its carbon emissions are the highest. The emissions of the Great Northwest were always lower than those of other regions, with only 38.75 million tons in 2017. The reason is that the Great Northwest of China has always been an economically underdeveloped region. Its agriculture and animal husbandry have been in relatively high proportions for a long time, compared with other regions; while its industry and commerce account for relatively low proportions. Therefore, the capital attraction is relatively weak, resulting in insufficient demand for freight. In addition, the Great Northwest has a small population and relatively less demand for transportation, so it is low for the carbon emissions of the transportation industry. Carbon emissions in the Great Southwest grew the fastest during the study period, with an average annual growth rate of 12.18% and an 8.96-fold increase from 1997 to 2017. Although the economic development level of the Great Southwest is not as high as that of the Southeastern Coast, it is geographically close to the southeast, carrying on the industrial transfer of the Southeastern Coast; therefore, the demand for freight is large. At the same time, the Great Southwest is a place where the population gathers, with a total population of 246 million, accounting for 17.7% of the total population of China, therefore, it shows a large demand for passenger transportation. The Great Southwest has a more favorable traffic condition. Compared with the Great Northwest, although the railway mileage of the Great Southwest is comparable, its road transportation is more developed. Its traffic mileage is more than 94.37% of the Great Northwest, especially with the convenience of shipping in the Yangtze River of Sichuan and ports in Guangxi, the inland waterway navigation mileage being 16.7 times that of the Great Northwest. Therefore, with the rapid growth of the transportation industry, the carbon emissions in the Great Southwest increase rapidly.
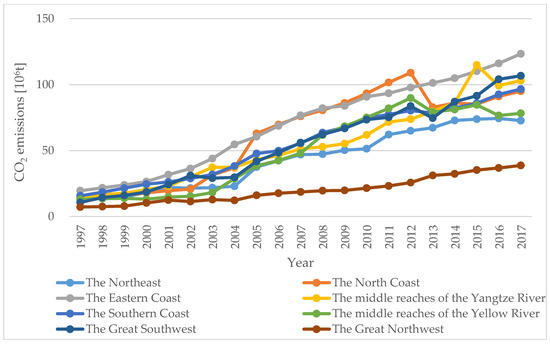
Figure 2.
CO2 emissions in the transportation industry in the eight regions of China from 1997 to 2017.
Table 2.
Carbon emissions of the transportation industry in eight Chinese regions.
3.2. Decomposition Variables
3.2.1. Carbon Emissions Coefficients
The carbon emissions coefficients of energy in eight regions of China are shown in Figure 3. Within the study range, the carbon emissions coefficients show a slow downward trend, with a relatively small decline. This is because in 2017, compared with 1997, the proportion of clean energy such as natural gas increased. In addition, the improvements of oil quality and fuel efficiency of vehicles reduced the CO2 emissions under the same energy consumption, which lowered the carbon emissions coefficients of energy. However, most of the vehicles in China still rely on traditional petroleum energy, so the carbon emissions coefficients of energies in each region are relatively small.
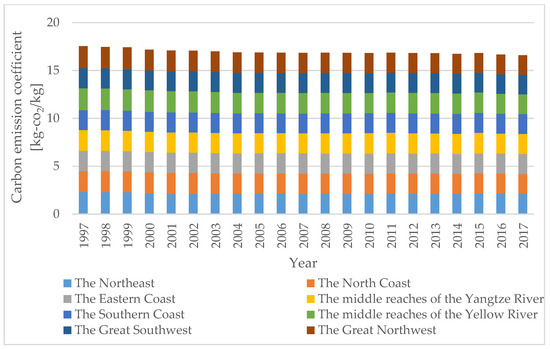
Figure 3.
Carbon emissions coefficients of different regions in China from 1997 to 2017.
3.2.2. Energy Intensity
In this paper, the energy intensity is the ratio between the energy consumption of transportation and the added value of transportation industry (at the constant price in 1997) and its unit is 10,000 tons of standard coal per 100 million yuan. The change of energy intensities of the transportation industry in the Chinese regions are shown in Figure 4. In general, the energy intensities of the transportation industry in most regions present an “inverted U-shaped” trend within the research range, that is, it rises first and then slowly declines. Among them, the middle reaches of the Yangtze River presented the fastest growth in energy intensity, rising 51.07% in 2017 compared with that in 1997, with an average annual growth rate of 2.08%. In 2017, the energy intensity in the Great Northwest was the highest, with 23,200 tons of standard coal/100 million yuan. Because the proportion of road transportation in the region continued to increase, its energy consumption was higher than those of the other regions. The energy intensity of the North Coast is the lowest, which was only 8500 tons of standard coal/100 million yuan in 2017. The energy intensity of the region decreased rapidly after 2012. It is mainly because the relatively strict energy conservation policies for vehicles have been adopted to reduce energy consumption. Thus, its energy intensity is the lowest.
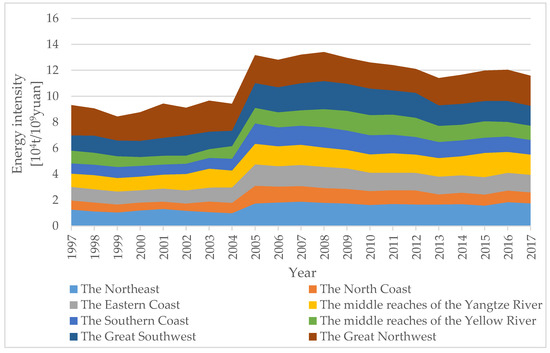
Figure 4.
Regional energy intensities in China from 1997 to 2017.
3.2.3. Industry Scale
Industry scale is the proportion of added value of transportation industry in gross regional product. The change of industry scale in each region is shown in Figure 5. During the study range, all regions show an “inverted U-shaped” trend, which is first in a slow rise and then a fluctuating decrease. After 20 years of reform and opening up, the Chinese market economy has realized great development and domestic manufacturing industry has begun to make progress. At the same time, due to the cheap labor and various preferential policies, large numbers of processing and manufacturing were shifted to China, resulting in growing demands for transportation. Therefore, the scale of the regional industry from 1997 to 2002 had different degrees of increase. After 2002, the proportion of services represented by finance, tourism and information in each region increased, while the proportion of traditional industries, mainly manufacturing, decreased and the demand for transportation slowed down, thus slowing down the growth rate of added value of transportation industry.
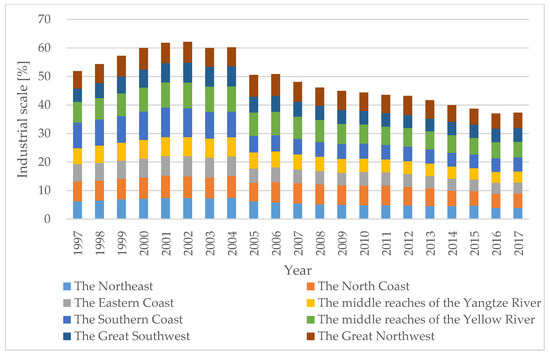
Figure 5.
Industry scale in various regions of China from 1997 to 2017.
Among them, the decline rates of the scale of industry in the Southern and the Eastern Coast are relatively fast, with an average annual decline rate of 2.91% and 2.18% respectively. This is because the Southern and Eastern Coast are forefronts of reform and opening-up in China. Their industrial transformation and upgrading paces are faster. Whether information technology or the services industry, like financial, are all at the advanced level. In addition, while a variety of emerging industries are influencing regional economic level, they slow down the transportation demand, making industry scale reduce quickly. In contrast, the industrial scale in the Great Southwest did not decline, but grew at an average annual rate of 0.08%. This is because, firstly, the industrial transformation and upgrading in the Great Southwest is relatively slow and the proportion of the traditional secondary industry is not substantially optimized. Secondly, there are many basins and plateaus in the Great Southwest, with rugged terrain and inconvenient transportation, which makes it difficult to reduce transportation costs.
3.2.4. Economic Output
Economic output is all expressed by GDP per capita in this paper. From 1997 to 2017, Chinese economic output continued to grow at an average annual rate of 10.01%. GDP per capita in 2017 was 42,407.71 yuan, 5.73 times higher than that in 1997. As shown in Figure 6, the economic output of each region continued to rise during the study range. Among them, the GDP per capita of the Eastern Coast has always been higher than that of other regions, with an average annual growth rate of 9.60%, reaching 70,347.40 yuan by 2017. Due to the superior geographical location, the Eastern Coast is the earliest to implement the reform and opening up in China and supported by national policies, so its economic output keeps rising. The economic output of the Southern Coast ranking second in 2017 was mainly because that the Southern Coast has had a strong business atmosphere and is also an area that firstly implemented the reform and open policy. With the locative advantage of being adjacent to Hong Kong, Macao and Taiwan and with the help of the good shipping conditions, it attracted the inflow of large amounts of foreign capital, making the change in industrial structure, proportional increase in manufacturing industry and rapid development of foreign trade, so it reached a relatively higher economic development level. The economic output in the Great Northwest in 2017 was the lowest in all the regions. The reason is that the Great Northwest has poor natural conditions, with wide distribution of desert, Gobi, plateaus and mountains. It makes relatively high proportions of farming and animal husbandry, with relatively low proportions of commerce and industry. In addition, the development pattern of the priority given to the marine trade since modern times also causes the decline of inland commercial. Moreover, the factor of social instability in the Great Northwest also has a certain influence on the development of its economy.
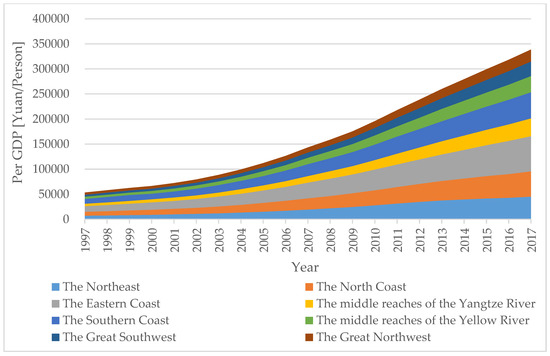
Figure 6.
Regional economic output of China from 1997 to 2017.
3.2.5. Population Size
Compared with 1997, the Chinese population increased by 153.82 million at the end of 2017, reaching 1390.08 million. The population sizes of the eight regions are shown in Figure 7. On the whole, the population sizes of each region increased slowly to varying degrees. Among them, the Southern Coast was witnessed the highest growth rate, with an average annual growth rate of 1.86% from 1997 to 2017. It is followed by the Eastern Coast, with an average annual growth rate of 1.06%. The two regions with the slowest growth rates were the Northeast and the Great Southwest, both with average annual growth rates of 0.17%. The population of the Northeast decreased 0.31% annually from 2015 to 2017. It is mainly because the Northeast is an old industrial base with unbalanced industrial structure and slow economic growth, resulting in a large population outflow.
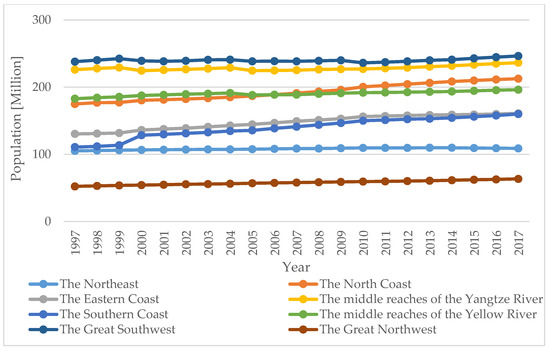
Figure 7.
Regional population sizes of China from 1997 to 2017.
4. Results and Discussion
4.1. Decomposition Results of Total Carbon Emissions in the Chinese Transportation Industry
In this paper, the research range is from 1997 to 2017. Because the research range experienced financial volatilities of Asian financial crisis and the world financial crisis, etc., Chinese economic growth has begun to slow markedly since 2012. So this paper divides the research range into four stages: the first stage (1997–2002), the second stage (2002–2007), the third stage (2007–2012) and the fourth stage (2012–2017).
By using the LMDI decomposition method, this paper decomposes the factors, which influence on the carbon emissions of Chinese transportation industry, into economic output, industry scale, energy intensity, population size, and carbon emissions coefficients. Equations (5)–(9) are used to calculate the contribution values (D) and contribution rates (R) of each influencing factor. The results are shown in Table 3. Among them, the contribution rate is the ratio between the contribution value of each influencing factor and the sum of contribution values of the five influencing factors, e.g., .
Table 3.
Decomposed contribution value (unit: million tons) and contribution rate (unit: %) of influencing factors on carbon emissions of Chinese transportation.
From 1997 to 2017, the contribution value and contribution rate of energy carbon emissions coefficients effect were −16.14 and −2.65%, respectively, to the carbon emissions of transportation industry. It can be seen that the carbon emissions coefficients effect is conducive to the suppression of the industry’s carbon emissions, but the influence is relatively small. This is because the improvements of vehicle fuel efficiency and oil quality reduced the carbon emissions coefficients of energy, thus promoting carbon reduction in the transportation industry.
Energy intensity effect has different influences on carbon emissions of Chinese transportation industry in different stages. It has a specific and significant effect on curbing carbon emissions of Chinese transportation industry in the third and fourth stages. The main reasons are as follows: (1) since 2007 and 2012, the Chinese government has proposed and implemented standards for the national pollutant emissions of motor vehicles, standardized air pollution emissions from the policy perspective and improved the quality of oil products for motor vehicles. These measures are conducive to reducing carbon emissions. (2) The proportion of clean energy consumption has increased. The proportion of clean energy consumption in Chinese transportation industry has increased from 0.02% in 1997 to 4.76% in 2017. (3) The continuous improvement of Chinese informatization level has promoted the information technology development of platforms of online ride-hailing, taxi dispatching, freight dispatching, etc., effectively improved the motor vehicles’ operation efficiencies of trucks, passenger cars, taxis and etc., and reduced empty influencing rate, thus lowering carbon emissions.
The industry scale effect has a relatively obvious influence on the inhibition of carbon emissions in Chinese transportation industry, with the overall contribution value and contribution rate of −116.71% and −19.14%, respectively, in the study range. From different stages, except the first stage to promote the increase of carbon emissions, the last three stages all act as inhibitory effects. This is mainly because China has begun to actively seek the transformation and upgrading for industrial structure. The proportion of secondary industry in the national economy has declined, while that of the tertiary industry has been rising. As the transportation volume for per unit output value of the secondary industry is higher than that of the tertiary industry, the demand for transportation is gradually reduced and the industry scale is also continuously reduced, thus restraining the increase of carbon emissions.
As shown in Table 3, the contribution value of economic output effect to the carbon emissions of the transportation industry increased year by year. The contribution rate increased from 71.10% in the first stage to 267.15% in the fourth stage. It can be seen that economic output is the key factor for the rise of the total carbon emissions of Chinese transportation industry. Therefore, if China wants to reduce the carbon emissions of the transportation industry, it should slow down its speed of economic development.
The contribution value of the population size effect to the carbon emissions of the transportation industry continued to rise from 1997 to 2017, but the total contribution value was only 40.82. This shows that the population size effect has a certain promoting influence on the carbon emissions of the Chinese transportation industry, but its overall influence is limited. It is because Chinese population control policy made the population growth rate begin to slow down. Although the continuing growth of population promoted the increase of the demand for transportation, its increase rate is not large, so the carbon emissions of transportation do not increase much.
4.2. Analyses of the Key Influencing Factors for Regional Carbon Emissions
In this paper, the LMDI decomposition method is used to decompose the factors affecting the carbon emissions of transportation in eight regions of China. Their contribution values and contribution rates of each factor are calculated. The results are shown in Table 4 and Table 5.
Table 4.
Results of LMDI decomposition for carbon emissions from transportation industry in the 8 regions (unit: million tons).
Table 5.
Contribution rate of LMDI decomposition of carbon emissions in transportation industry in the 8 regions (unit: %).
4.2.1. Carbon Emissions Coefficient Effect of Energy
From Table 4 (DG), the contribution values of carbon emissions coefficient effect of energy in the eight regions to the carbon emissions of the transportation industry are all nearly negative and their absolute values are small. It can be seen that the carbon emissions coefficient effect inhibits the carbon emissions of the transportation industry in different regions. However, the inhibition effect is small and the regional differences are not large. This is due to the fact that the fuel sources and the quality of oil products for vehicles in different regions of China are similar, with a low proportion of clean energy and a low degree of improvement in the quality of oil products.
4.2.2. Energy Intensity Effect
The energy intensity effect (DS, Table 4) has certain differences in influencing carbon emissions of the transportation industry in different regions. In general, except for the Great Northwest, the contribution values of the energy intensity effect to carbon emissions in the other seven regions were positive from 1997 to 2017.
Within the study range, the energy intensity effects of each region inhibited the carbon emissions of the transportation industry in most stages. Among them, the energy intensity effects of the Southern and the North Coast have significant inhibitory influences on the carbon emissions of the transportation industry in the third and fourth stages. This is mainly because these two regions adopted relatively strict energy-saving policies for transportation vehicles, which reduced energy consumption in the transportation process and restrained the increase of carbon emissions. In the fourth stage, the energy intensity effects in the Great Northwest and the Northeast regions became positive, and their energy intensities were still rising. This is because the two regions have relatively weak control over the energy saving of vehicles, and clean energy consumption accounts for a low proportion.
4.2.3. Industry Scale Effect
From Table 4 (DA), except for the Great Southwest, the contribution values of industry scale effects in the other 7 regions were negative from 1997 to 2017, indicating that the industrial scale effect inhibited the carbon emissions of the transportation industry on the whole.
Among them, the absolute values of the contribution values of industry scale effects in the Southern and the Eastern Coast were relatively large, which played a great role in restraining the carbon emissions from the transportation industry. This is mainly caused by the change of regional industrial structure. The proportion of the secondary industry in the Southern Coast decreased from 47% in 1997 to 37% in 2017, but the tertiary industry increased from 37% in 1997 to 52% in 2017. On the Eastern Coast, the proportion of secondary industry decreased from 52% in 1997 to 39% in 2017, but the tertiary industry increased from 36% to 58%. The decreased proportion of secondary industry leads to a gradual decrease in the demand for transportation and the scale of the transportation industry, thus restraining the increase of carbon emissions. However, the industrial structure of the Great Southwest has not changed significantly. In 1997, its secondary industry accounted for 41%, and in 2017, it still accounted for 39%. The demand for transportation was still high, so the carbon emissions of transportation industry in this region were still rising.
4.2.4. Economic Output Effect
It can be seen that the contribution values of the economic output effect in each region within the research range (DR, Table 4) are always positive. Their contribution rates to the carbon emissions of the transportation industry are greater than other effects in the same period (RR, Table 5). This indicates that economic output effect is the most important factor influencing on the growth of the carbon emissions of transportation industry in each region.
Overall, the contribution values of the economic output effects of the Eastern Coast and the Southern Coast and the Great Northwest to the carbon emissions of the transportation industry continued to rise. This is mainly due to the fact that the Eastern and the Southern Coast are the first regions to implement reform and opening up in China, with strong state policy support, a high degree of foreign trade, superior geographical location and convenient land and sea transportation, resulting in its rapid economic development. The sustained and rapid economic growth increases the demand for transportation, so the economic output effect plays a great role in promoting the carbon emissions of the transportation industry in these two regions. For the Great Northwest, since China officially implemented the “western development strategy” in 2000, the state council has issued four five-year plans for the development of the western regions, focusing on the top-level design of industrial development, ecological and environmental protection, infrastructure construction and opening to the outside world, etc. The continuous progress of the “western development strategy” made the Great Northwest realize the transformation and upgrading of partly traditional industries, develop a series of characteristic industries, promoting the transformation from the resource advantage to economic advantage. Moreover, because of the low base of economic output in the Great Northwest, its economic output has grown rapidly, which in turn has increased the speed of demand for transportation, thus objectively bringing about the increase in carbon emissions.
The contribution values of economic output effect to carbon emissions in the Northeast, the North Coast, the middle reaches of Yangtze River, Yellow River and the Great Southwest increased continuously in the first three stages but decreased in the fourth stage. This is mainly due to the continuous growth of economic output in various regions since the reform and opening up, and these five regions are no exception. Therefore, the rigid demand for transportation keeps rising, which promotes the growth of carbon emissions. Consequently, the contribution values of economic output effect to the carbon emissions of the transportation industry in the first three stages continue to increase. Since 2012, Chinese economic development has slowed down and turned from high-speed growth to high-quality development. Due to the slow industrial transformation in these five regions, the economic growth slowed down, so that the contribution value of economic output effect to the carbon emissions of the transportation industry declined in the fourth stage.
4.2.5. Population Size Effect
From Table 4 and Table 5, the contribution values of population size effects (DP, Table 4) of the eight regions in each stage are mostly positive, indicating that population size effect can promote the increase of carbon emissions in the transportation industry.
In general, from 1997 to 2017, the contribution values of population size effects to the carbon emissions of the transportation industry in the Southern and Eastern Coast were relatively large, 16.40 and 11.90, respectively, with contribution rates of 20.27% and 11.46%, respectively. This is mainly due to the fact that the Southern and Eastern Coast are the two regions with the most developed economy in China. The large population inflow resulted in the soaring demand for transportation, which promoted the increase of carbon emissions.
The contribution degree of population size effect to carbon emissions in the Northeast was relatively small in the first three stages. Even the contribution value and contribution rate were negative in the fourth stage. This is mainly because the population of the Northeast has continually decreased for three consecutive years. The population in 2017 was 0.92% lower than that in 2014. There are three main reasons for the decline. Firstly, the birth rate in the Northeast is far below that of Chinese average and the population is ageing severely. Secondly, the government in the Northeast is less efficient than those of other economically developed regions, which makes it difficult to attract investment and thus absorbs less employment. Finally, as the traditional heavy industry in the Northeast has weakened over the years and light industry has not developed, it attracts fewer talents.
5. Conclusions and Suggestions
5.1. Conclusions
In this paper, 30 provinces of China are divided into 8 regions to calculate and analyze the current situation of regional carbon emissions in the transportation industry from 1997 to 2017. Based on the LMDI decomposition method, the contribution values and contribution rates of each influencing factor are analyzed, and the following main conclusions are drawn as follows.
(1) The total CO2 emissions in the Chinese transportation industry show a ladder-type annual growth, from 108.43 million tons in 1997 to 714.58 million tons in 2017, with an average annual growth rate of 9.89%. Among them, the carbon emissions on the Eastern Coast are rising steeply and are higher than those in other regions as a whole. In 2017, the carbon emissions of the transportation industry in the Eastern Coast accounted for 17.27% of the Chinese total, but the total area only accounted for 2.28% of Chinese total. The emissions of the Great Northwest were always lower than those of other regions, with only 38.75 million tons in 2017. Carbon emissions in the Great Southwest grew the fastest during the study range, with an average annual growth rate of 12.18% from 1997 to 2017, an 8.96-fold increase.
(2) Based on the results of LMDI decomposition, the economic output effect is the most important factor to promote the carbon emissions of the transportation industry in various regions. Among them, the contribution values of economic output effect to carbon emissions of the Eastern Coast, the Southern Coast and the Great Northwest continued to rise, while the contribution values of the economic output effect to carbon emissions of the other five regions decreased to some degree in the fourth stage. The population size effect promoted the carbon emissions of the transportation industry in various regions, but the population size effect of the Northeast had a significant restraining effect on the carbon emissions in the fourth stage. Energy intensity effects of each region in most stages suppressed the carbon emissions of the transportation industry. Among them, the energy intensity effects of the North Coast and the Southern Coast in the two stages had obvious inhibitory influences on transportation carbon emissions, while the energy intensity effects of the Great Northwest and the Northeast still had positive contribution values in the fourth stage. Except the Great Southwest, the industry scale effects have inhibited the carbon emissions of the transportation industry in other regions. The carbon emissions coefficient effect to carbon emissions in different regions is not significant and the inhibitory effect is relatively small.
5.2. Policy Recommendations
In general, there are some differences in the factors influencing carbon emissions of the transportation industry in different regions of China. Therefore, based on the above research results, the following suggestions are proposed for policy makers.
(1) Change the pattern of economic growth and appropriately lower the speed of economic development. The results of this paper show that the economic output effect is the main factor leading to the increase of carbon emissions in the Chinese transportation industry. China should gradually change the pattern of economic growth, appropriately reduce the speed of economic development, and strive to achieve a coordinated development of economic growth and environmental protection. In the process of carbon reduction in the transportation industry, China should set differentiated emissions reduction targets. Economically developed regions such as the Eastern Coast and the Southern Coast regions can consider setting more stringent standards for industrial carbon reduction so as to realize the first transformation of the low-carbon economic growth mode. In the process of economic development, regions such as the Great Northwest, the Northeast and the middle reaches of the Yellow River can gradually increase their responsibilities of carbon reduction and promote the steady transformation of economic growth pattern.
(2) Reduce the energy intensity of regional transportation industry. Energy intensity effect should have been an important factor for reducing carbon emissions of the transportation industry, but the research results show that energy intensity effect promotes carbon emissions of transportation industry on the whole. So China should actively promote the usages of new energy, clean energy vehicles and ships, increase the application of new energy and clean energy vehicles in the fields of city bus, taxi, express delivery, airports, railway freight yard, etc., and reduce the unit consumption of transportation industry and regional energy intensity to control the carbon emissions of the transportation industry. The regions of the Great Northwest and the Northeast, etc. with high energy intensities should formulate more reasonable policies of emissions reduction, vigorously promote the use of clean energy, and improve the efficiency of clean energy.
(3) Optimize the regional industrial structure. As a whole, the industry scale effect has a restraining influence on the carbon emissions of the Chinese transportation industry. Therefore, China can promote the optimization and upgrading of its industrial structure, develop strategic emerging industries and a modern service industry, and promote the industries to move towards the medium-high end and achieve high-quality development. The rapid transformation of the industrial structure in the Eastern Coast and Southern Coast regions has played a significant role in curbing the carbon emissions of the transportation industry. Therefore, China should continue to optimize the industrial structure, accelerate the expansion of tertiary industry, and encourage the development of new high-tech industries. For economically underdeveloped regions such as the Great Southwest, the Great Northwest and the middle reaches of the Yellow River, appropriate industrial transformation policies should be formulated to encourage them to constantly optimize their industrial structures, improve their capacities for scientific and technological innovation, and shift them from low-end traditional manufacturing to medium- and high-end manufacturing so as to reduce the demand for transportation and lower carbon emissions.
Author Contributions
C.Z. and M.W. conceived the study, wrote original draft and contributed to all aspects of this work, Y.Y. analyzed the data and gave some useful suggestions to this work. All authors have read and agreed to the published version of the manuscript.
Funding
This research was funded by the National Social Science Foundation in China. (Grant No. 19BJY175).
Acknowledgments
The authors thank Dawei Gao and Wenbo Du for their help in participation in data collection, and thank Lijiao Qin for her help in the English editing.
Conflicts of Interest
The authors declare no conflict of interest.
References
- International Energy Agency. CO2 Emissions from Fuel Combustion 2019; International Energy Agency: Paris, France, 2019. [Google Scholar]
- International Energy Agency. CO2 Emissions from Fuel Combustion 2008; International Energy Agency: Paris, France, 2008. [Google Scholar]
- Xu, B.; Lin, B.Q. Differences in regional emissions in China’s transport sector: Determinants and reduction strategies. Energy 2016, 95, 459–470. [Google Scholar] [CrossRef]
- Duan, H.B.; Mo, J.L.; Fan, Y.; Wang, S.Y. Achieving China’s energy and climate policy targets in 2030 under multiple uncertainties. Energy Econ. 2018, 70, 45–60. [Google Scholar] [CrossRef]
- Yu, J.; Da, Y.B.; Ouyang, B. Analysis of carbon emission changes in China’s transportation industry based on LMDI decomposition method. China J. Highw. Transp. 2015, 28, 112–119. [Google Scholar]
- Lei, L.; Zhong, Y.Y.; Yuan, X.L. Decomposition Model and Empirical Study of Regional Carbon Emissions for China. Mod. Econ. Sci. 2011, 33, 59–65. [Google Scholar]
- Shipper, L.; Scholl, L.; Price, L. Energy Use and Carbon Emissions from Freight in 10 Industrialized Countries: An Analysis of Trends from 1973 to 1992. Transp. Res. D 1997, 2, 57–76. [Google Scholar] [CrossRef]
- Zhu, Y.Z. Analyses on Energy Development and Carbon Exhaustion According to Circumstances in Future China’s Communications and Transportation. China Ind. Econ. 2001, 12, 30–35. [Google Scholar]
- Su, T.Y.; Zhang, J.H.; Li, J.L.; Ni, Y. Influence Factors of Urban Traffic Carbon Emission: An Empirical Study with Panel Data of Big Four City of China. Ind. Eng. Manag. 2011, 16, 134–138. [Google Scholar]
- Timilsina, G.R.; Shrestha, A. Transport Sector CO2 Emission Growth in Asia: Underlying Factors and Policy Options. Energy Policy 2009, 37, 4523–4539. [Google Scholar] [CrossRef]
- Timilsina, G.R.; Shrestha, A. Factors Affecting Transport Sector CO2 Emissions Growth in Latin American and Caribbean Countries: An LMDI Decomposition Analysis. Int. J. Energ. Res. 2009, 33, 396–414. [Google Scholar] [CrossRef]
- Zhang, H.J.; Wang, L.N.; Chen, W.Y. Decomposition analysis of CO2 emissions from road and rail transport systems. Tsinghua Univ. Sci. Technol. 2017, 57, 443–448. [Google Scholar]
- Du, Q.; Su, Q.; Yang, Q.; Feng, X.Y.; Yang, J. Path analysis method of influencing factors of carbon emissions for Chinese transportation industry. J. Traffic Transp. Eng. 2017, 17, 143–150. [Google Scholar]
- Talbi, B. CO2 emissions reduction in road transport sector in Tunisia. Renew. Sust. Energ. Rev. 2017, 69, 232–238. [Google Scholar] [CrossRef]
- Lu, S.R.; Jiang, H.Y.; Liu, Y. Regional Disparities and Influencing Factors of CO2 Emission in Transportation Industry. J. Transp. Syst. Eng. Inf. Technol. 2017, 17, 32–39. [Google Scholar]
- Fan, Y.J.; Qu, J.S.; Zhang, H.F.; Xu, L.; Bai, J.; Wu, J.J. Study on the Current Situation and Influence Factors of Transportation Carbon Emissions in Five Great Northwest Provinces. Ecol. Econ. 2019, 35, 32–37. [Google Scholar]
- Li, X.Y.; Li, D. Influencing factors and spatial pattern analysis of the transportation carbon emission in Henan Province. J. Lanzhou Univ. Nat. Sci. 2019, 55, 430–435. [Google Scholar]
- Ouyang, B.; Feng, Z.H.; Li, Z.K.; Bi, Q.H.; Zhou, A.Y. Calculation and Evaluation Methodology of Transport Energy Consumption and Carbon Emission-The Case of Jiangsu Province. Soft Sci. 2015, 29, 139–144. [Google Scholar] [CrossRef]
- Ke, S.F.; Wang, Y.; Chen, Y.G.; Liu, A.Y. Carbon Emissions and Reduction Scenarios of Transportation in Beijing. China Popul. Resour. Environ. 2015, 25, 81–87. [Google Scholar]
- Zheng, J.L.; Mi, Z.F.; Coffman, D.; Milcheva, S.; Shan, Y.L.; Guan, D.B.; Wang, S.Y. Regional development and carbon emissions in China. Energy Econ. 2019, 81, 25–36. [Google Scholar] [CrossRef]
- Zhu, C.Z.; Gao, D.W. A Research on the Factors Influencing Carbon Emission of Transportation Industry in ‘the Belt and Road Initiative’ Countries Based on Panel Data. Energies 2019, 12, 2405. [Google Scholar] [CrossRef]
- Yang, Q.; Zhu, R.H.; Zhao, X.Q. Calculation decoupling analysis and scenario prediction of carbon emissions of transportation in China. J. Chang’an Univ. Nat. Sci. Edit. 2014, 34, 77–83. [Google Scholar]
- Ma, H.T.; Kang, L. Spatial and temporal characteristics and prediction of carbon emissions from road traffic in the Beijing-Tianjin-Hebei Region. Resour. Sci. 2017, 39, 1361–1370. [Google Scholar]
- Zhao, M.; Zhang, W.G.; Yu, L.Z. Resident Travel Modes and CO2 Emissions by Traffic in Shanghai City. Res. Environ. Sci. 2009, 22, 747–752. [Google Scholar]
- Wang, H.Y.; Wang, N. Research on Factors Affecting Carbon Emissions of China’s Comprehensive Transportation System. Log. Technol. 2019, 38, 78–83. [Google Scholar]
- Sun, J.K.; Zhang, J.H.; Tang, G.R.; Hu, H.; Chen, M. Review on Carbon Emissions by Tourism Transportation. China Popul. Resour. Environ. 2016, 26, 73–82. [Google Scholar]
- Intergovernmental Panel on Climate Change (IPCC). IPCC Guidelines for National Greenhouse Gas. Inventories 2006 Volume 2 Energy; Intergovernmental Panel on Climate Change: Kanagawa, Japan, 2007. [Google Scholar]
- Kaya, Y. Impact of Carbon Dioxide Emission Control. on GNP Growth: Interpretation of Proposed Scenarios; IPCC Energy and Industry Subgroup; Response Strategies Working Group: Paris, France, 1990. [Google Scholar]
- Hoekstra, R.; Van den Bergh, J. Comparing structural decomposition analysis and index. Energy Econ. 2003, 25, 39–64. [Google Scholar] [CrossRef]
- Zhang, M.; Mu, H.Y.; Song, Y.C. Decomposition of energy-related CO2 emission over 1991–2006 in China. Ecol. Econ. 2009, 68, 2122–2128. [Google Scholar] [CrossRef]
- Ang, B.W.; Zhang, F.Q.; Choi, K.H. Factorizing Changes in Energy and Environmental Indicators through Decomposition. Energy 1998, 23, 489–495. [Google Scholar] [CrossRef]
- Ang, B.W. Decomposition analysis for policymaking in energy: Which is the preferred method. Energy Policy 2004, 32, 1131–1139. [Google Scholar] [CrossRef]
- Wang, W.W.; Zhang, M.; Zhou, M. Using LMDI method to analyze transport sector CO2 emissions in China. Energy 2011, 36, 5909–5915. [Google Scholar] [CrossRef]
- Zhu, C.Z.; Du, W.B. A Research on Influencing Factors of Carbon Emissions of Road Transportation Industry in Six Asia-Pacific Countries Based on the LMDI Decomposition Method. Energies 2019, 12, 4152. [Google Scholar] [CrossRef]
- Liu, B.S. A Research on the Economic Regionalizing of China. China Soft Sci. 2009, 2, 81–90. [Google Scholar]
© 2020 by the authors. Licensee MDPI, Basel, Switzerland. This article is an open access article distributed under the terms and conditions of the Creative Commons Attribution (CC BY) license (http://creativecommons.org/licenses/by/4.0/).