Article

Kinetic Characterization of Enzymatic Hydrolysis of Apple Pomace as Feedstock for a Sugar-Based Biorefinery

by
Alessandra Procentese
1,
Maria Elena Russo
1,*,
Ilaria Di Somma
1 and
Antonio Marzocchella
2
1
Istituto di Ricerche sulla Combustione, Consiglio Nazionale delle Ricerche, 80125 Napoli, Italy
2
Dipartimento di Ingegneria Chimica, dei Materiali e della Produzione Industriale, Università degli Studi di Napoli Federico II, 80125 Napoli, Italy
*
Author to whom correspondence should be addressed.
Energies 2020, 13(5), 1051; https://doi.org/10.3390/en13051051
Submission received: 4 February 2020 / Revised: 20 February 2020 / Accepted: 24 February 2020 / Published: 26 February 2020

Abstract

:
The enzymatic hydrolysis of cellulose from biomass feedstock in the sugar-based biorefinery chain is penalized by enzyme cost and difficulty to approach the theoretical maximum cellulose conversion degree. As a consequence, the process is currently investigated to identify the best operating conditions with reference to each biomass feedstock. The present work reports an investigation regarding the enzymatic hydrolysis of apple pomace (AP). AP is an agro-food waste largely available in Europe that might be exploited as a sugar source for biorefinery purposes. A biomass pre-treatment step was required before the enzymatic hydrolysis to make available polysaccharides chains to the biocatalyst. The AP samples were pre-treated through alkaline (NaOH), acid (HCl), and enzymatic (laccase) delignification processes to investigate the effect of lignin content and polysaccharides composition on enzymatic hydrolysis. Enzymatic hydrolysis tests were carried out using a commercial cocktail (Cellic®CTec2) of cellulolytic enzymes. The effect of mixing speed and biomass concentration on the experimental overall glucose production rate was assessed. The characterization of the glucose production rate by the assessment of pseudo-homogeneous kinetic models was proposed. Data were analysed to assess kinetic parameters of pseudo-mechanistic models able to describe the glucose production rate during AP enzymatic hydrolysis. In particular, pseudo-homogeneous Michaelis and Menten, as well as Chrastil’s models were used. The effect of lignin content on the enzymatic hydrolysis rate was evaluated. Chrastil’s model provided the best description of the glucose production rate.

Graphical Abstract

1. Introduction

The conversion of lignocellulosic biomass into bio-based chemicals according to the biorefinery sugar-platform involves four main steps: (i) pre-treatment to remove/disaggregate the lignin structure; (ii) enzymatic hydrolysis to convert polysaccharides into fermentable sugars; (iii) fermentation to convert sugars into bio-based products; and (iv) recovery and concentration of the bio-based products [1]. The enzymatic conversion of cellulose into fermentable sugars is one of the bottlenecks of the whole biorefinery chain. Indeed, the success of this step depends strongly on the operating conditions (e.g., temperature, pH, biomass/liquid ratio, enzyme loading), the effect of product inhibition on enzyme catalysis [2], and the enzyme consumption (specific activity, stability, enzyme recycling strategies). Altogether, these issues affect the overall production cost of the sugars. Zhang et al. [3] pointed out that the incidence of the pre-treatment cost on the biofuel production is about 0.13–0.17 € per litre of ethanol, a quite large fraction for the competitive biofuel cost that should be less than 0.6 €/L. In addition, the first pre-treatment aimed at delignification strongly affects the rate and the degree of conversion of the enzymatic hydrolysis of polysaccharides. In particular, the nature of the pre-treatment (steam explosion, chemical pre-treatment with acid or alkaline solvents, organosolv, biological, etc.) influence the composition and the structure of the biomass substrate subjected to the enzymatic hydrolysis [4,5].
Some technical issues related to the enzymatic hydrolysis process are still open. Among these issues, the selection of the reactor configuration and the optimization of sugar recovery can be tackled based on quantitative information about enzymatic hydrolysis kinetics. With regard to the reactor configuration, different valuable studies date back to the eighties [6,7]. Tan et al. [6] carried out the enzymatic hydrolysis in a column reactor with continuous cellulase recycling to decrease the enzyme consumption. Gusakov et al. [7] tested the cellulose conversion in a batch reactor and in a plug-flow reactor to select the best configuration in terms of cellulose conversion. Nowadays, further studies are focused on innovative strategies to combine two fundamental targets: the maximization of both sugar concentration in the hydrolysate and polysaccharides conversion [8,9]. Typically, these two targets are in contrast with one another: high biomass loading (15–20 wt%) favours high soluble sugar concentration and low polysaccharides conversion, and low biomass loading (about 5 wt%) provides low sugar concentration and high polysaccharides conversion. An effective strategy was proposed by Xu et al. [8] to overcome this issue. They reported a two-step process that provided cellulose conversion and a sugar concentration in the final hydrolysate that is higher than the conventional single-step hydrolysis. The two-step process was based on the optimization of the enzyme adsorption on the biomass during the first short stage of the process (about 1 h) and the successive optimization of extensive hydrolysis during the second, long stage of the process (up to 48 h). A similar strategy was modelled by González Quiroga et al. [9]. They proposed a two-step enzymatic hydrolysis at different biomass loadings in different continuous reactors.
The further development of the proposed two-step strategies asks for the quantitative characterization of the hydrolysis of cellulose in real biomass. Hydrolysis is a heterogeneous process that includes [10,11] liquid–solid transfer of biocatalyst, enzymes adsorption on biomass surface, enzyme complexation with the polysaccharide chains, and cellulose and hemicellulose enzymatic hydrolysis. The last step may be affected by product inhibition, too. The rate of each of the listed phenomena depends on biomass structure, biomass loading, type of biocatalyst, and reactor configuration. As a consequence, the overall sugar production rate may be a complex combination of each step and its characterization can provide a rational tool for process design. Many kinetic models have been applied to the enzymatic hydrolysis of cellulose [9,10]. However, to the author’s knowledge, only some studies refer to the kinetic characterization of the enzymatic hydrolysis of real biomasses after delignification pre-treatment [12,13,14]. These studies provide kinetic parameters to be used to identify the optimal enzymatic hydrolysis operating conditions and to help to quantify the effect of the biomass composition (sugar and lignin content) resulting from different delignification conditions.
The present work proposes the kinetic characterization of the enzymatic hydrolysis of real biomass according to rigorously controlled conditions. Residues from apple pomace (AP) processing were used as substrate because it is one of the most available European agro-food wastes [15]. The work was aimed at investigating the effect of mixing rate applied to the biomass slurry during the enzymatic hydrolysis; quantifying through kinetic parameters the dependence of glucose production rate on the biomass composition affected in its turn by the delignification process, selecting a proper pseudo-homogeneous kinetic model for the description of the process. To these aims, AP samples were pre-treated with a chemical (alkaline or acid) and biological (laccases) pre-treatment and hydrolysed using commercial enzymes as biocatalysts, and then enzymatic hydrolysis tests were performed under a relevant range of mixing speeds, enzyme concentrations, and biomass-to-liquid ratios. Pseudo-homogeneous models were adopted for the kinetic characterization, and the kinetic parameters of the Michaelis and Menten with product inhibition model and that of Chrastil’s model were assessed.

2. Materials and Methods

2.1. Raw Material and Eenzymes

Apple pomace (AP) was selected as the waste biomass in the framework of the European project “Waste2Fuel” (grant agreement N°654623) and was kindly supplied by Muns Agroindustrial S.L. (Lleida, Spain). The raw biomass samples were dried at 40 °C, sieved in the range 0.5–1 mm, and stored in sealed plastic bags at room temperature until used.
The enzyme cocktail Cellic®CTec2 was selected according to the common procedure followed in the framework of the European project “Waste2Fuel” (grant agreement N°654623). Moreover, the use of Cellic®CTec2 allowed to compare the data with those reported by Pratto et al. [13]. The commercial cocktail Cellic®CTec2 was kindly donated by Novozymes Latin America (Araucária, PR, Brazil); it has an undisclosed composition and is properly made by a mixture of cellulases, hemicellulases, and β-glucosidases so that pentose and hexose sugars can be recovered as products of polysaccharides hydrolysis. The cellulase activity was determined in terms of Filter Paper Units (FPU) according to Adney and Baker [16].

2.2. Biomass Pretreatment

Any saccharification process of lignocellulose biomass needs removal of lignin to make the polysaccharides chains accessible to the enzymes in the enzymatic hydrolysis step. Several chemical and biological delignification pre-treatments have been proposed as alternative to the conventional steam explosion process, to minimize energy duty and the formation of inhibitors compound affecting the fermentation of hydrolytic sugars. In the present study, AP was pre-treated according to three processes: hydrolysis in diluted alkaline solvent, hydrolysis in diluted acid solvent, and laccase catalysed delignification. Details on pre-treatment procedures are reported in the next subsections.

2.2.1. Chemical Delignification

Chemical delignification was accomplished by using diluted alkaline or acid solvents. Dried AP powder was soaked in 2% wt NaOH or HCl aqueous solution: 10 mL of solution were used per gram of solid mass. The suspension was kept in an autoclave (VAPORMATIC 770) for 30 min at 121 °C according to the procedure suggested by Procentese et al. (2017). The biomass was separated from the liquid phase (black liquor) by 10 min centrifugation at 5000 rpm. The recovered biomass was washed with distilled water until pH 7 was reached, then it was dried at 40 °C, weighted, and stored until used for enzymatic hydrolysis.

2.2.2. Laccase Catalysed Delignification

Dried AP powder was treated with laccases (166 U mL−1), kindly provided by Biopox s.r.l., in a 50 mM sodium citrate buffer of pH 5. Tests were carried out by setting the dry biomass to solvent ratio at 1:10, in a shaker incubator at 150 rpm and 28 °C for 24 h. After pre-treatment, the biomass was filtered and washed with water, dried at 38 °C until a constant weight was reached, and then weighted and stored until used for enzymatic hydrolysis.

2.3. Enzymatic Hydrolysis of Polysaccharides

Enzymatic hydrolysis tests were carried out using the abovementioned commercial cocktail Cellic®Ctec2. The optimal temperature and pH for Cellic®CTec2 are 50 °C and 4.8, respectively. The activity of the sample cocktail, used for the present investigation, was about 142 FPU mL−1. Enzymatic hydrolysis of pre-treated AP samples was carried out in a 250 mL overhead stirred batch reactor (Applikon MiniBio Lab Reactor Bundles) at a controlled stirring speed and temperature (50 °C) with a 100 mL reaction volume in a 0.05 M sodium citrate buffer of pH 4.8; all the tests were carried out in triplicate. Two hydrolysis tests were performed for each biomass type: short-term tests (1 h) and long-term tests (72 h). The short-term tests were carried out to assess the effects of mixing rate and of substrate concentration on the glucose production rate. The long-term tests were carried out to assess the effect of product as inhibition of the glucose production rate.

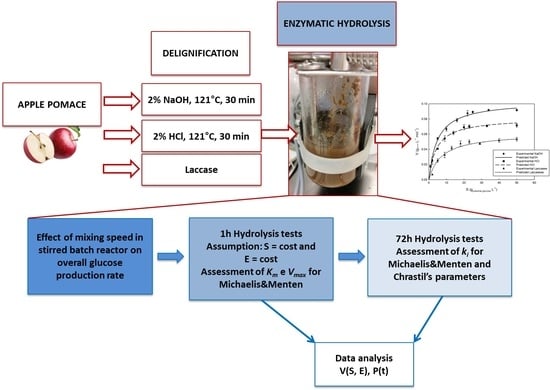
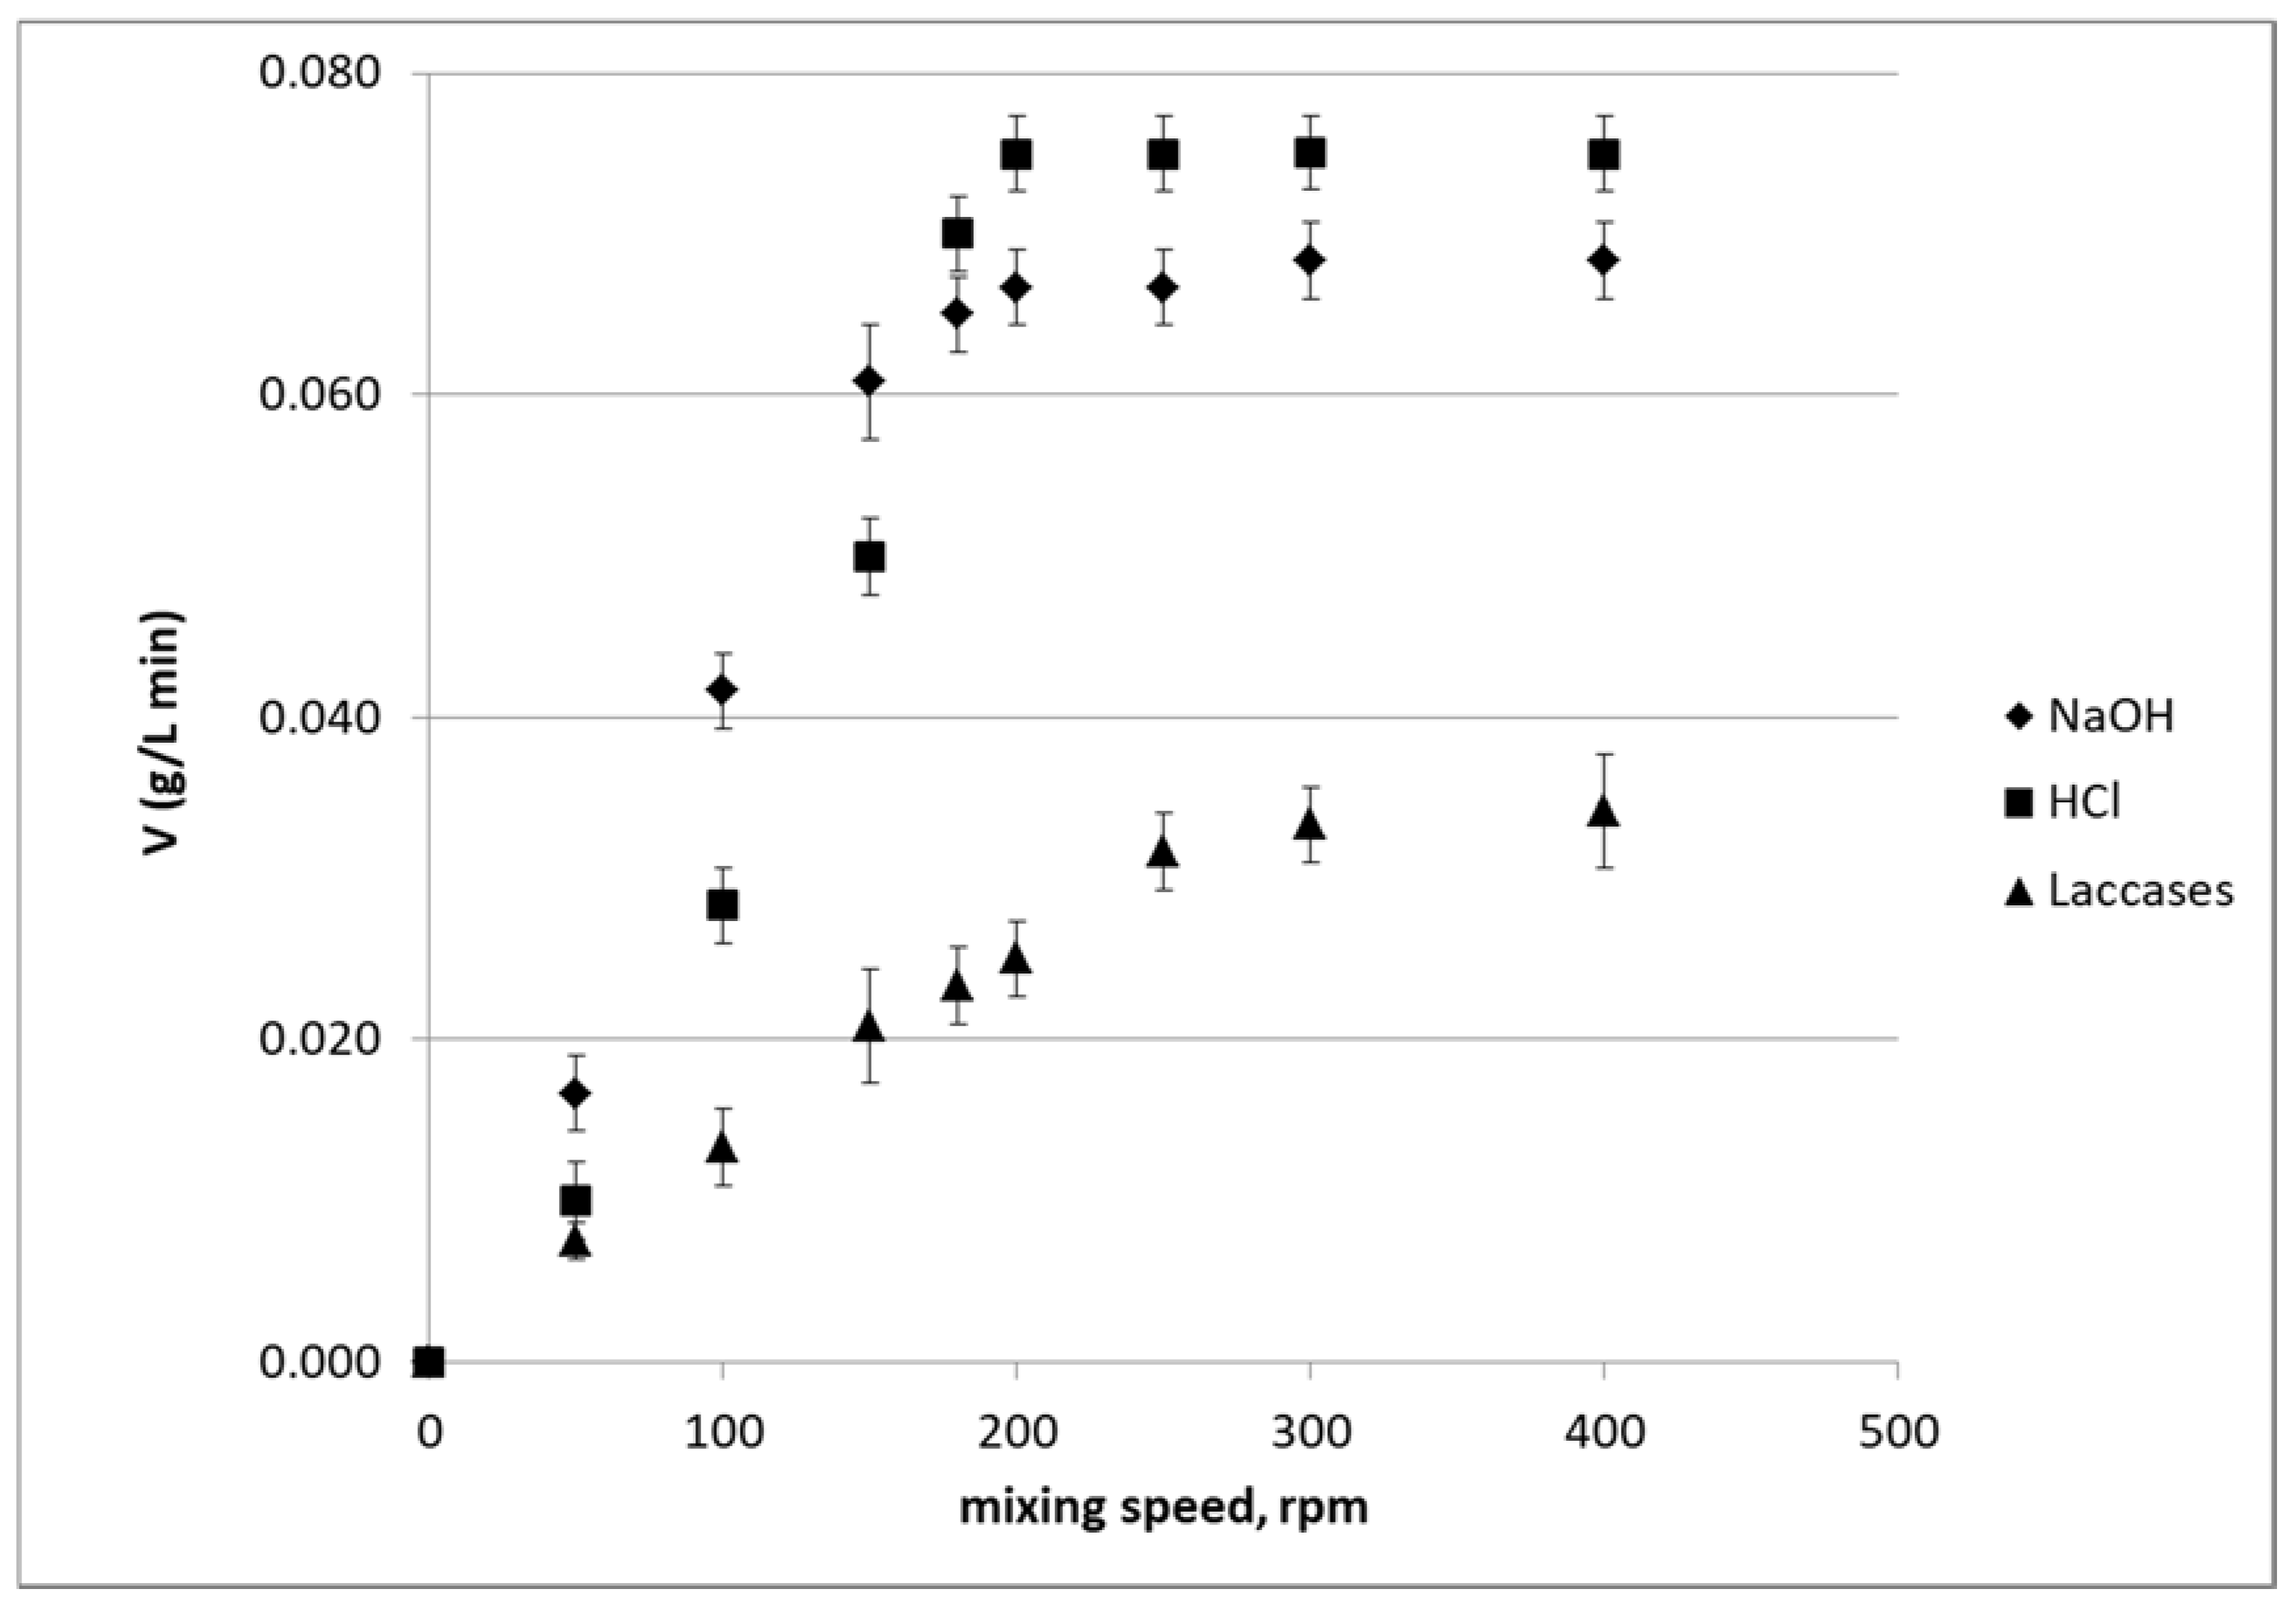
2.4. Effect of Mixing Speed

Short-term hydrolysis tests of pre-treated AP samples were carried out to assess the initial glucose production rate according to Pratto et al. [4], setting the mixing rate between 50 and 500 rpm. Substrate and enzyme concentrations were set at 10% (msolid/vsolution) and 5 FPU gcellulose−1, respectively [4]. Set the mixing speed, the glucose production rate was assessed as the amount of produced glucose after 1 h. The amount of produced glucose was calculated as the difference between the initial glucan concentration (mass of glucan in the biomass per unit volume of liquid) and the glucose concentration in the liquid.
The optimal mixing speed was selected as the minimum value above which no further increase in glucose production rate was observed. The optimal value of the mixing speed was set in tests focused on the investigation of the effects of other operating conditions.

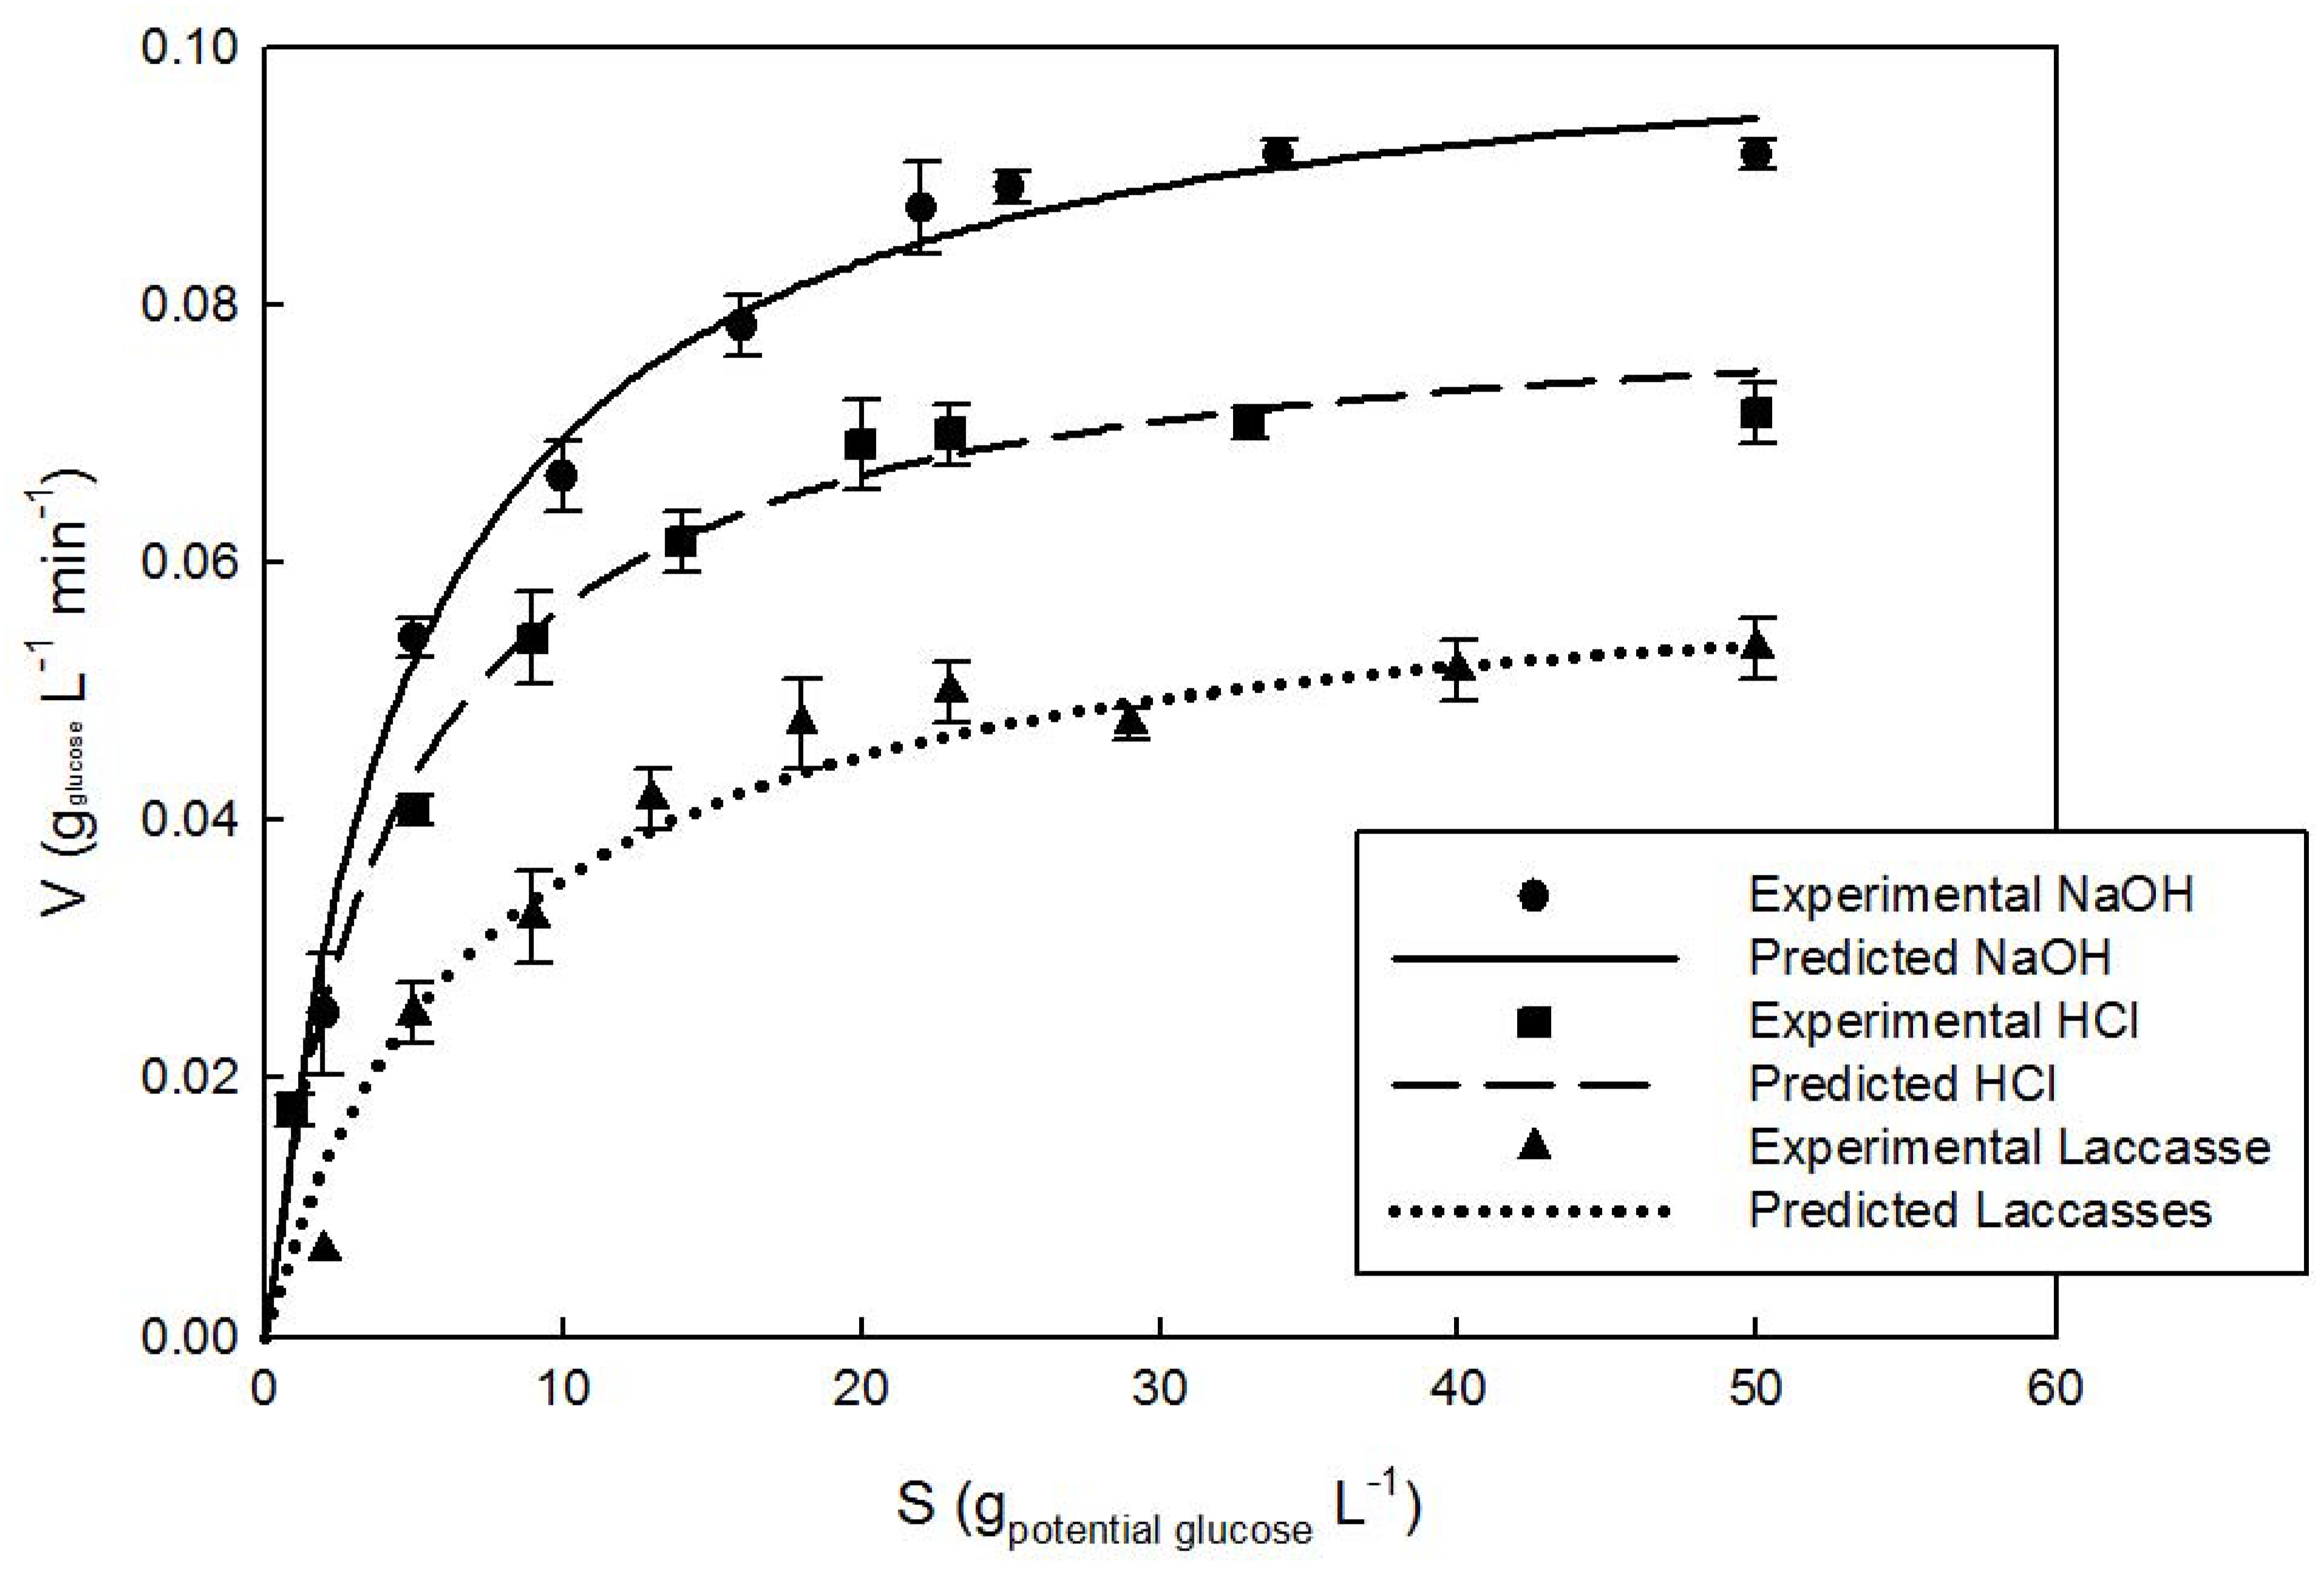
2.5. Effect of Substrate Concentration

The effect of substrate concentration was assessed through brief-term enzymatic hydrolysis tests by changing the biomass loading in the range 1–12% w/v. The enzyme concentration was fixed at 290 FPU Lsolution−1 and the stirring speed was fixed at the optimal value selected according to the tests described in Section 2.6. The glucose production rate was measured, at each biomass concentration, as the amount of produced glucose after 1 h.

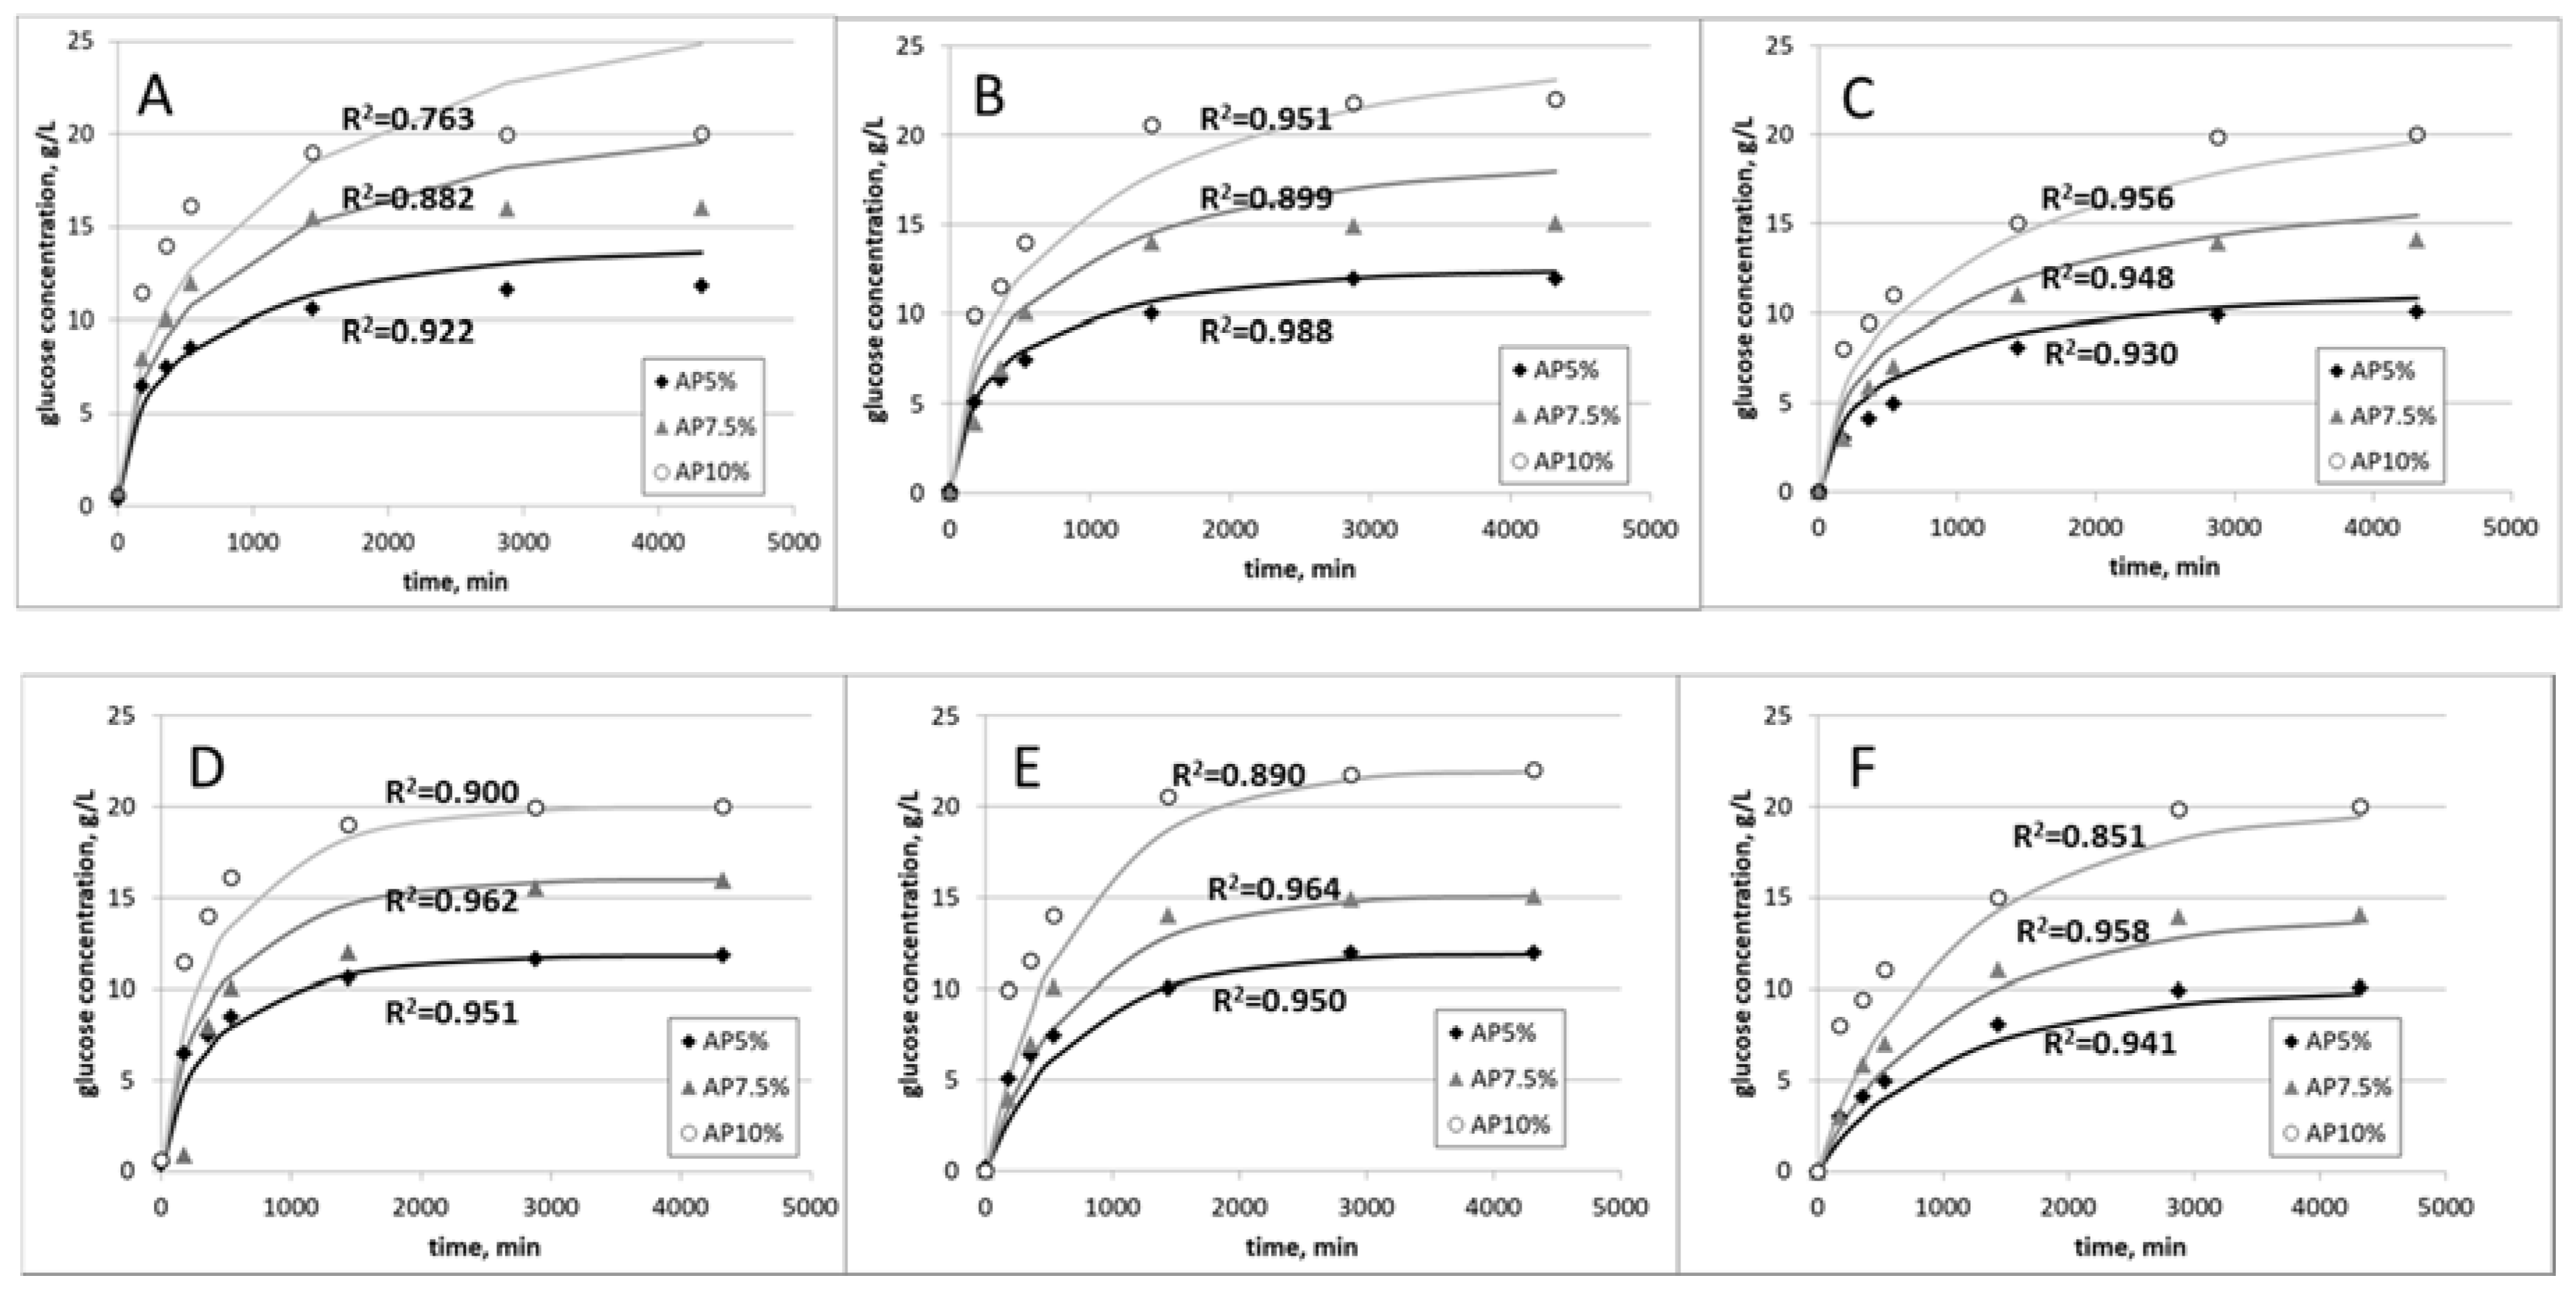
2.6. Effect of Product Inhibition

Product inhibition is well documented in the literature on kinetics of cellulase enzymes [4,7,12,14]. The use of commercial cocktails secures the formation of monomeric sugars; thus, glucose is the main product of polysaccharides hydrolysis. Long-term tests were carried out to evaluate the effect of glucose inhibition on the overall enzymatic rate of glucose production. The tests were carried out at a 5%, 7.5%, and 10% w/v biomass loading for 72 h. The enzyme concentration was set at 828 FPU L−1.

2.7. Analytical Methods

The raw and pre-treated biomass samples were characterized in terms of glucan, xylan, arabinan, and lignin content according to Sluiter et al. [17] by a two-step acid hydrolysis. About 0.3 g biomass sample was suspended in 72% H2SO4 and kept under mixing at 30 °C for 60 min. Then, the acid solvent was diluted to 4% H2SO4 by adding distilled water; the suspension was kept in an autoclave at 121 °C for 60 min. After sample cooling, the solid fraction was vacuum filtered and repeatedly washed with distilled water. The liquid fraction was recovered, neutralized to pH 5–6 by CaCO3 addition, and analysed for monomeric sugars concentrations through an HPLC (Agilent 1260 Infinity HPLC system equipped with a refractive index detector and a Rezex RHM-Monosaccharide H+ Phenomenex column (300 × 7.8 mm, 8 μm), City, state abbreviation if USA, Country) and for acid soluble lignin through UV spectroscopy (City, state abbreviation if USA, Country) [17]. The solid fraction was dried at 105 °C until a constant weight was achieved and then weighted for the assessment of the acid insoluble residue.
The glucose concentration, in samples withdrawn during hydrolysis tests, was assessed after biomass separation (centrifugation at 5000 rpm for 10 min) and liquid filtration (0.25 μm cut-off). The enzymatic kit “D-glucose HK” (Megazyme) was used to assess the glucose concentration in the liquid samples.

2.8. Data Analysis

The experimental data from the hydrolysis tests were worked out to assess the overall kinetics of glucose production during the enzymatic hydrolysis of the pre-treated AP. The presence of oligosaccharides as an intermediate product of hydrolysis (e.g., cellobiose) was neglected and glucose was considered as the only soluble product because the commercial cellulase cocktail Cellic®CTec2 is characterized by a large content of β-glucosidase. The semi-mechanistic kinetic models reported hereinafter have been adopted.
Michaelis and Menten model. The cellulose hydrolysis in AP can be described by the Michaelis and Menten model (Equation (1)), assuming that (1) the substrate is a soluble reactant; (2) the system is homogeneous; (3) the concentration of the enzyme is constant; (4) the formation of the enzyme-substrate complex is rapid and reversible; (5) the breakdown of the enzyme-substrate complex into products is the limiting step of the overall reaction; and (6) the formation of the products is irreversible. The Michaelis and Menten model can be used to determine the initial reaction rate as well as how the glucose production rate proceeds along time.
V ( S ) = V Max   S K M + S
where VMax ( = k*E0) is the maximum rate of reaction at fixed enzyme concentration (E0), S the cellulose concentration, and KM the Michaelis and Menten constant. The Michaelis and Menten model has also been applied in the form reported in Equation (2) to take into account the competitive enzyme inhibition by glucose.
V ( S ) = V Max   S K M ( 1 + P K i ) + S
where P is the glucose concentration, and Ki the product inhibition constant. The Michaelis and Menten model with inhibition by glucose was considered to describe the overall glucose production rate, resulting from long term hydrolysis tests.
Chrastil’s model. This model was developed to describe kinetics taking into account the structural characteristics of a heterogeneous system [18]. According to this model, the time course of glucose concentration can be described by Equation (3):
P = P   [ 1 exp ( kE 0 t ) ] n
where P and P are the product concentration at time t and at the equilibrium (maximum conversion degree), respectively, k is the rate constant proportional to the diffusion coefficient, E0 the initial enzyme concentration, and n a diffusion resistance constant that depends on the structure of the substrate and indicates the apparent reaction order. For negligible diffusion resistance, n tends to 1 and for limiting diffusion resistances n < 1.
Rate of glucose production vs. substrate concentration from data of short- and long-term tests were regressed according to the procedure described in the “Supplementary Materials” section.

3. Results and Discussion

3.1. Characterization of Raw and Pretreated Biomass

Raw and pre-treated AP samples were characterized in term of cellulose, hemicellulose, and lignin content according to the polysaccharides quantification assay [17] as well as in terms of biomass recovery after each delignification pre-treatment. Results of the biomass recovery and characterization are reported in Table 1. The highest biomass recovery was found for AP samples pre-treated with laccase (75%); the smallest biomass recovery was found after acid hydrolysis of AP (50%). The highest glucan content was measured for biomass samples pre-treated with NaOH; the smallest glucan content was measured for AP samples pre-treated with laccases. AP pre-treated with laccases retained the highest lignin fraction among the pre-treated AP samples (14.5% AIL). The degree of delignification was equal to 12%, 70%, and 45% for biomass pre-treated with laccase, NaOH, and HCl, respectively.
The observed different performances in terms of pre-treated biomass composition are due to the type of pre-treatment; in fact, two of the three adopted pre-treatments act with an unspecific hydrolysis by an aqueous alkaline or acid solvent, and the biological pre-treatment acts through specific enzymes on the lignin polymers. Laccases catalyses the oxidation of the phenolic hydroxyl groups in the lignin substrate, and unspecific alkaline and acid hydrolysis involves lignin and other polysaccharide fractions [19]. The different actions result firstly in evident properties of the liquid recovered after the pre-treatment: light-coloured liquid after biological pre-treatment and dark-coloured liquid after chemical pre-treatment [20,21]. This result is consistent with the decrease of xylan and arabinan fractions due to the unspecific hydrolysis of hemicellulose in alkaline and acid solvents. Accordingly, the specific enzymatic pre-treatment resulted in a high biomass recovery, low lignin removal, and thus a small variation in polysaccharides fractions. It is worth noting that the biological pre-treatment provides large biomass recovery and a small variation of xylans and arabinans, about 40% pentose sugars loss against almost complete (97–99%) loss after acid and alkaline pre-treatments. This result encourages further optimization of the laccase use in the delignification of agro-food wastes whenever pentose sugars can be used as substrates for fermentation processes.

3.2. Effect of Mixing Rate on Kinetics

The rate of glucose production can be strongly affected by the mixing rate due to the heterogeneous nature of the enzymatic hydrolysis of real lignocellulosic biomasses. For this reason, the effect of the mixing rate applied in the stirred reactor has been investigated to assess the minimum mixing rate value above which a constant glucose production rate was observed.
Figure 1 reports the initial hydrolysis reaction rates assessed after 1 h of hydrolysis. Operating conditions were 10% w/v biomass loading, 5 FPU gcellulose−1 cellulase activity, and a temperature of 50 °C. The stirring speed was set between 0 and 500 rpm to assess the optimal mixing speed. The optimization was necessary to enhance the liquid–solid mass transfer rate and to investigate the effect on glucose production rate of any other phenomena affected by mixing speed (e.g., biomass aggregates break-up).
As expected, and according to the results reported by Prato et al. [4], the initial hydrolysis rate increased with mixing rate in a range of low mixing rates for all the pre-treated AP samples. This result confirms the strong dependence of apparent glucose production rate on the mixing rate applied to the biomass slurry and thus suggests the necessity to select proper operating conditions (minimum mixing rate) for the quantitative assessment of glucose production kinetics. Tests carried out with NaOH pointed out that the hydrolysis rate for NaOH pre-treated biomass increased with the mixing rate and approached a constant value at mixing rates larger than 180 rpm. The same behaviour was observed in the cases of AP pre-treated with HCl and laccases. The critical value of the mixing rate above which the glucose production rate approached a constant value was 200 and 300 rpm for acid and enzymatic pre-treated AP, respectively. Thus, the minimum values for mixing rates not affecting the apparent glucose production rate during enzymatic hydrolysis of AP samples were 180, 200, and 300 rpm for AP samples pre-treated with alkaline, acid, and biological process, respectively. These values were set for the hydrolysis tests aimed at the assessment of the effects of substrate concentration and product inhibition on the kinetics. Results reported in the next section refer to tests carried out setting the mixing rate at the minimum value to neglect mixing-related phenomena.

3.3. Effect of Substrate Concentration on Kinetics

The effect of substrate (glucans) concentration on the glucose production rate has been assessed according to the procedure reported in the Section 2.5 through brief term (1 h) hydrolysis tests on AP samples pre-treated with one of the three abovementioned delignification processes. Figure 2 reports the glucose production rate as a function of substrate (glucans) concentration for all the AP samples. The glucose production rate increased progressively with S and approached a maximum constant value as S was larger than about 20 g L−1. The maximum constant values of the glucose production rates were close to 0.09 gglucose Lsolution−1 min−1 for AP samples pre-treated with 2% NaOH, 0.070 gglucose Lsolution−1 min−1 for AP pre-treated with 2% HCl, and 0.04 gglucose Lsolution−1 min−1 for AP pre-treated with laccases.
According to the procedure proposed by Pratto et al. [4] the substrate concentration has been assumed to be constant during the short tests (1 h). This assumption has been verified after the experimental tests; at small substrate concentrations (S < 10 g L−1) the substrate conversion after 1 h enzymatic hydrolysis was higher than 20% of the potential glucose (see Table 1). This result suggests further future assessments of the initial glucose production rate at low biomass loadings (<1 wt %) through hydrolysis tests shorter than 1 h. Indeed, enzyme adsorption on the substrate and the change in reactivity of the substrate itself [7,12] can influence the reaction rate whenever the large conversion occurs over a short timescale. These phenomena can be monitored under the adopted procedure by proper analysis other than the measurement of glucose concentration in the liquid and by preliminary investigation above the aim of this work (e.g., characterization of enzyme adsorption on biomass surface). Kinetic parameters resulting from regression of data in Figure 2 through Equation (1) are reported in Table 2.

3.4. Effect of Product Inhibition on Kinetics

The effect of glucose inhibition on the kinetics of enzymatic hydrolysis of AP was assessed through long-term tests (72 h) according to the procedure described in Section 2.6. Figure 3 reports experimental data measured during enzymatic hydrolysis of AP pre-treated with NaOH, HCl, and laccases at different biomass loading. The long-term hydrolysis tests were carried out at a 5, 7.5, and 10% w/v biomass loading. According to the reported data, the maximum produced glucose concentration (about 20 g L−1) in the liquid was reached after 48 h when a 10% w/v biomass loading was used. Data regression according to Michaelis and Menten model and Chrastil’s model provided the kinetic parameters—Vmax, KM, Ki, k, and n—reported in Table 3. The agreement between the experimental data and the proposed models was satisfactory for all the pre-treated biomasses. With regard to the Michaelis and Menten model with product inhibition results showed how the biomass composition resulting from the delignification pre-treatment affected the maximum glucose production rate Vmax, KM, and Ki. The highest Vmax value was reported for the biomass pre-treated with 2% NaOH. This result is in agreement with the low residual lignin content observed in the AP after alkaline pre-treatment (see Table 1) and thus with the expected large fraction of cellulose available for the enzyme productive adsorption [5,10] in this kind of pre-treated AP sample. The highest KM value was measured after laccases pre-treatment, again as a likely effect of the large lignin content of AP after biological delignification. The type of pre-treatment, and thus the biomass lignin content, did not significantly affect the values of the inhibition parameter Ki. This result is reasonably related to the presence of a mixture of cellulase and β-glucosidase in the enzyme cocktail; indeed, the latter enzymes acts as a homogeneous biocatalyst and thus is not affected by the composition of the biomass. Regarding Chrastil’s model, similar observation rise form the comparison of assessed kinetic parameters and the composition of AP samples. The highest n value was reported for hydrolysis of biomass pre-treated with laccases and 2% HCl. An evident trend of the effect of lignin content on n parameter cannot be inferred from the data in Table 3. In any case, according to Chrastil’s model (see Section 2.7), the diffusion related resistance caused by the structure of the lignocellulosic substrate seems to me more pronounced for alkaline pre-treated AP samples. As expected, the value of k slightly increased as the AIL of the pre-treated biomass decreased, in accord with results reported by Pratto et al. [13] regarding another biomass typology. The comparison of statistic data suggested that Chrastil’s model provided the best fitting and it can be considered for further investigation aimed at bioreactor design. The present study confirms the dependence of the overall sugar production rate on the stirring rate and suggests the adoption of quantitative description of the hydrolysis dynamics under relevant operating conditions.
The assessed kinetic parameters were compared with the results reported in the literature (Table 4). To the best of our knowledge, the data comparison was limited to few studies of the overall hydrolysis rate of raw lignocellulosic biomass. Carvalho et al. [14] studied the enzymatic hydrolysis rate of sugarcane bagasse after a sequence of steam explosion and alkaline pre-treatment. Pratto et al. [4] investigated the enzymatic hydrolysis rate of sugarcane straw after a sequence of hydrothermal and alkaline (4% NaOH) pre-treatment. Data reported in the literature were compared with those assessed in the present paper related to alkaline pre-treatment of AP (Table 4). The n values reported for steam-exploded sugarcane bagasse is larger than those reported for the other two biomasses; moreover, the same n value has been assessed for two different substrates (sugarcane straw and AP) subjected to the same delignification pre-treatment (alkaline hydrolysis). These values of the n parameters seem to be in reasonable agreement with the structures of steam exploded and chemically pre-treated biomass. Indeed, structural modification after steam explosion can positively affect the limitation by diffusion of the heterogeneous enzymatic process [4,5]. The k values assessed in the present paper are remarkably larger than those reported by Carvalho et al. [14] and by Pratto et al. [4], and this result is related with the strong dependence of the maximum rate of hydrolysis on the biomass composition even if it is not related to the lignin content (similar residual lignin in Table 4 for all biomass types). Thus, the variation of k parameter can be due to the different biomass investigated and to the overall structural and composition variation after delignification pre-treatment of AP [18].

4. Conclusions

A procedure for the assessment of the overall kinetics of glucose production from apple pomace enzymatic hydrolysis catalysed by cellulase cocktails was applied using a commercial enzyme cocktail (Cellic®CTec2). The effect of mixing rate on the observed overall glucose production rate was confirmed for AP hydrolysis according to the results reported in the literature for other biomasses [4]. According to the reported results, faster kinetics were observed during hydrolysis of biomass characterized by a low lignin content. Since the residual lignin content was a result of the delignification pre-treatment (minimized after the alkaline pre-treatment), the effect of pre-treatment on the enzymatic hydrolysis rate (glucose production) was quantified by the assessed kinetic parameters. The analysis of the glucose production dynamics pointed out that both the adopted kinetic models provided a satisfactory description of the process. Chrastil’s model was the most effective and can be suggested for the rational design of enzymatic hydrolysis reactors supplemented with AP.
The present study is the starting point of a wider analysis aimed at the generation of quantitative tools based on the overall rate of enzymatic hydrolysis of real biomass. These data enable the design and the optimization of enzymatic hydrolysis reactors and their operating conditions depending on the different possible biomass compositions (sugars and lignin content) resulting after the pre-treatment step. Because the obtained results are in agreement with the results by Pratto et al. [13] and because of the different biomasses used by Pratto et al. [13] and in the present study (see Table 4), the adopted procedure can be successfully extended to several potential feedstock for lignocellulose saccharification (mainly agro-food wastes for second generation bio-based fuels and chemicals production).

Supplementary Materials

The following are available online at https://www.mdpi.com/1996-1073/13/5/1051/s1.

Author Contributions

Conceptualization, M.E.R. and A.P.; Methodology, M.E.R. and A.P.; Software, I.D.S.; Validation, M.E.R. and A.P.; Formal Analysis, M.E.R.; Investigation, A.P.; Resources, A.M. and M.E.R.; Data Curation, A.P.; Writing-Original Draft Preparation, M.E.R. and A.P.; Writing-Review & Editing, M.E.R. and A.M. Visualization, A.P.; Supervision, M.E.R. and A.M.; Project Administration, A.M. and M.E.R; Funding Acquisition, A.M. and M.E.R. All authors have read and agreed to the published version of the manuscript.

Funding

This research was funded by European Union’s Horizon 2020 research and innovation program by the project “Waste2Fuels Sustainable production of next generation biofuels from waste streams” grant number N°654623. Check carefully that the details given are accurate and use the standard spelling of funding agency names at https://search.crossref.org/funding, any errors may affect your future funding.

Acknowledgments

The authors thank Alessio Occhicone for his participation to parts of the experimental tests and data analysis.

Conflicts of Interest

The authors declare no conflict of interest. The funders had no role in the design of the study; in the collection, analyses, or interpretation of data; in the writing of the manuscript, and in the decision to publish the results.

References

  1. Parajuli, R.; Dalgaard, T.; Jørgensen, U.; Adamsen, A.P.; Trydeman Knudsen, M.; Birkved, M.; Gylling, M.; KofodSchjørring, J. Biorefining in the prevailing energy and materials crisis: A review of sustainable pathways for biorefinery value chains and sustainability assessment methodologies. Renew. Sustain. Energy Rev. 2015, 43, 244–263. [Google Scholar] [CrossRef] [Green Version]
  2. Arora, A.; Banerjee, J.; Vijayaraghavan , R.; Mac Farlane, D.; Patti, A.F. Process design and techno-economic analysis of an integrated mango processing waste biorefinery. Ind. Crops Prod. 2018, 116, 24–34. [Google Scholar] [CrossRef]
  3. Zhang, L.; Freitas dos Santos, A.C.; Ximenes, E.; Ladisch, M. Proteins at heterogeneous (lignocellulose) interfaces. Curr. Opin. Chem. Eng. 2017, 18, 45–54. [Google Scholar] [CrossRef]
  4. Pratto, B.; Alencar de Souza, R.B.; Sousa, R., Jr.; Gonçalves da Cruz, A.J. Enzymatic Hydrolysis of Pretreated Sugarcane Straw: Kinetic Study and Semi-Mechanistic Modeling. Appl. Biochem. Biotechnol. 2016, 178, 1430–1444. [Google Scholar] [CrossRef] [PubMed]
  5. Mohammad, B.T.; Al-Shannag, M.; Alnaief, M.; Singh, L.; Singsaas, E.; Alkasrawi, M. Production of multiple biofuels from Whole Camelina Material: A renewable energy crop. BioResources 2019, 13, 4870–4883. [Google Scholar]
  6. Tan, U.L.; Yu, E.K.C.; Campbell, N.; Saddler, J.N. Column cellulose hydrolysis reactor: An efficient cellulose hydrolysis reactor with continuous cellulase recycling. Appl. Microbiol. Biotechnol. 1986, 25, 250–255. [Google Scholar] [CrossRef]
  7. Gusakov, A.; Sinitsyn, A.P.; Klyosov, A.A. A Theoretical Comparison of the Reactors for the Enzymatic Hydrolysis of Cellulose. Biotechnol. Bioeng. 1987, 29, 898–900. [Google Scholar] [CrossRef] [PubMed]
  8. Xue, Y.; Jameel, H.; Phillips, R.; Chang, H. Split addition of enzymes in enzymatic hydrolysis at high solids concentration to increase sugar concentration for bioethanol production. J. Ind. Eng. Chem. 2012, 18, 707–714. [Google Scholar] [CrossRef]
  9. González Quiroga, A.; Bula Silvera, A.; Vasquez Padilla, R.; da Costa, A.C.; Maciel Filho, A.C. Continuous and semicontinuous reaction systems for high-solids enzymatic hydrolysis of lignocellulosic. Braz. J. Chem. Eng. 2015, 32, 805–819. [Google Scholar] [CrossRef] [Green Version]
  10. Zhang, X.; Yuan, Q.; Cheng, G. Deconstruction of corncob by steam explosion pretreatment: Correlations between sugar conversion and recalcitrant structures. Carbohydr. Polym. 2017, 156, 351–356. [Google Scholar] [CrossRef] [PubMed]
  11. Jeoh, T.; Cardona, J.M.; Karuna, N.; Mudinoor, A.R.; Nill, J. Mechanistic Kinetic Models of Enzymatic Cellulose Hydrolysis—A Review. Biotechnol. Bioeng. 2017, 114, 7. [Google Scholar] [CrossRef] [PubMed]
  12. Bansal, P.; Hall, M.; Realff, M.J.; Lee, J.H.; Bommarius, A.S. Modelling cellulase kinetics on lignocellulosic substrates. Biotechnol. Adv. 2009, 27, 833–848. [Google Scholar] [CrossRef] [PubMed]
  13. Carrillo, F.; Lis, M.J.; Colom, X.; López-Mesas, M.; Valldeperas, J. Effect of alkali pretreatment on cellulose hydrolysis of wheat straw: Kinetic study. Proc. Biochem. 2005, 40, 3360–3364. [Google Scholar] [CrossRef]
  14. Carvalho, M.L.; Sousa, R., Jr.; Rodríguez-Zúñiga, U.F.; Suarez, C.A.G.; Rodrigues, D.S.; Giordano, R.C.; Giordano, R.L.C. Kinetic study of the enzymatic hydrolysis of sugarcane bagasse. Braz. J. Chem. Eng. 2005, 30, 437–447. [Google Scholar] [CrossRef] [Green Version]
  15. Procentese, A.; Raganati, F.; Olivieri, G.; Russo, M.E.; Rehmann LMarzocchella, A. Deep eutectic solvents pretreatment of agro industrial food waste. Biotech. Biofuels 2018, 11, 37. [Google Scholar] [CrossRef] [PubMed]
  16. Adney, B.; Baker, J. Measurement of Cellulase Activities; Report No.: NREL/TP-510-42628; National Renewable Energy Laboratory: Denver, CO, USA, 2008. [Google Scholar]
  17. Sluiter, A.; Hames, B.; Ruiz, R.; Scarlata, C.; Sluiter, J.; Templeton, D.; Crocker, D. Determination of Structural Carbohydrates and Lignin in Biomass; Report No.: NREL/TP-510-42618; National Renewable Energy Laboratory: Denver, CO, USA, July 2011. [Google Scholar]
  18. Chrastil, J. Enzymic product formation curves with the normal or diffusion limited reaction mechanism and in the presence of substrate receptors. Int. J. Biochem. 1988, 20, 683–693. [Google Scholar] [CrossRef]
  19. Kumar, P.; Barrett, D.M.; Delwiche, M.J.; Stroeve, P. Methods for pretreatment of lignocellulosic biomass for efficient hydrolysis and biofuel production. Ind. Eng. Chem. Res. 2009, 48, 3713–3729. [Google Scholar] [CrossRef]
  20. Niglio, S.; Procentese, A.; Russo, M.E.; Piscitelli, A.; Marzocchella, A. Integrated enzymatic pretreatment and hydrolysis of apple pomace in a bubble column bioreactor. Biochem. Eng. J. 2019, 150, 107306. [Google Scholar] [CrossRef]
  21. Procentese, A.; Raganati, F.; Olivieri, G.; Russo, M.E.; Marzocchella, A. Pre-treatment and enzymatic hydrolysis of lettuce residues as feedstock for bio-butanol production. Biomass. Bioenergy 2017, 96, 172–179. [Google Scholar] [CrossRef]
Figure 1. Initial glucose production rates V for pre-treated AP vs. the mixing speed. Enzymatic hydrolysis conditions: solid loading 10% w/v, Cellic®CTec2 concentration 1.2 g L−1, 5 FPU gcellulose−1, 50 °C, pH 4.8, and a hydrolysis time of 1 h.
Energies 13 01051 g001
Figure 2. Initial glucose production rate V vs. substrate concentration S for AP pre-treated with 2% NaOH, 2% HCl, and 166 U/mL laccase. Enzymatic hydrolysis conditions: Cellic®CTec2 activity 290 FPU Lsolution−1, 50 °C, pH 4.8, and a hydrolysis time of 1 h. Optimized mixing rate was fixed for each AP sample. Lines are the plot of Equation (1) with parameters reported in Table 2.
Energies 13 01051 g002
Figure 3. Time resolved concentration of glucose in the liquid phase during enzymatic hydrolysis of the AP at different biomass loading after pre-treatment in 2% NaOH (A,D), 2% HCl (B,E), and 166 U mL−1 laccases (C,F). Operating conditions: enzyme concentration set at 828 FPU L−1; optimized mixing rate. Lines mark regression of the experimental data with the Michaelis and Menten with product inhibition model (A,B,C) and Chrastil’s model (D,E,F).
Energies 13 01051 g003
Table 1. Characterization of raw and pre-treated apple pomace (AP) in terms of polysaccharides and lignin content (Acid Insoluble Lignin—AIL, Acid Soluble Lignin—ASL).
Pre-TreatmentRecovery (%)Composition (%)
GlucansXylans and ArabinansAILASL
Raw10021.2 ± 0.0114.75 ± 0.0316.5 ± 0.552.1 ± 0.34
NaOH6028.0 ± 0.010.8 ± 0.055.0 ± 0.53n.d
HCL5025.0 ± 0.010.2 ± 0.069.0 ± 0.43n.d
Laccases7522.5 ± 0.0112.04 ± 0.0314.5 ± 0.54n.d
Table 2. Kinetic parameters of the pseudo-homogeneous Michaelis and Menten model (Equation (1)) for AP hydrolysis catalysed by Cellic®CTec2.
Pre-TreatmentGlucans (%)Michaelis and Menten Model
KM (g L−1)VMax (g L−1 min−1)
NaOH28.05.5 ± 0.60.108 ± 0.003
HCl25.04.8 ± 0.60.084 ± 0.003
Laccase22.59.0 ± 2.10.067 ± 0.006
Table 3. Kinetic parameters for Michaelis and Menten with product inhibition and Chrastil’s model for enzymatic hydrolysis of AP pre-treated with alkaline (NaOH), acid (HCl), and enzymatic (laccase) delignification processes.
Biomass Pre-TreatmentGlucans (%)Lignin (%)M&M with Product InhibitionChrastil’s Model
Vmax (g L−1 min−1)KM (g L−1)Ki (g L−1)k (L g−1 min−1)n (-)
NaOH28.05.00.305.50.16 ± 0.022·10−3 ± 1.2·10−40.41 ± 0.02
HCl25.59.00.244.80.20 ± 0.031.8·10−3 ± 1.2·10−40.63 ± 0.03
Laccase22.514.50.199.00.31 ± 0.031.1·10−3 ± 8·10−50.58 ± 0.03
Table 4. Kinetic parameters for Chrastil’s model reported in the literature for enzymatic hydrolysis of real lignocellulosic biomass.
BiomassPre-TreatmentsResidual Lignin (%)Chrastil’s ModelReferences
k (L g1 min1)n (-)
Sugarcane Bagasse121 °C 30 min in 4% NaOH + Steam explosion5.42·10−50.6[12]
Sugarcane Straw195 °C 10min + 121 °C 30 min in 4% NaOH5.7Between 3.52·105 and 7.4 1050.4[13]
Apple Pomace121 °C 30 min in 2% NaOH5.02·1030.4Present work

