Abstract
Solar thermal power is nowadays one of the trendiest topics in the construction industry, and it represents a valuable energy source of heating that reduces energy consumption. As solar panels produce heating during the day and consumers demand calefaction during the whole day, we use standby tanks (for domestic hot water) and buffer tanks (for heating) for storage. The latest developments improved the efficiency and useful life while reducing the volume of tanks. So, the presented research work deals with analyzing the solar thermal power in a family house. This work presents a method to create a decision support system to compare solar energy systems in houses from economical, technical, availability, and environmental concerns. The weights of the criteria selected considering the analytical hierarchy process are computed. Parameters required for energy production calculations (location, temperature, etc.) and energy consumption (inhabitants, outdoor temperature, etc.) are summarized. It can be stated that a universal best solar thermal scheme does not exist, as energy consumption depends on the other features and limits as well as energy production, geographical latitude of the location, and so forth. According to results, Case 3 (a gas boiler and a combination tank) is the best alternative for reducing the energy required, CO2 emitted, the best energy efficiency of the installation, and the lowest transmission losses. In other scenarios when the economic criteria are not so relevant, this should be the best case in the prioritization scheme.
1. Introduction
One of the greatest challenges in the 21st century is the continuous deterioration of the environment, characterized by climate change and other interdependent consequences assisted by policies in favor of fossil fuels [1]. As the world population increases in the coming decades, the International Energy Agency predicted global energy demand will extend by 30% between 2016 and 2040 [2].
The main source of inexhaustible energy is the sun, and its potential is 6500 TW [3]. Irradiance has huge potential (e.g., 1500 kWh/m2 year on a horizontal plane in Africa [4]) to fulfill the world’s energy demands [5], while humans can have an available technology for collecting and withdrawing the sun’s energy. Many countries have established policies to encourage users to consume renewable electricity. Policies include tariff privileges (cost credit for using renewable energy [6,7]), allocation rules (they should produce a specific rate of energy from sustainable sources [8,9]), pensions (gives economic support for sustainable energy management or energy efficient technology use [10]), feed-in costs (gives monetary help for the purchaser), relationship of research institutes (gives research fellowships), planned implementation, measure, and/or inexhaustible power laws [11].
At present, the European Commission has determined to reduce emissions by 2050 as one of its fundamental objectives. They have developed economic and social transition strategies [12]. The European Union (EU) is working on “Pathways for the transition to a net-zero greenhouse gas emissions economy and strategic priorities”, and a subsection of this general line is “Maximize the deployment of renewables and electricity to fully decarbonize Europe’s energy supply”, underlining the European dependency on oil and gas, which in 2018 was 55% of the energy need. The EU aims to reduce 20% of the entire energy need by 2050. The Spanish plan of greenhouse gas (GHG) emissions, 10% reduction by 2020 compared to 2005, means conserving energy and emissions (as many as current consumption). According to the EU [13], they expect that in 2020 Spain will meet the objectives, but not in 2030. So, we must make the first efforts to meet emission reduction targets. Energy production through renewable sources is equal to 20% [13]. Spanish legislation on building construction imposes to cover 30–70% (depending on the zone in Spain) of energy demand with solar thermal energy [14].
Solar water heaters are a convenient substitute to produce hot water for space heating and domestic hot water (DHW) supply [15,16], as solar thermal collectors can diminish the use of non-inexhaustible energy and can provide hot water at temperatures fluctuating from 40 to 80 °C. The leading states in solar water heater capacity (cumulated water collector) in 2019 were China, the United States, Turkey, and Germany (334.52, 17.76, 16.28 and 13.74 MW2 respectively) [17]. Heating is a very efficient use of solar thermal power, which could help to reduce fossil fuel consumption and minimize global carbon emissions for environmental, economic, and social reasons [18].
Since exploring the warming and refrigerating loads at the construction design stage can lower energy consumption in families, researchers are handling more concerns on optimizing building envelopes, windows [19], outline dimensions, direction, rubbing area, and thermophysical properties of structure elements [15]. Solar irradiance received by a building depends on its orientation and glazing area [20], acknowledging that buildings with great energy efficiency are oriented to capture irradiance from a variety of directions [15].
Researchers developed simulation models for building integrated solar thermal elements [21,22] and for multiskin facades [23,24], but they are difficult to compare because authors did not present some information (the boundary conditions, fluid inlet temperature, the usage pattern) that affects the solar thermal performance [25]. The major troubles in solar thermal systems are overheating and stagnation. Overheating occurs when the solar energy absorbed by a solar collector exceeds the capability of its heat transfer fluid circuit to cool it (the temperature of a thermal fluid during sluggishness can reach up to 180 °C) [26]. Practitioners do not equip standard dwellings with meters to give the flow and temperature for energy-balance calculations, so the data are not available in most cases. Water meters register total water consumption in residences, but it does not discriminate between hot and cold-water utilization. A survey on the energy expenditure in households shows that the energy savings are moderate because of diverse active or passive energy-saving technologies [27].
Green houses refer to architecture that is environmentally efficient and resource efficient [28,29,30]. New approaches have determined that self-utilization systems are viable, but they associate economics to systems design. Several factors (such as load profile, solar production analysis, and the designs of the support schemes) influence the feasibility of self-expenditure. In the USA, some works investigated the large-scale implementation of solar water heating techniques on their utility [31], which led to reduction of energy demands, energy expenditure, and carbon emissions.
This work proposes a method to determine which design scheme is better for a building in which a solar thermal panel for space heating and (Domestic Hot Water are incorporated [32,33], something that has been performed in industries [34] and offices buildings [35], or focusing on the thermal energy performance of cool louvers of shutters [36], ventilated double skin façades with venetian blinds [37], or on the new materials and technologies that can improve the thermal comfort in buildings [38]. We calculate energy and emissions savings comparing every scenario with the zero-case where only a gas boiler and a tank are used for domestic hot water and for floor/radiator heating (this zero-case does not consider renewable energies). In every scenario, we use the simulation software “T*SOL” (Valentin Software GmbH, 10243 Berlin, Germany) [39] to calculate the efficiency of solar thermal equipment. T*SOL software returns the energy delivered to collectors, the solar contribution to heating and DHW, and the energy from auxiliary heating for every alternative. We prioritize alternatives considering multiple criteria (energy savings, economic availability, technical availability, and environmental standpoints) to find which solar energy installation in buildings is the best alternative in this decision support model to help decision-makers understand the trade-offs among alternatives.
We calculate the cost of alternatives (costs of Solar thermal panels, gas boilers, and water tanks) and compute the economic savings after this investment. From the economic perspective, we calculate the payback period to prioritize the solar installation schemes. As the software presents auxiliary gas consumption, we incorporate these data as environmental results for every alternative. Availability criteria consider that technological obsolescence involves higher transmission losses (from the ST systems, tanks, etc.).
To assess the weights of these criteria, we adopt the analytical hierarchy process (AHP), a robust management science tool that is helpful in structuring complex multiperson, multicriteria decisions [40,41]. AHP is a measurement (scoring) model that relies on personal managerial views on different criteria, applied in sustainable energy-related questions [42,43,44]. We established the AHP model with precise benchmarks and metrics and converted these inputs into scores that were used to test each of the choices. AHP and the analytical network process were presented in [45,46], and we calculated the AHP procedure with a software developed in Microsoft Excel based on Macro (VBA- Visual Basic for Applications programming) [47].
This software generates pair-wise matrixes (based on the criteria and based on the options) and it prioritizes a set of options from most to least acceptable (it offers a general score, where the best alternative has the greatest value). It determines the relative merit of members of a set of alternatives and calculates the inconsistency ratio for each criterion and for the total problem. We present here a real case study allocated in a house (four inhabitants) in Murcia (Spain). In this context, we propose four schemes with five solar panels and other differences that intend to represent the most common installation alternatives. We perform a sensitivity analysis to see how these cases work with daily water demand variations.
We organize the work as follows. Section 2.1 shows the simulation of the thermal equipment efficiency, and the economic prioritization, availability, and technical and environmental results are depicted in Section 2.2, Section 2.3, Section 2.4, and Section 2.5 respectively. The AHP is presented in Section 2.6, and the process developed is shown in Section 2.7. A real case study in Spain is presented in Section 2.8. Section 3 shows the step-by-step results, and Section 3.6 discusses them. We present the key conclusions in Section 4.
2. Materials and Methods
2.1. Simulation of the Solar Thermal Equipment Efficiency
In this section, we provide input data, software characteristics, and output results for the solar thermal equipment efficiency calculations.
2.1.1. Input data for the Simulation
The T*SOL 2018 program generates results based on building and solar thermal panel input data. The input data required for the building are location, latitude, heat load (kW), heated usable area (m2), indoor temperature (°C), mean outside temperature (°C), and lowest outside temperature (°C). On the other hand, the input data for the solar thermal panel are type, description, gross surface (m2), active solar surface (m2), gross collector area (m2), active collector area (m2), orientation, inclination (degrees), and azimuth angles (degrees), as in Figure 1.
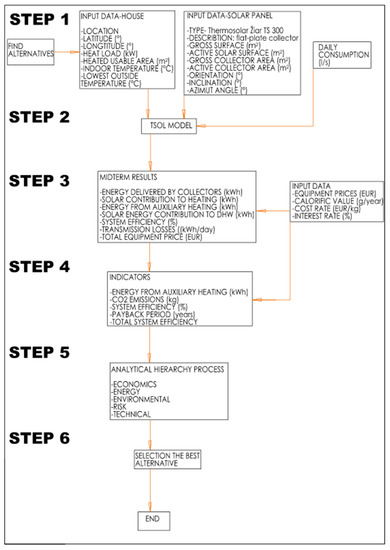
Figure 1.
Flowchart.
Researchers and practitioners should choose which installation is convenient for residential buildings. So, installation is the input data in the software. Rooftop and ground-mounted systems (among other alternatives) are the most popular types of residential solar plants, but in our approach, we chose rooftop solar panels. Anywhere the sun reaches is a spot for panel installation, and we can outfit other structures besides a house roof with panels. We used a flat-plate installation solar collector, which gives flexibility for orienting the solar panels for ideal energy collection. Rooftop installation takes no extra square footage of a property. These installations work at a temperature below 100 °C, and it can provide a thermal energy of 4 kWh per day.
2.1.2. T*SOL Software
T*SOL is a program for designing and simulating solar thermal systems with hot water supply and space heating. This software (released in 1993) can simulate solar thermal systems for different houses, including system presentation of respective solar thermal systems and revenue and profitability forecasts. The installation types available cover approximately 80% of the applications for such facilities in Europe and the USA. Using a variant comparison, the program analyzes the influence of individual system components on the performance of a solar thermal system. Variant analysis also provides global radiation, domestic hot water, heating, collector circuit, build in storage, auxiliary heating, and simulation results.
The simulation results show the system performance in different environmental conditions, such as the building’s climate zone, the amount of heat loss of an object, heating types, or hot water system. Based on the simulation in the program, we made a detailed comparison between the variants and their values.
2.1.3. Output Data for the Simulation
T*SOL ® software returns the following results:
- Energy delivered by collectors (kWh);
- Solar energy contribution to DHW (kWh);
- Solar contribution to heating (kWh);
- Energy from auxiliary heating (kWh);
- System efficiency (%)—efficiency is calculated by dividing the useful energy by the energy available. In the case of solar collector, the energy available is the solar radiation that arrives at the surface aperture collector. The useful energy is the net thermal energy embodied in the hot fluid (liquid coolant) leaving the collector outlet pipe;
- Some other results not considered in our approach, such as installed collector power (kW), installed solar surface area (gross) (m2), irradiation on collector surface (active) (kWh), and so on.
2.2. Economic Prioritization of the Alternatives
This section considers the alternatives of implementing total prices of solar thermal systems. Certain equipment needed to be purchased: solar panels, pre-heating tanks, buffer tanks for heating, standby tanks for DHW, dual coil indirect water combination tanks for DHW and heating, gas boiler, and collector loop heat exchanger. Meanwhile, we reduced the heat expenditure and expected financial savings (as owners must pay for lower energy consumption on a monthly basis, reimbursed periodically).
If we prefer to permit a reasonable analogy, every cost of options should be expressed in monetary units in handling the equivalent continuous discount rate, r [48]. Value “r” is the rate of profit that could be picked up per unit of time for an opportunity cost (investment with similar risk).
The objective function to maximize (which balances expenditures and future revenues) from the present time (tp) to time t is the net present value (NPV- net present value) (Equation (1)):
where “I0” is the investment (€) performed in year zero (the costs of the panels, tanks, etc.) and “S0” is the monthly economic savings (€/month) obtained after changing the current type of installation to solar thermal panels. We calculated gas costs and the calorific value for the current installation and for the new alternative analyzed. The difference between these represents the gas savings. We calculated yearly costs with the gas cost rate (€/Kg). Equating the derivative of Equation 1 to zero, we calculate the payback period of the investment as (Equation (2))
where Ti (years) is the payback period, the indicator we want to minimize as lower values involve higher energy savings and, thus, higher revenues per monetary unit invested to buy equipment. This is the first criterion when prioritizing the alternatives in this optimization problem shown here.
2.3. Availability
This parameter (availability) highlights that higher heat losses in the installation scheme involve higher probabilities of failure and lower availability of the scheme. We calculated yearly transmission losses in every alternative (from the daily transmission losses in the software), and this value was the key indicator for our approach. As minor values involve better installation, we are promoting installation schemes with lower energy losses.
2.4. Technical
Technical availability is useful in overall equipment effectiveness because it can determine how well maintenance is working. Successful availability involves many actuators to share responsibility and incentivize great operating times. The energy produced by each installation (kWh produced) shows the working time of the machinery, but because of the periodic character of usable solar insolation, the heat generated when linked to the forecast efficiency does not correspond 100% to the machinery being capable to produce its predetermined function. The precise energy and peak power characterize energy storage technologies [49], and technological obsolescence influences them. Energy consumption follows typical patterns with an enormous change over the course of the day, which emerges from consumption styles, social tendencies, budgets and restraints.
In T*SOL 2018 we simulated data for system efficiency calculations, incorporating the collector loop efficiency and quotient of the available energy generated by the solar thermal system and the energy irradiated onto the collector (active solar surface). This is a benchmark for the system’s efficiency. The system efficiency also depends on the weather conditions, inclination towards the roof, directional orientation, and some other parameters not considered here.
2.5. Environmental Concerns
We calculated CO2 emissions for every alternative, as gas boilers need auxiliary energy to provide heating (solar contribution to heating requires more energy). The indicators for the environmental results of the installation are the CO2 emissions, which were obtained from the auxiliary energy heating for every alternative. The lowest emissions resulted in the best environmental indicator.
We considered the CO2 emissions from fossil fuels consumed jointly for heat and power. The standard values of CO2 per kWh emitted by every energy source are natural gas, 554 g/kWh; oil fired, 865 g/kWh; coal fired, 1432 g/kWh; and others (nuclear and renewable sources), 0 g/kWh [50]. According to each country’s energy mix, we can calculate the emissions savings.
2.6. Analytical Hierarchy Process
We calculated the weights attached to each criterion (energy, economics, availability, technical, and environmental). The AHP method is a decision-making tool that can be used to solve complex decision problems. After a decision, which incorporates the most and the least important criteria, each case is ranked into each criterion. The next step is to design a priority value for each criterion. After all, the software uses a pairing (matching) method. Table 1 shows an example of how AHP works. If we consider the selection the best criterion for the three cases, we can say the most important criterion is economics and has a priority of 8. Suppose that case A is much better than case B, and system C is at least desired as far as the economics criterion is concerned. Thus, in the corresponding comparison, the following is the judgement matrix when the three cases are investigated in terms of this criterion. After calculations, the numbers are normalized by dividing them with their sum.

Table 1.
AHP calculation example.
We tested the most preferred by positioning the alternative pairwise on each criterion adopting a scale division from 1 to 9 (1 being the lowest and 9 the highest priority). In determining the influence matrices in AHP, the greatest impact was in terms of economics and stemmed from a simple matter: purchasing life. The strategy for analysis of advantages revealed that another less decisive criterion is energy and environmental pairwise. We show the pairwise matrixes used in this method in Appendix A. The values shown there were selected for this approach, but if practitioners’ criteria are different, they can use other values.
We assigned the priorities and weights for the criteria as follows: economics (54%), energy (17%), environmental (10%), availability (10%), and technical (9%). We show the weighted point procedure in Table 2.
Table 2.
Pairwise comparison of criteria.
The overall arrangements throughout the rank should sum to one. After completing the preferences of each criterion, we can recognize the comprehensive objective of selecting the best solar panel option. The comprehensive economic arrangements of the panels showed that financial issues had the greatest preference in AHP. The environmental issue was one of the leading panels towards the overall goal, and that is why in this case it was the third best category.
2.7. Process for Selecting the Best Alternative
This flowchart (Figure 1) shows the procedure developed to find out which alternative was the best considering all aspects.
- Step 1: We recovered input data from the specific house and solar panels. These data were fully described in Section 2.1.1. Moreover, the cases to be considered were also defined here as information for the T*SOL calculations, and domestic hot water consumption (l/s) should be also considered.
- Step 2: This step involved modelling the alternatives in T*SOL 2018 software. From the previous step we get the input for the simulation software and set an average daily consumption.
- Step 3: After simulations of selected solar installations we got the midterm results for energy and solar thermal system efficiencies such as energy from solar, energy from auxiliary heating, and so forth.
- Step 4: In this part we analyzed simulation results for economic, environmental, energy, technical, and availability and transferred them to appropriate values for AHP. We calculated the payback period and CO2 emitted to the atmosphere.
- Step 5: This step summarized the final rating from AHP in all criteria and selected the best alternative based on the final score percentage.
- Step 6: This final stage involved choosing the highest score alternative.
2.8. Case Study
The case study was placed in Murcia (Spain). Murcia experiences a semiarid, warm climate classified as a BSh type by the Köppen–Geiger classification. This dry Mediterranean climate includes warm winters and humid summers, and temperatures fluctuate from 16 to 4 °C in January and 34 to 21 °C in August. Four cases were studied to identify what the best option was considering the environmental, technical, availability, and environmental criteria (Figure 2). For every case, DHW daily consumption was equal to 120 liters per day.
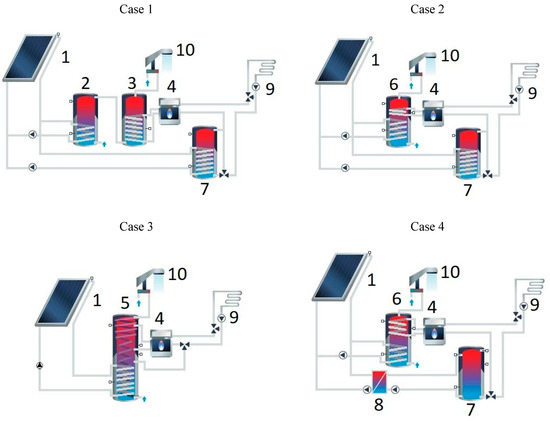
Figure 2.
Cases 1, 2, 3, and 4. Numbers represent the following: 1—solar collector Thermosolar Žiar TS 300; 2—solar preheating tank, 200 liters; 3—DHW(Domestic hot water) standby tank, 120 liters; 4—gas boiler, 15 kW; 5—combination tank, 1000 liters; 6—dual coil indirect water tank, 300 liters; 7—space-heating buffer tank, 500 liters; 8—heat exchanger; 9—floor heating; 10—DHW consumption.
These were the key differences:
- Case 0 does not contain any renewable resources in the heating system, it only has a gas-fired boiler with 15 kW performance.
- Case 1 has a 200 liter preheating tank, one tank for DHW with 120 liters, a space-heating buffer tank of 500 liters, and a gas-fired boiler with 15 kW performance and floor heating.
- Case 2 has a gas-fired boiler with 15 kW performance, a dual coil indirect water tank of 300 liters, and a 500 liter tank for floor heating.
- Case 3 contains a 1000 liter tank for DHW and floor heating and a gas-fired boiler with 15 kW performance.
- Case 4 incorporates one tank for DHW with 300 liters, a gas-fired boiler with 15 kW performance, and a 500 liter tank for floor heating and a heat exchanger.
The results of investments and payback periods depend on the equivalent capital continuous discount rate [51,52], which is considered at r = 0.02 = 2%. The energy cost of natural gas (which we assume we burn 228 g to obtain 1 kWh [53]) for all alternatives is 1.32 €/kg.
The economic input data were obtained from the T*SOL software units [39] and are summarized as follows:
- Five solar collectors = 2128.8 € (this cost applies to the four cases), type Thermosolar Žiar TS 300 flat plate collector, gross surface 2.03 m2, active solar surface 1.78 m2, gross collector area 10.15 m2, active collector area 8.9 m2, orientation 180°, inclination 45°, and azimuth angles 0°;
- Gas boiler = 1169 € (every case), nominal output 15kW;
- Solar preheating tank 200 liters = 401.41 € (Case 1), volume 200 liters, height 1.8 m, insulation thickness 100 mm, effective thermal conductivity 0.065 W/(mK), and losses 2.31 kWh/day;
- Buffer tank 500 liters = 906 € (Cases 1 and 2), volume 500 liters, height 2.93m, insulation thickness 45 mm, effective thermal conductivity 0.03 W/(mK), and losses 3.46 kWh/day;
- DHW standby tank 120 liters = 376 € (Cases 1 and 4), volume 120 liters, height 1.8 m, insulation thickness 100 mm, effective thermal conductivity 0.065 W/(mK), and losses 1.95 kWh/day;
- Dual coil indirect water tank 300 liters = 1944.76 € (Cases 2 and 4), volume 300 liters, height 1.8 m, insulation thickness 100 mm, effective thermal conductivity 0.065 W/(mK), and losses 3.23 kWh/day;
- Collector loop heat exchanger = 100 € (Case 2), maximum heat transfer rate 4.45 kW;
- Combination tank = 3956.09 € (Case 3), volume 1000 liters, height 2 m, insulation thickness 100 mm, effective thermal conductivity 0.065 W/(mK), and losses 4.75 kWh/day.
3. Results and Discussion
3.1. Energy Results for Every Type of Installation
We simulated the cases presented in T*SOL software and obtained the following yearly results. The energy delivered by collectors was similar for Cases 1, 2, and 3 (6400 kWh), but Case 4 provided only 6100 kWh a year. Table 3 describes that the most solar contribution to heating was in Case 3 (1991.14 kWh). Based on the results, energy from auxiliary heating required was similar (3200–3400 kWh) for Cases 1, 2, and 4. According to the simulations for solar energy contributions to DHW, we obtained the best value in Case 3, 2485.72 kWh/year, and the worst figures in Case 4, 1896.96 kWh/year.
Table 3.
Yearly results from energy simulations for all cases.
3.2. Payback Period Calculation
We calculated investments for every case, and these values are shown in Table 4. In order to easily identify each equipment in Figure 2, we indicated the numbers. Based on the calculations of how much each alternative cost, we found that the cheapest was Case 1 (4981.2 €) and the most expensive was Case 3 (7253.83 €).
Table 4.
Equipment investment for alternatives.
The values of energy required for auxiliary heating represent boiler consumption, expressed in kilowatt-hours a year. Based on the yearly simulations in T*SOL (Table 5), these values ranged between 2700 and 3400 for the four cases with solar thermal panels. Case 0 (which involved no investment in solar thermal systems) provided the greatest energy from auxiliary heating (6163.8 kWh/year), as this case did not have any solar power in the supply and all energy came only from the gas boiler. To estimate the money invested in supplying more energy from heating (the key variations in Cases 1, 2, 3, and 4 versus Case 0 or the do-nothing case), we consumed 228 g of natural gas to get 1 kWh, and each kg of CO2 cost 1.32 €. In short, we calculated the cost of providing this extra heat required by our family house (Table 5).
Table 5.
Maintenance costs and economic savings for every case.
Finally, we calculated energy cost for the cases, where Case 3 (837.37 €) and Case 1 (1019.89 €) were the lowest and highest gas consumption, respectively. We obtained the monthly savings by comparing the monthly cost of the zero-case with every alternative monthly cost (i.e., Case 1 = 154.59 − 84.99 = 69.6 €/month saved by using solar thermal panels).
We can calculate payback periods (Equation 2) for different “r” values from 0.01–0.04 (Table 6). These results showed the best was Case 1 according to this criterion because it had the lowest payback period.
Table 6.
Payback period for every alternative with different equivalent continuous discount rates.
3.3. Availability and Technical Indicators
In this case we used daily transmission loses from energy simulations in every case as the indicator for availability. For instance, we calculated transmission losses in Case 1 as losses from solar pre-heating tank (2.31kWh/day), from DHW standby tank (1.95 kWh/day), and from space heating buffer tank (3.46 kWh/day). These numbers resulted in 7.71 kWh/day (2814 kWh/year). Availability values for all alternatives are shown in Table 7. The indicator used for the total system efficiency was directly obtained as a result in T*SOL software and depicted in Table 7.
Table 7.
Availability values and system efficiency for all cases.
3.4. Environmental Calculation
We calculated CO2 emissions (tons) in the gas boiler (Table 8), and Case 3 had the lowest emissions. The energy mix in Spain for 2017 was oil fired, 31.8%; natural gas, 13.5%; coal fired 21.0%; and nuclear and renewables 33.7% [54], which results in the emissions showed in Table 7.
Table 8.
CO2 emissions for every case.
3.5. Influence of DHW Variation on the system
We calculated the influence of DHW consumption for the four cases varying this parameter between 100–150 liters per day. We simulated the cases again using T*SOL software. The results were not surprising: we found that the energy delivered by the solar collector rose (Figure 3) and the solar contribution to heating decreased as the daily consumption increased (Figure 4). In short, more energy was delivered to DHW than to space heating.
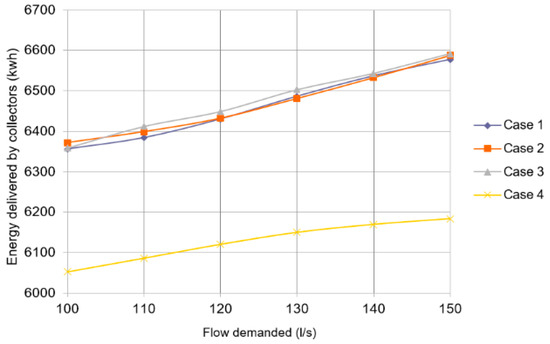
Figure 3.
Energy delivered by solar collectors in 100–150 l/s in Cases 1–4.
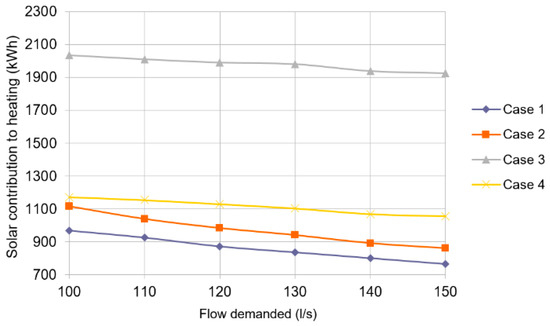
Figure 4.
Solar contribution to heating in Cases 1–4.
The auxiliary heating energy required in every case is shown in Figure 5. As expected, the higher the hot water consumption, the higher the energy required from auxiliary heating.
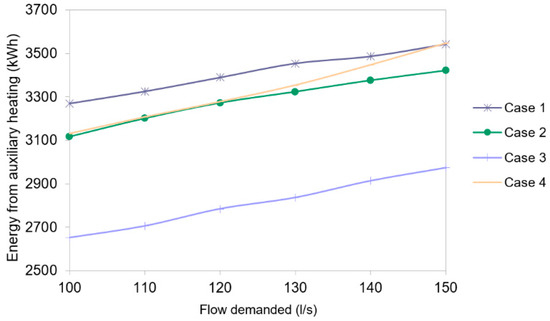
Figure 5.
Energy from auxiliary heating in Cases 1–4.
3.6. Discussion
For clarification, we summarized the essential aspects of the method proposed and the case study developed. Although using renewable energies is more convenient from environmental and economic standpoints, practitioners and researchers should select the installation scheme preferred according to economic, energetic, availability, environmental, and technical perspectives. The data required to carry out the calculations were described before (Section 2.1.1 and Figure 1). The practical problem deals with the procedure for performing these calculations, and this is the task resolved by the method presented here.
We should remark that we have described here the whole method, and maybe the result is not as important as the method itself. In our case study, the weight of the economic criteria was very high in comparison to the other criteria weights.
This case study aims to illustrate a building in the Murcia region, and we propose the following cases (also in Figure 2):
- Case 0— (non-renewable energy).
- Case 1—thermal supply through ST (renewable energy), a gas boiler, a solar preheating tank, a buffer tank, and DHW tank;
- Case 2—thermal supply through ST (renewable energy), a gas boiler, a buffer tank a dual coil indirect water tank, and a collector loop heat exchanger;
- Case 3—thermal supply through ST (renewable energy), a gas boiler, and a combination tank;
- Case 4—thermal supply through ST (renewable energy), a gas boiler, a dual coil indirect water tank, and DHW tank and a heat exchanger.
To discover which alternative was the overall best in this case study, we created an analytical hierarchy process (AHP). Before the AHP, we needed to make a completed table for all alternatives based on all criteria (Table 9). With these data, we calculated the total score based on the weights for every criterion, and the prioritization is depicted in Table 9.
Table 9.
Values for criteria, weights, and total scores for the cases.
We highlight that energy consumption from auxiliary heating in the four cases varied between 54.97% (Case 1) and 45.16% (Case 3) regarding energy consumption in Case 0. Energy savings were at least 45%, as suggested by [55,56]. Moreover, payback periods obtained were close to 6.5, which is an order of magnitude shown in many manuscripts [57], and these values can be reduced if subsidized tariff rates apply [58].
According to the five criteria shown herein, Case 3 was the best alternative regarding the energy, environmental, availability, and technical criteria, and Case 1 was the best solution regarding the economic criteria. Case 1 was the best alternative with the criteria selected, which contained a space heating buffer tank with 500-liter volume, a gas boiler, a solar preheating tank, and DHW tank with a 120-liter volume. Case 3 was the second best, Case 2 was the third alternative, and the last was Case 4. We did not consider Case 0 because this case did not include solar thermal panels or any kind of renewable energy source; thus, calculation of, for example, the payback period is irrelevant. Scores were combined with the criterion weights to produce an overall score for each option. The extent to which the options satisfied the criteria was weighed according to the relative importance of the criteria. This was done by simple weighted summation. The results indicate that the economic criterion (which gives most to the objective of determining the best solar panel) influenced the prioritization.
4. Conclusions
This work presents a method to create a multicriteria decision support system to compare solar energy systems in buildings considering energy, economical, technical, availability, and environmental issues. We computed the weight of the criteria selected considering the analytical hierarchy process to get a prioritization scheme for selecting the right solar panel system. We intend practitioners to set their own weights for the criteria (other scenarios can involve different weights, for example environmental, energy, or availability, if they are considered more than in our case) to make this a universal tool.
In the case study selected, we proposed four schemes to represent the most common installation alternatives in Spain. Among others, Case 1 which incorporated a gas boiler, a solar preheating tank, a buffer tank, and DHW tank, was the best alternative, as the economic criteria were much more important than in the other cases. We can state here that a universal best solar thermal scheme does not exist, as energy consumption depends on other features and limits as well as energy production, geographical latitude of the location, and so forth. For the other criteria, Case 3 (a gas boiler and a combination tank) resulted in the best alternative for reducing the energy required and CO2 emitted, it had the best energy efficiency of the installation, and it had the lowest transmission losses. In other scenarios when the economic criteria are not so relevant, this should be the best case in the prioritization scheme. The sensitivity analysis with regards the DHW consumption showed that an increase in hot water demand involved higher energy requirements. These schemes are more important in terms of energy and environmental savings; thus, it is appropriate to install a greater number of panels.
We will focus our future research works on experimental measurements of solar thermal installation schemes and on comparing modelled and measured parameters with the aim to confirm the results obtained with T*SOL software. It is important to highlight that as heat production varies in many locations (longitude and latitude, mean outside temperature, lowest outside temperature), we think the current method will show that different results are expected in every town or country.
Author Contributions
J.K. performed modeling and analysis; M.P. designed the research and wrote the discussion, and S.V. cooperated in the research task; M.P. and S.V. read and approved the final manuscript. All authors have read and agreed to the published version of the manuscript.
Funding
This work was financially supported by the Grant Agency of Slovak Republic to support project No. VEGA 1/0512/20: “Analysis of new approaches and certification of sustainable office buildings from the perspective of wellbeing and performance of employees.”
Conflicts of Interest
The authors declare no conflicts of interest.
Appendix A: Tables for AHP calculations
Table A1.
Pairwise comparison of criteria.
Table A1.
Pairwise comparison of criteria.
| Criterion | Economics | Energy | Environmental | Risk | Technical | Weight |
|---|---|---|---|---|---|---|
| Economics | 1 | 8 | 6 | 5 | 4 | 0.54 |
| Energy | 0.12 | 1 | 6 | 1.20 | 1.5 | 0.17 |
| Environmental | 0.17 | 0.17 | 1 | 1.20 | 1.5 | 0.09 |
| Availability | 0.20 | 0.83 | 0.83 | 1 | 1.25 | 0.10 |
| Technical | 0.25 | 0.67 | 0.667 | 0.8 | 1 | 0.09 |
| Sum | 1.74 | 10.67 | 14.5 | 9.2 | 9.25 |
Table A2.
Pairwise comparison of alternatives based on Economics.
Table A2.
Pairwise comparison of alternatives based on Economics.
| Case | A | B | C | D | Weight |
|---|---|---|---|---|---|
| A | 1 | 2 | 2.1 | 2.2 | 0.41 |
| B | 0.5 | 1 | 1.1 | 1.2 | 0.21 |
| C | 0.47 | 0.91 | 1 | 1.05 | 0.19 |
| D | 0.45 | 0.83 | 0.95 | 1 | 0.18 |
| Sum | 2.43 | 4.74 | 5.15 | 5.45 |
Table A3.
Pairwise comparison of alternatives based on Energy.
Table A3.
Pairwise comparison of alternatives based on Energy.
| Case | A | B | C | D | Weight |
|---|---|---|---|---|---|
| A | 1 | 1 | 0.6 | 1 | 0.22 |
| B | 1 | 1 | 1 | 1 | 0.25 |
| C | 1.67 | 1 | 1 | 1 | 0.28 |
| D | 1 | 1 | 1 | 1 | 0.25 |
| Sum | 4.67 | 4 | 3.6 | 4 |
Table A4.
Pairwise comparison of alternatives based on Environmental.
Table A4.
Pairwise comparison of alternatives based on Environmental.
| Case | A | B | C | D | Weight |
|---|---|---|---|---|---|
| A | 1 | 0.67 | 0.33 | 0.67 | 0.14 |
| B | 1.5 | 1 | 0.33 | 1 | 0.20 |
| C | 3 | 3 | 1 | 0.33 | 0.32 |
| D | 1.5 | 1 | 3 | 1 | 0.34 |
| Sum | 7 | 5.67 | 4.67 | 3 |
Table A5.
Pairwise comparison of alternatives based on Availability.
Table A5.
Pairwise comparison of alternatives based on Availability.
| Case | A | B | C | D | Weight |
|---|---|---|---|---|---|
| A | 1 | 0.8 | 0.4 | 0.8 | 0.17 |
| B | 1.25 | 1 | 0.5 | 1 | 0.21 |
| C | 2.5 | 2 | 1 | 1.67 | 0.40 |
| D | 1.25 | 1 | 0.60 | 1 | 0.22 |
| Sum | 6 | 4.8 | 2.50 | 4.47 |
Table A6.
Pairwise comparison of alternatives based on Technical.
Table A6.
Pairwise comparison of alternatives based on Technical.
| Case | A | B | C | D | Weight |
|---|---|---|---|---|---|
| A | 1 | 0.8 | 0.5 | 1.1 | 0.20 |
| B | 1.25 | 1 | 0.6 | 0.9 | 0.22 |
| C | 2 | 1.67 | 1 | 1.67 | 0.37 |
| D | 0.91 | 1.11 | 0.60 | 1 | 0.21 |
| Sum | 5.16 | 4.58 | 2.70 | 4.67 |
References
- Pestana, D.G.; Rodrigues, S.; Morgado-Dias, F. Environmental and economic analysis of solar systems in Madeira, Portugal. Util. Policy 2018, 55, 31–40. [Google Scholar] [CrossRef]
- Kafka, J.L.; Miller, M.A. A climatology of solar irradiance and its controls across the United States: Implications for solar panel orientation. Renew. Energy 2019, 135, 897–907. [Google Scholar] [CrossRef]
- Dhar, A.; Naeth, M.A.; Jennings, P.D.; El-din, M.G. Perspectives on environmental impacts and a land reclamation. Sci. Total Environ. 2019, 134602. [Google Scholar] [CrossRef]
- Rozentale, L.; Lauka, D.; Blumberga, D. Accelerating power generation with solar panels. Case in Latvia. Energy Procedia 2018, 147, 600–606. [Google Scholar] [CrossRef]
- Harrison, S.; Cruickshank, C.A. A review of strategies for the control of high temperature stagnation in solar collectors and systems. Energy Procedia 2012, 30, 793–804. [Google Scholar] [CrossRef]
- Abolhosseini, S.; Heshmati, A. The main support mechanisms to finance renewable energy development. Renew. Sustain. Energy Rev. 2014, 40, 876–885. [Google Scholar] [CrossRef]
- Timilsina, G.R.; Kurdgelashvili, L.; Narbel, P.A. Solar energy: Markets, economics and policies. Renew. Sustain. Energy Rev. 2012, 16, 449–465. [Google Scholar] [CrossRef]
- Dinica, V. Support systems for the diffusion of renewable energy technologies—An investor perspective. Energy Policy 2006, 34, 461–480. [Google Scholar] [CrossRef]
- Menanteau, P.; Finon, D.; Lamy, M.L. Prices versus quantities: Choosing policies for promoting the development of renewable energy. Energy Policy 2003, 31, 799–812. [Google Scholar] [CrossRef]
- Srinivasan, S. Subsidy policy and the enlargement of choice. Renew. Sustain. Energy Rev. 2009, 13, 2728–2733. [Google Scholar] [CrossRef]
- Hosenuzzaman, M.; Rahim, N.A.; Selvaraj, J.; Hasanuzzaman, M.; Malek, A.B.M.A.; Nahar, A. Global prospects, progress, policies, and environmental impact of solar photovoltaic power generation. Renew. Sustain. Energy Rev. 2015, 41, 284–297. [Google Scholar] [CrossRef]
- European Commission. A Clean Planet for All—A European Strategic Long-Term Vision for a Prosperous, Modern, Competitive and Climate Neutral Economy; Communication from the Commission to the European Parliament, The European Council, the European Economic and Social Committee, the Committee of the Regions and the European Investment Bank; European Commission: Brussels, Belgium, 2018. [Google Scholar]
- European Commission. 2019 European Semester: Assessment of Progress on Structural Reforms, Prevention and Correction of Macroeconomic Imbalances, and Results of In-Depth Reviews under Regulation (EU); No 1176/2011; European Commission: Brussels, Belgium, 2019. [Google Scholar]
- De Guadalfajara, M.; Lozano, M.A.; Serra, L.M. Evaluation of the potential of large solar heating plants in Spain. Energy Procedia 2012, 30, 839–848. [Google Scholar] [CrossRef]
- Wang, W.; Tian, Z.; Ding, Y. Investigation on the influencing factors of energy consumption and thermal comfort for a passive solar house with water thermal storage wall. Energy Build. 2013, 64, 218–223. [Google Scholar] [CrossRef]
- Kalogirou, S.A. Solar thermal collectors and applications. Prog. Energy Combust. Sci. 2004, 30, 231–295. [Google Scholar] [CrossRef]
- Weiss, W.; Spörk-Dür, M. Global Market Development and Trends in 2018; AEE-Institute for Sustainable Technologies: Gleisdorf, Austria, 2018. [Google Scholar]
- Lauka, D.; Pakere, I.; Blumberga, D. First solar power plant in Latvia. Analysis of operational data. Energy Procedia 2018, 147, 162–165. [Google Scholar] [CrossRef]
- Tsikaloudaki, K.; Laskos, K.; Theodosiou, T.; Bikas, D. Assessing cooling energy performance of windows for office buildings in the Mediterranean zone. Energy Build. 2012, 49, 192–199. [Google Scholar] [CrossRef]
- Morrissey, J.; Moore, T.; Horne, R.E. Affordable passive solar design in a temperate climate: An experiment in residential building orientation. Renew. Energy 2011, 36, 568–577. [Google Scholar] [CrossRef]
- Oliva, A.; Costa, M.; Segarra, C.D.P. Numerical simulation of solar collectors: The effect of nonuniform and nonsteady state of the boundary conditions. Sol. Energy 1991, 47, 359–373. [Google Scholar] [CrossRef]
- Cadafalch, J. A detailed numerical model for flat-plate solar thermal devices. Sol. Energy 2009, 83, 2157–2164. [Google Scholar] [CrossRef]
- Berry, S.; Davidson, K. Zero energy homes—Are they economically viable? Energy Policy 2015, 85, 12–21. [Google Scholar] [CrossRef]
- Matuska, T.; Sourek, B. Façade solar collectors. Sol. Energy 2006, 80, 1443–1452. [Google Scholar] [CrossRef]
- Maurer, C.; Cappel, C.; Kuhn, T.E. Progress in building-integrated solar thermal systems. Sol. Energy 2017, 154, 158–186. [Google Scholar] [CrossRef]
- Quiles, P.V.; Aguilar, F.J.; Aledo, S. Analysis of the overheating and stagnation problems of solar thermal installations. Energy Procedia 2014, 48, 172–180. [Google Scholar] [CrossRef]
- Baneshi, M.; Bahreini, S.A. Impacts of hot water consumption pattern on optimum sizing and techno-economic aspects of residential hybrid solar water heating systems. Sustain. Energy Technol. Assess. 2018, 30, 139–149. [Google Scholar] [CrossRef]
- Ragheb, A.; El-Shimy, H.; Ragheb, G. Green architecture: A concept of sustainability. Procedia Soc. Behav. Sci. 2016, 216, 778–787. [Google Scholar] [CrossRef]
- Dalla Rosa, A.; Christensen, J.E. Low-Energy district heating in energy-efficient building areas. Energy 2011, 36, 6890–6899. [Google Scholar] [CrossRef]
- Ma, Y.; Kelman, A.; Daly, A.; Borrelli, F. Predictive control for energy efficient buildings with thermal storage: Modeling, stimulation, and experiments. IEEE Control Syst. 2012, 32, 44–64. [Google Scholar]
- Ijumba, K.P.; Sebitosi, A.B.; Pillay, P.; Folly, K. Impact of extensive residential solar water heating on power system losses. Energy Sustain. Dev. 2009, 13, 85–95. [Google Scholar] [CrossRef]
- Sarbu, I.; Sebarchievici, C. A comprehensive review of thermal energy storage. Sustainability 2018, 10, 191. [Google Scholar] [CrossRef]
- Chidambaram, L.A.; Ramana, A.S.; Kamaraj, G.; Velraj, R. Review of solar cooling methods and thermal storage options. Renew. Sustain. Energy Rev. 2011, 15, 3220–3228. [Google Scholar] [CrossRef]
- Quijera, J.A.; Alriols, M.G.; Labidi, J. Integration of a solar thermal system in a dairy process. Renew. Energy 2011, 36, 1843–1853. [Google Scholar] [CrossRef]
- Paulus, C.; Papillon, P. Substations for decentralized solar district heating: Design, performance and energy cost. Energy Procedia 2014, 48, 1076–1085. [Google Scholar] [CrossRef]
- Pisello, A.L. Experimental analysis of cool traditional solar shading systems for residential buildings. Energies 2015, 8, 2197–2210. [Google Scholar] [CrossRef]
- Parra, J.; Guardo, A.; Egusquiza, E.; Alavedra, P. Thermal performance of ventilated double skin façades with venetian blinds. Energies 2015, 8, 4882–4898. [Google Scholar] [CrossRef]
- Biswas, K.; Shrestha, S.; Hun, D.; Atchley, J. Thermally anisotropic composites for improving the energy efficiency of building envelopes. Energies 2019, 12, 3783. [Google Scholar] [CrossRef]
- Valentin Software, Inc. T*SOL® Basic Version 5.0. Design and Simulation of Thermal Solar Systems; User Manual; Valentin Software, Inc.: Temecula, CA, USA, 2012; Volume 104. [Google Scholar]
- Handfield, R.; Walton, S.V.; Sroufe, R.; Melnyk, S.A. Applying environmental criteria to supplier assessment: A study in the application of the Analytical Hierarchy Process. Eur. J. Oper. Res. 2002, 141, 70–87. [Google Scholar] [CrossRef]
- Zahedi, F. The analytic hierarchy process—A survey of the method and its applications. Interfaces (Provid.) 1986, 16, 96–108. [Google Scholar] [CrossRef]
- Nigim, K.; Munier, N.; Green, J. Pre-Feasibility MCDM tools to aid communities in prioritizing local viable renewable energy sources. Renew. Energy 2004, 29, 1775–1791. [Google Scholar] [CrossRef]
- Mohsen, M.S.; Akash, B.A. Evaluation of domestic solar water heating system in Jordan using analytic hierarchy process. Energy Convers. Manag. 1997, 38, 1815–1822. [Google Scholar] [CrossRef]
- Aragonés-Beltrán, P.; Chaparro-González, F.; Pastor-Ferrando, J.P.; Pla-Rubio, A. An AHP (Analytic Hierarchy Process)/ANP (Analytic Network Process)-based multi-criteria decision approach for the selection of solar-thermal power plant investment projects. Energy 2014, 66, 222–238. [Google Scholar] [CrossRef]
- Saaty, R.W. Decision Making in Complex Environments; Super Decisions; Creative Decisions Foundation: Pittsburgh, PA, USA, 2003. [Google Scholar]
- Saaty, T.L. Fundamentals of Decision Making and Priority Theory with the Analytic Hierarchy Process; RWS Publications: Pittsburgh, PA, USA, 2000; Volume 6. [Google Scholar]
- Keshavarzi, A. AHP Software in Excel.
- Kettler, A.J.; Goulter, I.C. Analysis of pipe breakage in urban water distribution networks. Can. J. Civ. Eng. 1985, 12, 286–293. [Google Scholar] [CrossRef]
- Wagner, L. Overview of Energy Storage Technologies; Elsevier: Amsterdam, The Netherlands, 2013; pp. 613–631. [Google Scholar]
- Cabrera, E.; Pardo, M.A.; Cobacho, R.; Arregui, F.J.; Cabrera, E., Jr. Evaluation of carbon credits saved by water losses reduction in water networks. In Proceedings of the IWA International Conference on Water losses, Cape Town, South Africa, 5 July–5 September 2009. [Google Scholar]
- Kleiner, Y.; Rajani, B. Comprehensive review of structural deterioration of water mains: Statistical models. Urban Water 2001, 3, 131–150. [Google Scholar] [CrossRef]
- Shamir, U.; Howard, C.D.D. An analytic approach to scheduling pipe replacement. J. Am. Water Works Assoc. 1979, 71, 248–258. [Google Scholar] [CrossRef]
- Murugesan, R. Energy Use Efficiency in Dryland Agriculture; Kalpaz Publications: New Delhi, India, 2010; ISBN 8178357992. [Google Scholar]
- Red Eléctrica de España. The Spanish Electricity System 2017; Red Eléctrica de España: Madrid, Spain, 2018. [Google Scholar]
- Martinopoulos, G.; Tsalikis, G. Active solar heating systems for energy efficient buildings in Greece: A technical economic and environmental evaluation. Energy Build. 2014, 68, 130–137. [Google Scholar] [CrossRef]
- Rosiek, S.; Batlles, F.J. Integration of the solar thermal energy in the construction: Analysis of the solar-assisted air-conditioning system installed in CIESOL building. Renew. Energy 2009, 34, 1423–1431. [Google Scholar] [CrossRef]
- Gilford, D.; Croushore, L.; Ramel, C. Solar Thermal in New York City: Opportunities + Challenges; Final Report of the NYCEDC Solar Thermal Pilot Program; New York City Economic Development Corporation: New York, NY, USA, 2013. [Google Scholar]
- Aoul, K.T.; Hasan, A.; Riaz, H. Solar water heating systems for different buildings under a hot climate; parametric optimization and economic analysis. Sustain. Build. 2018, 3, 3. [Google Scholar] [CrossRef]


© 2020 by the authors. Licensee MDPI, Basel, Switzerland. This article is an open access article distributed under the terms and conditions of the Creative Commons Attribution (CC BY) license (http://creativecommons.org/licenses/by/4.0/).