Article

Addressing Abrupt PV Disturbances, and Mitigating Net Load Profile’s Ramp and Peak Demands, Using Distributed Storage Devices

by
Roshan Sharma
* and
Masoud Karimi-Ghartemani
Department of Electrical and Computer Engineering, Mississippi State University, Starkville, MS 39762, USA
*
Author to whom correspondence should be addressed.
Energies 2020, 13(5), 1024; https://doi.org/10.3390/en13051024
Submission received: 10 January 2020 / Revised: 17 February 2020 / Accepted: 21 February 2020 / Published: 25 February 2020
(This article belongs to the Special Issue Grid-Connected PV Plants)

Abstract

:
At high penetration level of photovoltaic (PV) generators, their abrupt disturbances (caused by moving clouds) cause voltage and frequency perturbations and increase system losses. Meanwhile, the daily irradiation profile increases the slope in the net-load profile, for example, California duck curve, which imposes the challenge of quickly bringing on-line conventional generators in the early evening hours. Accordingly, this paper presents an approach to achieve two objectives: (1) address abrupt disturbances caused by PV generators, and (2) shape the net load profile. The approach is based on employing battery energy storage (BES) systems coupled with PV generators and equipped with proper controls. The proposed BES addresses these two issues by realizing flexible power ramp-up and ramp-down rates by the combined PV and BES. This paper presents the principles, modeling and control design aspects of the proposed system. A hybrid dc/ac study system is simulated and the effectiveness of the proposed BES in reducing the impacts of disturbances on both the dc and ac subsystems is verified. It is then shown that the proposed PV-BES modifies the daily load profile to mitigate the required challenge for quickly bringing on-line synchronous generators.

Graphical Abstract

1. Introduction

The limitations of fossil fuel reserves and environmental concerns have increased interest in renewable energy resources [1]. Solar photovoltaic (PV) generation is one of the most promising renewable energy approaches. In recent years, PV power generation has increased significantly thanks to the development of cost-effective, higher efficiency semiconductor PV technology, as well as advancements in related power electronics and controls. Solar PV is projected to contribute 16% of the world’s total electricity and 43% of the added electricity in the United States (US) by 2050 [2,3]. However, the uncertainty and variability of PV sources constitute the main obstacles against their high level penetration. Furthermore, PV sources do not have inherent rotational inertia to support the grid during the transients [4,5,6].
The power injected by PV can change suddenly due to cloud movements. In 2011, a study of three PV systems, located in Porterville, Palmdale, and Fontana, California, found that the power ramp rate was as high as 90%, 93% and 75% per minute of their rated power, respectively [7]. The sudden changes in PV power can introduce voltage fluctuations in distribution system and frequency fluctuations in the case of high PV penetration and weak grid, leading to grid stability issues [2,8,9,10]. Puerto Rico Electric Power Authority (PREPA) limits the ramp rate to 10%/minute of the rated capacity for both wind and PV generation, and the Hawaiian Electric Company (HECO) limits its ramps at ±2 MW/min (even ±1 MW/min during some times) for wind generators under 50 MW [11]. According to IEEE standard 1547, distributed energy resources (DERs) cannot cause voltage fluctuations exceeding 3% for a medium voltage interconnection and 5% for a low voltage interconnection [12].
A large number of distributed PV generators together create a duck-shaped daily net load profile due to the variation in solar irradiation. The duck-shaped net load profile has steep slopes, especially in the evening. This requires bringing a large number of synchronous resources online within a short period of time. Such changes in the net load profile cannot be easily addressed by slow conventional generators and the problem becomes severe with the increased penetration of PVs. The existence of a large number of PV generators also increases the chances of negative net load that requires curtailment of PV power [8,13,14].
The number of PV generators connected to the electric power grid has been rising continuously. Authorities and researchers are considering the development of strategies and approaches to obtain grid services, both transient and long-term, from the aggregation of these distributed resources [15]. Therefore, PV generators have been coupled together with complementary generation and storage technologies to address the intermittencies and the disturbances, and these distributed resources are utilized to obtain grid services. Battery energy storage (BES) systems and super-capacitors are two important energy storage approaches that can be coupled with PV generators [16,17,18].
Most of the existing approaches that combine BES with household PV-prosumers are concerned with optimization of battery size, and energy management strategies to minimize electricity bills [19,20,21]. These methods do not address the impact of intermittency and power variation of PVs on the grid. Moving average methods are used to mitigate the impact of abrupt PV power disturbances. However, moving average method does not directly control the ramp rate, depends on historical data, and operates the BES even though BES operation is not required due to the memory effect [22]. The direct ramp control of PV power is an effective method. The ramp-up of PV output is generally not a challenging issue, and it can be achieved using a proper controller without requiring a storage, at the expense of total extracted PV energy [23]. However, the ramp-down is a challenge, and it requires an energy storage to compensate for the PV power drop.
The fluctuations of wind/PV generators are compensated using the BES station in Reference [24]. The control approach calculates the target power for the BES station from the fluctuations of wind/PV generators, and this power is shared by the constituting smaller BES units based on their SOC level. In Reference [22], a BES is coupled with a PV system to mitigate the power fluctuations caused by cloud passing using the ramping method. During PV power fluctuations, the BES is controlled based on the inverse characteristics of the desired ramp-rate. Once the PV power fluctuation is over, the BES power is brought to zero using SOC droop-based ramp rate. The control strategies of References [22,24] are presented at system level, and ignore the dynamics of the converter and details of the control design. Furthermore, the BES reference calculations involve complex algorithms. A hybrid BES and super-capacitor setup is used in Reference [25] to provide frequency support. Although this is combined with a PV generator, it does not directly address the PV power generation variations. Moreover, the frequency does not directly and quickly reflect the PV disturbances at the distribution level.
A battery is integrated in an ac-stack architecture in series with PV converters in Reference [26] to achieve the controlled ramp rate in power. The BES control uses the derivative of the rms of ac string current to determine the fluctuation in PV power. This method does not appear to be able to respond to abrupt PV fluctuations in a timely manner due to the limitations with a derivative operator in practice. Furthermore, this architecture is vulnerable to over-modulation that distorts the output. Finally, the stack architecture compromises the plug-and-play flexibility of the system. In Reference [27], a power management strategy is proposed for a BES in connection to a PV and a local load. If the local load is larger than a predefined minimum value, the combined PV-BES supply the load and the rest of power is offset by the grid. No power ramping is done in this mode. If the local load is less than a predefined minimum, the battery performs a ramp rate control, based on Reference [22], if the PV fluctuations exceed the predefined ramp rate; and the PV-BES operates in constant power feed mode otherwise. Further details of the control design procedures are not presented. A PV-battery combination connected to an ac grid is presented in Reference [28] where the PV operates at the MPP, a battery controls the dc bus voltage of the inverter and the inverter operates in constant power mode. If the reference power of the inverter is properly determined, it can realize ramping. However, this is not discussed in Reference [28]. One limitation of this approach is that the BES cannot be used for an already operating inverter without altering the control system of the inverter. A similar approach is used in Reference [29] where the BES supplies/absorbs the difference of power between the desired and the PV power. The controller in Reference [29] requires communication of an ac signal which is a major limitation. In Reference [30], a 1 MW/2 MWh BES is connected with a multi-MW PV system to achieve (1) power smoothing using moving average and low pass filter, and (2) frequency regulation using P-f droop control. The power smoothing method of Reference [30] has the disadvantages of the moving average approach mentioned earlier. Also, the frequency regulation may not be useful at the distribution level.
Most of the aforementioned works that implement BES to smooth PV power treat the matter at the system level and ignore the dynamics at the converters level. There is a lack of systematic design of the local controls to accomplish the desired power ramps. This paper presents a BES control system concept to address both the abrupt and daily variations of PV power. The proposed BES connects at the terminals of the PV generator (without requiring a change in the PV inverter) and responds to the disturbances to execute desired power ramp rates. The ramp rate signals are either generated locally or received from the grid operator. The paper presents the complete mathematical model of the system including the dynamics of the converter and provides systematic approach in designing the control. Furthermore, if the BES is only used to filter the abrupt PV disturbances for a short period, it results in low utilization of the BES. Therefore, the ramping capability of the PV-BES system has been utilized in this paper to improve the daily load profile. The grid operator can remotely command the distributed PV-BES units with the desired ramp rate, and the proposed control executes the command. The aggregated effect of the distributed PV-BES units with the proposed ramping capability significantly enhances the daily net load profile in terms of (1) reduced peak, (2) increased minimum, and (3) reduced slopes. The proposed method also includes an outer loop that controls the SOC of the BES. The performance of the proposed system is verified using extensive computer simulation and a laboratory prototype.
The contributions of this paper may be summarized as follows: (1) A simple yet effective battery control philosophy to address both the abrupt and daily photovoltaic generation variations. The two set-points of the proposed controller can be generated locally or through communications for system-wide optimization; (2) Complete modeling and control design of the battery control system; (3) Verification of the proposed approach using simulations and laboratory tests.
The remainder of the paper is organized as follows. The power variabilities, abrupt and daily profile, originated from PV generators are discussed in Section 2. Section 3 presents a proposed battery energy storage (BES) system, its mathematical model, and the proposed control to ramp the output power of the PV. Numerical designs and the results obtained both in simulation and laboratory experiment are presented in Section 4. The paper concludes with concluding remarks and limitations of the proposed control in Section 5.

2. Power Variabilities of a PV Generator

2.1. Abrupt Disturbances in PV Generation

Cloud movements cause abrupt changes in solar irradiation, Figure 1. To study the impact of these abrupt power changes, a hybrid dc/ac system is considered in this paper as shown in Figure 2. The parameters of the dc microgrid and the ac system are shown in Table 1 and Table 2, respectively. The details of the PV control used in this study are given in Section 4.1.1.
The PV generator of Figure 2 is controlled using a maximum power point tracking (MPPT) algorithm. The control structure and the parameters are shown in Section 4. Figure 3 shows the voltage and frequency fluctuations, at the point of coupling between dc and ac systems, to abrupt PV disturbances. The solar intensity falls from 1000 W / m 2 to 250 W / m 2 at t = 5.0 s , and it rises back to 1000 W / m 2 at t = 50.0 s . The dc voltage has a peak of 10% that oscillates over a second, and the ac voltage (rms) has a peak close to 5%. The frequency oscillates with a peak of 0.23 Hz , and it takes several seconds to settle.

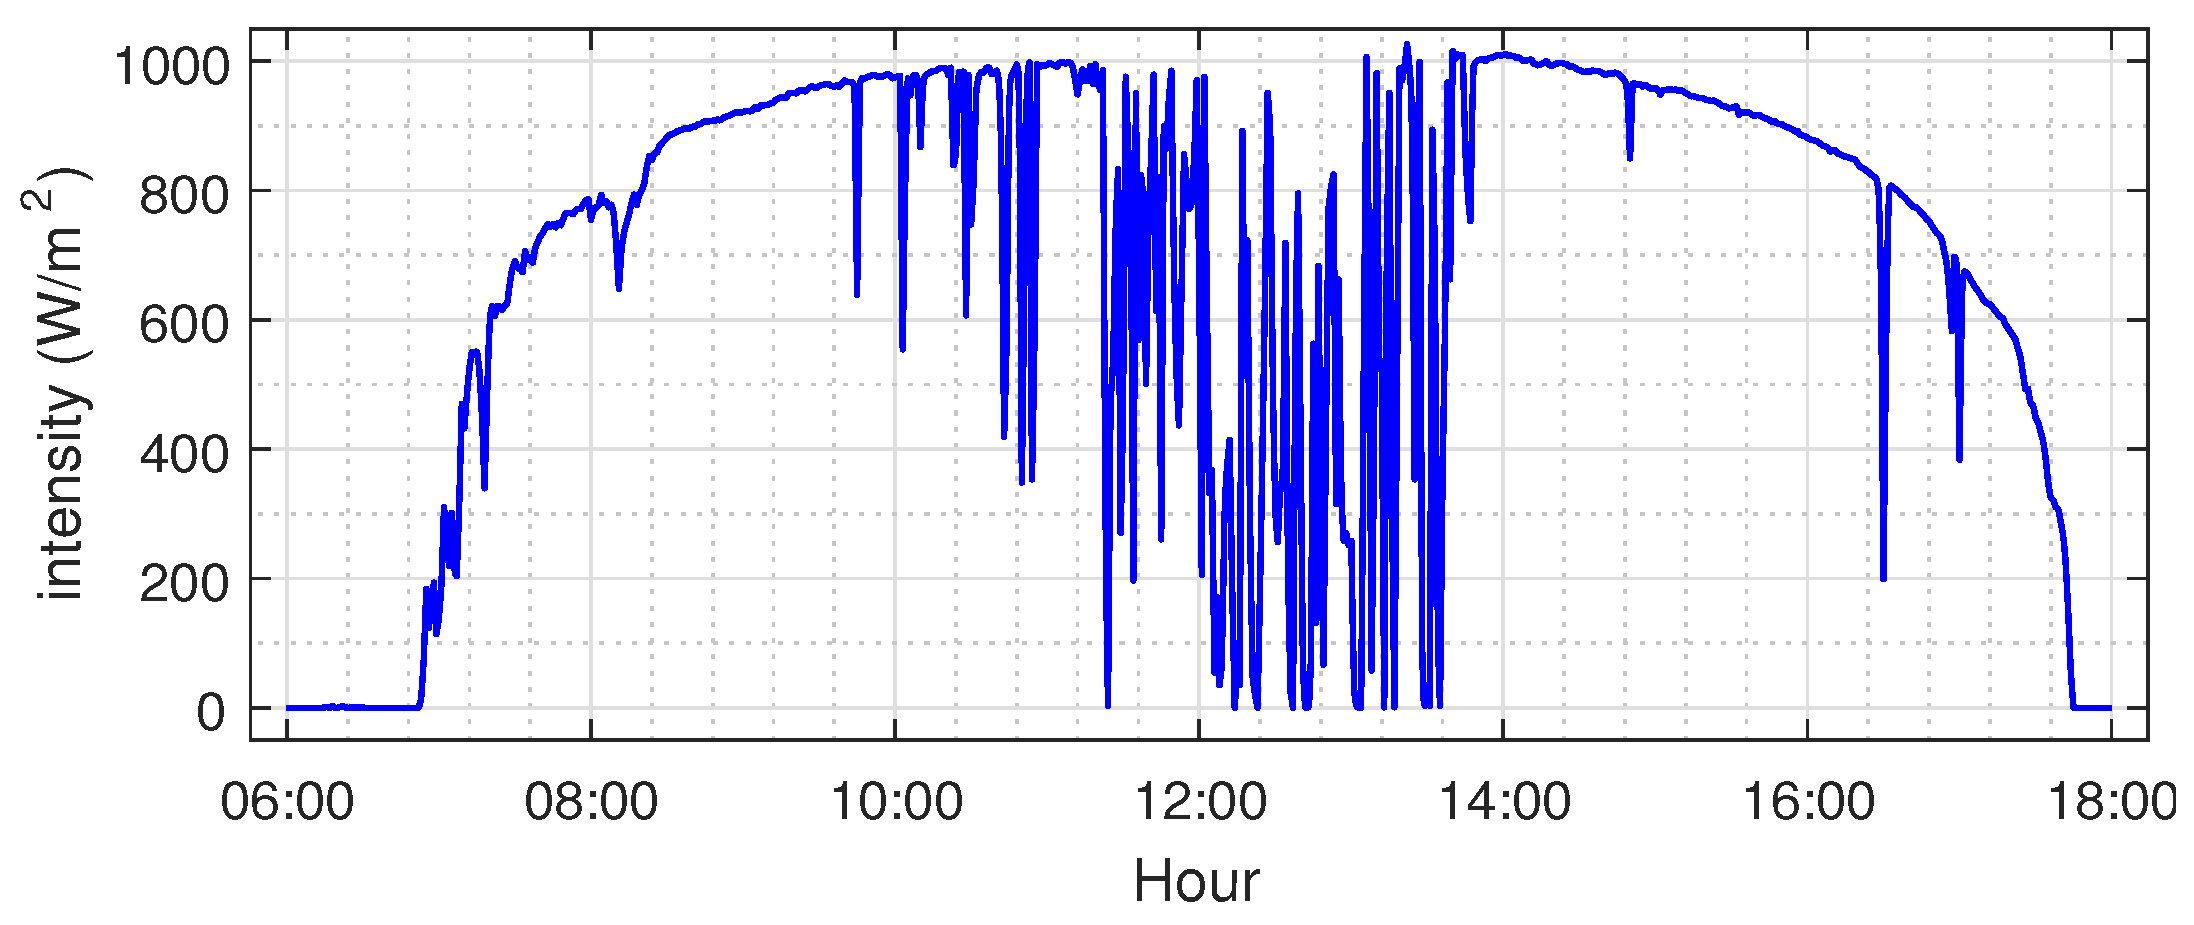
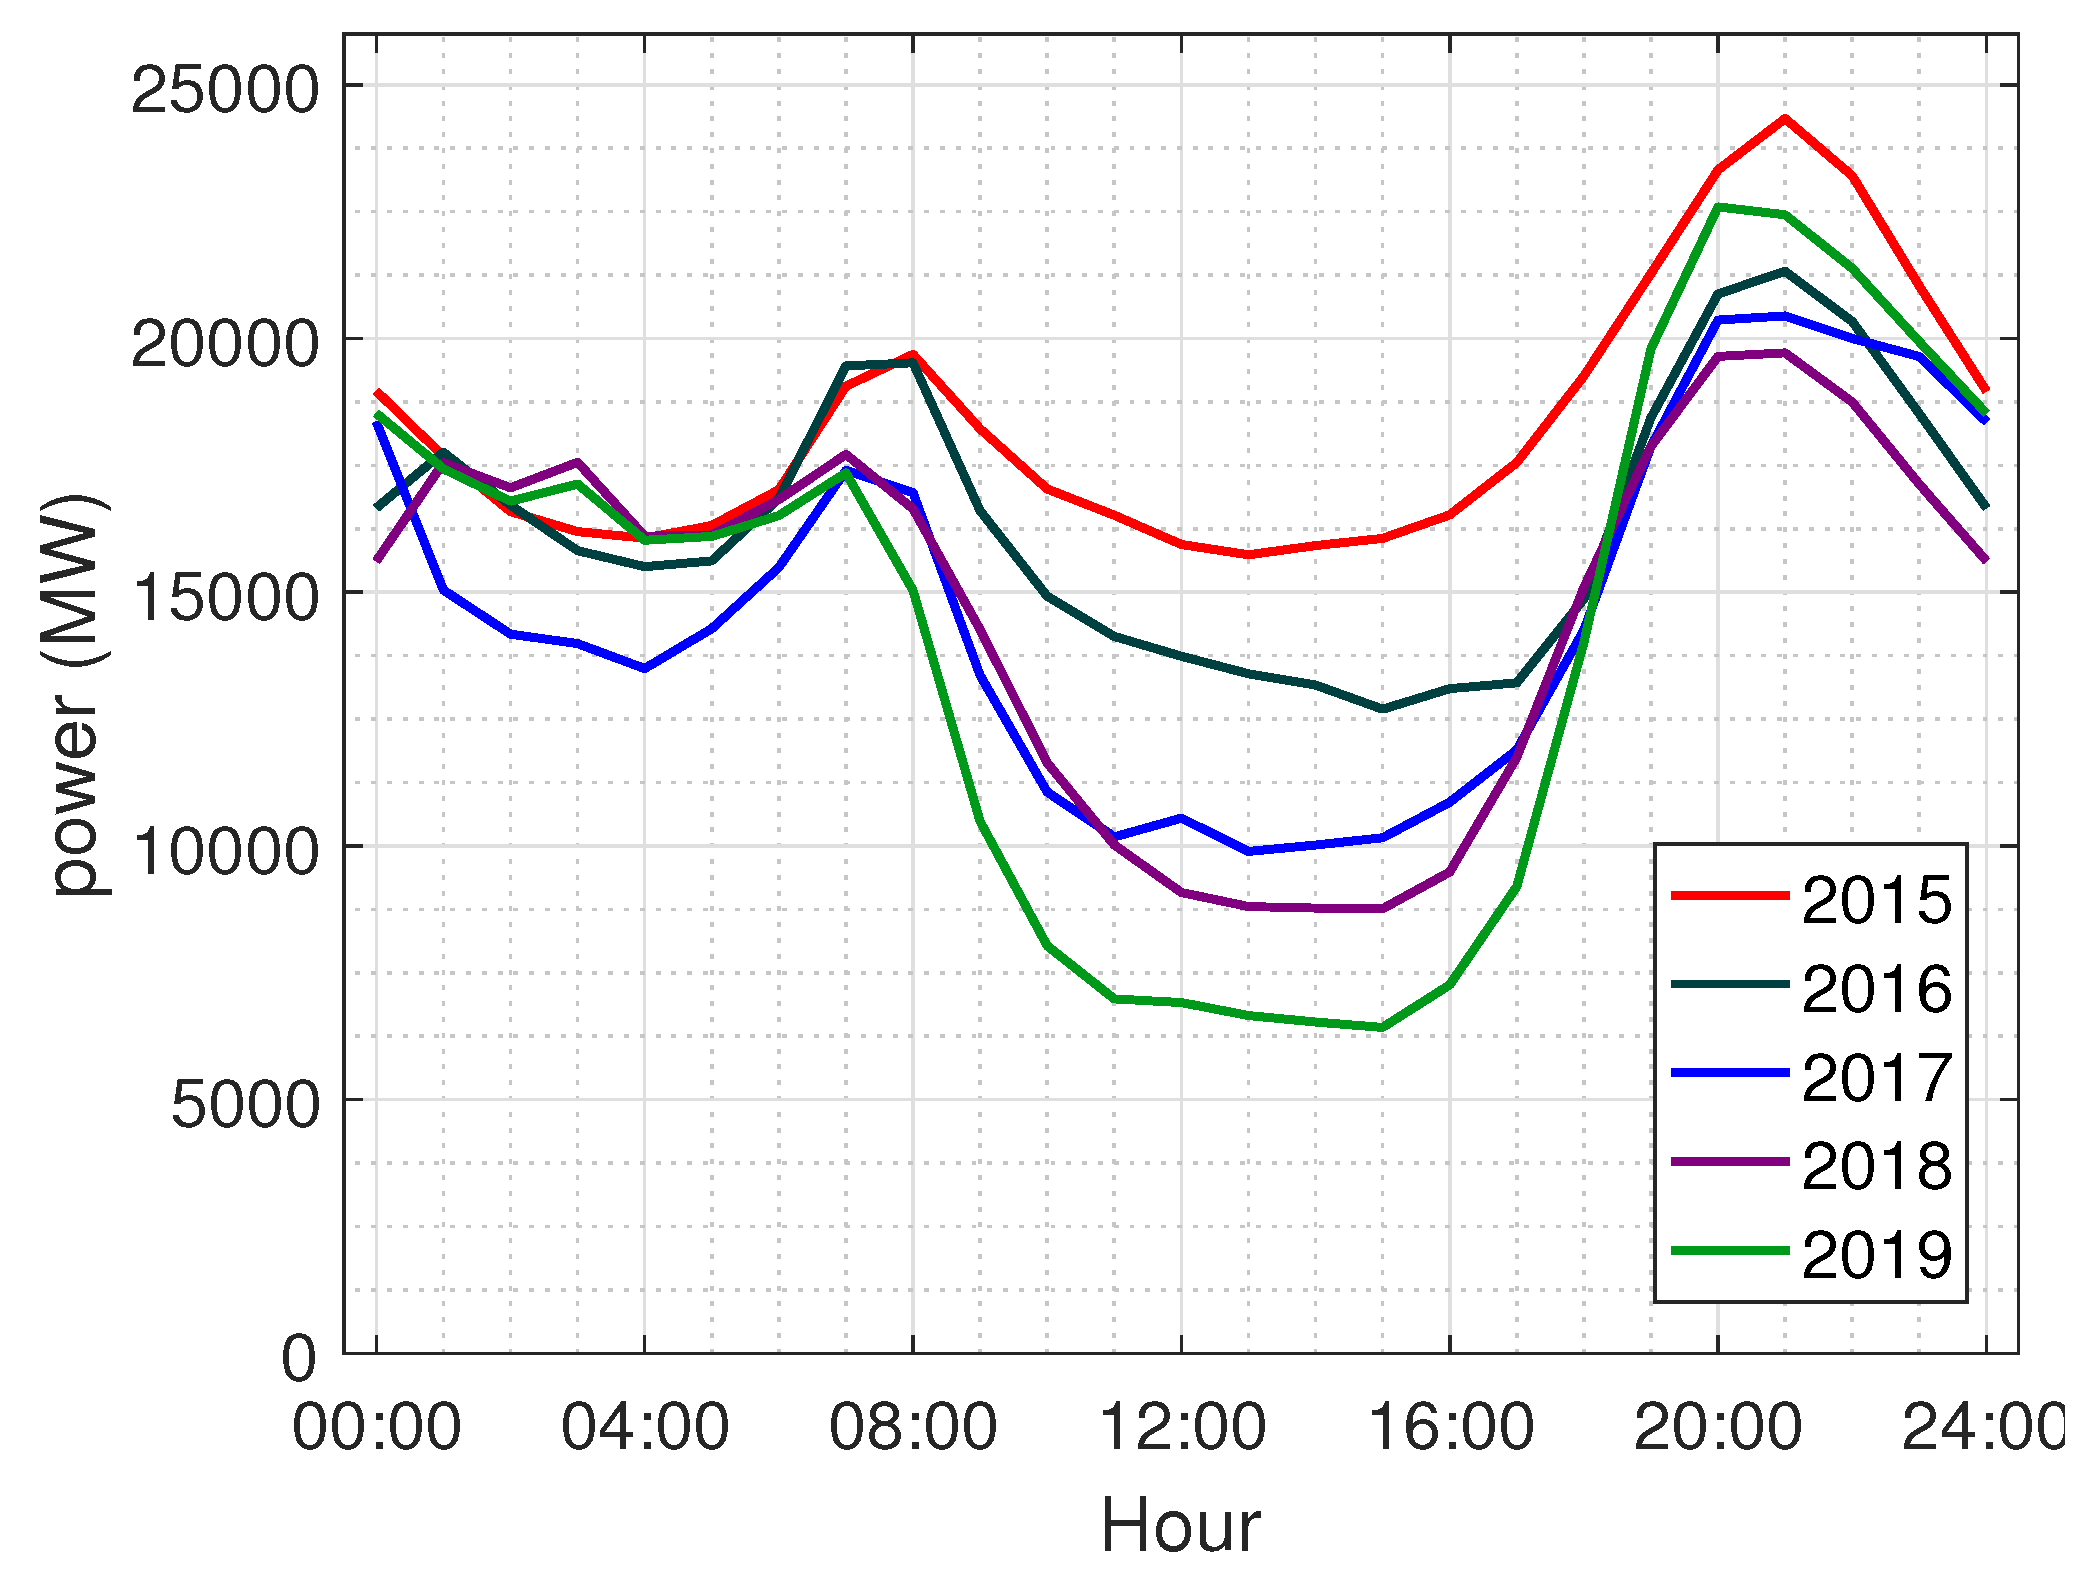
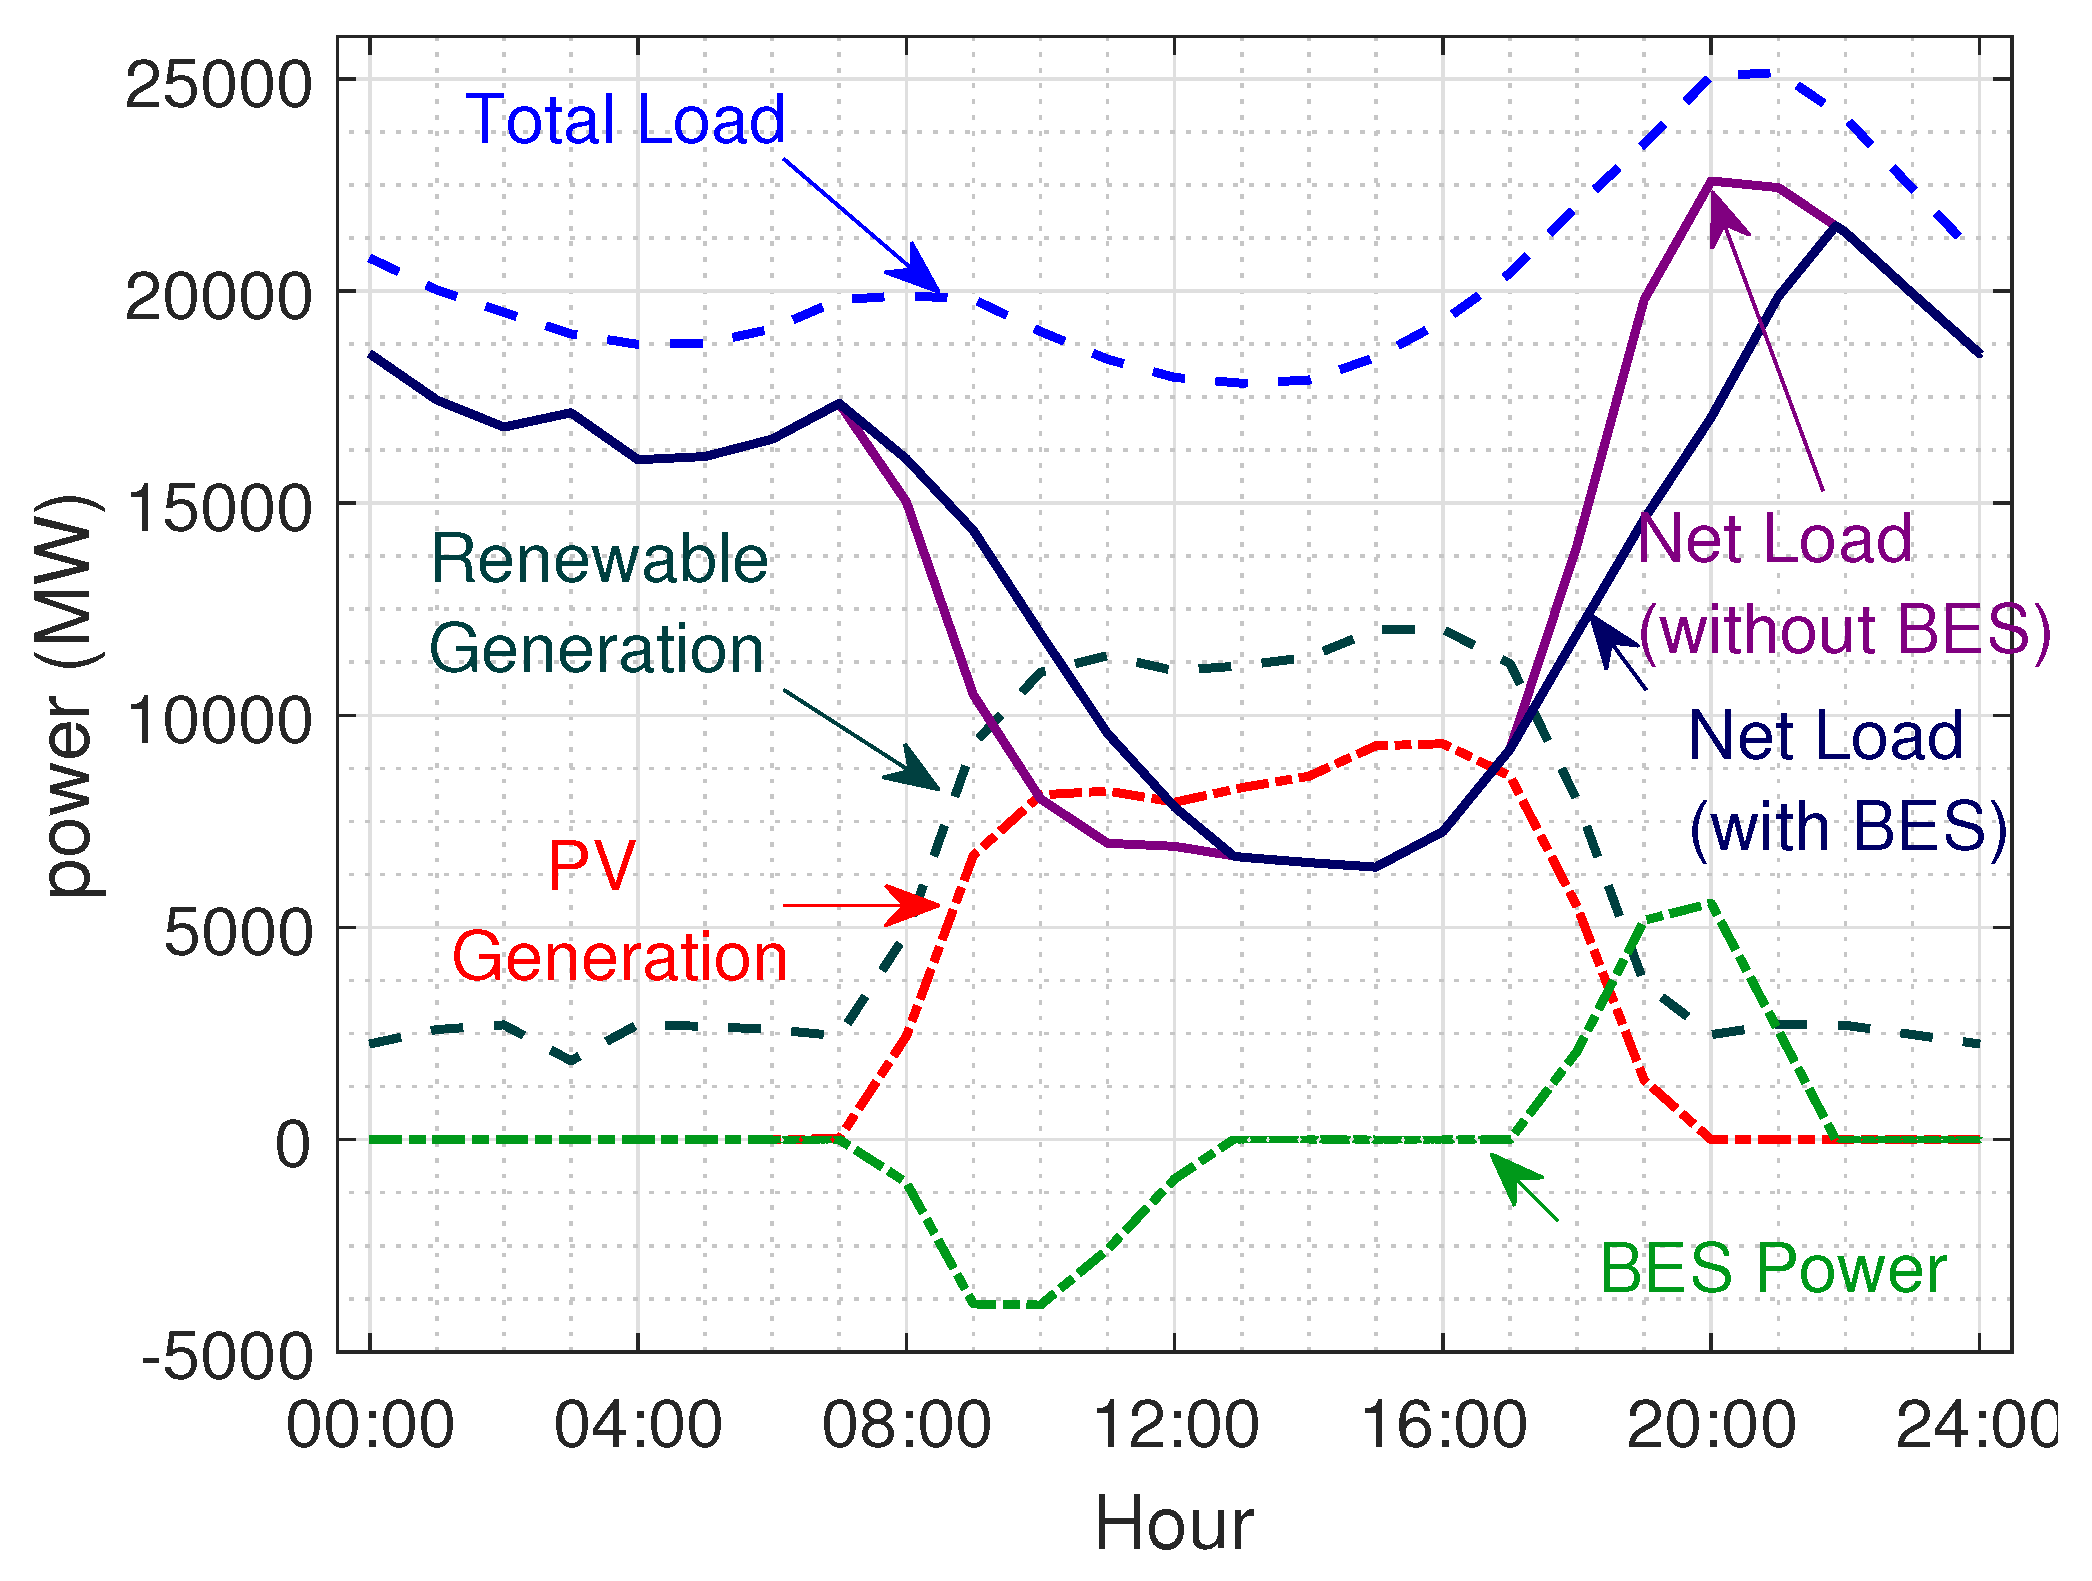
2.2. Daily Power Profile of PV

Figure 4a shows the power generation and the load demand of California Independent System Operator (ISO) on 31 March 2019. As the sun rises, the PV generation increases and the net load declines. Into the evening, the PV generation declines while the load demand increases. This creates a duck-shaped net load profile with steep ramp rates. The net profile of Figure 4a has a ramp rate as steep as 5300 MW/h. Such power ramps impose challenges in commitment of the slow conventional generators [32]. The problem becomes severe with the increased penetration level of the PVs as shown in Figure 4b.

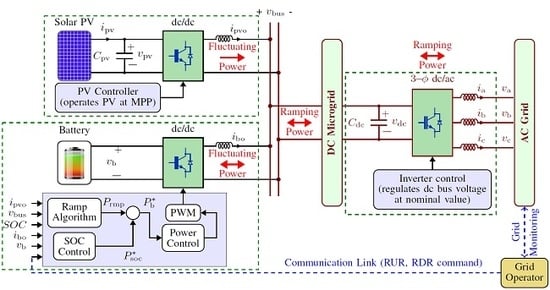
3. Proposed BES System and Control

Figure 5 shows the structure of the proposed PV-BES system. The BES connects at the terminals of the PV and executes ramping of the combined power of the PV-BES system. The BES either generates locally or receives the ramp-up-rate (RUR) and ramp-down-rate (RDR) signals from the grid operator and adjusts its operation accordingly. This can (1) prevent the abrupt PV disturbances, and (2) re-shape the daily load profile, as will be demonstrated in this paper.

3.1. Defining Operational Scenario of BES

Figure 6a shows the scenario where PV power ( P pvo ) experiences an abrupt fall followed by an abrupt rise. The BES power, shown in Figure 6b, compensates this sudden disturbance and the combined power of PV-BES system, P o , has controlled ramp down/up. The charging and discharging of the BES causes rise/fall of its state-of-charge (SOC), as shown in Figure 6c. The BES control system should be equipped with an SOC control that charges/discharges the battery after the response to the disturbance is completed to regulate its SOC to the desired level.

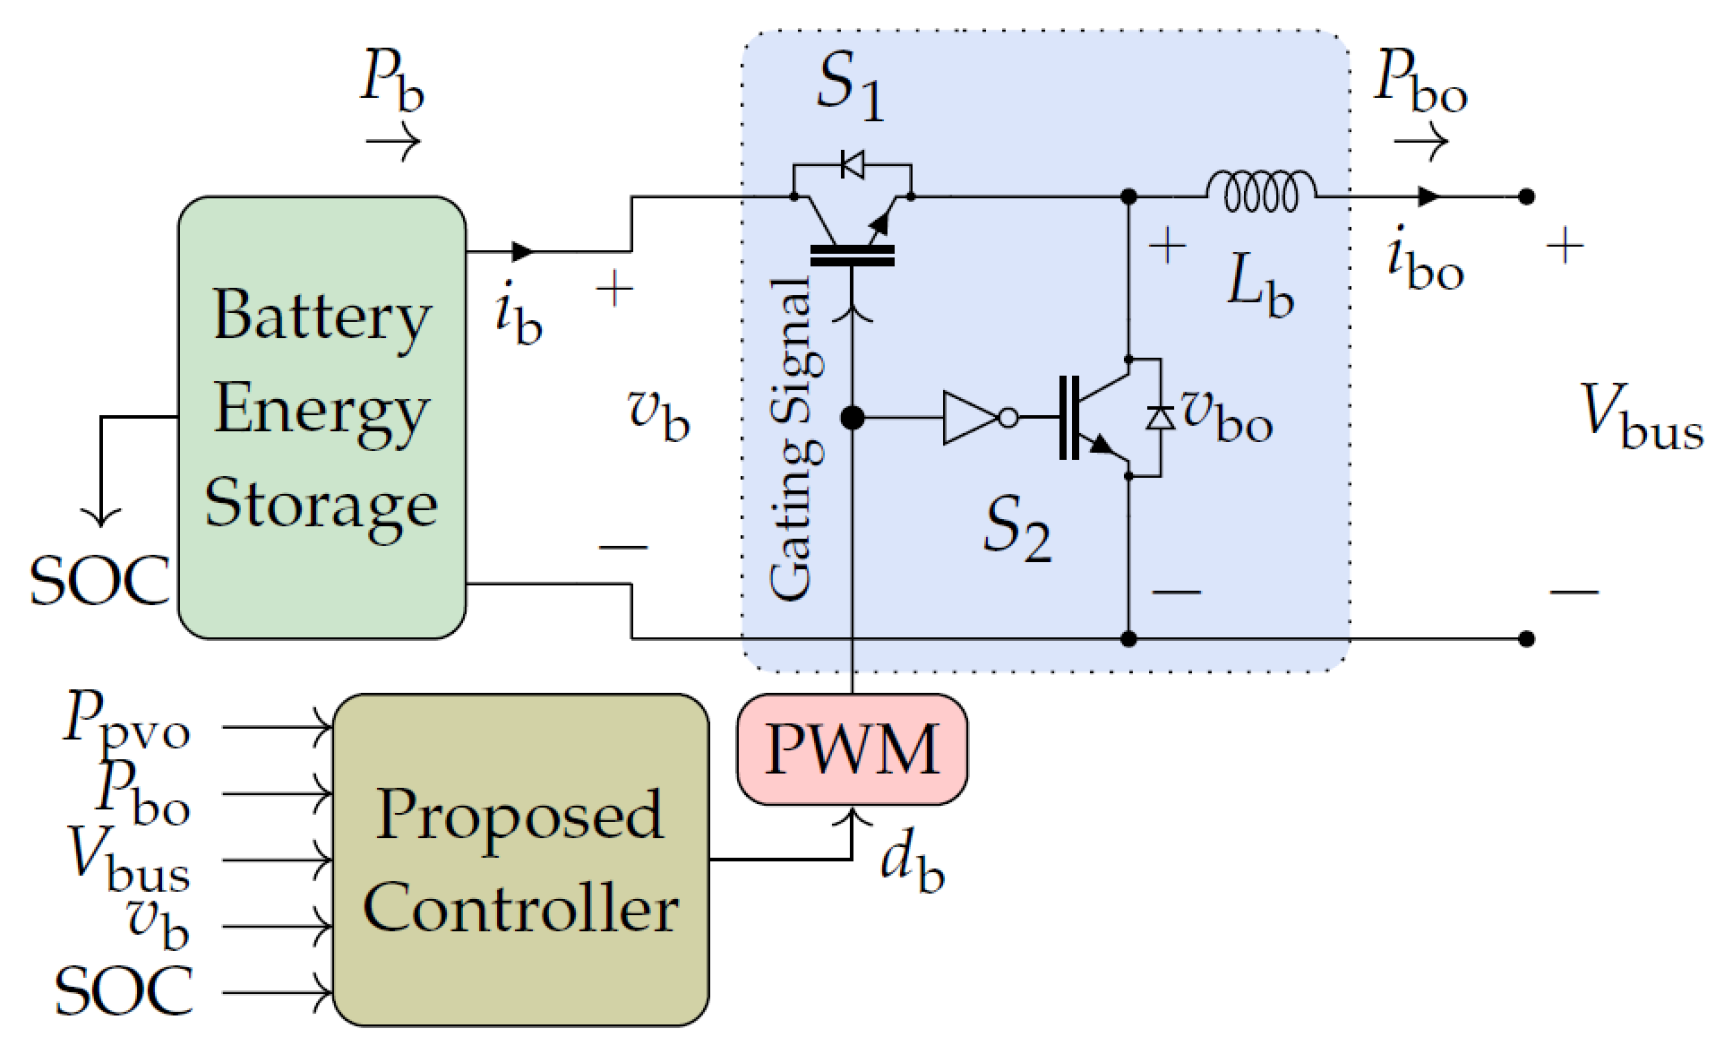
3.2. BES Converter and Its Mathematical Modeling

In this study, the BES uses a bi-directional converter topology as shown in Figure 7. The control system determines the duty cycle of the gating signal for the switches. Assume d b ( t ) is the duty cycle of PWM of the BES converter and v b ( t ) is the BES voltage, then the average converter voltage is v bo ( t ) = d b ( t ) v b ( t ) . If u b ( t ) = v bo ( t ) is the control input, then d b ( t ) = u b ( t ) v b ( t ) and
d i bo ( t ) d t = R b L b i bo ( t ) + 1 L b u b ( t ) V bus L b ,
where i bo ( t ) , R b , L b , and V bus are the BES converter output current, filter resistance, filter inductance, and the voltage at the point of connection of the BES converter, respectively. In terms of power, (1) can be rewritten as
d P bo ( t ) d t = R b L b P bo ( t ) + V bus L b u b ( t ) V bus 2 L b ,
where P bo ( t ) is the output power from the BES system. The dynamics of the SOC depends on the amount of current flowing in/out of the battery and it is mathematically expressed as
d d t SOC ( t ) = P bo Q v b ,
where Q and v b are the battery capacity (in As) and battery voltage (in V), respectively.

3.3. BES Control Structure and Design

Figure 8 shows the block diagram of the proposed control structure for the BES system. The control system can be divided into 3 parts: the Power Control (high bandwidth), the Reference Power Calculator, and the SOC control (low bandwidth). These three parts of the controller can be designed separately and independently due to their different time scales.

3.3.1. Power Control Loop

This loop generates the duty cycle for the converter to absorb/supply the reference power ( P b ). A proportional-integrating (PI) controller is considered and its gains, k 1 b and k 2 b , are optimally designed as follows. Define x ˙ 1 ( t ) = e ( t ) = P b ( t ) P bo ( t ) , and x 2 ( t ) = P bo ( t ) to obtain the state space equations of the power control loop as
x ˙ 1 ( t ) = x 2 ( t ) + P b ( t ) x ˙ 2 ( t ) = R b L b x 2 ( t ) + V bus L b u b ( t ) V bus 2 L b .
We use the approach [34] to convert this tracking problem into standard linear quadratic regulator (LQR) problem by applying d d t to both sides of (4) to obtain
z ˙ 1 ( t ) = z 2 ( t ) , z ˙ 2 ( t ) = R b L b z 2 ( t ) + V bus L b W b ( t ) ,
where z i ( t ) = x ˙ i ( t ) and W b ( t ) = u ˙ b ( t ) . It is assumed that d d t V bus and d d t P b are 0, which is justifiable. Therefore, z ˙ ( t ) = A z ( t ) + B W b ( t ) and the objective is to regulate z 1 ( t ) = e ( t ) to 0. The cost function is
J = 0 [ q 1 e 2 ( t ) + q 2 z 2 2 ( t ) + W b 2 ( t ) ] d t .
As described in Reference [34], the q i parameters can be systematically adjusted for the design of the gains ( k 1 b , k 2 b ) to achieve the fast and smooth response in the power control. The numerical design stage for this system is described in Section 4.

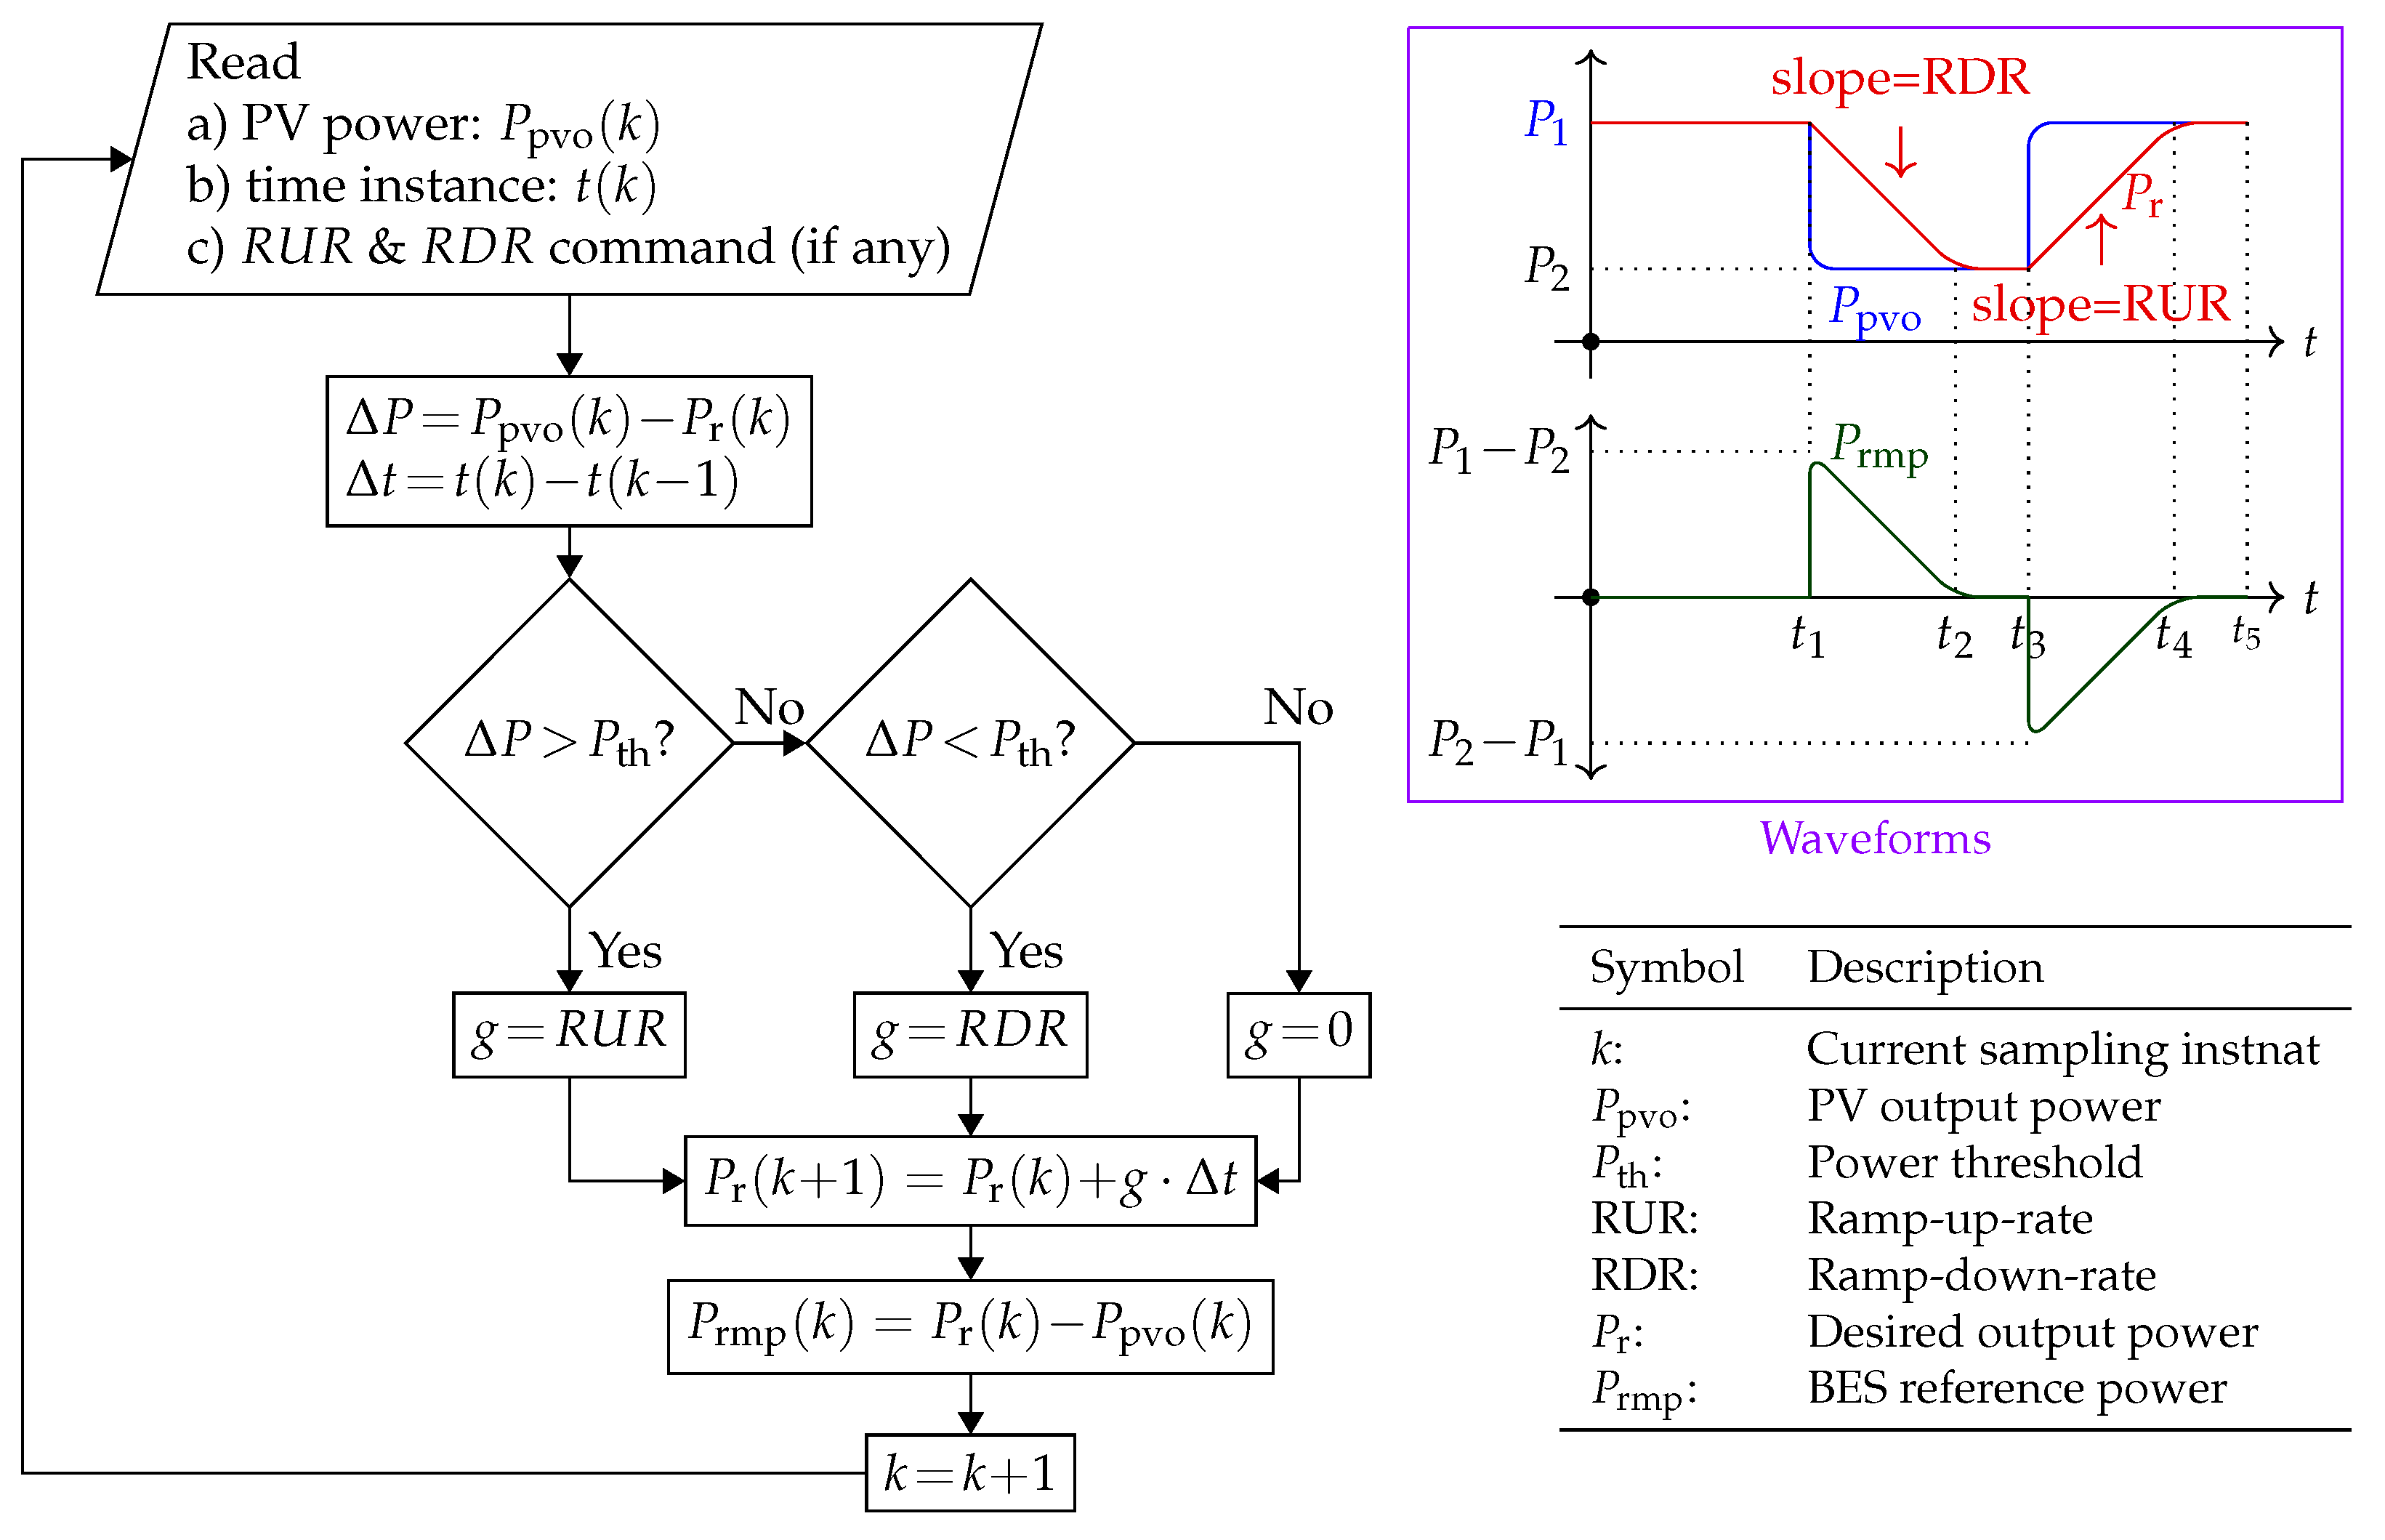
3.3.2. Reference Power Calculation

The reference power is calculated using an algorithm to properly follow the desired ramp rate. Figure 9 shows the flowchart that generates a reference power value, P rmp , that follows desired ramp rate whenever the PV power experiences changes. If P soc is power for the SOC control, then the reference power for the BES system is
P b ( t ) = P rmp ( t ) + P soc ( t ) .

3.3.3. SOC Control Loop

A PI controller is used and its gains, k 1 soc and k 2 soc , are optimally designed to keep the SOC close to its reference value as shown in Figure 8 [6]. The SOC controller gains are designed such that the power control loop and the ramp reference calculator are faster than it. Therefore, during the design of this loop, the fast dynamics of the power control loop may be neglected (and this loop is substituted with a unity gain and the ramp power P rmp is set to zero). With these assumption and also neglecting the small voltage variations across the battery that is, v b V b , the system becomes linear. Defining x ˙ 1 ( t ) = e ( t ) = SOC SOC ( t ) , x 2 ( t ) = SOC ( t ) , and u ( t ) = P soc ( t ) , the state equations of SOC control loop are
x ˙ 1 ( t ) = x 2 ( t ) + SOC , x ˙ 2 ( t ) = 1 Q V b u ( t ) .
This can be converted to a LQR form by applying d d t as
z ˙ 1 ( t ) = z 2 ( t ) , z ˙ 2 ( t ) = 1 Q V b W b 1 ( t )
where z i ( t ) = x ˙ i ( t ) . Thus, z ˙ ( t ) = A z ( t ) + B W b 1 ( t ) and the objective is to regulate z 1 ( t ) = e ( t ) to 0. Define the cost function
J = 0 [ q 1 e 2 ( t ) + q 2 z 2 2 ( t ) + W b 1 2 ( t ) ] d t ,
and use the method of Reference [34] for the design of the gains ( k 1 soc , k 2 soc ) to achieve smooth response in the SOC control. Numerical design is provided in Section 4.

3.4. Determining the BES Capacity

The battery capacity depends on the desired slowest power ramp of the PV and the BES combined. The minimum BES capacity ( Q min ) is chosen such that during the maximum power disturbance ( Δ P max ) the system operates at desired slowest power ramp ( R min ) keeping the SOC within the desired range ( SOC min , SOC max ) for all the time.
Figure 6 shows the typical desired response of the system. For maximum PV power fluctuation Δ P max (in W), the BES should be able to supply power with minimum ramp R min (in W/s) for the time interval T where T = Δ P max R min . Assuming that the battery voltage remains relatively constant at V b (in V) during this period, the total charge supplied by the battery is 0.5 T Δ P max V b (in As). If Δ SOC max is the maximum permissible fluctuation in SOC from its nominal value, SOC n , during this period, then the minimum battery capacity required, Q min (in As), is given by
Q min = Δ P max 2 2 V b R min Δ SOC max .

4. Numerical Designs, Results, and Comparisons

This section presents some numerical designs of the proposed system and also investigates its performance in the context of both abrupt PV power variations and daily irradiation profile using simulations and laboratory-scale experimentation. The structure of the this section is as follows. (1) Section 4.1 studies the performance of proposed system in response to abrupt PV disturbances in a simulated hybrid dc/ac system. (2) Section 4.2 shows the simulation results of applying the proposed system to address abrupt PV disturbances in a real irradiation profile data. (3) Section 4.3 investigates the performance of the proposed method in mitigating the duck-curve phenomenon using simulations on practical data. (4) Section 4.4 shows the results of a laboratory-scale realization of the proposed method. (5) Section 4.5 shows the qualitative comparison of the proposed method with existing methods to mitigate PV power fluctuations.

4.1. Abrupt Disturbances: Case Study 1

The proposed controller is applied to the study system of Figure 2 to study the impact of abrupt PV disturbances. The design of system components are discussed first.

4.1.1. System and Control Parameters

Figure 10 and Table 3 show the PV system and its converter parameters. The controller gains of the PV system are designed using the method discussed in Reference [34]. The internal current loop is designed first, which gives k 1 pv and k 2 pv , and then the external loop is designed that includes the design of k 3 pv , k 4 pv , k 5 pv , and k 6 pv . In the design of the external loop, all the dynamics of the internal loop are carried along. Therefore, unlike common practice, the internal loop is not limited to be several times faster than the external loop. In our study, the PV operates at MPPT using perturb and observe (P&O) algorithm [35]. However, this is not a requirement for the proposed BES controller.
The objective is to obtain the desired ramp rate of 30 %/minute ≈ 75 W/s from the combined PV-BES system. Table 4 shows the parameters of the BES system and its converter. The gains of the power control loop of the BES controller are designed based on the method discussed in Section 3.3.1. Figure 11a shows the plot of the closed loop poles of the power loop on changing q i ’s. Here, q 1 and q 2 are subsequently increased between 10 3 10 2.5 and 10 6 10 4 , respectively. The reference power of the BES for the ramp control is calculated by using the method mentioned in Section 3.3.2. For the SOC control loop, the control gains are designed based on the method presented in Section 3.3.3. Figure 11b shows the plot of the closed loop poles of the SOC loop on changing q i ’s. Here, q 1 and q 2 are increased between 10 1.5 10 2.5 and 10 0 10 7.75 , respectively. Table 4 shows the controller gains and the location of the poles for both the power control loop and the SOC control loop. The poles of the SOC control loop are selected such that its speed is several times slower than the ramp rate calculator.
The system and control parameters of the dc/ac converter are adopted based on the conventional voltage source converter (VSC) and vector control method [36,37,38] to regulate the dc voltage at 600 V. This ensures exchange of power between the dc and ac system in a desired way. The synchronous generator is simulated using the method proposed in Reference [39].

4.1.2. Results and Discussion

The simulation scenario to study the impact of abrupt PV disturbances is defined as follows. The solar intensity is initially at 1000 W / m 2 and the system is operating at steady state. The PV system supplies 14.2 kW power and there is 1.4 kW power from the ac to the dc system. At t = 5.0 s, the solar intensity drops from 1000 W / m 2 to 250 W / m 2 in a fraction of a second that drops the PV power to 3.42 kW. At t = 50 s, the solar intensity goes back abruptly to 1000 W / m 2 .
Figure 12 shows the output power response of the system. There is a sudden change in the power injected to the dc system (and then flowing into the ac system) when BES is not used. The BES smoothes down those changes and establishes an output power ramp at the desired rate. Figure 13 shows the transient response details of the PV, the BES, and the combined output powers. It confirms that the BES quickly compensates for the PV power practically without a delay.
Figure 14 shows the voltage and frequency transients at point of common coupling (PCC) of the dc and the ac system in response to the abrupt PV disturbances. The BES has reduced the peak and duration of both dc and ac voltage transients. The ac voltage (rms) experiences a peak fluctuation of close to 5.5 V (close to 5%) without the BES, and the BES limits the fluctuations within 0.1 V (practically zero). The BES has also improved the transients in the system frequency. Figure 15 shows the voltage transients at different buses in the dc system. The BES reduces the voltage transients across the entire dc system. Without the BES, this disturbances causes voltage fluctuations with peaks of over 10%. The BES reduces the peak of the transients to about 1%, and damps out the oscillations quickly. Over ten times improvement is achieved.
The ac current of the grid dc/ac converter is shown in Figure 16. When the PV power drops, the ac system supplies the deficit power to the dc system in the absence of the BES. With the proposed BES, the ac current has smooth transitions. Figure 17 shows the SOC of the BES in response to the abrupt PV disturbances. The SOC controller slowly regulates the SOC to the reference value after the disturbance is taken care without affecting the ramping behavior of the BES.

4.2. Abrupt Disturbances: Case Study 2

Figure 18 shows the total power of the proposed PV-BES system (designed in previous section) in response to the real solar intensity measured at Lowry Range Solar Station on 18 March 2013 [31] for different power ramp settings (0.5%/minute, 1%/minute, 5%/minute). It demonstrates that the BES reduces the impact of the abrupt PV disturbances and smooths the power profile with the desired ramp rate.

4.3. Daily Power Profile of PV

The ramping capability of the proposed PV-BES system can be utilized to shape the daily load profile. When the distributed PV generators are equipped with the proposed BES system, and properly commanded, the aggregated load profile can become much smoother with some desired ramp rates. This also enables peak-load reduction. To demonstrate these properties, two scenarios are studied in this section as follows.
Scenario I: Figure 19 shows the power profile of California ISO on 31 March 2019 [33] with the proposed PV-BES system. The BES charges and stores energy in the morning as the solar intensity increases and avoids sharp decline of net load. This stored energy is released in the evening when the PV generation declines and the load demand increases. Figure 19 shows the profile when both RUR and RDR of the PV-BES system are set at 1200 MW/h. With a total of 5000 MW, 19411 MWh BES systems, the ramp rate is reduced from 5300 MW/h to 2767 MW/h (almost 50%) and the peak load is reduced from 22580 MW to 18747 MW.
Scenario II: In Figure 20, the RUR is set at 1400 MW/h while the RDR is set at 1000 MW/h till 20:00 and changed to 3000 MW/h afterwards. The required BES is 5571 MW, 15201 MWh and the ramp rate of the net load is reduced to 2660 MW/h with peak load of 21535 MW.
The results are summarized in Table 5. This study concludes that by properly adjusting the RUR and RDR, both the steep ramp-up rate and the peak of the net load profile may be mitigated. The RUR and RDR may be optimally computed and supplied by a secondary controller through a low-bandwidth communication.

4.4. Experimental Results

This section presents the results of a laboratory-scale implementation of the proposed system to evaluate its performance in a basic condition where all algorithms and controls are implemented in real time. The ability of the proposed approach to counter the PV disturbances (generated using an actual PV emulator hardware and other periphery circuits) is demonstrated. The results confirm feasibility of the proposed algorithms and controls. The details are presented throughout the section.

4.4.1. Experimental Setup

Figure 21 shows a low-power laboratory-scale experimental setup built to evaluate the performance of the proposed controller in response to the abrupt PV disturbances. An Agilent E4360A modular solar array simulator is used to emulate the PV and its disturbances. It is connected to a dc grid via a standard buck converter. A dc power supply in parallel with a local load models the dc grid. Another dc supply with a local load acts as a battery, and it is connected to the dc grid via a half-bridge converter for bi-directional power flow. The proposed control method is used and realized on the micro-controller to control the two converters.
Table 6 shows the system and control parameters. The control parameters for the PV system are designed to regulate the PV voltage to 20 V (maximum power point) using the method discussed in Section 4.1.1. For the BES system, the reference power calculation and the design of the power control parameters are done using the method in Section 3.3. We have ignored the SOC control and the ac system due to limitations in experimental setup.

4.4.2. Results

Figure 22a shows the response of the system for the ramp rate setting of 1.0 W/s (for both RDR & RUR). Abrupt PV disturbances are manually applied to the PV emulator by switching from PV Curve I to PV Curve II and vice versa as specified in Table 6. When the PV conveter output increases, the battery quickly intervenes to absorb the power. Similarly, the battery supplies power when there is abrupt fall in PV converter power. With the grid voltage of 10 V, the ramp rate of 0.1 A/s in current is obtained. Figure 23 shows the results when the PV power experiences random abrupt disturbances. The study presented in this section confirms that the proposed control system can be successfully implemented in real-time on a typical hardware platform and the desired ramping rates set by the user are achieved by the combination of PV and proposed BES control system.

4.5. Comparisons

This section demonstrates comparison of the proposed method with conventional methods to execute smoothing of PV power. The comparison is done based on various qualitative parameters such as ramp calculation simplicity, plug-play level of proposed BES, coverage of converter model details, optimal control design, and inclusion of SOC control. The evaluation are done at the levels of poor, fair, average, and good. The comparisons are tabulated in Table 7.

5. Conclusions

PV power experiences abrupt changes due to the fast moving clouds which cause voltage and frequency fluctuations in the weak grid and high PV penetrations. A battery energy storage (BES) is proposed in this paper to address fast power disturbances. Furthermore, the daily profile of the solar irradiance creates sharp ramp in daily load profile, which imposes challenges on the slow conventional generators. The ramping capability of the proposed PV-BES system is utilized to smooth and improve the daily load profile in terms of its steep ramp up and peak demand. Although the concept is developed for a BES system, it can be applied to other behind-the-meter distributed assets such as small gas turbine generators. The optimal computation and communication of the storage ramp rates are the future directions of research. To mention a limitation, the proposed approach of this paper requires the BES to be co-located with the PV and have access to its terminals in order to achieve the desired power ramping of the combined PV-BES.

Author Contributions

Conceptualization, R.S. and M.K.-G.; Modeling and simulation, R.S.; Formal analysis, R.S. and M.K.-G.; Investigation, R.S.; Writing–original draft preparation, R.S. and M.K.-G.; Writing–review and editing, R.S. and M.K.-G.; Supervision, M.K.-G.; Funding acquisition, M.K.-G. All authors have read and agreed to the published version of the manuscript.

Funding

This research work was partially supported by National Science Foundation (NSF 1808368).

Conflicts of Interest

The authors declare no conflict of interest.

Abbreviations

PVPhotovoltaicBESBattery Energy Storage
DERDistributed Energy ResourcesLQRLinear quadratic regulator
MPPTMaximum power point trackingPCCPoint of common coupling
PIProportional Integratorpuper unit
RDRRamp Down RateRURRamp Up Rate
SGSynchronous generatorSOCState of Charge
ISOIndependent System Operator
Symbols and Variables
tTimekSampling instant
Δ t Change in time S sg Synchronous generator power
v sg Voltage of synchronous generatorHInertia constant
R tr Resistance of transformer X tr Reactance of transformer
V R Transformer voltage ratio V dc Dc voltage at the PCC
V ac L-L rms ac voltage at PCC L inv Filter inductance of dc/ac converter
R inv Filter resistance of dc/ac converter C dc Capacitor on dc side of dc/ac converter
V bus Voltage at PV-BES connection V bus i Voltage of i th bus
R U R Ramp up rate R D R Ramp down rate
R min Minimum ramp rate P pv PV power
P pvo Output power of PV converter Δ P Change in PV power
P r Desired output power Δ P max Maximum change in PV power
P o Total output power of PV-BES system L pv Filter inductance of PV converter
C pv Capacitor across PV terminals R pv Filter resistance of PV converter
k i pv PV control i th gain i pv PV current
i pvo Output current of PV converter v pv PV voltage
v pv ref PV reference voltage V mp PV voltage at maximum PV power
I mp PV current at maximum PV power V oc Open-circuit voltage of PV
I sc Short-circuit current of PV P b BES reference power
P soc Reference power for SOC control of BES P b Battery Power
P bo Output power of BES converter i b Battery current
i bo Output current of BES converter d b Duty cycle for BES converter
u b Control input of BES converter v b Battery voltage
V b Nominal voltage of battery S O C State of charge of BES
S O C n Nominal SOC of BES Δ S O C Change in SOC of BES
Δ S O C max Maximum change in SOC L b Filter inductance of BES converter
R b Filter resistance of BES converterQBattery capacity
Q min Minimum battery capacity k i b BES power control i th gain
k i s o c i th gain of SOC controlJCost function
q i i th weighting factor in cost function

References

  1. Al-Hallaj, S. More than enviro-friendly: Renewable energy is also good for the bottom line. IEEE Power Energy Mag. 2004, 2, 16–22. [Google Scholar] [CrossRef]
  2. Hu, J.; Li, Z.; Zhu, J.; Guerrero, J.M. Voltage Stabilization: A Critical Step Toward High Photovoltaic Penetration. IEEE Ind. Electron. Mag. 2019, 13, 17–30. [Google Scholar] [CrossRef]
  3. Administration, U.E.I. Annual Energy Outlook 2019: With Projections to 2050. 2019. Available online: https://www.eia.gov/outlooks/aeo/pdf/aeo2019.pdf (accessed on 8 April 2019).
  4. Kroposki, B.; Johnson, B.; Zhang, Y.; Gevorgian, V.; Denholm, P.; Hodge, B.M.; Hannegan, B. Achieving a 100% renewable grid: Operating electric power systems with extremely high levels of variable renewable energy. IEEE Power Energy Mag. 2017, 15, 61–73. [Google Scholar] [CrossRef]
  5. Silwal, S.; Karimi-Ghartemani, M. On Transient Responses of a Class of PV Inverters. IEEE Trans. Sustain. Energy 2019, 10, 311–314. [Google Scholar] [CrossRef]
  6. Qunais, T.; Sharma, R.; Karimi-Ghartemani, M.; Silwal, S.; Khajehoddin, S.A. Application of Battery Storage System to Improve Transient Responses in a Distribution Grid. In Proceedings of the 2019 IEEE 28th International Symposium on Industrial Electronics (ISIE), Vancouver, BC, Canada, 12–14 June 2019; pp. 52–57. [Google Scholar]
  7. Mather, B.A.; Shah, S.; Norris, B.L.; Dise, J.H.; Yu, L.; Paradis, D.; Katiraei, F.; Seguin, R.; Costyk, D.; Woyak, J.; et al. NREL/SCE High Penetration PV Integration Project: FY13 Annual Report; Technical Report; National Renewable Energy Lab. (NREL): Golden, CO, USA, 2014.
  8. Katiraei, F.; Aguero, J.R. Solar PV integration challenges. IEEE Power Energy Mag. 2011, 9, 62–71. [Google Scholar] [CrossRef]
  9. Bueno, P.G.; Hernández, J.C.; Ruiz-Rodriguez, F.J. Stability assessment for transmission systems with large utility-scale photovoltaic units. IET Renew. Power Gener. 2016, 10, 584–597. [Google Scholar] [CrossRef]
  10. Sakamuri, J.N.; Das, K.; Altin, M.; Cutululis, N.A.; Hansen, A.D.; Tielens, P.; Van Hertem, D. Improved frequency control from wind power plants considering wind speed variation. In Proceedings of the 2016 Power Systems Computation Conference (PSCC), Genoa, Italy, 20–24 June 2016; pp. 1–7. [Google Scholar]
  11. Gevorgian, V.; Booth, S. Review of PREPA Technical Requirements for Interconnecting Wind and Solar Generation; Technical Report; National Renewable Energy Lab. (NREL): Golden, CO, USA, 2013.
  12. IEEE Std 1547-2018 Standard for Interconnection and Interoperability of Distributed Energy Resources with Associated Electric Power Systems Interfaces. 2018, pp. 1–138. Available online: https://ieeexplore.ieee.org/abstract/document/8332112 (accessed on 8 April 2019).
  13. Denholm, P.; O’Connell, M.; Brinkman, G.; Jorgenson, J. Overgeneration from Solar Energy in California. A Field Guide to the Duck Chart; Technical Report; National Renewable Energy Lab. (NREL): Golden, CO, USA, 2015.
  14. Ghosh, S.; Rahman, S.; Pipattanasomporn, M. Distribution voltage regulation through active power curtailment with PV inverters and solar generation forecasts. IEEE Trans. Sustain. Energy 2016, 8, 13–22. [Google Scholar] [CrossRef]
  15. Xue, Y.; Guerrero, J.M. Smart Inverters for Utility and Industry Applications. In Proceedings of the PCIM Europe 2015; International Exhibition and Conference for Power Electronics, Intelligent Motion, Renewable Energy and Energy Management, Nuremberg, Germany, 19–21 May 2015; pp. 1–8. [Google Scholar]
  16. Bragard, M.; Soltau, N.; Thomas, S.; De Doncker, R.W. The balance of renewable sources and user demands in grids: Power electronics for modular battery energy storage systems. IEEE Trans. Power Electron. 2010, 25, 3049–3056. [Google Scholar] [CrossRef]
  17. Teleke, S.; Baran, M.E.; Bhattacharya, S.; Huang, A.Q. Rule-based control of battery energy storage for dispatching intermittent renewable sources. IEEE Trans. Sustain. Energy 2010, 1, 117–124. [Google Scholar] [CrossRef]
  18. Ceja-Espinosa, C.; Espinosa-Juárez, E. Smoothing of photovoltaic power generation using batteries as energy storage. In Proceedings of the 2017 IEEE PES—Innovative Smart Grid Technologies Conference-Latin America (ISGT Latin America), Quito, Ecuador, 20–22 September 2017; pp. 1–6. [Google Scholar]
  19. Lujano-Rojas, J.M.; Dufo-López, R.; Bernal-Agustín, J.L.; Catalão, J.P. Optimizing daily operation of battery energy storage systems under real-time pricing schemes. IEEE Trans. Smart Grid 2016, 8, 316–330. [Google Scholar] [CrossRef]
  20. Hernández, J.; Sanchez-Sutil, F.; Muñoz-Rodríguez, F. Design criteria for the optimal sizing of a hybrid energy storage system in PV household-prosumers to maximize self-consumption and self-sufficiency. Energy 2019, 186, 115827. [Google Scholar] [CrossRef]
  21. Gomez-Gonzalez, M.; Hernandez, J.; Vera, D.; Jurado, F. Optimal sizing and power schedule in PV household-prosumers for improving PV self-consumption and providing frequency containment reserve. Energy 2020, 191, 116554. [Google Scholar] [CrossRef]
  22. Alam, M.; Muttaqi, K.; Sutanto, D. A novel approach for ramp-rate control of solar PV using energy storage to mitigate output fluctuations caused by cloud passing. IEEE Trans. Energy Convers. 2014, 29, 507–518. [Google Scholar]
  23. Sangwongwanich, A.; Yang, Y.; Blaabjerg, F. A cost-effective power ramp-rate control strategy for single-phase two-stage grid-connected photovoltaic systems. In Proceedings of the Energy Conversion Congress and Exposition (ECCE), Milwaukee, WI, USA, 18–22 September 2016; pp. 1–7. [Google Scholar]
  24. Li, X.; Hui, D.; Lai, X. Battery energy storage station (BESS)-based smoothing control of photovoltaic (PV) and wind power generation fluctuations. IEEE Trans. Sustain. Energy 2013, 4, 464–473. [Google Scholar] [CrossRef]
  25. Hernández, J.C.; Bueno, P.G.; Sanchez-Sutil, F. Enhanced utility-scale photovoltaic units with frequency support functions and dynamic grid support for transmission systems. IET Renew. Power Gener. 2017, 11, 361–372. [Google Scholar] [CrossRef]
  26. Kim, N.; Parkhideh, B. Control and Operating Range Analysis of AC-Stacked PV Inverter Architecture Integrated with Battery. IEEE Trans. Power Electron. 2018, 33, 10032–10037. [Google Scholar] [CrossRef]
  27. Tran, V.T.; Islam, M.R.; Sutanto, D.; Muttaqi, K.M. Mitigation of Solar PV Intermittency Using Ramp-Rate Control of Energy Buffer Unit. IEEE Trans. Energy Convers. 2018, 34, 435–445. [Google Scholar] [CrossRef]
  28. Saxena, N.; Hussain, I.; Singh, B.; Vyas, A.L. Implementation of a Grid-Integrated PV-Battery System for Residential and Electrical Vehicle Applications. IEEE Trans. Ind. Electron. 2018, 65, 6592–6601. [Google Scholar] [CrossRef]
  29. Zhang, Q.; Sun, K. A Flexible Power Control for PV-Battery-Hybrid System Using Cascaded H-Bridge Converters. IEEE J. Emerg. Sel. Top. Power Electron. 2018, 7, 2184–2195. [Google Scholar] [CrossRef]
  30. Rallabandi, V.; Akeyo, O.M.; Jewell, N.; Ionel, D.M. Incorporating Battery Energy Storage Systems Into Multi-MW Grid Connected PV Systems. IEEE Trans. Ind. Appl. 2019, 55, 638–647. [Google Scholar] [CrossRef]
  31. Yoder, M.; Andreas, A. Lowry Range Solar Station: Arapahoe County, Colorado (Data). Available online: https://data.nrel.gov/submissions/30 (accessed on 8 April 2019).
  32. Lew, D.; Miller, N. Reaching new solar heights: integrating high penetrations of PV into the power system. IET Renew. Power Gener. 2017, 11, 20–26. [Google Scholar] [CrossRef]
  33. California ISO. Renewables and Emission Reports. Available online: http://www.caiso.com/market/Pages/ReportsBulletins/RenewablesReporting.aspx (accessed on 8 April 2019).
  34. Karimi-Ghartemani, M.; Khajehoddin, S.A.; Jain, P.; Bakhshai, A. Linear quadratic output tracking and disturbance rejection. Int. J. Control 2011, 84, 1442–1449. [Google Scholar] [CrossRef]
  35. De Brito, M.A.G.; Galotto, L.; Sampaio, L.P.; e Melo, G.d.A.; Canesin, C.A. Evaluation of the main MPPT techniques for photovoltaic applications. IEEE Trans. Ind. Electron. 2013, 60, 1156–1167. [Google Scholar] [CrossRef]
  36. Kazmierkowski, M.P.; Malesani, L. Current control techniques for three-phase voltage-source PWM converters: A survey. IEEE Trans. Ind. Electron. 1998, 45, 691–703. [Google Scholar] [CrossRef]
  37. Blaabjerg, F.; Teodorescu, R.; Liserre, M.; Timbus, A.V. Overview of Control and Grid Synchronization for Distributed Power Generation Systems. IEEE Trans. Ind. Electron. 2006, 53, 1398–1409. [Google Scholar] [CrossRef] [Green Version]
  38. Silwal, S.; Karimi-Ghartemani, M.; Sharma, R.; Karimi, H. Impact of Feed-forward and Decoupling Terms on Stability of Grid-Connected Inverters. In Proceedings of the 2019 IEEE 28th International Symposium on Industrial Electronics (ISIE), Vancouver, BC, Canada, 12–14 June 2019; pp. 2641–2646. [Google Scholar] [CrossRef]
  39. Silwal, S.; Taghizadeh, S.; Karimi Ghartemani, M.; Hossain, J.; Davari, M. An Enhanced Control System for Single-Phase Inverters Interfaced with Weak and Distorted Grids. IEEE Trans. Power Electron. 2019, 34, 12538–12551. [Google Scholar] [CrossRef]
Figure 1. Solar intensity measured at Lowry Range Solar Station on 18 March 2013 [31].
Energies 13 01024 g001
Figure 2. A hybrid dc/ac system to study the abrupt power disturbances of the photovoltaic (PV) generator.
Energies 13 01024 g002
Figure 3. Voltage and frequency fluctuations at point of common coupling (PCC) of the study system due to the abrupt PV disturbances.
Energies 13 01024 g003
Figure 4. Load profile of California ISO; (a) Load demand and generation on 31 March 2019, and (b) net load profile on March 31 for last 5 years (2015-19) [33].
Energies 13 01024 g004
Figure 5. Structure of proposed PV-battery energy storage (BES).
Energies 13 01024 g005
Figure 6. Operational scenario of the BES.
Energies 13 01024 g006
Figure 7. BES converter system.
Energies 13 01024 g007
Figure 8. Mathematical model of the BES converter system with the proposed controller.
Energies 13 01024 g008
Figure 9. Flowchart to calculate power ramp reference for the BES.
Energies 13 01024 g009
Figure 10. PV converter system and its control.
Energies 13 01024 g010
Figure 11. Poles of (a) the power, and (b) the state-of-charge (SOC) loops of BES.
Energies 13 01024 g011
Figure 12. Top: solar irradiance, Bottom: powers of the PV and BES system response to the solar irradiance.
Energies 13 01024 g012
Figure 13. Power transients of the PV-BES system to PV disturbances.
Energies 13 01024 g013
Figure 14. Voltage and frequency due to the abrupt PV disturbances.
Energies 13 01024 g014
Figure 15. Dc system voltages due to the abrupt PV disturbances.
Energies 13 01024 g015
Figure 16. Inverter’s ac current due to the abrupt PV disturbances.
Energies 13 01024 g016
Figure 17. SOC of the BES during and after the abrupt PV disturbances.
Energies 13 01024 g017
Figure 18. Output power of the proposed PV-BES system for different ramp settings in response to the real solar irradiance data.
Energies 13 01024 g018
Figure 19. Shaping of Daily Load Profile: Scenario I.
Energies 13 01024 g019
Figure 20. Shaping of Daily Load Profile: Scenario II.
Energies 13 01024 g020
Figure 21. Experimental setup.
Energies 13 01024 g021
Figure 22. Experimental results: (a) ramp up response, and (b) ramp down response.
Energies 13 01024 g022
Figure 23. Experimental result: ramp up/down response for random PV power changes.
Energies 13 01024 g023
Table 1. Parameters of dc system.
Nominal Bus Voltage: 600 V
Loads:
Load 0: 1.5 kWLoad 1: 0.5 kWLoad 2: 1.5 kW
Load 3: 2.0 kWLoad 4: 1.5 kWLoad 5: 5.0 kW
Load 6: 4.4 kW
Lines:
LineLengthResistanceInductance
Line1g0.75 km0.482 Ω0.198 mH
Line120.5 km0.321 Ω0.132 mH
Line230.3 km0.0.193 Ω0.079 mH
Line340.5 km0.321 Ω0.132 mH
Line450.5 km0.321 Ω0.132 mH
Line561 km0.642 Ω0.264 mH
PV system:
Rated power: 15 kW at 1000 W/m2, 1000 V
Table 2. Parameters of ac system.
Synchronous Generator (SG):
Power ( S sg ): 250 kVA, voltage ( v sg ): 12.47 V
Inertia constant (H): 5.0
Loads:
ac load 0: 0.05 pu,      ac load 1: 0.846 pu
Ac Line:
200 km, 32.2 Ω, 120.96 mH
Transformer:
Resistance ( R tr ): 0.02 pu, Reactance ( X tr ): 0.05 pu
Voltage ratio (VR): 207.8 V/12.47 kV
Three-phase dc/ac Converter:
ParameterSymbolValue
Filter inductance L inv 10 mH
Filter resistance R inv 10 mΩ
Dc capacitor C dc 1200 μF
Voltage on dc side V dc 600 V
Voltage on ac side V ac 207.8 V
Table 3. Parameters of PV system.
PV System:
15 kW @ 1000 W / m 2 and 1000 V
V bus : 600 V
Converter:
C pv : 400 μ F , L pv : 10 mH , R pv : 10 mΩ
Controller:
Switching Frequency: 10 kHz
Control Gains:
k 1 pv : −316.22, k 2 pv : 3.07, k 3 pv : 31.62
k 4 pv : 344.49, k 5 pv : 1.38, k 6 pv : −0.59
Table 4. BES system parameters.
BES System:
V b : 1000 V,  RUR/RDR: 30%/minute ≈75 W/s
V bus : 600 V,  Δ P max : 15 kW,  Δ S O C max : 30%
Q min : 5040 As,  Choose Q: 5400 As
Converter: L b :10 mH, R b :10 mH
Controller:
Switching Frequency: 10 kHz
Power Control:
With    q 1 : 316.22,  q 2 : 0.0001
Poles:   789.6 ± j 665.9
Gains:   k 1 b : −17.78,  k 2 b : 0.0263
SOC Control:
With    q 1 : 316.22,   q 2 : 5.62 × 10 7
Poles  −0.0015 ± j0.0011
Gains:   k 1 soc : 17.7828,  k 2 soc : −15,757
Table 5. Impact of ramp rate settings on daily power profile.
S.NRamp SettingBES SizeMaximum Ramp
in Net Load
Peak Net
Load
PowerEnergy
1No BES--530022,580
2RUR: 1200 MW/h5000 MW19,411 MWh2767 MW/h18,747 MW
RDR: 1200 MW/h
3RUR: 1400 MW/h5571 MW15,201 MWh2660 MW/h21,535 MW
RDR: 1000 MW/h till 20:00
RDR: 3000 MW/h after 20:00
Table 6. Experimental setup parameters.
Modular Solar Array Simulator:
PV Curve I: V mp : 20.0 V,   I mp : 0.3 A,   V oc : 23.0 V,   I sc : 0.5 A
PV Curve II: V mp : 20.0 V,   I mp : 2.0 A,   V oc : 23.0 V,   I sc : 2.5 A
PV converter: L pv : 1 mH,   R pv : 0.2587  Ω ,   C pv : 100μF
BES and converter: V b : 30.0 V,  Local Load: 30  Ω , L b : 1 mH,   R b : 0.250 Ω
Dc bus: V bus : 10.0 V,  Local Load: 2 Ω
Controller:
Switching Frequency: 32 kHz
PV converter control gains
k 1 pv : −56.23,   k 2 pv : 0.18,   k 3 pv : 10.00,   k 4 pv : 382.76,   k 5 pv : 1.02,   k 6 pv : −0.16
BES controller settings
RUR & RDR: 1.0 W/s, Control Gains: k 1 b = −5.6234,   k 2 b = 0.0189 (Power control)
Table 7. Qualitative comparison of proposed method with existing methods.
ReferencesSmoothing MethodRamp Calculation SimplicityPlug-and-Play LevelModel DetailsSOC Control DesignOptimal Control Design
[24]RampAveragePoorFairNoNo
[22]RampFairPoorFairNoNo
[25]P-f droopAverageFairAverageNoNo
[26]RampFairPoorAverageNoNo
[27]Ramp, Constant powerFairFairAverageNoNo
[28]Constant powerAverageFairAverageNoNo
[29]Constant powerAveragePoorAverageNoNo
[30]Moving average, P-f droopFairPoorPoorNoNo
Proposed methodRampGoodGoodGoodYesYes

