Article

Simulating the Effect of Torrefaction on the Heating Value of Barley Straw

by
Dimitrios K. Sidiras
*,
Antonios G. Nazos
,
Georgios E. Giakoumakis
and
Dorothea V. Politi
Laboratory of Simulation of Industrial Processes, Department of Industrial Management and Technology, School of Maritime and Industrial Studies, University of Piraeus, 80 Karaoli & Dimitriou, GR 18534 Piraeus, Greece
*
Author to whom correspondence should be addressed.
Energies 2020, 13(3), 736; https://doi.org/10.3390/en13030736
Submission received: 29 December 2019 / Revised: 28 January 2020 / Accepted: 5 February 2020 / Published: 7 February 2020

Abstract

:
Many recent studies focused on the research of thermal treated biomass in order to replace fossil fuels. These studies improved the knowledge about pretreated lignocellulosics contribution to achieve the goal of renewable energy sources, reducing CO2 emissions and limiting climate change. They participate in renewable energy production so that sustainable consumption and production patterns can by ensured by meeting Goals 7 and 12 of the 2030 Agenda for Sustainable Development. To this end, the subject of the present study relates to the enhancement of the thermal energy content of barley straw through torrefaction. At the same time, the impact of the torrefaction process parameters, i.e., time and temperature, was investigated and kinetic models were applied in order to fit the experimental data using the severity factor, R0, which combines the effect of the temperature and the time of the torrefaction process into a single reaction ordinate. According to the results presented herein, the maximum heating value was achieved at the most severe torrefaction conditions. Consequently, torrefied barley straw could be an alternative renewable energy source as a coal substitute or an activated carbon low cost substitute (with/without activation treatment) within the biorefinery and the circular economy concept.

Graphical Abstract

1. Introduction

Fossil fuels, such as oil, gas and coal, are the world’s primary energy sources. However, these resources have limited reserves that will only be sufficient for the next 50 years [1,2]. Fossil fuels also make a significant contribution to the environmental impact of carbon dioxide emissions. Reductions in CO2 emissions through the use of renewable energy aim to reduce greenhouse gas emissions from 1990 to 2030 by 40% and reduce greenhouse gas emissions by 80%–95% by 2050 [3,4,5,6]. It is imperative that we use natural resources to achieve the goals of the 2030 agenda so that the needs of the present situation and the satisfaction of future ones will be covered [7].
The use of renewable energy sources and particularly, of biomass, is important due to the economic factor, since the use of cheaper energy resources is more selective, enhancing the conservation of clean environment, as natural, abundant and reusable means of producing thermal energy are mostly in use [8]. Biomass is becoming more promising due to a set of features that allow fossil fuel substitution, thereby reducing greenhouse gas emissions [9,10]. Biomass is one of the major sources of renewable energy, accounting for about 10% of total primary energy and 78% of total renewable energy [11]. Thus, the need to utilize non-wood lignocellulosic biomass as a promising raw material for future renewable fuels is widely recognized, since the latter is in abundance [12,13]. Lignocellulosic biomass, while presenting several positive features, is, however, associated with various deficiencies, such as structural heterogeneity, non-uniform physical properties, low energy density, hygroscopic nature and low bulk density. All of these features create difficulties in transport, handling, storage, and conversion [14,15,16,17,18]. These features impede the use of biomass in the replacement of fossil fuels for energy production. Therefore, biomass must be pre-treated before it can be used in any thermochemical process. The torrefaction process is an appropriate such pretreatment method that removes many of the above limitations associated with crude biomass. The torrefaction process is the partial pyrolysis of the biomass which is carried out usually under atmospheric pressure over a small temperature range of 200–300 °C and under an inert environment [19,20,21]. The process is usually performed at a low heating rate, which gives a higher yield of solid product [22]. A great motivation for torrefaction is the maximization of solid performance, which is not achieved with pyrolysis. During the torrefaction process, three major phases, namely decomposition, rehabilitation and depolymerization, occur. The process releases concentrated hydrocarbons, hydrogen, oxygen and some of the carbon content of the biomass as carbon monoxide and carbon dioxide [23]. During the torrefaction process, drying is considered to be the most destructive between the intramolecular hydrogen bonds, C–O and C–H [24]. This results in the significant emissions of hydrophilic and oxygenated pollutants, and hydrophilic and oxygenated compounds, forming a black hydrophobic energy-dense product.
The main motivation of torrefaction is to improve the quality of biomass fuels and make it more suitable for energy use. The torrefied biomass can be applied in briquetting, pelletizing, gasification and thermal energy cogeneration [5,25,26]. Biomass torrefaction destroys biomass strength and fibrous structure and also increases energy density. Many studies have concluded that torrefied biomass can avoid many constraints associated with crude biomass because it produces moisture-free hydrophobic solid products [27], reduces the O/C ratio [13], decreases milling energy [15,28], increases energy density [29], increases bulk density and simplifies storage and transport [30]. It also improves particle size distribution [15], strengthens burning with less smoke [31], shifts the combustion zone to the high temperature zone in a gasifier [32] and increases resistance to biological decomposition [33]. Therefore, the torrefied biomass is more appropriate than the raw biomass for co-firing in the conventional coal power plants due to many of these improvements, as mentioned above. In addition, torrefied biomass is more appropriate than crude biomass for eligible fuel in conventional coal-fired power plants [20]. The removal of volatiles during torrefaction process leads to a decrease of the O/C ratio, and to an increase the energy density of the biomass [34].
In the present study, the process of torrefaction caused by muffle furnace on barley straw under different experimental conditions was studied, aiming at increasing the energy content of barley straw. Barley straw was placed in a porcelain capsule and was heated using a muffle furnace for various experiments with different sets of temperatures and residence times, allowing the critical parameters of the combustion process to be identified and affecting the energy content of the material. Furthermore, innovative kinetic models were applied to fit the experimental data using the severity factor (R0), which combines the effect of temperature and time on the torrefaction process in a single reaction operator.

2. Materials and Methods

2.1. Material Development

Barley straw was collected from the Kapareli village of Thebes, Greece (38°14′8“ N 23°12′59” E) and it was manually treated and prepared in small bunches. The specific fraction was considered to be suitable because in this way, homogeneity could be achieved when the torrefaction procedure was over. The untreated straw moisture was 6.0% w/w measured according to the procedure UNE-EN ISO 18134-1: 2015.

2.2. Torrefaction Process

The torrefaction process was applied to barley straw through a muffle furnace. The experimental setup is presented in Figure 1. The muffle furnace temperature was in room temperature at zero torrefaction time. The heat increase curve was from 20 °C up to 300 °C. Each experiment had a different reaction time. The time was increased by 2.5 min from 15 min to 50 min (see Table 1).
Therefore, barley straw was placed in a porcelain capsule and after the process was completed, it was removed from the muffle furnace and finally, it was placed in a dryer for 15 min. Then, the char weight in the capsule was measured. The higher heating value was measured experimentally using an adiabatic bomb calorimeter, which measures the enthalpy change between reagents and products.

2.3. Bomb Calorimeter

In order to take the necessary measurements, a Parr 1341 Plain Jacket Bomb Calorimeter was used. In more detail, from the samples obtained after torrefaction for a given time, we accurately weighed quantities of about 0.5 g. Then, the 0.5 g was placed in the oxygen container with the pressure of 25 bar oxygen and a specific length of ignition wire. The combustion container was placed in the calorimeter’s adiabatic tank, which contained 2000 g distilled water shaken at a steady speed while the temperature was measured per minute. Accordingly, two ignition lead wires were pushed into the terminal sockets on the bombs’ head, the cover was set on the jacket and the stirrer was turned manually in order to ensure that it ran freely. Upon turning of the stirrer, the drive belt slipped onto the pulleys and the motor started operating.
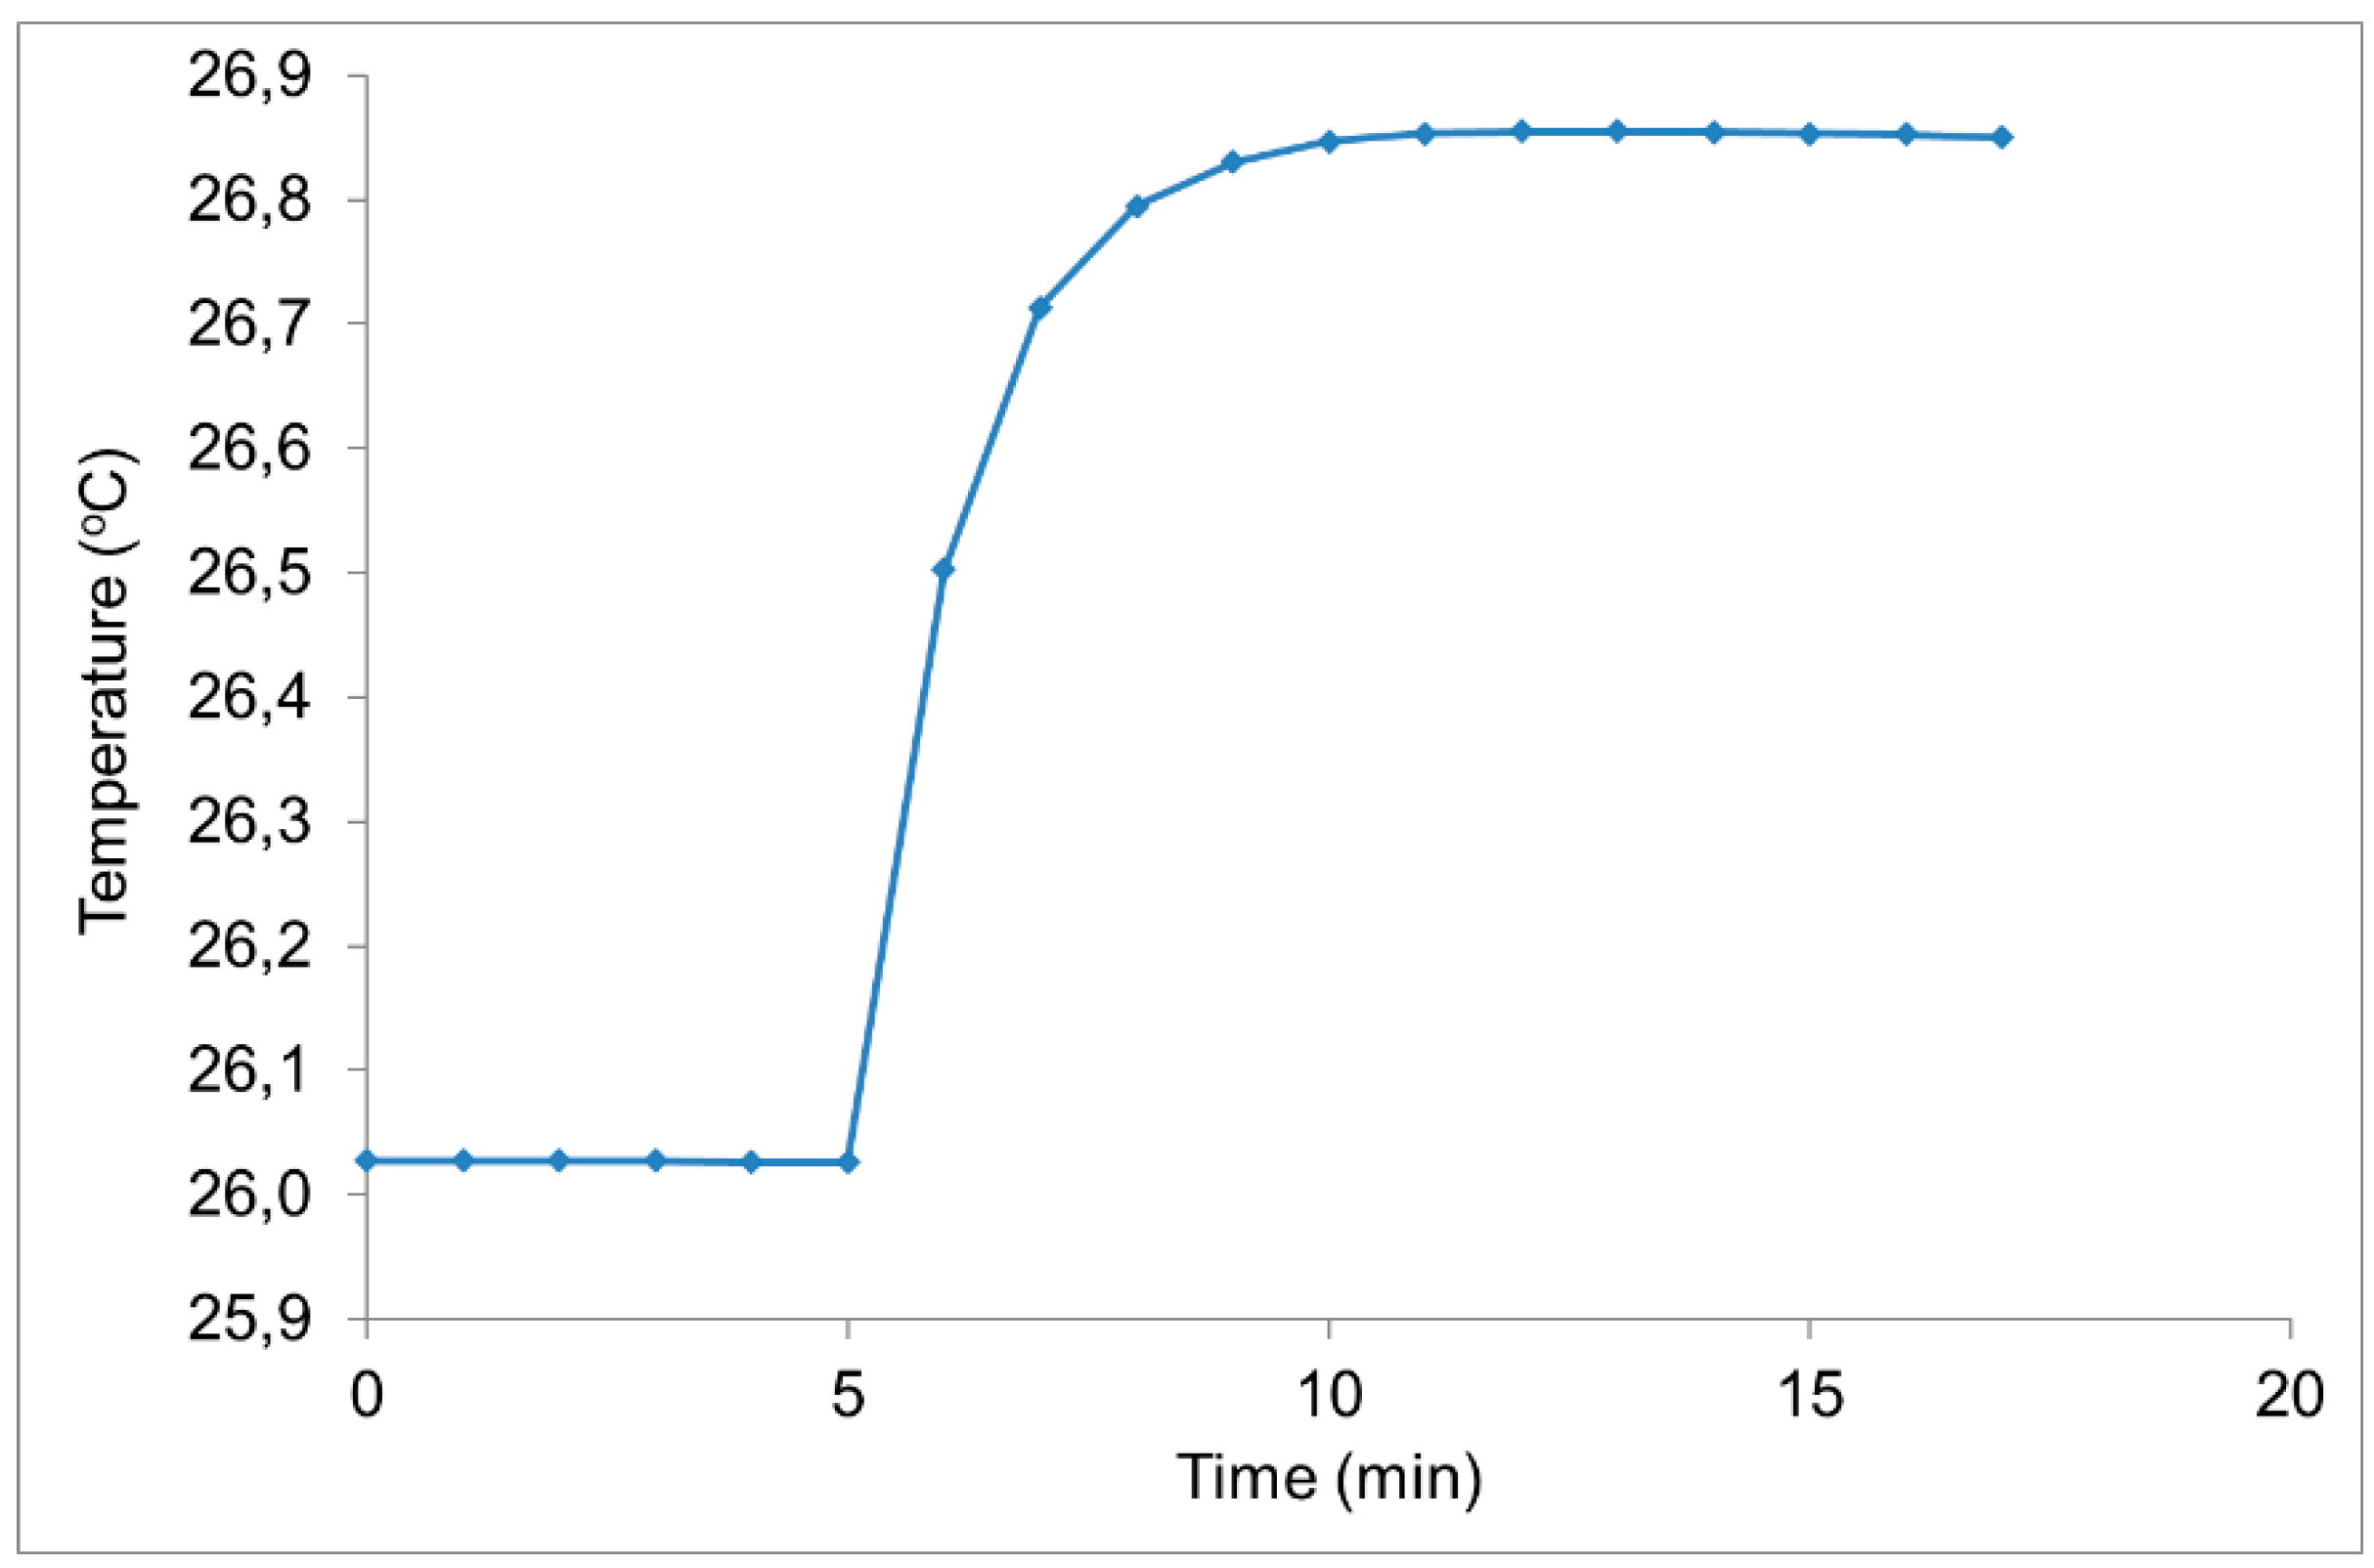
With regards to temperature indications, they were measured manually with the help of a 6775 Parr Digital Thermometer each minute for 5 min in order to achieve equilibrium into the calorimeter. More specifically, at the start of the sixth minute, the ignition button was pushed and temperature measurements were taken each minute until the temperature became stable again. As such, the increase of the temperature was intense during the first minutes and slowed down when reaching the stage equilibrium. The energy equivalent of the calorimeter was determined by its standardization at 10,104 J/°C. The energy equivalent due to the formation of nitric acid and sulfuric acid was not included in the calculations while the moisture content of the samples was 6.0%.
Additionally, two ignition lead wires were pushed into the terminal sockets on the bombs’ head, the cover was set on the jacket, and the stirrer was turned manually in order to ensure that it ran freely. Upon turning of the stirrer, the drive belt slipped onto the pulleys and the motor started operating. In this context, the diagram of Figure 2 depicts the temperature profile and how the latter is affected during the different stages described earlier.

2.4. Ultimate Analysis

Proximate and ultimate analysis provided information on the major categories that are important for the thermal conversion of biomass such as moisture, Volatile Matter (VM), ash, carbon etc. The moisture content of the samples was measured by drying according to the procedure UNE-EN ISO 18134-1: 2015; the nitrogen, carbon and hydrogen percentages were determined according to the UNE-EN ISO 16948: 2015 standard, the VM by the UNE-EN ISO 18123: 2015, the sulfur by UNE-EN ISO 16994: 2015, and the oxygen by difference. The measurement was conducted by the Centre for Research & Technology Hellas/Chemical Process and Energy Resources Institute (CERTH/CPERI), Athens branch. The proximate and ultimate analysis data for untreated and torrefied barley straw are presented in Table 2. The torrefaction conditions were for the optimal heating value.

2.5. Scanning Electron Microscopy

The observation the surface morphology pattern changes of the untreated and torrefied barley straw was conducted by scanning electron microscopy (SEM) at the Institute of Nanoscience and Nanotechnology, National Centre for Scientific Research “Demokritos”, Athens, using an FEI INSPECT SEM equipped with an EDAX super ultra-thin window analyzer for energy-dispersive X-ray spectroscopy (EDS).

3. Results and Discussion

The kinetics of higher heating value combustion of untreated and torrefied barley straw have been extensively studied using ISO 1716:2018 [35]. To this end, the well-known higher heating value of combustion equation is shown below:
Hg = (tW − e1 − e2 − e3)/m
where Hg represents the higher heating value of combustion, “m” stands for the mass of the sample in grams, e1 refers to a correction coefficient concerning calories for heat of formation of nitric acid, e2 to a correction coefficient concerning calories for heat of formation of sulfuric acid and e3 to a correction coefficient for calories or heat of combustion of fuse wire. For the given case, both e1 and e2 are taken as being equal to zero since neither nitric acid nor sulfuric acid were used. Moreover, W is the energy equivalent of the calorimeter, which is determined under standardization and t is the net-corrected temperature increase, with equations following further analyzing the above variables.
t = tc − ta − r1(b − a) − r2(c − b)
e3 = 2.3lf
W = 10,104 J/℃
To this end, a stands for the time of firing, b for the time when the temperature reaches 60% of the total rise and c for the time at the beginning of period in which the rate of temperature change is constant. Next, ta corresponds to the temperature at firing time and tc the temperature at time c, r1 is the rate at which the temperature was rising until firing and r2 is the rate at which the temperature is rising during the 5 min period after the time c. Finally, lf is the size of the fuse wire consumed during the firing.
A severity factor was used in order to integrate the effects of reaction times and temperature into a single variable during torrefaction. In this context, a ‘combined severity factor’ for isothermal reactions was based on the ‘P’ factor, first introduced at 1965 by Brasch and Free [36], for the prehydrolysis-Kraft pulping of pinus radiata, and then at 1987 (under the name ‘reaction ordinate’) applied by Overend and Chornet [37] in the case of fractionation of lignocellulosics by steam-aqueous pretreatments (like wet torrefaction). The ‘P’ factor had units of time and was as follows:
(‘P’ factor) = [exp(T − 100)/14.75]·t
where t is the reaction time in min and T is the reaction temperature in degrees Celsius.
Moreover, in the case of torrefaction for high energy density solid fuel of fast-growing tree species, the following severity factor was used [38]:
S F = log [ t · e T h T R 14.75 ]
where t is the reaction time of the torrefaction in min, Th the reaction temperature and TR the reference temperature, both in degrees Celsius.
In addition to the above, a combined severity factor for non-isothermal reaction conditions was also introduced in the case of the batch autohydrolysis of wheat straw [39],
R 0 * = 10 p H · 0 t e T θ 100 14.75 d t
where Tθ is the reaction temperature in degrees Celsius.
At this point, it should be noted that since, in this work, the main variables used are time and temperature, pH was removed from the equation, with the simplified severity factor used for non-isothermal reaction conditions given in the following equation:
R 0 = 0 t e T θ 100 14.75 d t
A similar severity factor was used by Aguado et al. [40] for wet torrefaction of almond-tree pruning. On the other hand, a severity index was used by Zhang et al. [41] for spend coffee grounds and microalga residue torrefaction. Several torrefaction severity reporting methods were reported by Campbell et al. [42], while the dry mass yield was suggested as an indicator for severity presuming that was the most reliable singular severity indicator for bench and pilot scale work.
Consequently, in the present work, the severity factor values according to Equation. (8) and for each of the experiments carried out are provided in Table 1. Therefore, the gradual reduction of the test sample mass from starting time (m0) until the end of each experiment (mt) is used, with the parameter of solid residue yield showing the percentage of the mass loss over torrefaction time.
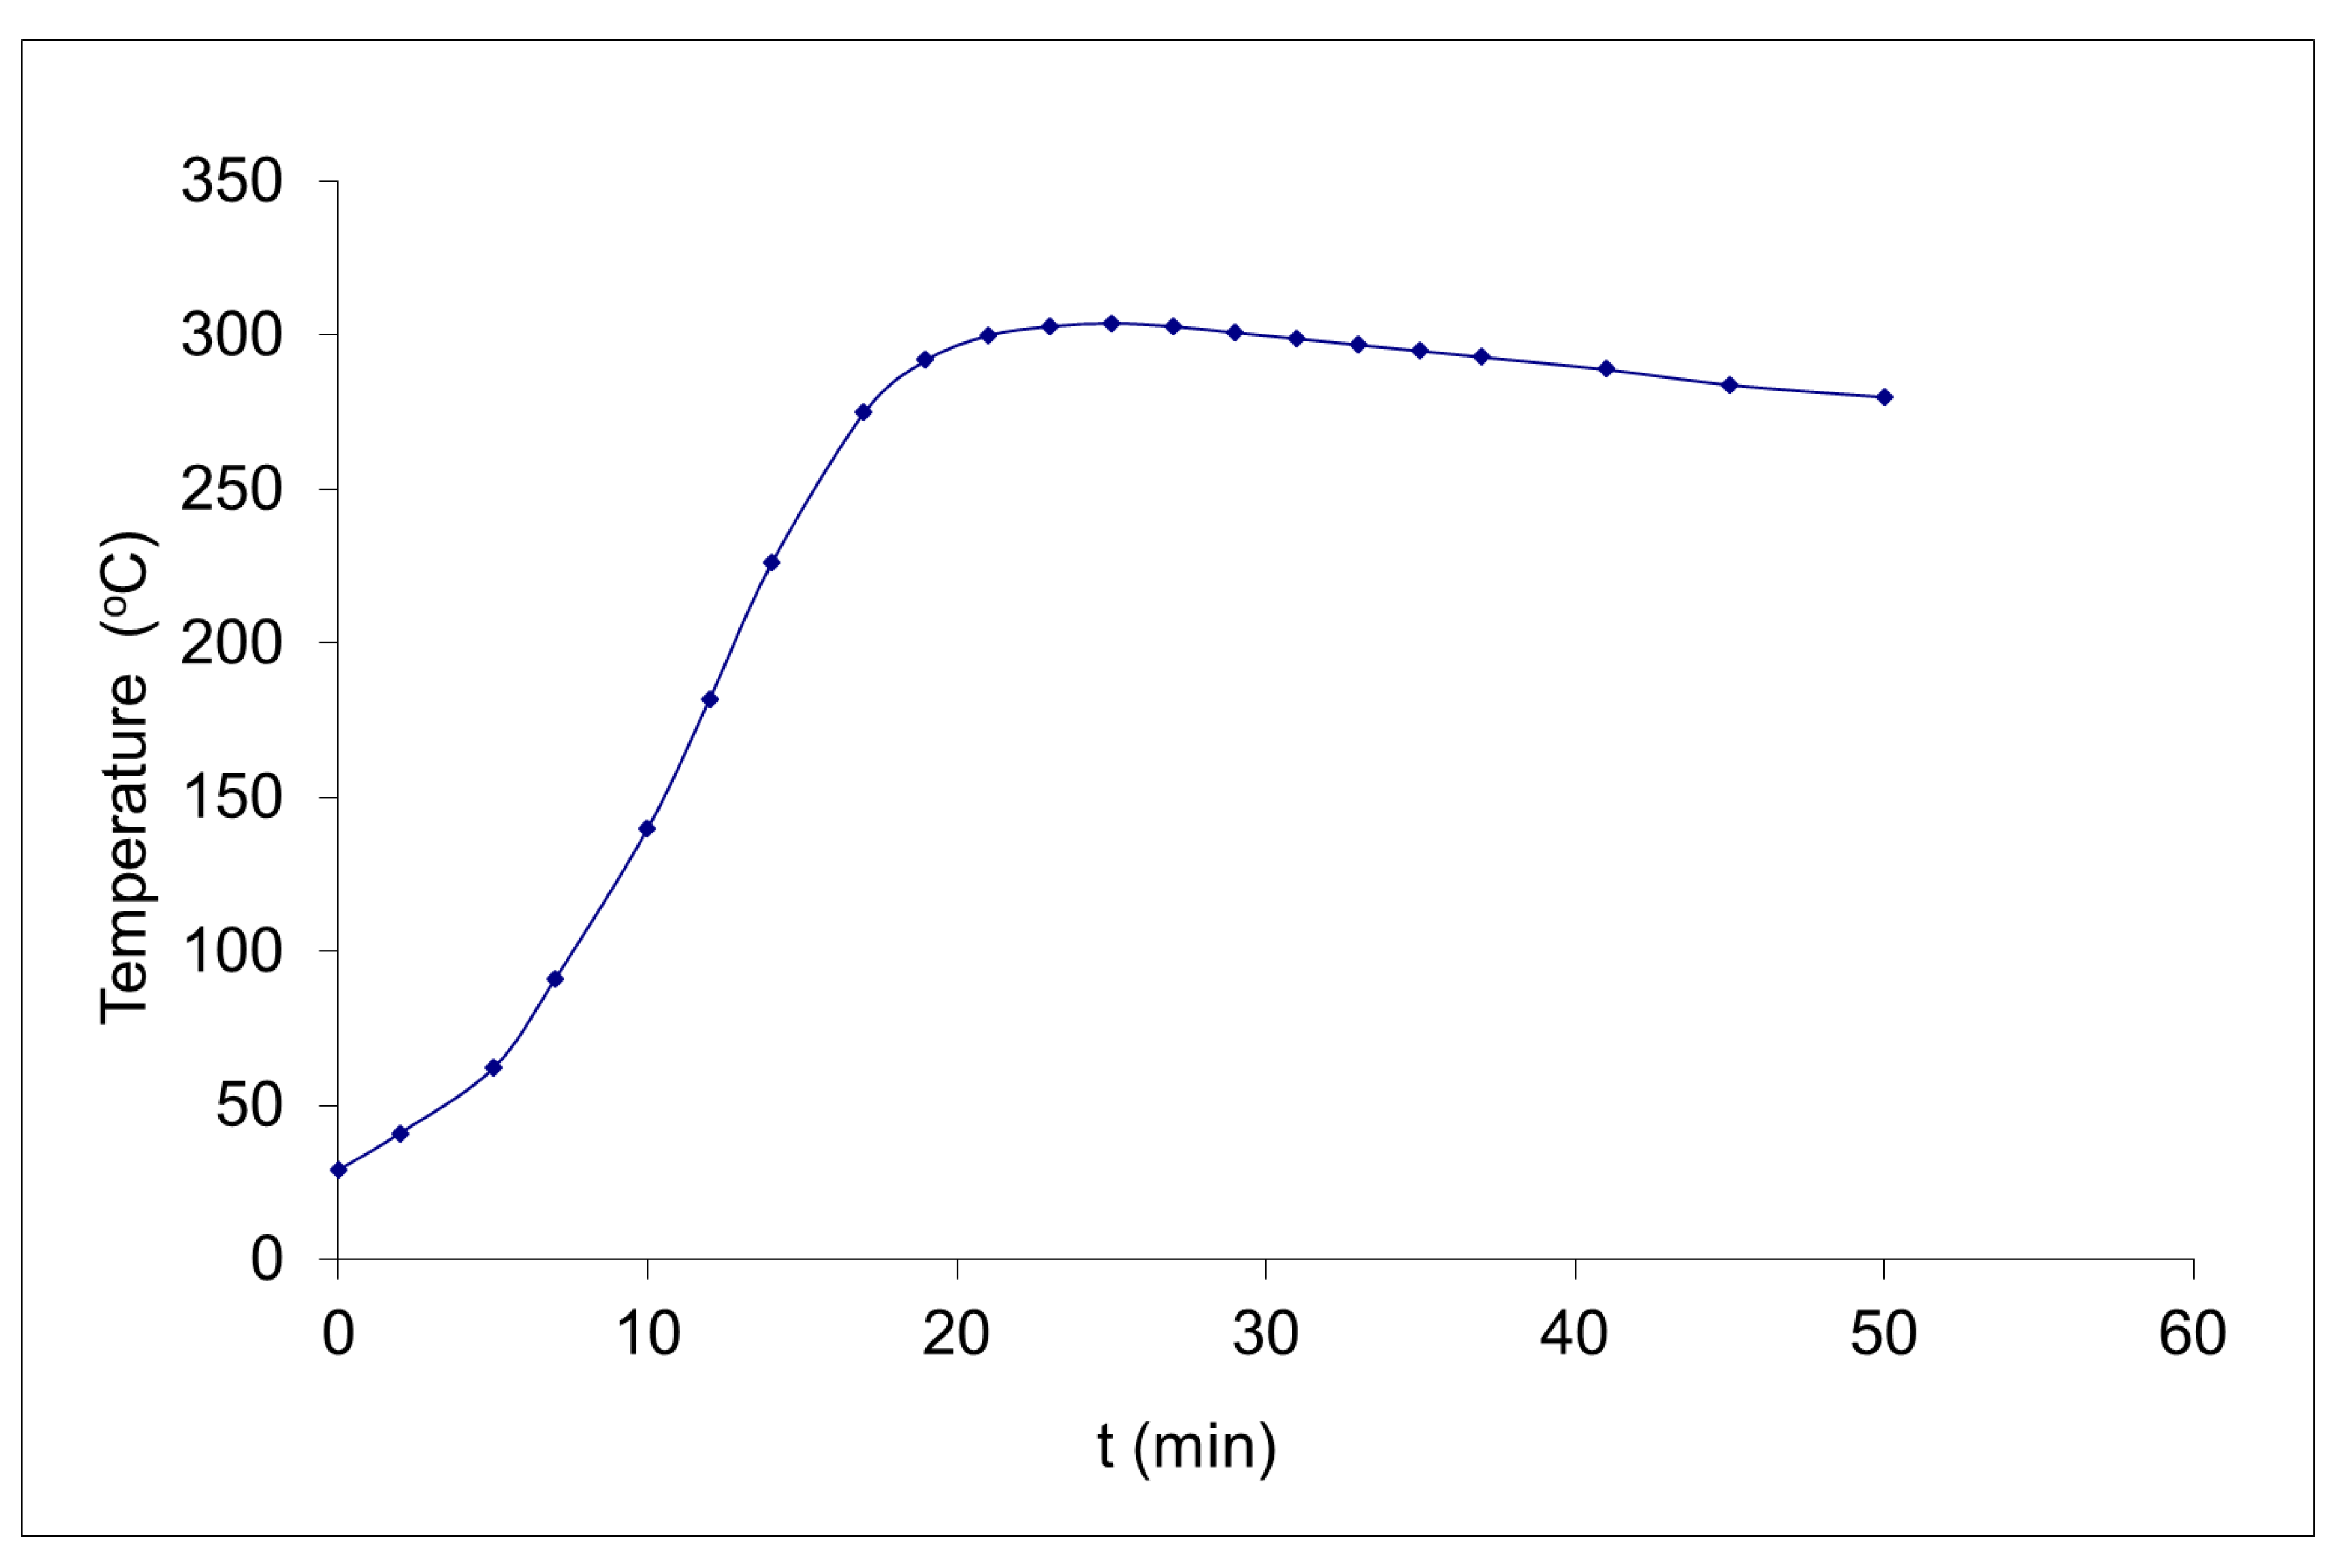
In this context, the diagram of Figure 3 depicts the temperature profile and how the latter is affected during the time stages described earlier. An example of temperature profiles at different times of the muffle furnace during torrefaction of 300 °C is shown in this Figure. The preheating time in the case of 300 °C was around 25 min, because the initial temperature in the furnace was about 30 °C, i.e., the furnace was cold (not preheated). Similar temperature measurements were done at each torrefaction time for the muffle furnace.
Moreover, in Figure 4 the percentage of loss of mass during the torrefaction procedure following illustrates the impact of the time (Figure 4a), severity factor (Figure 4b), and logarithm of severity factor (Figure 4c) on the solid residue yield percentage decrease, with the latter showing a rapid reduction for small severity factor values which is gradually almost stabilized for higher severity factor values. Increased weight loss occurs when torrefaction temperature is also increased due to moisture removal and hemicellulose breakdown which produced H2O, CO, CO2 and other hydrocarbons. Finally, the following equations describe the exponential relation between the yield (y) and the time (t) or the severity factor (R0 or logR0), with the equation parameters given in Table 3.
Model A1: y = ye + (y0ye)exp(−kt)
where ye is the value for y at infinite time, y0 is the value for y at zero time, and k is the pseudo-first order kinetic constant.
Model A2: y = ye + (y0ye)exp(−kR0)
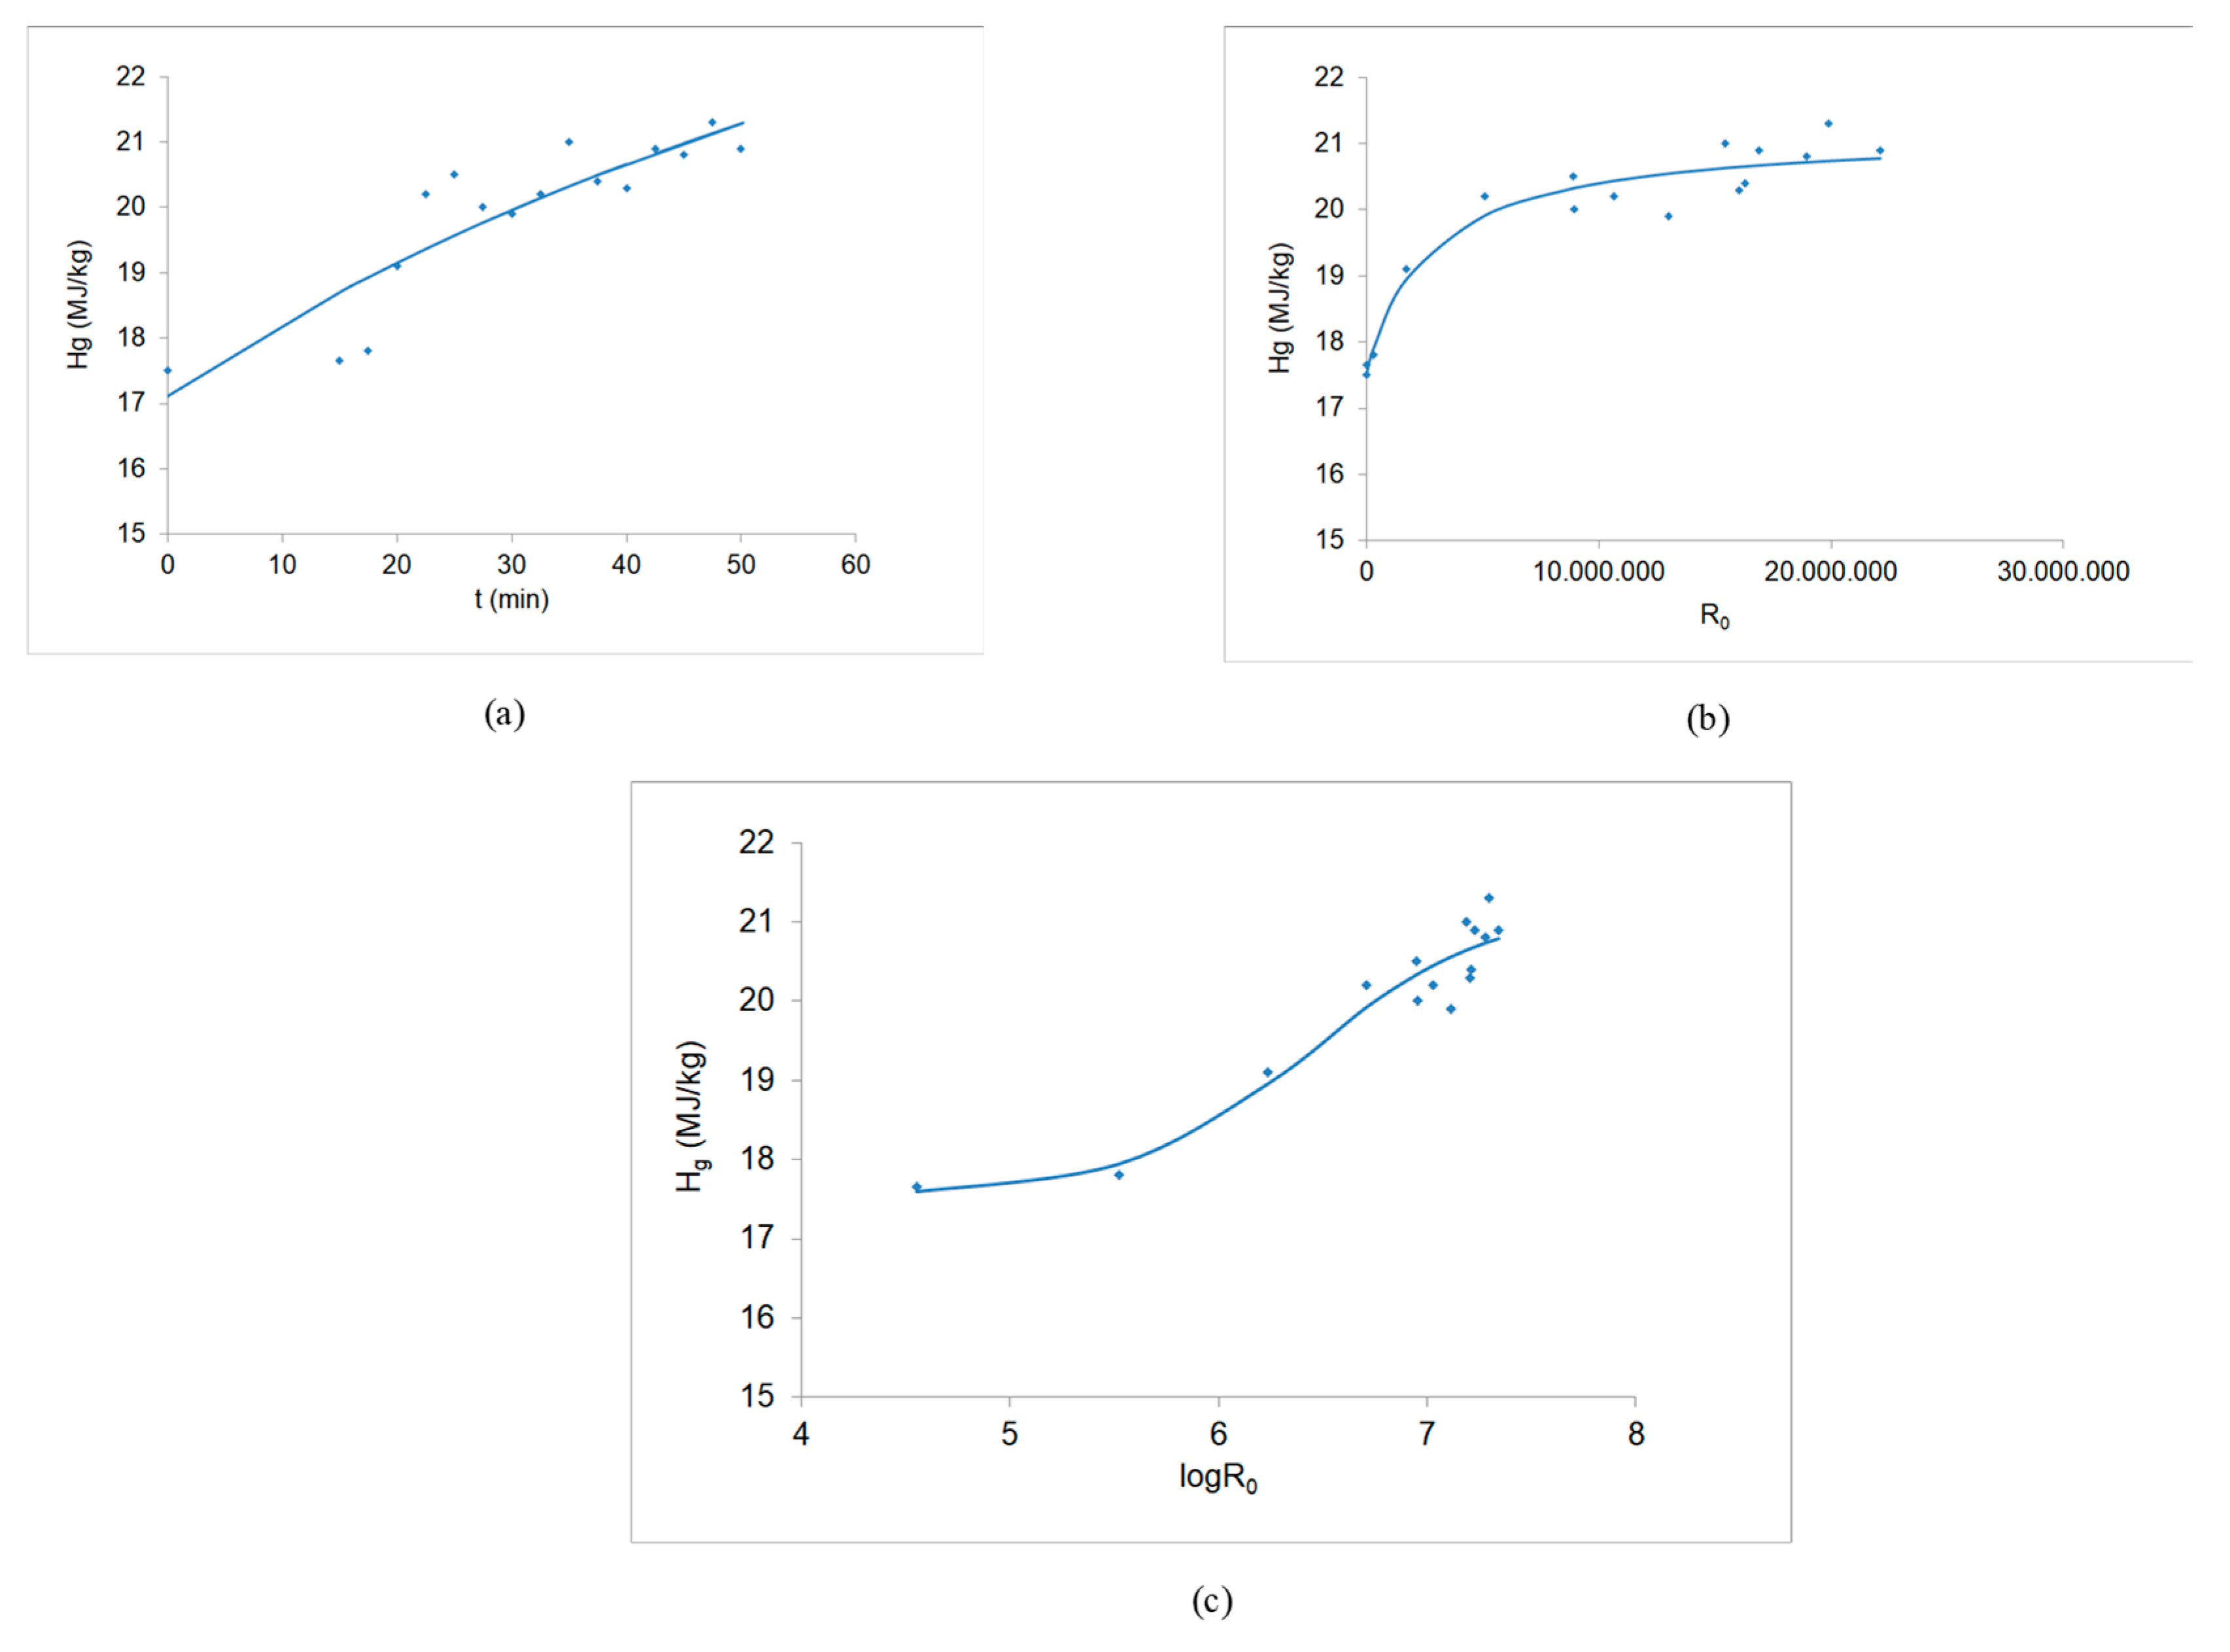
It must be mentioned Model A3 is described by the same Equation (10) as Model A2, but its parameters were estimated without taking into account the experimental value for y at zero time. The standard error of estimate (SEE) values for these tree models are presented in Table 3, showing that the best fitting to the experimental data was for Model A3. The fitting of these three models is illustrated in Figure 4a,b and c for Model A1, A2 and A3, respectively.
Moreover, Figure 5 demonstrates the Higher Heating Value (Hg) of barley straw combustion vs. torrefying reaction time (Figure 5a), severity factor (Figure 5b), and logarithm of severity factor (Figure 5c). To this end, according to the experimental results obtained, the optimal time that gives the maximum output (Hg = 21.3 MJ.kg) was 47.5 min, where Hg increases by 21.7%. On the other hand, the gross heat of combustion for the untreated barley straw was measured a total of three times, with the average value found to be 17.5 MJ/kg and the standard deviation 0.17 (1.0%). Therefore there is an increase of Hg during conditions intensification. After all, the following equations describe the relation between the Hg and the time (t) or the severity factor (R0 or logR0) with the equation parameters given in Table 4.
Model B1: Hg = Hge − [(HgeHg0)−1 + k1t]−1
where Hge is the value for Hg at infinite time, Hg0 is the value for Hg at zero time, and k1 is the pseudo-second order kinetic constant.
Model B2: Hg = Hge − [(Hge Hg0)−1 + k1R0]−1
It must be mentioned the Model B3 is described by the same Equation (12) as Model B2, but its parameters were estimated without taking into account the experimental value for Hg at zero time. The SEE values for these tree models are presented in Table 4, showing that the best fitting to the experimental data was for Model B2. The fitting of these three models is illustrated in Figure 5a–c for Models B1, B2 and B3, respectively.
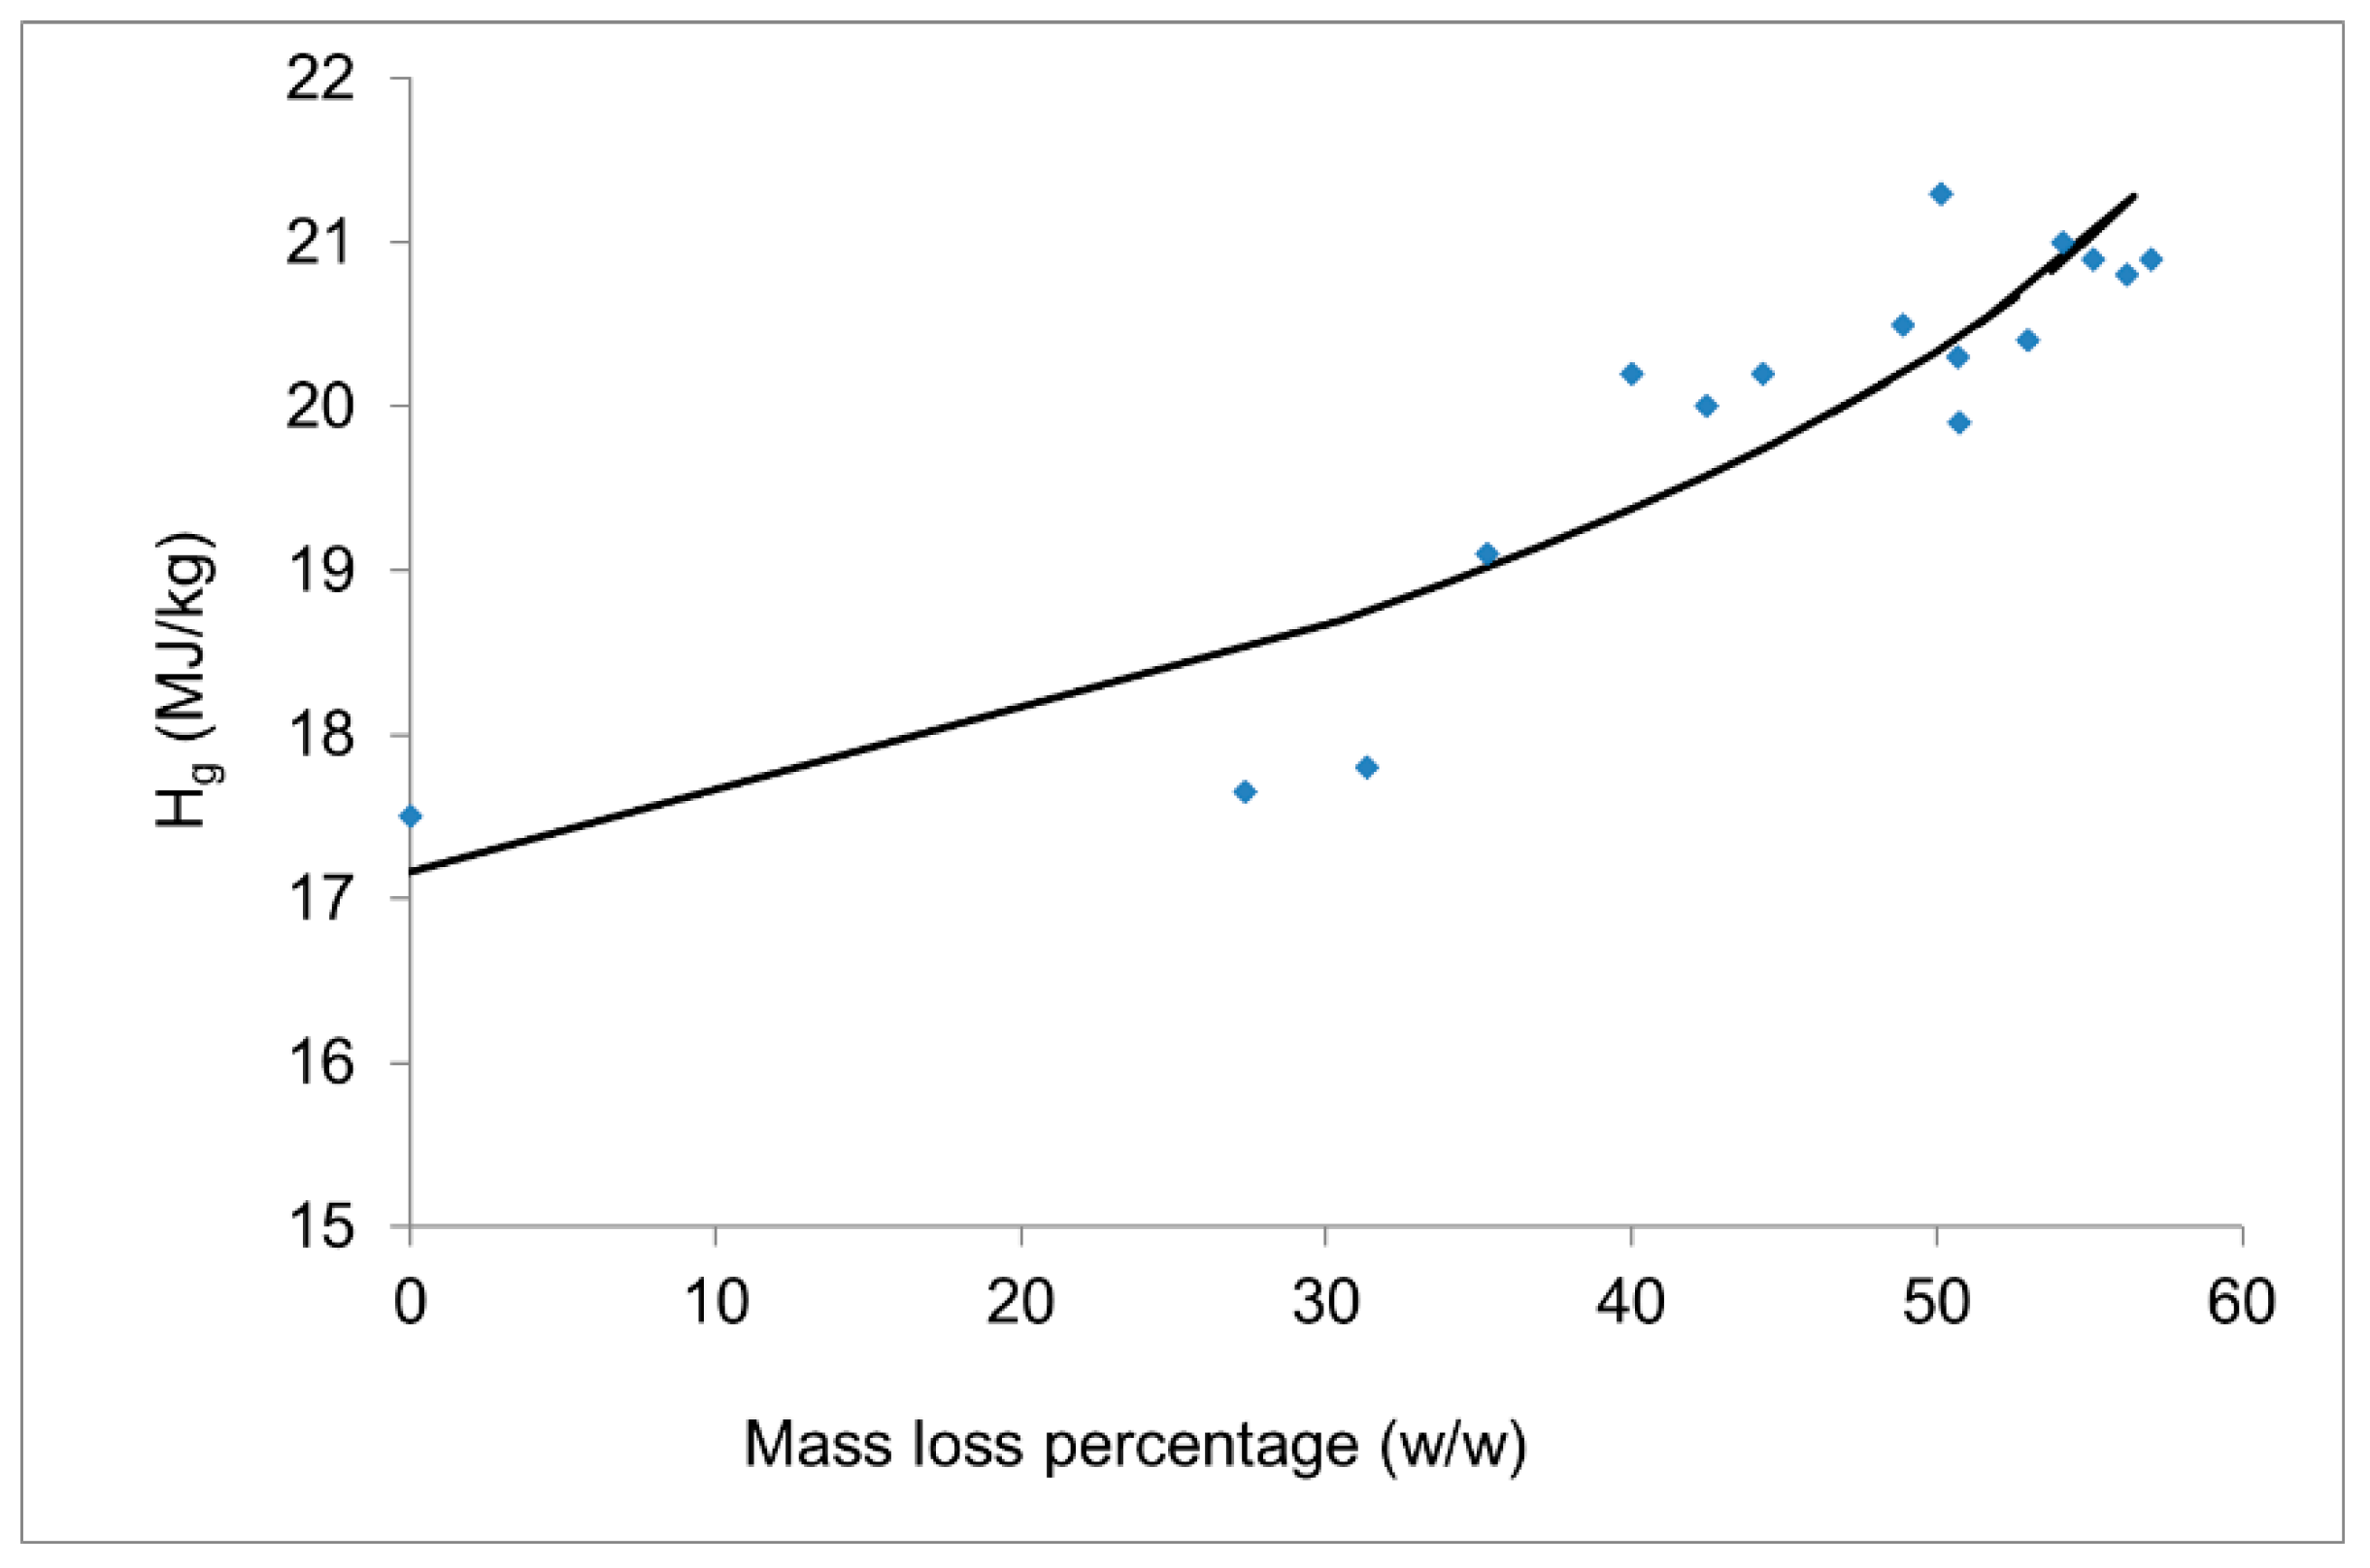
Figure 6 illustrates the relation between the Higher Heating Value of barley straw combustion and the material’s mass loss percentage due torrefaction. The theoretical curve was estimated using Models A1 and B1 in combination. Moreover, Models A2 and B2 could successfully fit the experimental data. The maximum Higher Heating Value of the barley straw combustion is expected to be at the maximum material’s mass loss percentage, i.e., at the most severe torrefaction conditions. Moderate torrefaction conditions could be chosen to reduce barley straw’s mass loss but with a lower Higher Heating Value of the material combustion.
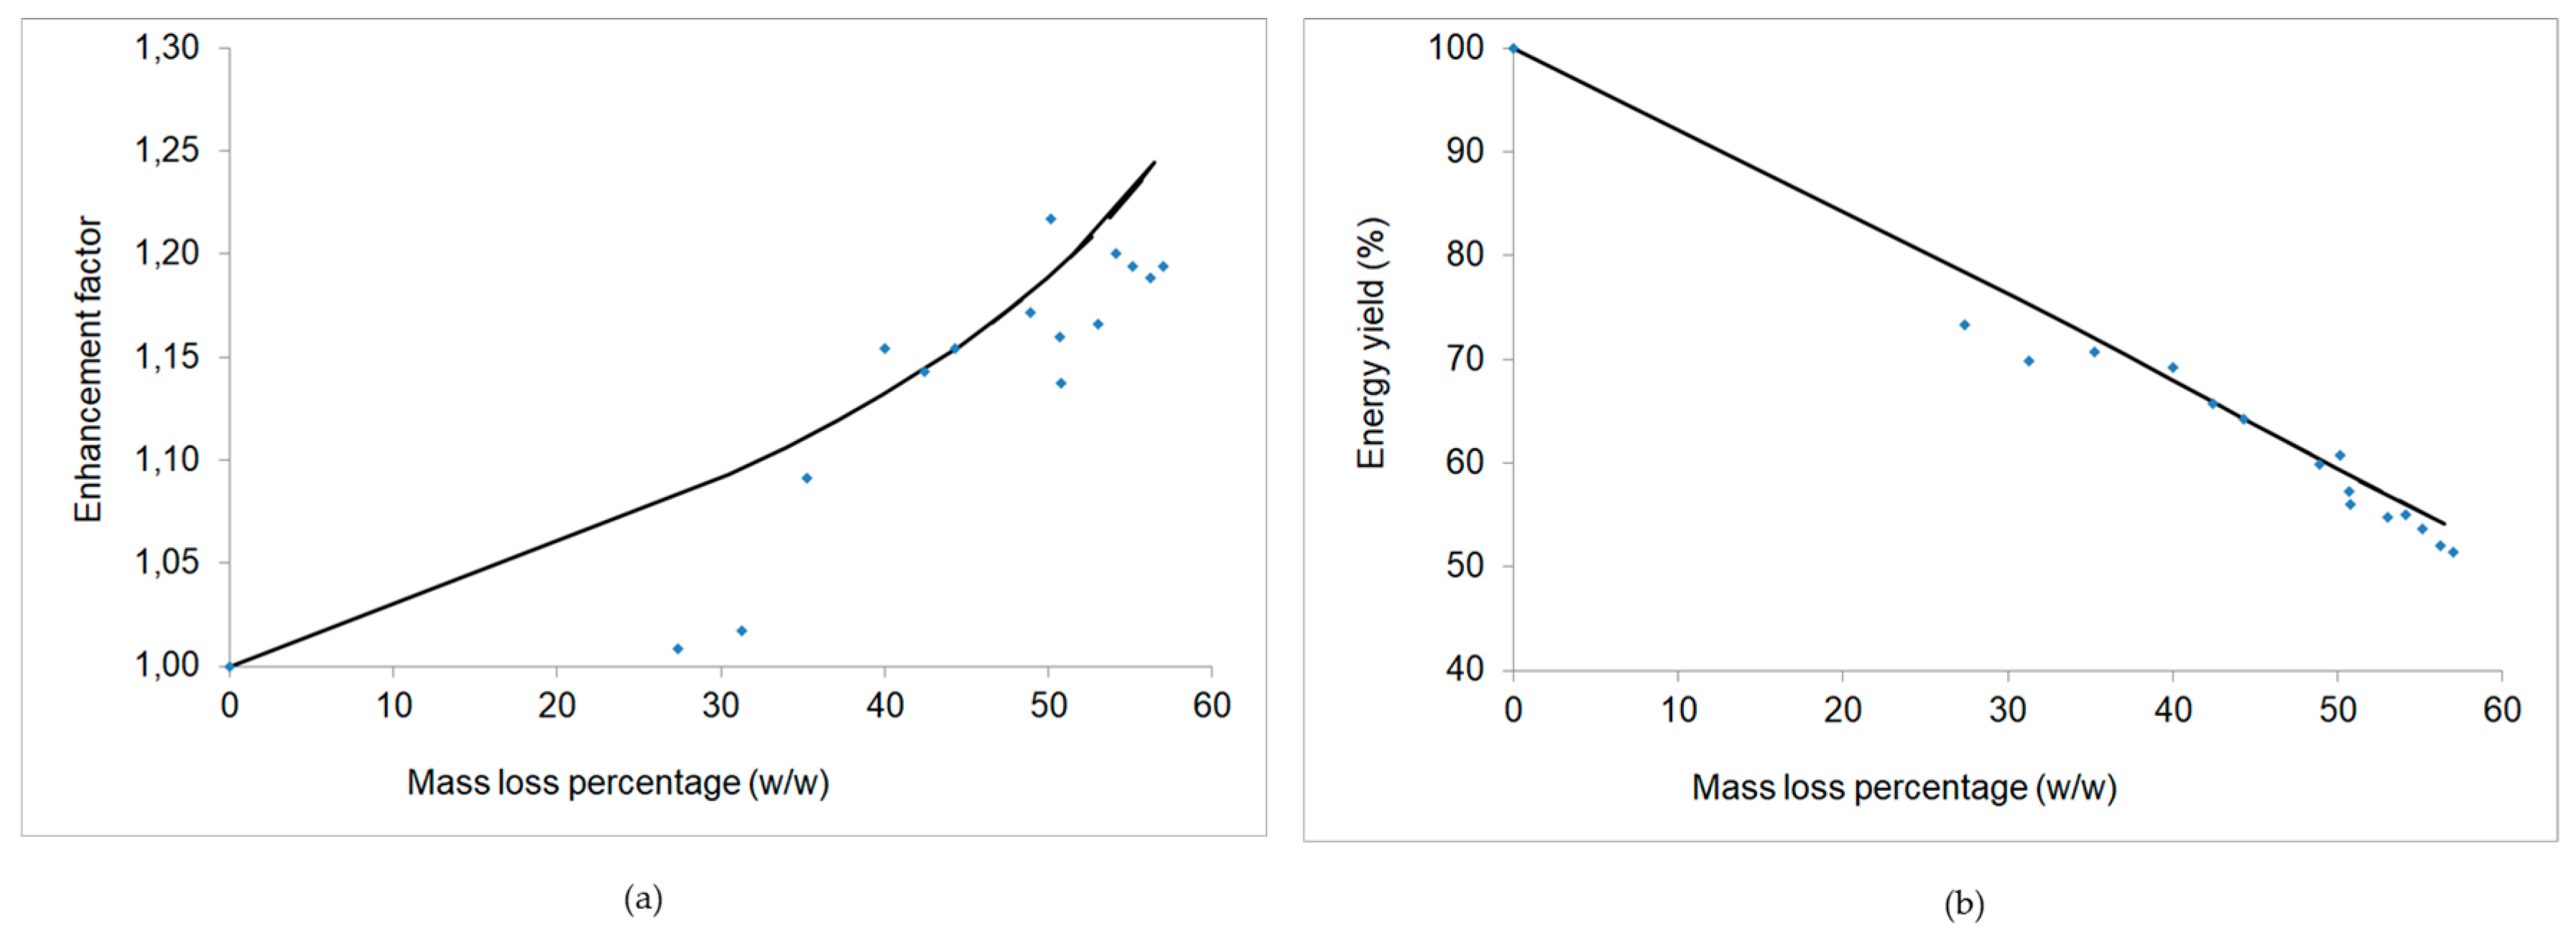
In Figure 7, the torrefied barley straw Enhancement Factor (EF) and Energy yield (EY) vs. the mass loss percentage are presented. The Enhancement Factor (EF) is given by
(EF) = Hgt/Hgu
where Hgt is the HHV for torrefied straw and Hgu is the HHV for untreated straw. The Energy yield (EY) is given by the following equation:
(EY) = (EF)·y
According to Figure 7a the Enhancement factor increases by mass loss decreasing, while according Figure 7b, Energy yield decreases almost linearly by mass loss decreasing. The theoretical curves are according to the same above-described Models A1 and A2, and Equations (10) and (12), respectively. There was no need for re-estimation of the models’ parameters.
In Figure 8 are shown the Scanning Electron Microscopy (SEM) images of the untreated barley straw at (a) × 750, (c) × 7500 and (e) × 20,000 magnification, and torrefied barley straw (at optimal conditions) at (b) × 750, (d) × 7500 and (f) × 20,000 magnification. We observe that the effect of the torrefaction on the straw surface topology is the roughening of the surface. The effect might facilitate the use of torrefied barley straw for the production of adsorbents (low-cost activated carbon substitute). This could be an alternative use to the torrefied straw as energy production material (coal substitute).
In Table 5, the Higher Heating Value of combustion, the Solid residue yield, the Enhancement factor and the Energy yield for some untreated and torrefied lignocellulosic residues according to the recent literature are presented.
These HHV values are comparable to the values found in the present study with regards to untreated and torrefied barley straw [34], but there are significant differences when another lignocellulosic material was used. Moreover, the EF value of torrefied barley straw [11] was similar to the findings of the present work, while the EY value [11] was lower compared to that of the present work. On the other hand, most of the other lignocellulosic materials presented in Table 5 have higher EY values (73.7–98.9%) compared to the 60.7% found herein. The high EY values were found due to high EY and/or high solid residue yield.
The higher heating values (HHV) of the barley straw samples in the present work can be calculated from their C, H and N contents (see Table 2) in a dry basis, using the following expression, as derived by Friedl et al. [45] for biomass from plant origin:
HHV = 3.55C2 − 232C − 230H + 51.2C·H + 131N + 20600
The values calculated according to Equation (15) for untreated and torrefied barley straw of this work were 18.1 and 22.4 MJ/kg, respectively. This is very close to the experimental values shown in Table 5. The EF was 1.24 very close to 1.22, i.e., the experimental one.
Lignocellulosic biomass torrefaction (dry or wet, in the absence of oxygen or not, under atmospheric pressure or not) is a pretreatment process used to overcome the disadvantages of using biomass as a fuel such as low energy density, high moisture, and oxygen contents [46,47]. The torrefaction increases energy density, hydrophobicity, and reduces grinding energy requirement of biomass. The environmental and economic aspects of the torrefaction process and torrefied product, and various applications of torrefaction products have been taken into account by various researchers. The cost competitiveness of torrefied materials is one of the major concerns of the torrefaction process. Integrating the torrefaction with other processes makes it economically more viable than as a standalone process [47].

4. Conclusions

Torrefaction of biomass is a promising process for improving the characteristics of biomass, as an alternative renewable energy source over the use of fossil fuels. This process provokes the interest of investors in this sector. From this perspective, the potential development of biomass heat conversion technologies, such as combustion, is promising as far as the use of new forms of biomass is concerned, i.e., more eco-friendly, more abundant and more economical, as is the case of barley straw. The fact that publications on this topic have significantly increased indicates the strong academic relevance and industrial interest in this subject in recent years. In the current study, torrefaction conditions were investigated for increasing the Higher Heating Value of combustion for barley straw. An integrated methodology was applied to this end, with the main focus given on the impact of the temperature and time parameters and with the results presented herein eventually indicating that severe treatment conditions are the optimum ones in order to maximize the heating value of barley straw combustion. According to these experimental results, the optimal time that gives the maximum output equal to 21.3 MJ/kg was 47.5 min where Hg increases by 21.7%., for R0 = 1.99·107 and consequently logR0 = 7.3. On the other hand, according to the developed models, the maximum Higher Heating Value of the barley straw combustion is expected to be at the maximum material’s mass loss percentage, i.e., at the most severe torrefaction conditions. More or less, moderate torrefaction conditions could be chosen to reduce barley straw’s mass loss but with enhanced Higher Heating Value of the material combustion compared to the untreated material but lower value compared to the optimal one.

Author Contributions

Investigation, A.G.N.; Methodology, G.E.G.; Software, D.V.P.; Supervision, D.K.S. All authors have read and agreed to the published version of the manuscript.

Funding

This research received no external funding.

Acknowledgments

This work has been partly supported by the University of Piraeus Research Center.

Conflicts of Interest

The authors declare no conflict of interest.

References

  1. Fragkos, P.; Tasios, N.; Paroussos, L.; Capros, P.; Tsani, S. Energy system impacts and policy implications of the European Intended Nationally Determined Contribution and low-carbon pathway to 2050. Energy Policy 2017, 100, 216–226. [Google Scholar] [CrossRef]
  2. Corradini, M.; Costantini, V.; Markandya, A.; Paglialunga, E.; Sforna, G. A dynamic assessment of instrument interaction and timing alternatives in the EU low-carbon policy mix design. Energy Policy 2018, 120, 73–84. [Google Scholar] [CrossRef]
  3. Sung, B.; Park, S.-D. Who Drives the Transition to a Renewable-Energy Economy? Multi-Actor Perspective on Social Innovation. Sustainability 2018, 10, 448. [Google Scholar] [CrossRef] [Green Version]
  4. Chen, W.H.; Kuo, P.C. Torrefaction and co-torrefaction characterization of hemicellulose, cellulose and lignin as well as torrefaction of some basic constituents in biomass. Energy 2011, 36, 803–811. [Google Scholar] [CrossRef]
  5. Van der Stelt, M.J.C.; Gerhauser, H.; Kiel, J.H.A.; Ptasinski, K.J. Biomass upgrading by torrefaction for the production of biofuels: A review. Biomass Bioenergy 2011, 35, 3748–3762. [Google Scholar] [CrossRef]
  6. Vassilev, S.V.; Vassileva, C.G.; Vassilev, V.S. Advantages and disadvantages of composition and properties of biomass in comparison with coal: An overview. Fuel 2015, 158, 330–350. [Google Scholar] [CrossRef]
  7. Ntanos, S.; Kyriakopoulos, G.; Chalikias, M.; Arabatzis, G.; Skordoulis, M. Public Perceptions and Willingness to Pay for Renewable Energy: A Case Study from Greece. Sustainability 2018, 10, 687. [Google Scholar] [CrossRef] [Green Version]
  8. Muench, S. Greenhouse gas mitigation potential of electricity from biomass. J. Clean. Prod. 2015, 103, 483–490. [Google Scholar] [CrossRef]
  9. Chen, W.; Peng, J.; Bi, X.T. A state-of-the-art review of biomass torrefaction, densification and applications. Renew. Sustain. Energy Rev. 2015, 44, 847–866. [Google Scholar] [CrossRef]
  10. Dietrich, R.-U.; Albrecht, F.G.; Maier, S.; König, D.H.; Estelmann, S.; Adelung, S.; Bealu, Z.; Seitz, A. Cost calculations for three different approaches of biofuel production using biomass, electricity and CO2. Biomass Bioenergy 2018, 111, 165–173. [Google Scholar] [CrossRef]
  11. Satpathy, S.K.; Tabil, L.G.; Meda, V.; Naik, S.N.; Prasad, R. Torrefaction of wheat and barley straw after microwave heating. Fuel 2014, 124, 269–278. [Google Scholar] [CrossRef]
  12. Bridgeman, T.G.; Jones, J.M.; Shield, I.; Williams, P.T. Torrefaction of reed canary grass, wheat straw and willow to enhance solid fuel qualities and combustion properties. Fuel 2008, 87, 844–856. [Google Scholar] [CrossRef]
  13. Prins, M.J.; Ptasinski, K.J.; Janssen, F.J.J.G. Torrefaction of wood: Part 2: Analysis of products. J. Anal. Appl. Pyrol. 2006, 77, 35–40. [Google Scholar] [CrossRef]
  14. Arias, B.; Pevida, C.; Fermoso, J.; Plaza, M.G.; Rubiera, F.; Pis, J.J. Influence of Torrefaction on the Grindability and Reactivity of Woody Biomass. Fuel Process. Technol. 2008, 89, 169–175. [Google Scholar] [CrossRef] [Green Version]
  15. Phanphanich, M.; Mani, S. Impact of Torrefaction on the Grindability and Fuel Characteristics of Forest Biomass. Bioresour. Technol. 2011, 102, 1246–1253. [Google Scholar] [CrossRef] [PubMed]
  16. Medic, D.; Darr, M.; Shah, A.; Potter, B.; Zimmerman, J. Effects of Torrefaction Process Parameters on Biomass Feedstock Upgrading. Fuel 2011, 91, 147–154. [Google Scholar] [CrossRef]
  17. Uemura, Y.; Omar, W.N.; Tsutsui, T.; Yusup, S.B. Torrefaction of Oil Palm Wastes. Fuel 2011, 90, 2585–2591. [Google Scholar] [CrossRef]
  18. Wannapeera, J.; Fungtammasan, B.; Worasuwannarak, N. Effects of Temperature and Holding Time during Torrefaction on the Pyrolysis Behaviors of Woody Biomass. J. Anal. Appl. Pyrol. 2011, 92, 99–105. [Google Scholar] [CrossRef]
  19. Bergman, P.C.A.; Boersma, A.R.; Kiel, J.H.A.; Prins, M.J.; Ptasinski, K.J.; Janseen, F.J.J.G. Torrefaction for Entrained Flow Gasification of Biomass. In Biomass for Energy, Industry and Climate Protection: Second World Biomass Conference; Proceedings of the World Conference, Rome, Italy, 10–14 May 2004; van Swaaij, W.P.M., Ed.; ECN-RX; ETA-Renewable Energies: Florence, Italy, 2004; Volume 04-046, pp. 679–682. [Google Scholar]
  20. Clausen, L.R.; Houbak, N.; Elmegaard, B. Techno-Economic Analysis of a Low CO2 Emission Dimethyl Ether (DME) Plant Based on Gasification of Torrefied Biomass. Energy 2010, 35, 4831–4842. [Google Scholar] [CrossRef] [Green Version]
  21. Prins, M.J.; Ptasninski, K.J.; Janssen, F.J.J.G. More Efficient Biomass Gasification via Torrefaction. Energy 2006, 31, 3458–3470. [Google Scholar] [CrossRef]
  22. Deng, J.; Wang, G.J.; Kuang, J.H.; Zhang, Y.-L.; Luo, Y.H. Pretreatment of Agriculture Residues for Co-Gasification via Torrefaction. J. Anal. Appl. Pyrol. 2009, 86, 331–337. [Google Scholar] [CrossRef]
  23. Pach, M.; Zanzi, R.; Bjornbom, E. Torrefied Biomass a Substitute for Wood and Charcoal. In Proceedings of the 6th Asia-Pacific International Symposium on Combustion and Energy Utilization, Kuala Lumpur, Malaysia, 20–22 May 2002. [Google Scholar]
  24. Tumuluru, J.S.; Sokhansanj, S.; Hess, J.R.; Wright, C.T.; Boardman, R.D. A Review on Biomass Torrefaction Process and Product Properties for Energy Applications. Ind. Biotechnol. 2011, 7, 384–401. [Google Scholar] [CrossRef] [Green Version]
  25. Bridgeman, T.G.; Jones, J.M.; Williams, A.; Waldron, D.J. An Investigation of the Grindability of the Torrefied of Energy Crops. Fuel 2010, 89, 3911–3918. [Google Scholar] [CrossRef] [Green Version]
  26. Felfli, F.F.; Luengo, C.A.; Suarez, J.A.; Beaton, P.A. Wood Briquette Torrefaction. Energy Sustain. Dev. 2005, 9, 19–22. [Google Scholar] [CrossRef]
  27. Acharjee, T.C.; Coronella, C.J.; Vasquez, V.R. Effect of Thermal Pretreatment on Equilibrium Moisture Content of Lignocellulosic Biomass. Bioresour. Technol. 2011, 102, 4849–4854. [Google Scholar]
  28. Repellin, V.; Govin, A.; Rolland, M.; Guyonment, R. Energy Required for Fine Grinding of Torrefied Wood. Biomass Bioenergy 2010, 34, 923–930. [Google Scholar] [CrossRef] [Green Version]
  29. Yan, W.; Acharjee, T.C.; Coronella, C.J.; Vasquez, V.R. Thermal Pretreatment of Lignocellulosic Biomass. Environ. Prog. 2009, 28, 435–440. [Google Scholar] [CrossRef]
  30. Mobini, M.; Meyer, J.C.; Trippe, F.; Sowlati, T.; Fröhling, M.; Schultmann, F. Assessing the integration of torrefaction into wood pellet production. J. Clean. Prod. 2014, 78, 216–225. [Google Scholar] [CrossRef]
  31. Pentananunt, R.; Rahman, A.N.M.M.; Bhattacharya, S.C. Upgrading of Biomass by Means of Torrefaction. Energy 1990, 15, 1175–1179. [Google Scholar] [CrossRef]
  32. Ge, L.; Zhang, Y.; Wang, Z.; Zhou, J.; Cen, K. Effects of Microwave irradiation Treatment on Physicochemical Characteristics of Chinese Low-Rank Coals. Energy Convers. Manag. 2013, 71, 84–91. [Google Scholar] [CrossRef]
  33. Chaouch, M.; Petrissans, M.; Petrissans, A.; Gerardin, P. Use of Wood Elemental Composition to Predict Heat Treatment Intensity and Decay Resistance Different softwood and Hardwood Species. Polym. Degrad. Stab. 2010, 95, 2255–2259. [Google Scholar] [CrossRef]
  34. Nhuchhen, D.R.; Basu, P.; Acharya, B. A Comprehensive Review on Biomass Torrefaction. Int. J. Renew. Energy Biofuels 2014, 2014, 1–56. [Google Scholar] [CrossRef]
  35. International Organization for Standardization ISO 1716:2018 Reaction to Fire Tests for Products—Determination of the Gross Heat of Combustion (Calorific Value). 2018. Available online: https://www.iso.org/standard/70177.html (accessed on 20 December 2019).
  36. Brasch, D.J.; Free, K.W. Prehydrolysis-kraft pulping of Pinus radiata grown in New Zealand. Tappi 1965, 48, 245–248. [Google Scholar]
  37. Overend, R.; Chornet, E. Fractionation of lignocellulosics by steam-aqueous pretreatments. Philos. Trans. R. Soc. Lond. B Biol. Sci. 1987, 321, 523–536. [Google Scholar]
  38. Kim, Y.H.; Na, B.I.; Ahn, B.J.; Lee, H.W.; Lee, J.W. Optimal condition of torrefaction for high energy density solid fuel of fast growing tree species. Korean J. Chem. Eng. 2015, 32, 1547–1553. [Google Scholar] [CrossRef]
  39. Sidiras, D.; Batzias, F.; Ranjan, R.; Tsapatsis, M. Simulation and optimization of batch autohydrolysis of wheat straw to monosaccharides and oligosaccharides. Bioresour. Technol. 2011, 102, 10486–10492. [Google Scholar] [CrossRef] [PubMed]
  40. Aguado, R.; Cuevas, M.; Perez-Villarejo, L.; Martínez-Cartas, M.L.; Sanchez, S. Upgrading almond-tree pruning as a biofuel via wet torrefaction. Renew. Energy 2020, 145, 2091–2100. [Google Scholar] [CrossRef]
  41. Zhang, C.; Ho, S.-H.; Chen, W.-H.; Xie, Y.; Liu, Z.; Chang, J.S. Torrefaction performance and energy usage of biomass wastes and their correlations with torrefaction severity index. Appl. Energy 2018, 220, 598–604. [Google Scholar] [CrossRef]
  42. Campbell, W.A.; Coller, A.; Evitts, R.W. Comparing severity of continuous torrefaction for five biomass with a wide range of bulk density and particle size. Renew. Energy 2019, 141, 964–972. [Google Scholar] [CrossRef]
  43. Silveira, E.A.; Gustavo, L.; Galva, O.; Sa, I.A.; Silva, B.F.; Macedo, L.; Rousset, P.; Caldeira-Pires, A. Effect of torrefaction on thermal behavior and fuel properties of Eucalyptus grandis macro-particulates. J. Therm. Anal. Calorim. 2019, 138, 3645–3652. [Google Scholar] [CrossRef]
  44. Xin, S.; Huang, F.; Liu, X.; Mi, T.; Xu, Q. Torrefaction of herbal medicine wastes: Characterization of the physicochemical properties and combustion behaviors. Bioresour. Technol. 2019, 287, 121408. [Google Scholar] [CrossRef] [PubMed]
  45. Friedl, A.E.; Padouvas, H.R.; Varmuza, K. Prediction of heating values of biomass fuel from elemental composition. Anal. Chim. Acta 2005, 544, 191–198. [Google Scholar] [CrossRef]
  46. Bach, Q.-V.; Skreiberg, Ø. Upgrading biomass fuels via wet torrefaction: A review and comparison with dry torrefaction. Renew. Sustain. Energy Rev. 2016, 54, 665–677. [Google Scholar] [CrossRef]
  47. Cahyanti, M.N.; Doddapaneni, T.R.K.C.; Kikas, T. Biomass torrefaction: An overview on process parameters, economic and environmental aspects and recent advancements. Bioresour. Technol. 2020, 301, 122737. [Google Scholar] [CrossRef]
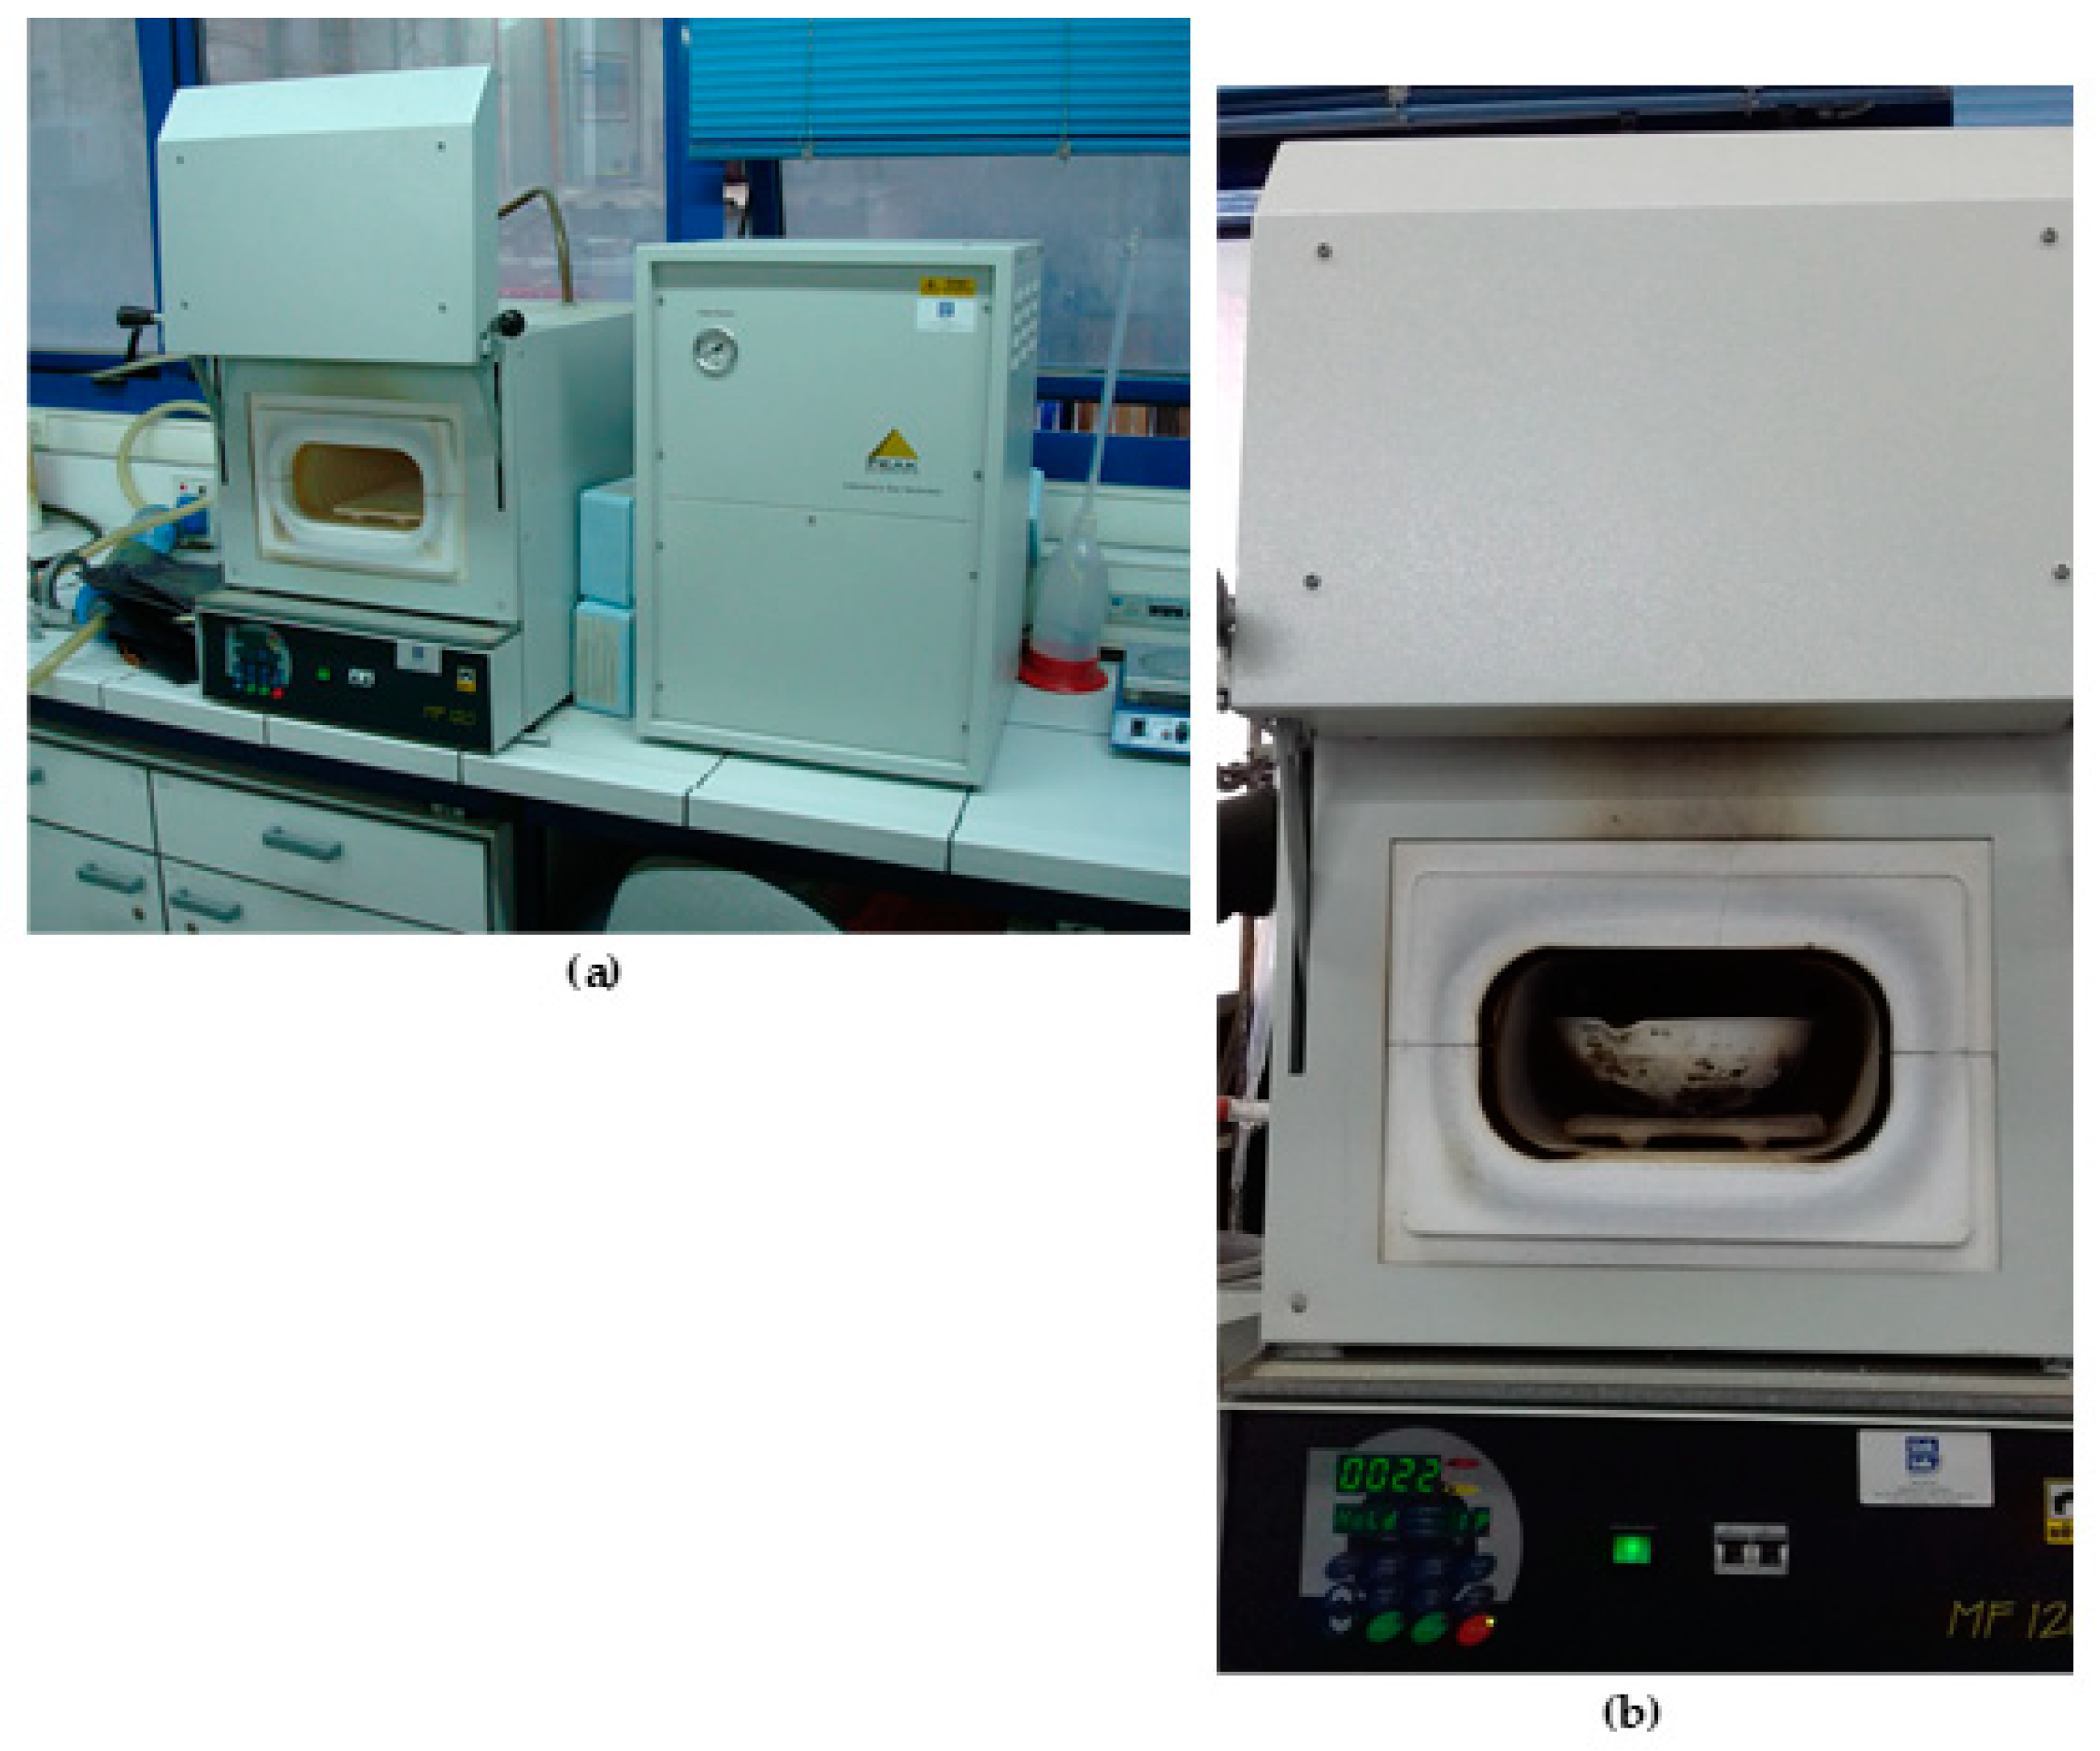
Figure 1. Experimental setup of the torrefaction process: (a) Nuve Muffle Furnace (Internal dimensions: 210W × 300D × 110Hmm) equipped with electric heating and a nitrogen generator that uses molecular sieves and (b) barley straw in a ceramic crucible placed in the cold furnace.
Energies 13 00736 g001
Figure 2. Temperature profile vs. time during the measurement of a typical sample’s higher heating value of combustion.
Energies 13 00736 g002
Figure 3. Experimental temperature profile for a typical barley straw torrefaction experiment.
Energies 13 00736 g003
Figure 4. Torrefied barley straw solid residue yield vs. time (a), severity factor (b), and logarithm of severity factor (c).
Energies 13 00736 g004
Figure 5. Torrefied barley straw Higher Heating Value of combustion vs. time (a), severity factor (b), and logarithm of the severity factor (c).
Energies 13 00736 g005
Figure 6. Torrefied barley straw Higher Heating Value of combustion vs. the mass loss percentage.
Energies 13 00736 g006
Figure 7. Torrefied barley straw (a) Enhancement Factor (EF) and (b) Energy yield (EY) vs. the mass loss percentage.
Energies 13 00736 g007
Figure 8. Scanning Electron Microscopy (SEM) images of untreated barley straw at (a) ×750, (c) ×7500 and (e) ×20,000 magnification, and torrefied barley straw at (b) ×750, (d) ×7500 and (f) ×20,000 magnification.
Energies 13 00736 g008
Table 1. Ranking, time, severity factor and logarithm of severity factor for barley straw torrefaction design of experiments.
Countt (min)R0LogR0
11536,0104.56
217.5332,9105.52
3201,724,7556.24
422.55,098,0256.71
5258,922,5356.95
627.58,949,6976.95
73013,005,4807.11
832.510,659,4697.03
93515,435,5737.19
1037.516,313,4257.21
114016,032,9047.21
1242.522,099,4057.34
134518,959,5227.28
1447.519,904,9757.30
155016,903,6557.23
Table 2. Composition of untreated and torrefied barley straw.
Percentages
(% wt. Dry Basis)
Untreated Barley StrawTorrefied Barley StrawAnalytical Method
Proximate analysis (wt. %)
Moisture Content 6.03.5ISO 18134-1
Volatile Matter74.362.5ISO 18123
Ash8.416.1ISO 18122
Ultimate analysis (wt. %)
Carbon45.557.5ISO 16948
Hydrogen5.54.1ISO 16948
Nitrogen0.991.6ISO 16948
Oxygen 47.936.4by difference
Sulfur0.1157.5ISO 16994
Table 3. The parameters and standard error of estimate (SEE) of the three models for the solid residue yield (% w/w) of barley straw torrefaction.
Model A1Model A2Model A3
y0101.1080.2370.58
k0.04501.739·10–77.778·10–8
ye36.7645.3238.35
SEE3.6377.1832.596
Table 4. The parameters and standard error of estimate (SEE) of the three models for the Higher Heating Value (MJ/kg) of the combustion of the torrefied barley straw.
Model B1Model B2Model B3
Hg017.1117.5317.55
k10.00063341.020·10–71.000·10–7
Hge30.8721.1821.19
SEE0.61820.33440.3479
Table 5. Higher Heating Value of combustion, Solid residue yield, Enhancement factor and Energy yield for some untreated and torrefied lignocellulosic residues.
MaterialsHHV (MJ/kg)Solid Residue Yield,
y (% wt.)
Enhancement Factor, EFEnergy Yield, EY (%)References
Almond-tree pruning17.6 [28]
Almond-tree pruning pretreated by wet torrefaction2457.11.3677.9[28]
Barley straw17.7 [11]
Barley straw torrefied21.544.11.2153.6[11]
Barley straw17.5 This study
Barley straw torrefied21.349.91.2260.7This study
Eucalyptus grandis20.1 [43]
Eucalyptus grandis torrefied25.065.21.2481.0[43]
Herbal medicine wastes19 [44]
Herbal medicine wastes torrefied20.382.11.0787.7[44]
Microalga residue12.7 [41]
Microalga residue torrefied17.368.01.3692.6[41]
Spent coffee grounds21.8 [41]
Spent coffee grounds torrefied29.872.41.3798.9[41]
Spruce 20.3 [42]
Spruce char21.291.51.0495.6[42]
Wheat straw17.8 [11]
Wheat straw torrefied20.5641.1573.7[11]
Wheat straw19 [42]
Wheat straw char20.184.81.0689.7[42]
Willow20.1 [42]
Willow char21.287.11.0591.9[42]