1. Introduction
The building sector consumed one-third of global final energy use in 2016. About 80% of this final energy consumption was supplied by fossil fuels. The combustion of this fossil fuel amount caused 28% of global energy-related CO
2 emissions, which represent one of the main reasons for the greenhouse effect in the atmosphere and global warming. A plan to limit global warming is described in the Paris Agreement, which entered into force on 4 November 2016. The first point of this agreement defines that the increase in global average temperature should not exceed 2 °C in comparison to the pre-industrial level [
1].
Many countries included the aims of the Paris Agreement in their National Climate Action Plans, which, among other things, outline the national policies for reduction of the greenhouse gas emissions in the building sector through to 2050. The Climate Action Plan of Germany aims to make the building stock virtually climate neutral by reducing the primary energy demand of buildings by at least 80% compared to 2008 levels by 2050. This ambitious goal can be achieved by a combination of increasing efficiency, using renewable energy, and sector coupling with the energy and transport sectors [
2].
These solutions, particularly the coupling between different sectors, face big challenges. One of these challenges is the development and integration of energy management systems for the buildings. Such smart energy management system can have a significant impact, especially on the energy consumption of non-residential commercial buildings, because this type of building has an advantage of simultaneity between load behavior and locally generated energy from photovoltaic (PV) systems [
3,
4]. However, the fluctuating electricity generation from PV systems challenges the energy management system to use a prediction of PV power output. This type of power prediction leads to increasing the self-consumption, avoiding higher grid fees, and efficient controlling of temporal coincidence between integrated energy systems such as PV systems, battery electric vehicles (BEV), heat pumps, and other flexible loads.
As a continuation of a previous study Hanke et al. [
5], a predictive model based on a machine learning approach was developed within this study to forecast the PV power output for the next 24 h. This model had the same conditions as before [
5]; the input dataset for the predictive approach consists of only measured power values of PV systems and free publicly available weather reports. The prediction of PV power is made without any technical information about the PV system (e.g., without installed capacity, efficiency, inclination of the PV modules, etc.). Wang et al. [
1] used also only historical PV power output and numerical weather prediction for the short-term forecasting of PV power. One of the main differences between the study [
6] and this study is the type of forecasting method, whereby Wang et al. [
6] proposed interval forecasting of PV power with lower and upper boundaries, while the predictive model of this study makes deterministic point forecasting.
The study [
5] and this study are not the first surveys, which used publicly available data for making predictions. For example, Kwon et al [
7] used publicly available weather data (temperature, humidity, dew point, and sky coverage) to make predictions of global horizontal irradiance (GHI), which can theoretically be used for PV power prediction. The given study made direct predictions of PV power using publicly available weather reports as input data. However, these reports do not provide measurements and predictions of GHI. For this reason, the input dataset was extended with an additional descriptive feature. Two possible additional features were investigated within this study: PV power under clear-sky conditions and maximum PV power, calculated from power measurements of the last five days.
The requirement to use free publicly available weather data can be explained by the assumption that most commercial building integrated and grid-connected PV systems do not have any profitable business model. These systems do not generate enough revenue from feed-in tariffs and self-consumption. Without enough revenue, the buildings with PV systems cannot have an energy management system based on cost-intensive forecast data. Using publicly available weather reports is necessary to ensure that energy management systems with an integrated developed predictive approach can operate at a low-cost level.
In addition to using publicly available weather reports, the predictive model should also satisfy other requirements; it should operate fully automatically, be continuously learning, be transferable to other PV systems, and adapt to changes in weather conditions and the PV system, such as degradation of the solar modules.
With regard to these requirements, different studies were investigated in order to find an appropriate predictive approach. In recent years, more and more machine learning algorithms were developed and applied for time series predictions, as References [
8,
9,
10,
11] showed in their reviews about PV power forecast techniques. Mohammed et al. [
12] investigated different machine learning models for forecasting PV power for the next 24 h: seven individual machine learning methods (k-nearest neighbors, decision tree, gradient boosting, etc.) and three ensemble models. Both individual and ensemble models were compared to the benchmark models (autoregressive integrated moving average model, naïve, and seasonal naïve). Das et al. [
13] used support vector regression to forecast PV power, and they compared the prediction to a persistence and conventional artificial neural network (ANN). In particular, ANNs are used widely for PV power prediction. Rosato et al. [
14] proposed three predictive approaches based on ANN, which were used to predict power output for a large-scale PV plant in Italy. An ANN model was also used by Khandakar et al. [
15] to predict the PV power output in Qatar, but the authors of this study additionally investigated two different feature selection techniques. In References [
16,
17,
18], it was discussed that the application of long short-term memory (LSTM) neural networks provides particularly good results in PV power forecasting.
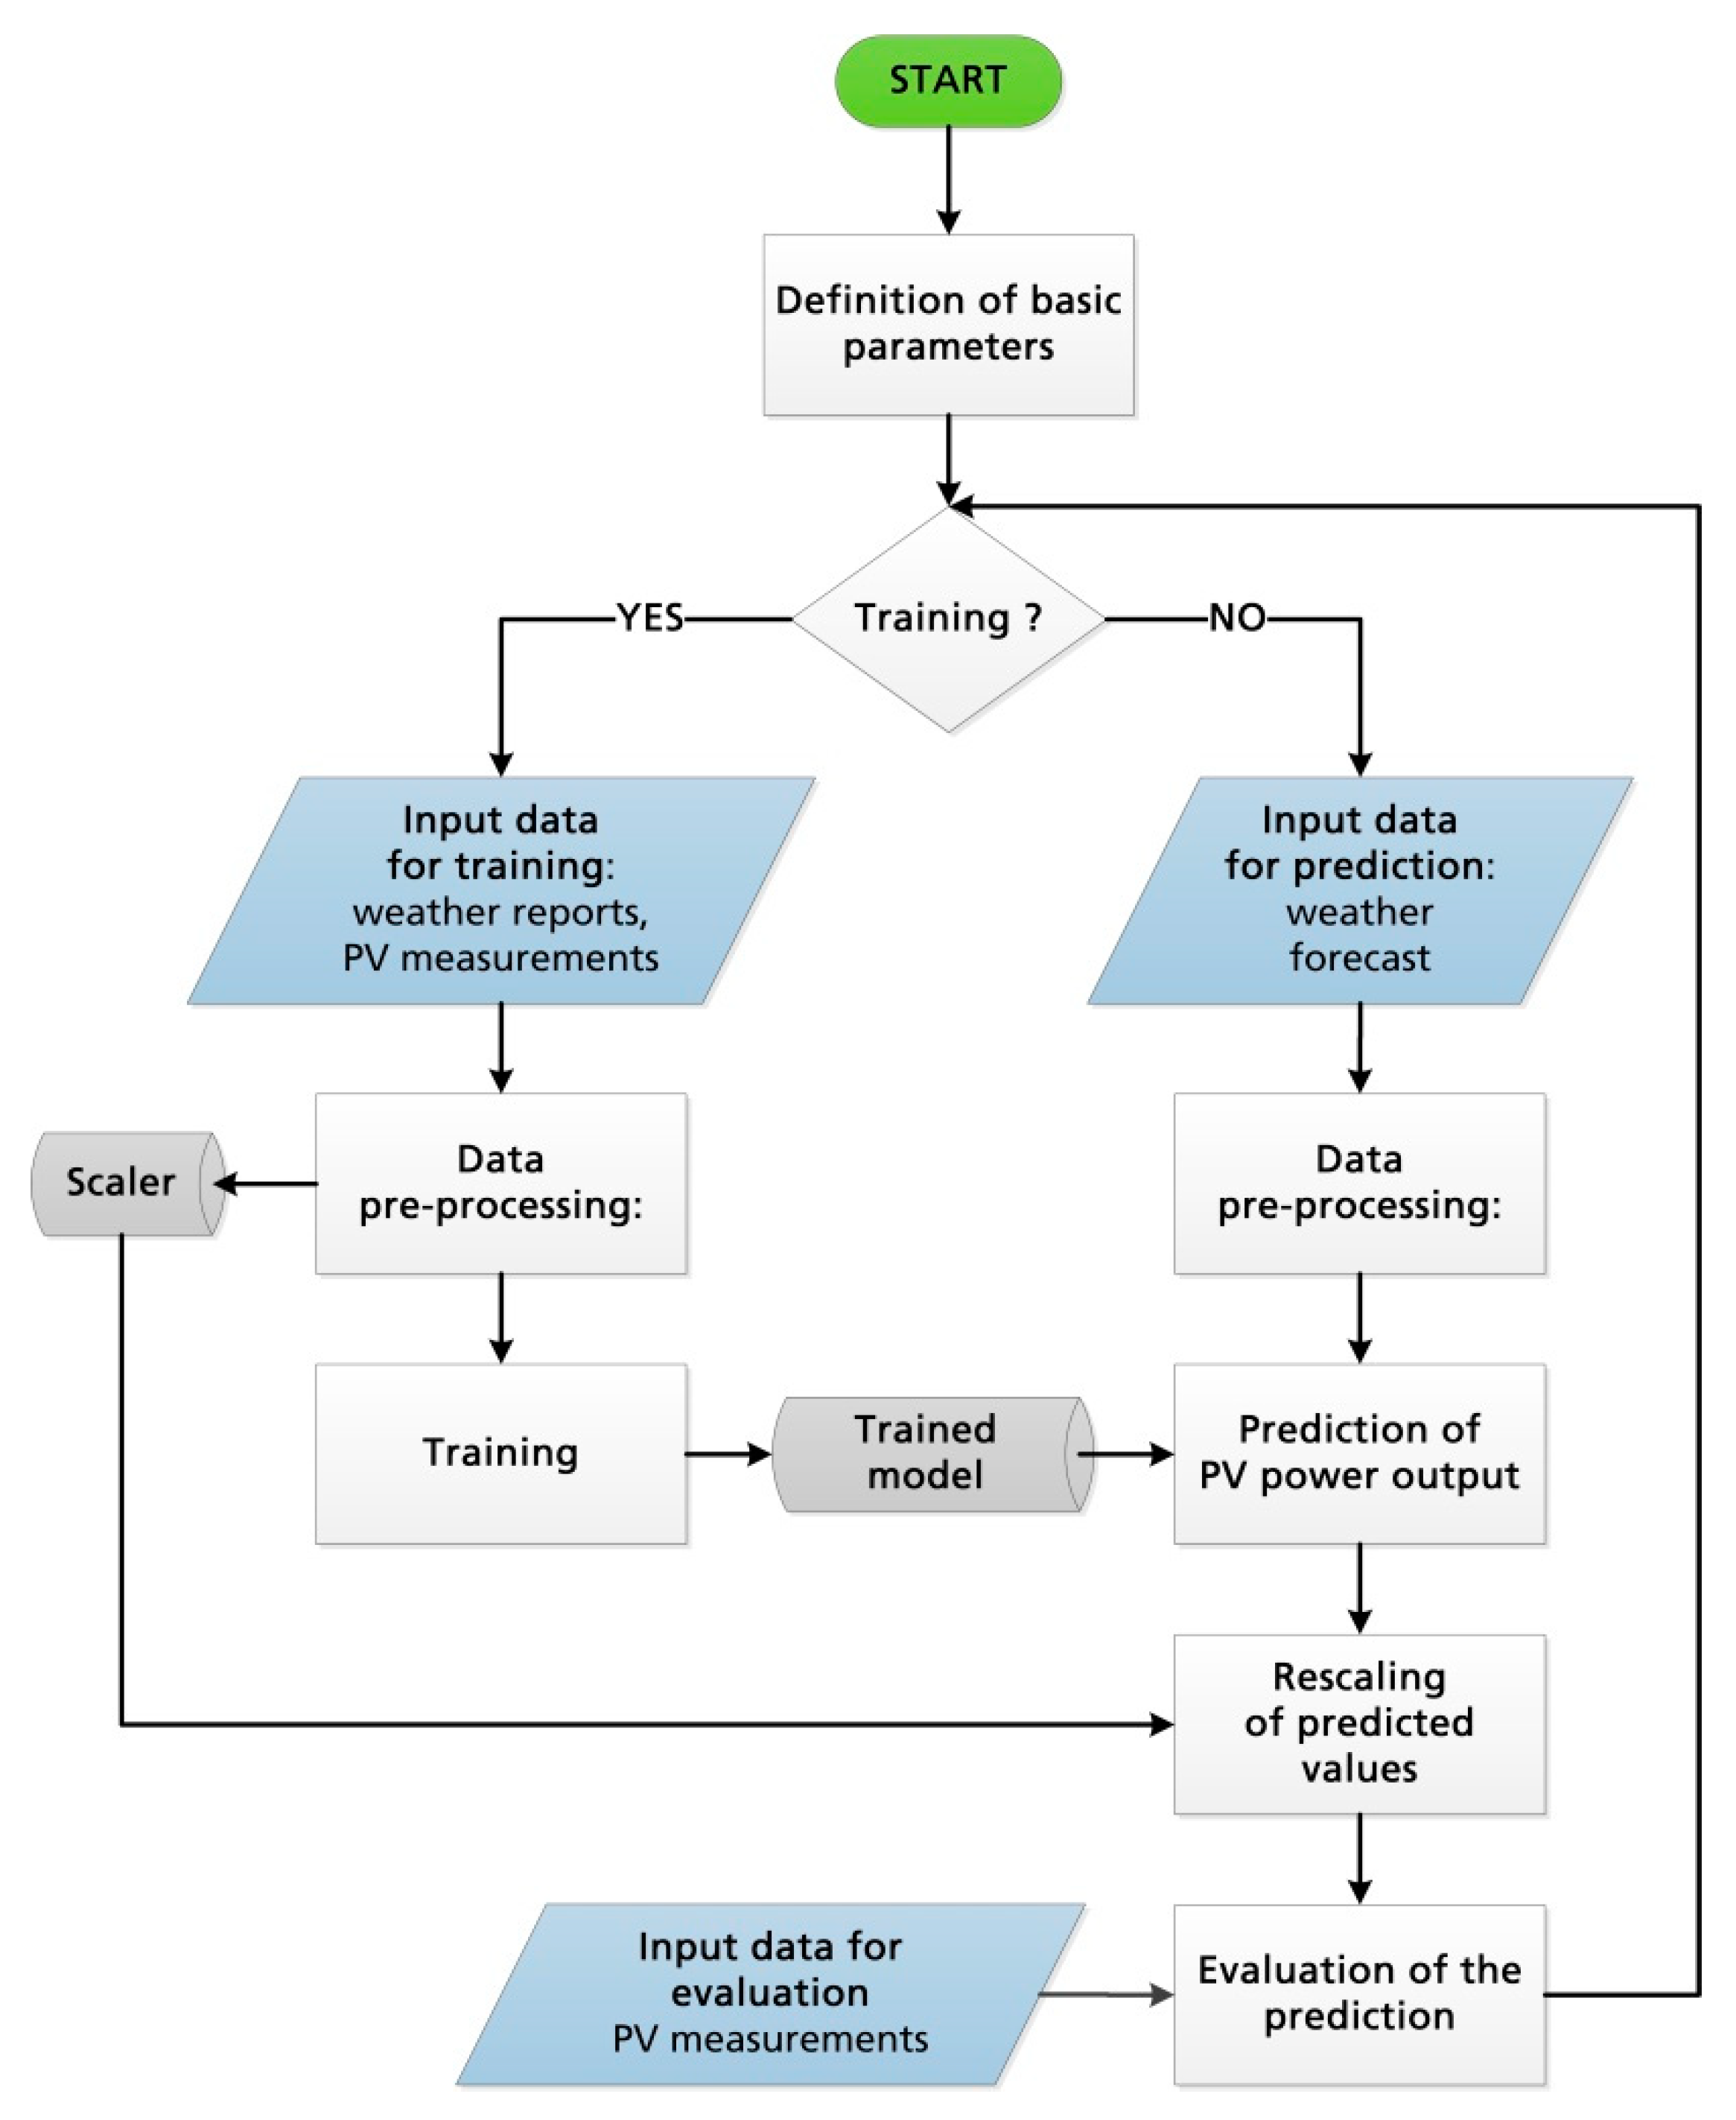
Taking into account the conducted literature research and the defined requirements for the predictive model, it was not suitable for this study to use classical splitting of the dataset into training and test sets and training the model only once. The dataset with the measured values used in this study is regularly updated with current weather data and PV measurements. Therefore, a re-training of the model with new data occurs at regular time intervals (every 12 h). Together with the current data, the weather forecast is also updated regularly (every 3 h). After each update of the weather forecast the developed model makes updated predictions of the PV power output for the next 24 h. These procedures can ensure continuous learning of the predictive model and addressing concept drift, i.e., adaptation to possible changes in data, completely new data, and new relationships between input and output.
The developed predictive approach was tested for two PV systems, which have different installed capacity, age, solar cell types, and location. This test checked whether the predictive approach can be transferred to different PV systems, despite having different individual parameters. In addition to this, PV power was predicted for two seasons of the year with different levels of GHI, in order to investigate how seasonal fluctuations of GHI can influence the accuracy of PV power prediction.
After making predictions of PV power for two seasons using two different PV systems, it was necessary to evaluate the quality of the developed predictive approach. For this purpose, the developed predictive approach was compared to a benchmark model (seasonal naïve forecast). This comparison analysis was implemented with the help of seasonal mean absolute scaled error (MASE). Furthermore, the PV power prediction of the model, based on publicly available weather data, was compared to predictions made with fee-based solar irradiance data.
At the end of
Section 1, it is important to underline the novelty of this study and its contribution to the knowledge of PV power prediction. The “low-cost” predictive approach, which was developed within this study, can predict PV power output without any knowledge of the PV system, i.e., no technical information of the PV system is required. Only measured PV power values and publicly available weather reports were used as input data for the predictive approach. These publicly available weather reports do not have any values of the GHI; thus, the PV power prediction was made without the prediction of GHI. Moreover, all conducted simulations proved that the developed “low-cost” approach can operate fully automatically, can predict the power output of different PV systems, and can adapt for different seasons of the year.
2. Data
In this section, the origin, main characteristics, and quality of input data are explained. In supervised machine learning, the input data are divided into descriptive and target features [
19]. The descriptive features of this study included historical weather measurements and numerical weather predictions for two different locations in Germany: Oldenburg and Munich. These features were used for prediction of PV power output, which was defined as a target feature.
The datasets for Oldenburg and Munich included weather data and measured PV power for different observation periods. The observation period for Oldenburg lasted from 5 May 2017 until 10 April 2018, and the observation period for Munich lasted from 5 March 2019 until 30 June 2019. These datasets were explored extensively to determine possible data quality issues and to estimate correlation between descriptive and target features for feature selection.
2.1. Photovoltaic Power Output
The origins of the PV power measurements used in this study are roof-top PV systems. The first system is in operation at the DLR Institute of Networked Energy Systems in Oldenburg since November 2010. Another system was newly installed on a commercial building in Munich and it generates electricity since November 2018.
The investigated PV systems have not only different locations, but also different installed capacities, solar cell types, etc. The main technical characteristics of these two systems are presented in
Table 1.
From 5 May 2017 until 10 April 2018, the PV system in Oldenburg generated 675.63 kWh of electricity. The measured values of the PV system in Munich are available for the DLR institute since 5 March 2019 and, from this time until 30 June 2019, it produced 50,740.14 kWh of energy.
The technical characteristics of the PV systems were not considered in the predictive model and they are given here only for better understanding of the prediction results. Only measured values of PV power output were used in the prediction model. These measured values for both PV systems were recorded with a time resolution of 5 min.
2.2. Weather Data
The requirements for the predictive model defined that input data should be open and publicly available, in order to ensure low-cost operation of the approach. Therefore, the input weather data for the predictive model were taken from an online service “OpenWeatherMap” (OWM) of a company Openweather Ltd. The main activity profile of this company includes providing current weather data, historical weather data, and weather forecasts of different locations to developers who want to present meteorological data on their homepages, mobile applications, or other web services. If the developers make fewer than 60 calls per minute, the current weather and five-day weather forecasts are available for free. The data of OWM are licensed by the Open Data Commons Open Database License (ODbL). Because the data from OWM are available to the public, the data are here referred to as “publicly available weather reports” [
20].
OWM provides current and forecast values of various weather parameters, including ambient air temperature, pressure, air humidity, cloudiness factor, wind speed, precipitation type, etc. Current and forecast values from OWM have different time resolutions; meteorological parameters of the current weather are given every 30 min, but the forecasted weather data are available only every 3 h. The data receiving time of the meteorological values from OWM is in coordinated universal time (UTC) [
20].
The used publicly available weather reports do not contain measured and predicted values of GHI. In order to evaluate how the absence of GHI in input data impacts the accuracy of PV power prediction, further weather data were purchased for use as input data for the same model. Because these data are not publicly available, they are here referred to as “fee-based solar irradiance data”. These fee-based data include measured values of GHI, which are collected by pyranometer. They also contain calculated values of GHI, direct normal irradiance (DNI), and diffuse horizontal irradiance (DHI) under clear-sky conditions and angles of solar zenith and azimuth. The GHI prediction is based on an optimized combination of different forecasting methods, including satellite cloud images and different numerical weather prediction models [
21]. This dataset does not include other meteorological parameters, such as temperature or humidity. The measured values and predictions of solar irradiance in the fee-based dataset are presented in 1 h and 15 min time intervals, respectively. These data were provided by the DLR Institute of the Networked Energy Systems and the Energy Meteorology Group, Institute of Physics, Oldenburg University. Kalisch et al. [
21] described these data and published a dataset for the year 2014. For this study, the solar irradiance data (W/m
2) were taken from the year 2019.
The problem of different time resolutions of the input data was dealt with in the data pre-processing step, as described later.
2.3. Additional Descriptive Feature
The publicly available weather reports from OWM do not provide measured and predicted values of GHI, which are strongly correlated with PV power output. Because of this reason, the input dataset with weather parameters was extended with an additional descriptive feature. Two possible features were investigated: PV power under clear-sky conditions and maximum PV power calculated from the PV power measurements of previous days. Then, these values were inserted in the input dataset and used for training of the model and for making predictions.
2.3.1. PV Power under Clear-Sky Conditions
PV power output under clear-sky conditions was the first additional descriptive feature investigated within this study. The process of this feature generation consisted of three steps.
Step 1: Calculation of the total solar irradiance on a horizontal surface, which is called GHI, under clear-sky conditions. GHI was estimated with the help of pvlib, a special open-source python toolbox for modeling PV system performance [
22]. This toolbox provides three different simple clear-sky models in order to estimate solar irradiance on horizontal surface under clear-sky conditions: Ineichen, Haurwitz, and simplified soils [
22]. These and other clear-sky models were investigated by Reno et al. [
23], and the Ineichen model was ranked among the more accurate approaches. For this study, GHI under clear-sky conditions was estimated in pvlib with the Ineichen model, because this model does not need very specific information and it showed good performance in Reference [
23]. The Ineichen model in pvlib needs the following input data for the calculation of GHI under clear-sky conditions [
22]:
Latitude, longitude, altitude, and time zone of PV system location;
Some meteorological parameters, like air temperature and pressure (if these parameters are not available, pvlib uses default values: T = 12 °C, pressure = none);
Time period for which the GHI is calculated.
At the end of the first step, a time series with GHI values under clear-sky conditions was generated for the definite location of the PV system.
Step 2: Calculation of PV system-specific clear-sky index
(m
2). For this step, the maximum value of the PV power measurements
(W) was divided by the maximum value of the GHI under clear-sky conditions
(W/m
2) (see Equation (1)).
According to the motivation of this study, the prediction of the PV power output should be made without any technical information of the PV system. The calculated index is a parameter for initial assessment of the size, installed capacity, and efficiency of the PV system.
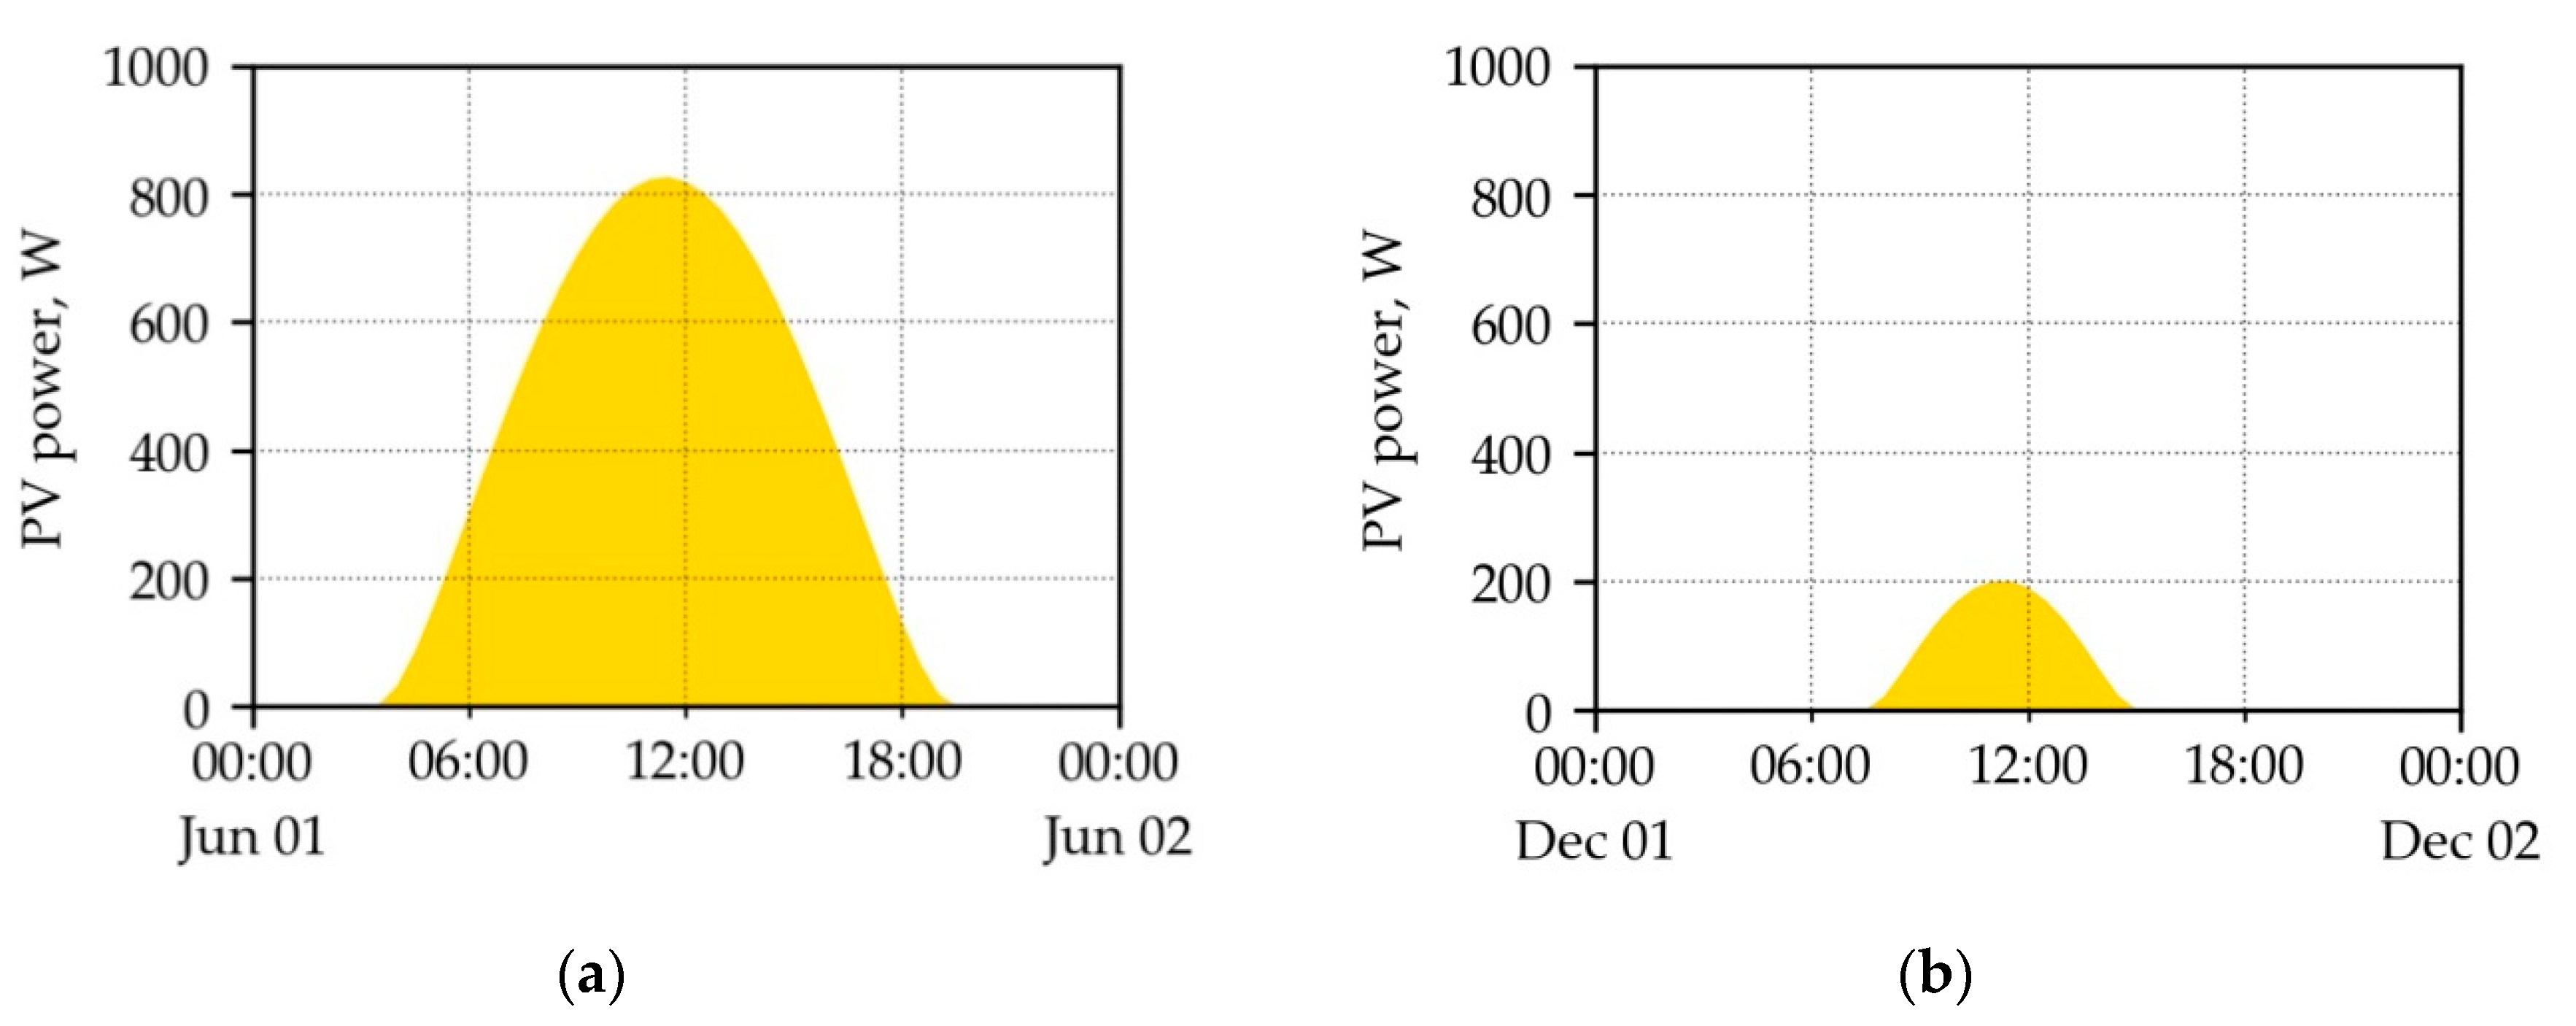
Step 3: Multiplication of GHI values under clear-sky conditions from the first step with the PV system-specific clear-sky index from the second step. The third step generates a time series of power output, which can theoretically be produced by the PV system under clear-sky conditions. In the study, this additional feature is called “clear-sky PV power”.
Figure 1 presents two time series for one summer day (1 June 2017) and one winter day (1 December 2017) for the PV system in Oldenburg (see technical parameters of this PV system in
Table 1). The yellow areas in
Figure 1 present PV power output under clear-sky conditions. As it can be seen, this feature takes into account seasonal properties such as lower solar irradiance and the shorter daytime in winter.
2.3.2. Maximum PV Power
The maximum PV power curve was the next additional descriptive feature investigated within this work. The calculation methodology of maximum PV power and the optimal number of days to look back were taken from a fully automated model of Hanke et al. [
5].
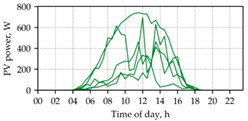
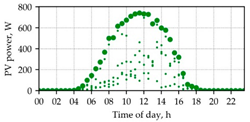
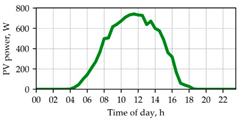
Table 2 presents the working steps for the estimation of maximum power from PV power measurements of the last five days.
Table 2 explains only the calculation approach for the estimation of the maximum PV power output; it does not explain why this parameter was calculated using power values of the last five days. This number of days was not chosen randomly; rather, Hanke et al. [
5] investigated different numbers of days. In this study, the model was consistently trained with data from only yesterday up to data of the last 30 days. Then, the simulation results were compared to each other and to the measured values. Statistical errors, mean absolute error (MAE), and root-mean-square error (RMSE) were selection criteria for choosing the optimal number of days for training of the model. Because the model which was trained with the last five days had the lowest statistical errors in the study [
5], this number of days was chosen for generation of the additional feature, i.e., maximum PV power, within this study.
Both maximum PV power and clear-sky PV power were used not only for training the model, but also for verification of the PV power prediction. The prediction of PV power output should not be greater than these additional features. If the predicted PV power was greater than the additional feature, then this predicted value was replaced with the additional feature value. The main advantage of this verification rule was that it prevented the prediction of PV power output overnight, as well as great overestimation by day.
2.4. Data Exploration
The predictive model, which was developed within this study, is a data-driven approach. For this kind of approach, input data and quality of these data play key roles in prediction accuracy. Therefore, exploration of the input data is one of the main steps in data pre-processing and feature selection [
19].
Firstly, all input data were explored with the goal of determining whether the data suffered from any data quality issues. Both the publicly available weather reports with current meteorological parameters and the dataset with measured PV power output suffered from missing values. Only 2.9% of values in the publicly available weather dataset were missing. The dataset with the PV measurements had 5.7% missing values. The rule of thumb of Kelleher et al. [
19] helped to decide whether these amounts of missing values were critical or not. This rule recommends removing a feature from the input dataset if the proportion of missing values exceeds 60% of the whole dataset. In this case, the amount of relevant information stored in the rest of the data is very low. According to this rule, the proportion of missing values in the datasets with weather parameters and PV measurements was uncritical, and both datasets could be used as input data for the predictive model. The next common data quality issue involves outliers; publicly available weather reports had only one outlier (humidity value) within the investigated period, and the PV dataset did not have any outliers in the same period. According to the OWM homepage, humidity is calculated as a percentage and varies between zero and one hundred. During data exploration, it was determined that the humidity value on 12 March 2018 at 21:00 was 107%.
Secondly, the quality of the numerical weather forecast from publicly available weather reports could also be evaluated, because the weather forecast was available for the whole investigated period of time. The prediction accuracy of publicly available weather reports was evaluated with the help of three statistical metrics.
Mean absolute error (MAE):
Root-mean-square error (RMSE):
Symmetric mean absolute percentage error (sMAPE) [
24]:
In Equations (2)–(4), is the measured value, is the predicted value, and is the number of values.
The statistical metrics can only be calculated for the numerical variables. The meteorological parameter “precipitation” in publicly available weather reports is a categorical feature, which contains categories such as “rain” and “snow”. In order to evaluate the forecast accuracies for this parameter, it was converted into dummy variables. After this procedure, the dataset contained two new columns with discrete variables: “precipitation (rain)” and “precipitation (snow)”.
The meteorological parameters cover different ranges; for example, cloudiness and humidity cover the range [0, 100], ambient air temperature covers the range [−10, 29], etc. In order to compare them with each other, all values were converted into the range [0, 1] using range normalization [
19]. Afterward, MAE, RMSE, and sMAPE for all meteorological parameters were calculated. The statistical metrics which indicate the quality of weather forecast of publicly available weather reports are presented in the
Table 3.
Among all meteorological parameters, temperature and pressure, with an sMAPE of less than 3%, had the best prediction accuracy. The high statistical errors of cloudiness and precipitation make sense, because these meteorological parameters are the hardest to predict. The accuracy of humidity forecasting lay between the accuracies for temperature and cloudiness.
2.5. Correlation Analysis and Feature Selection
In the previous subsections, the meteorological parameters were investigated separately from the target feature, i.e., the PV power output. The next step was the calculation of the relationship between weather data, additional features (clear-sky PV power and maximum PV power), and measured PV power. The relationship between all these features was estimated with the help of covariance
and correlation
metrics [
19]. The formulas for the calculation of these metrics are given below.
In Equations (5) and (6), represent features a and b, represent the means of features a and b, and is the standard deviation.
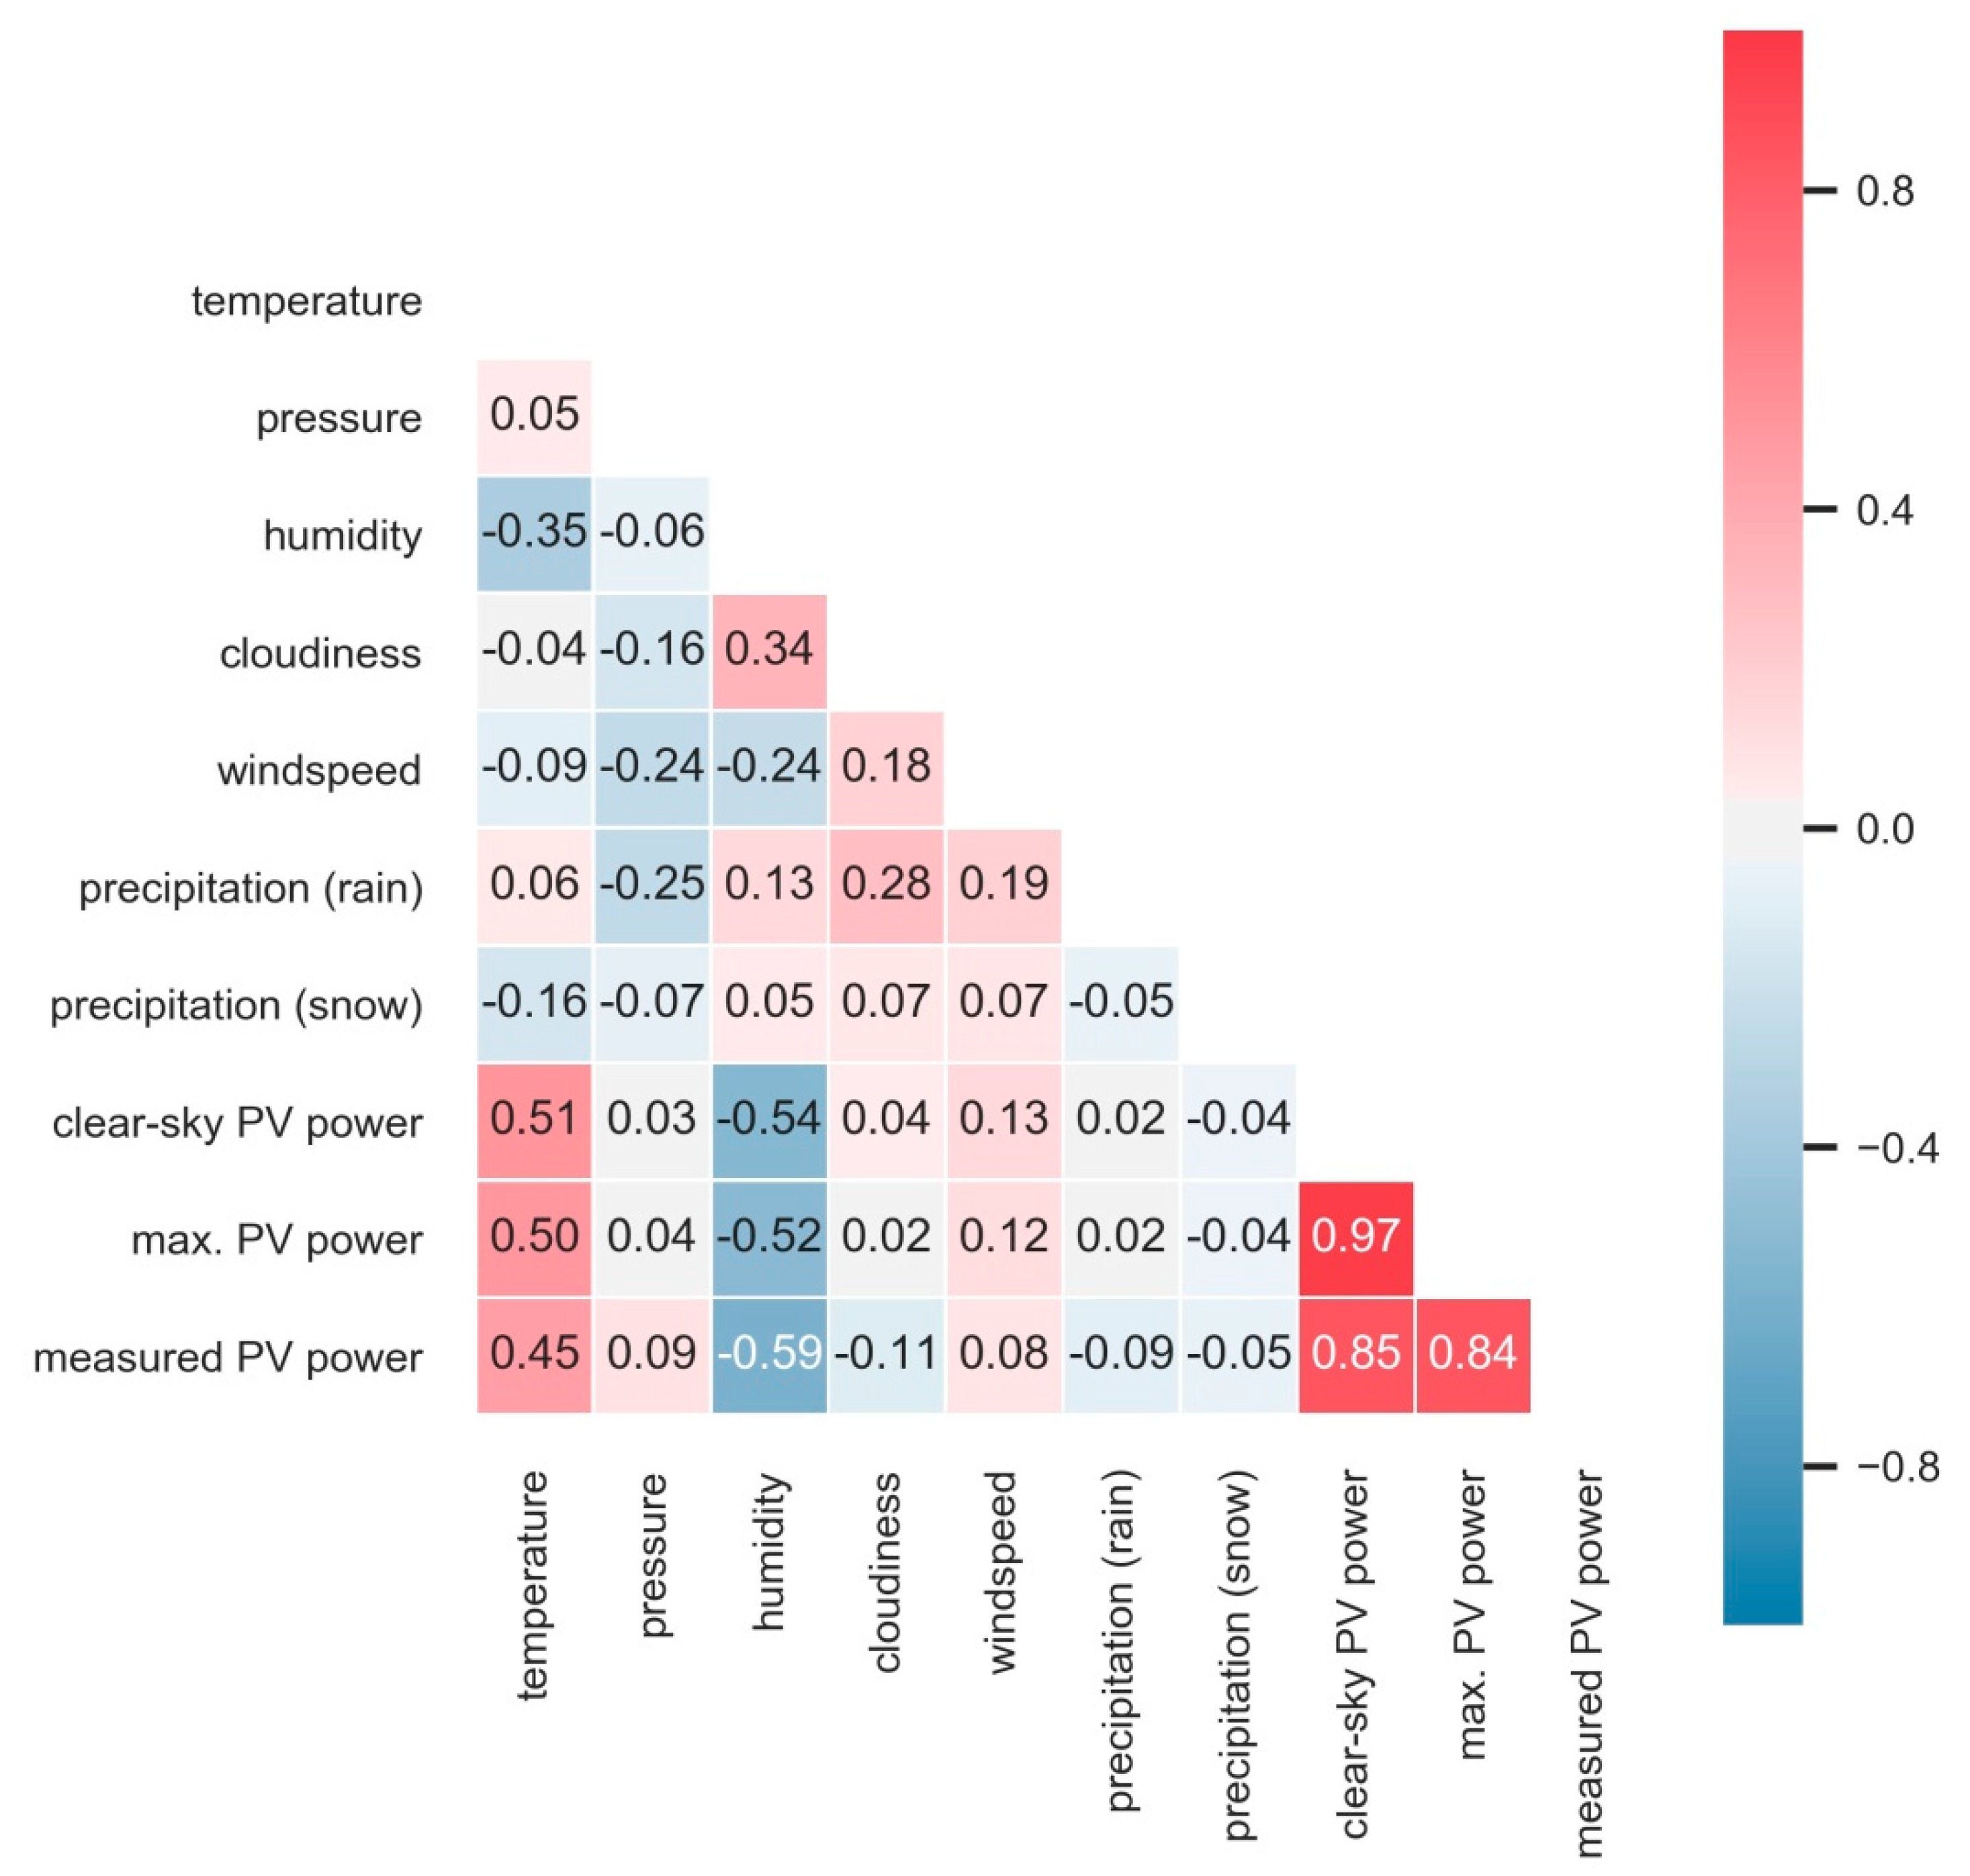
The correlation values between meteorological parameters from publicly available weather reports, two additional features, and PV power output are presented as a heat map in
Figure 2.
The correlation analysis showed that air temperature and humidity have a stronger relationship with PV power output in comparison with the other meteorological features. The strong positive correlation between PV power and temperature can be explained by the fact that daily curves of the solar irradiation and air temperature were similar to each other. In general, an increase in solar irradiation also causes an increase in air temperature. The same explanation is valid for the strong negative correlation between PV power and humidity. However, in this case, the increase in solar irradiation causes a decrease in humidity.
Despite the commonly perceived fact that the PV generation strongly depends on the current cloud cover, the given probability for cloudiness from the OWM showed a weak correlation with the measured PV power. The calculated maximum PV power values and the expected PV power under clear-sky conditions had the strongest positive relationship with PV power output, as the correlation values were greater than 0.80. Pressure, wind speed, and both precipitation features had the lowest correlation with the measured PV power, or the relationship between these features was strongly non-linear.
The two precipitation features “rain” and “snow” were combined as a common feature, which received the name “precipitation”. In the case of rain or snow, the parameter “precipitation” was equal to one; otherwise, it was zero. The correlation value between the new descriptive feature “precipitation” and the target feature “measured PV power” was −0.14.
The conducted correlation analysis helped for a better understanding of the data. Furthermore, the results of this analysis were applied for feature selection. Hall [
25] defined the feature selection as a process of identifying and removing features which contain irrelevant or redundant information. The presence of irrelevant information can reduce the prediction accuracy and make the results less understandable. By the same token, the removal of irrelevant features can improve the performance of the machine learning algorithm, whereby the operation time decreases and the algorithm operates more effectively [
25].
There are a lot of techniques for feature selection, but this research work used correlation values in order to identify and select the input features with relevant information. Only those descriptive features with correlation values greater than 0.1 or lower than −0.1 were selected for the predictive model. The selected features were air temperature, humidity, cloudiness, precipitation, maximum PV power, and clear-sky PV power.
The heat map in
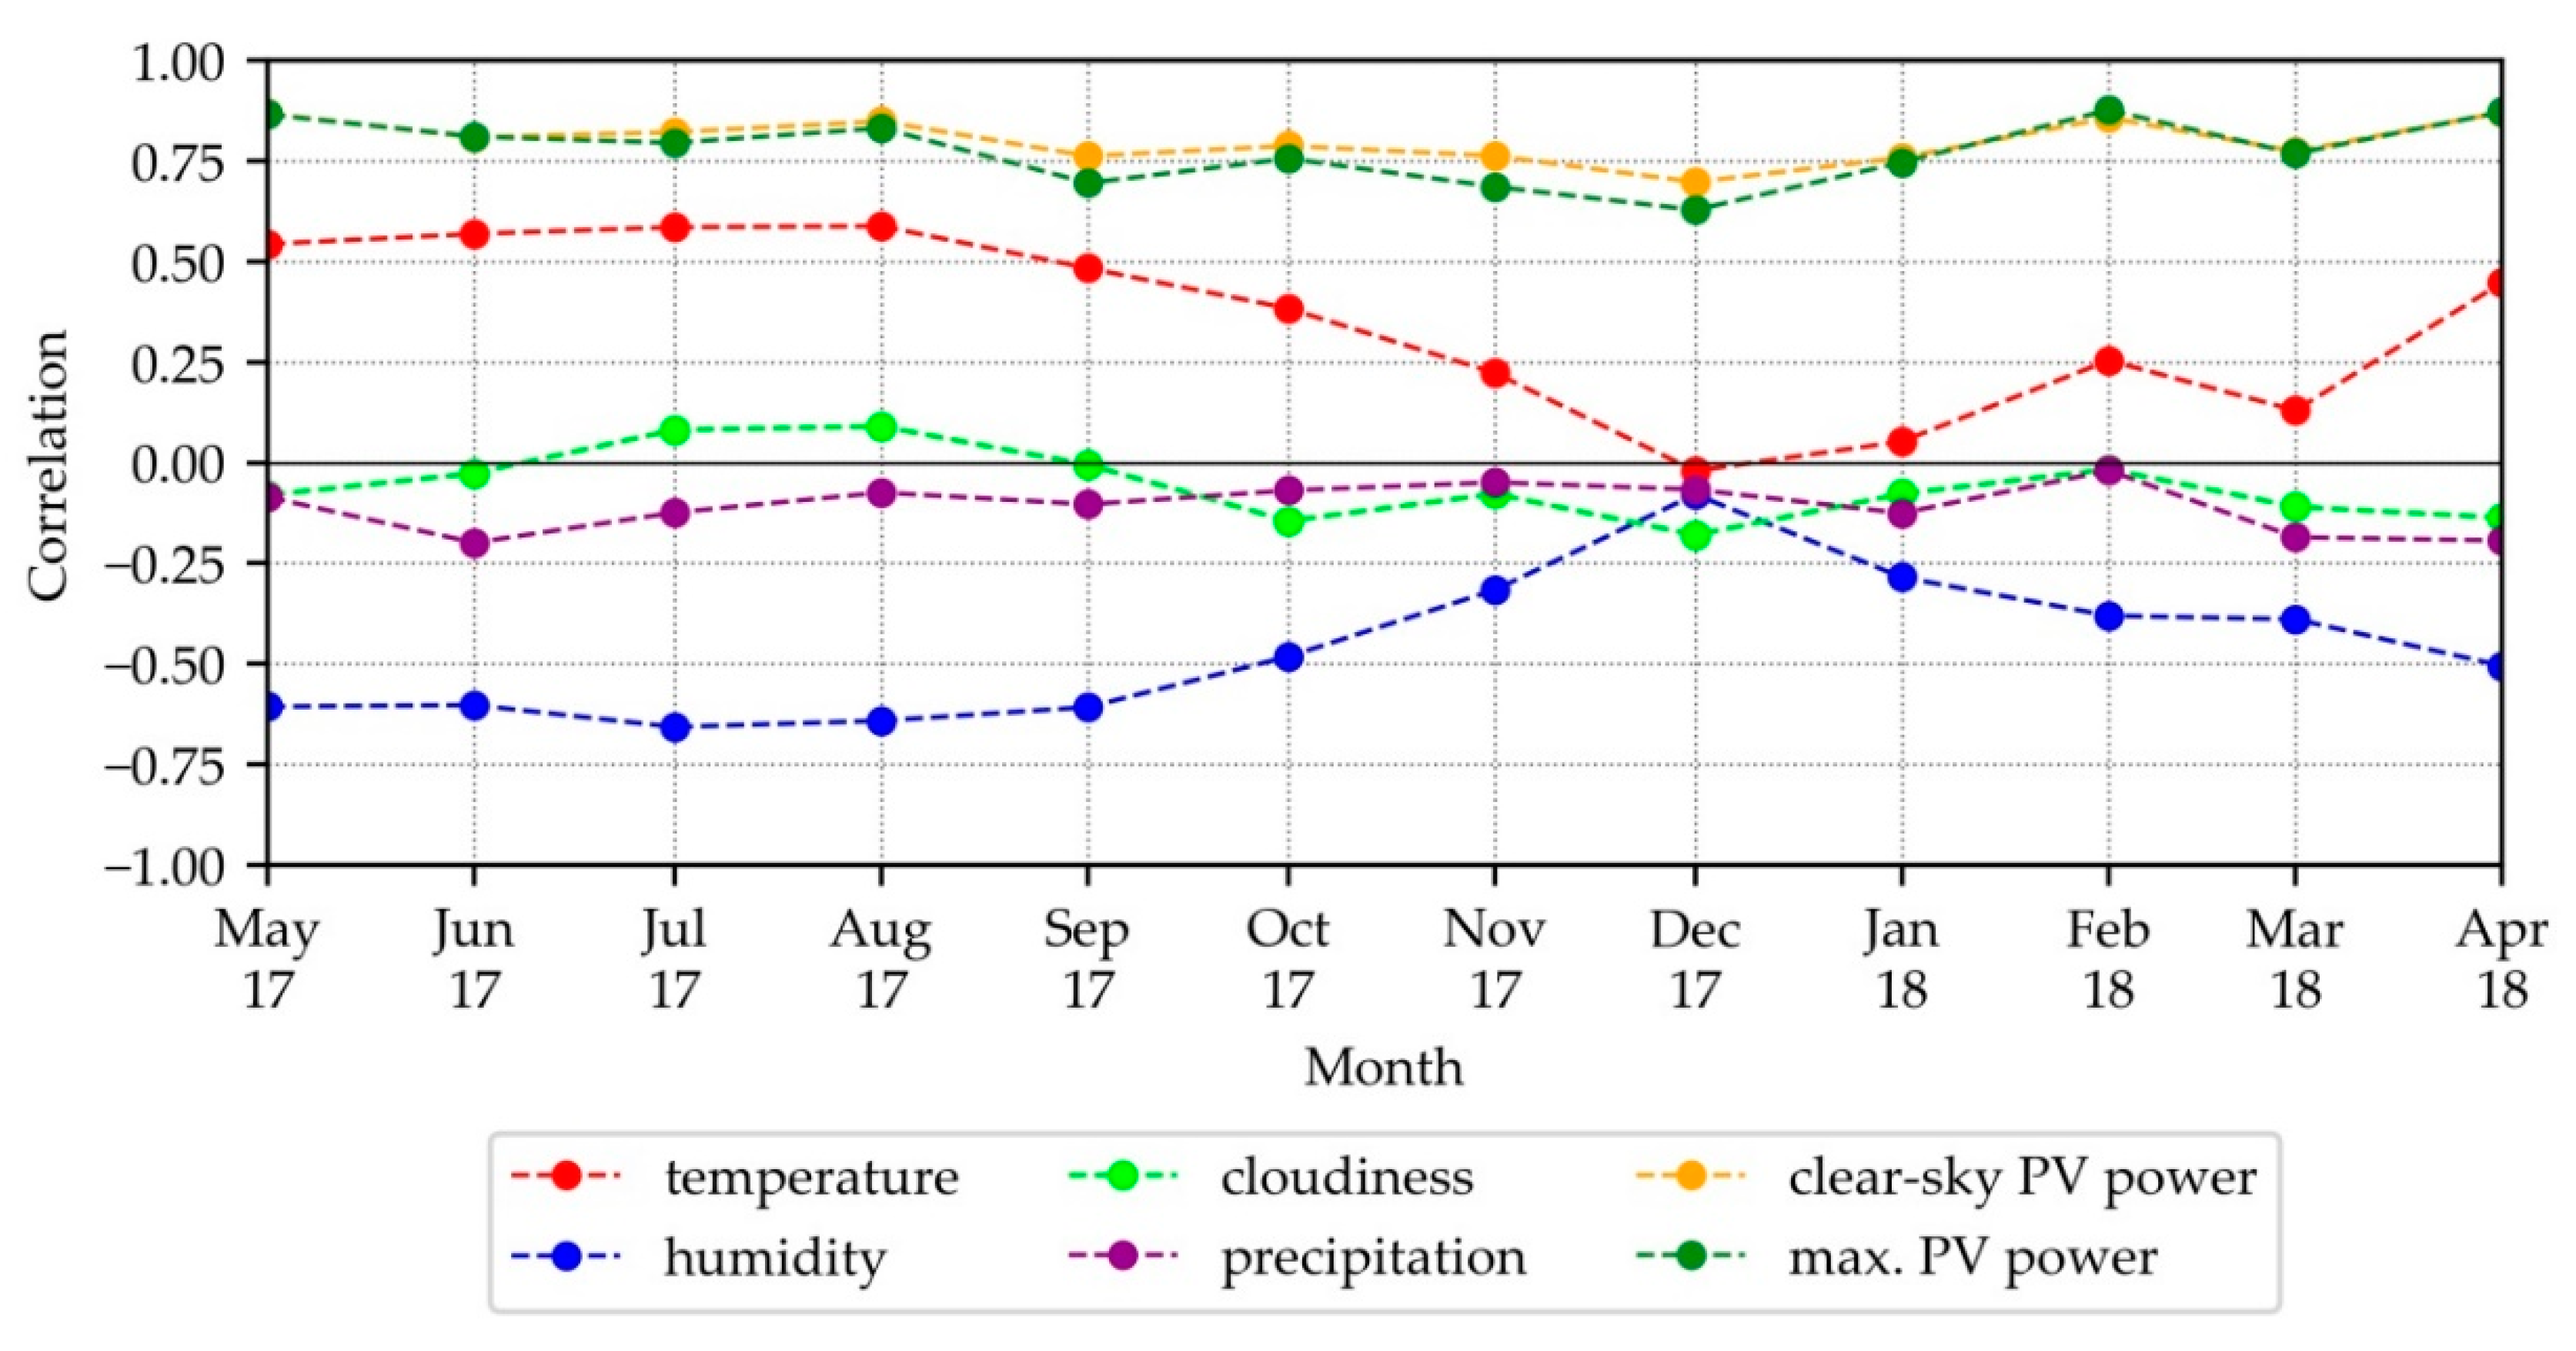
Figure 2 presents the correlation values for the whole observation period (one year). The next step was to investigate whether the correlation values were dependent on seasons or whether they remained constant throughout the whole year. For this purpose, the correlation was calculated for each month in the investigated period.
Figure 3 presents the monthly correlation values among the measured PV power, four selected meteorological parameters, and two additional features.
The correlation between the measured PV power and two additional features remained the strongest over the whole observation period. Moreover, the monthly correlation values between these parameters fluctuated slightly over the year; for example, the correlation values between the measured PV power and calculated maximum PV power ranged between 0.63 in December 2017 and 0.87 in April 2018. The relationship between the PV measurements and air temperature had strong seasonal dependency. The correlation between these features was much stronger in warm seasons. It decreased in autumn and reached its minimum in winter months. In spring, the correlation values began increasing again. The same tendency can be seen by observing the relationship between measured PV power and humidity. The correlation between the measured PV power and two remaining weather parameters did not fluctuate as strongly, and it lay between 0 and −0.25 for almost the whole year.
4. Results and Discussion
In this chapter, the PV power prediction, made with the publicly available weather reports, is presented, discussed, and compared with the prediction with fee-based solar irradiance data. Moreover, it was also checked whether the developed predictive model meets the defined requirements, such as self-learning ability, transferability, etc.
4.1. Choice of the Additional Descriptive Feature
Section 2.3. described two additional descriptive features: clear-sky PV power and maximum PV power. Here, these two features were compared by making predictions of PV power output and estimating the prediction accuracy. The developed predictive model was trained with the same weather data and the same power measurements of the PV system in Oldenburg (the installed capacity of this PV system is 1.14 W
P). Both training datasets contained 90 days of data. The architecture of the predictive model and the procedure of the predictive process also remained the same. The only difference was that the first input dataset contained maximum PV power and the second input dataset contained clear-sky PV power as the additional descriptive feature.
After training the model and predicting PV power, the MAE of this prediction was calculated for each day in the test set. These MAE values are presented in
Figure 7 in the form of boxplots.
A boxplot is a very representative way of displaying the distribution of values. The main components of boxplots are the box, median, whiskers, and outliers. The box or interquartile range contains the middle 50% of all values. The line in the box indicates the median. The space between the lower whisker and the box covers the range between the minimum and lower quartile. The space above the box includes the values from the upper quartile until the maximum.
The first important conclusion which can be drawn from
Figure 7 is that the extension of input data with one of the additional features (maximum PV power or clear-sky PV power) improved the prediction accuracy significantly; the median MAE decreased from 150 W to 67 W. The second important conclusion is that both additional features resulted in a similar accuracy of the PV power prediction. MAE values of these predictions varied between 25 W and 125 W. The only difference between these prediction accuracies was the distribution of the errors between the lower quartile, interquartile range, and upper quartile. Because MAEs of the predictions with both additional features had almost the same range, they could be equally used for PV power prediction.
To generate the maximum PV power, only two parameters are needed for the calculation: measured power of the PV system and pre-defined number of days looking back (see calculation procedure in
Section 2.3.2). The feature “clear-sky PV power” required more input data for its generation, including geographical coordinates, location name, and calculated specific clear-sky index for the feature generation. Thus, the additional feature “maximum PV power” was more independent than the feature “clear-sky PV power”. For this reason, it was decided to use the maximum PV power as the additional descriptive features for all predictions, as described later.
4.2. Prediction with Publicly Available Weather Reports
The developed predictive model with publicly available weather reports as input data must be able to make reasonably good predictions of PV power output. Moreover, the model must meet the requirements defined in
Section 1. One of these requirements was the suitability of the model for different seasons of the year. This requirement was checked using the PV system in Oldenburg. Therefore, the predictive model was tested for two periods of time with different weather and solar irradiance conditions: a warm period from 8 August until 30 August 2017 and a cold period from 19 March until 10 April 2018.
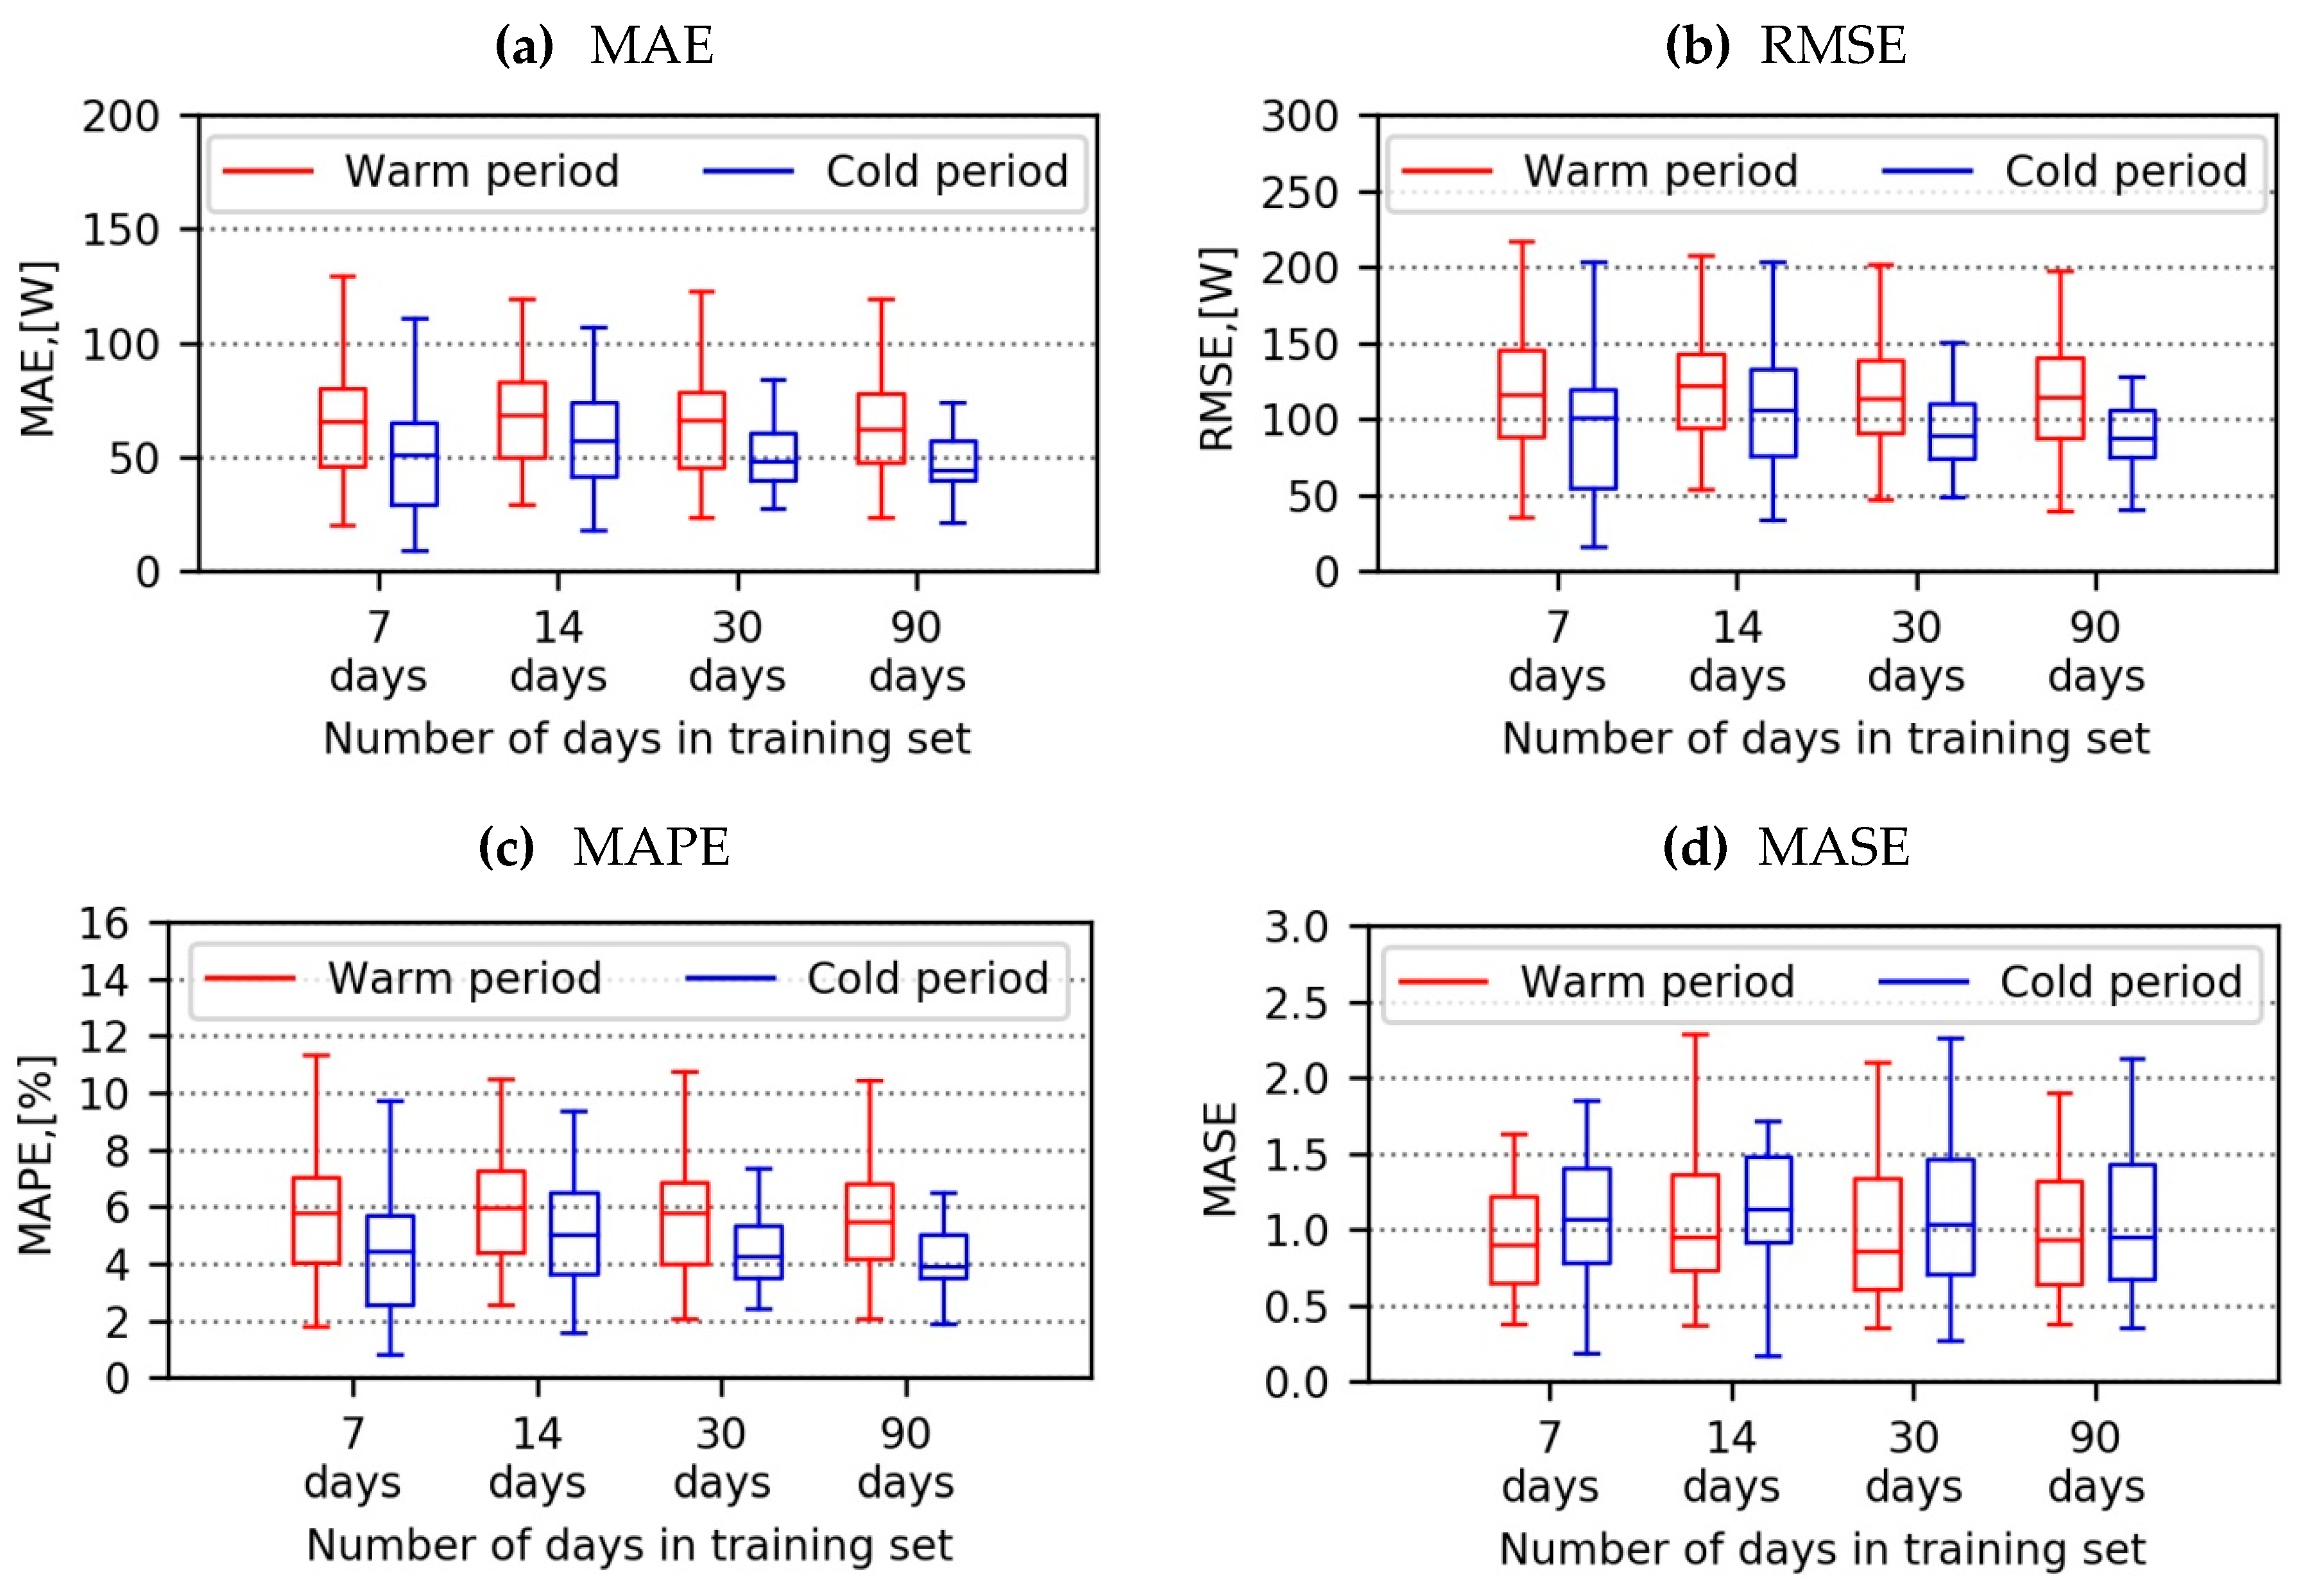
The prediction accuracies for warm and cold periods are displayed in
Figure 8 in the form of boxplots with the distribution of MAE, RMSE, MAPE, and MASE values. The predictions for both warm and cold periods were made using the predictive model, which was trained with four training set sizes one after the other. All training and test sets contained the data from publicly available weather reports. The
X-axis in the figure presents the four sizes of the training set, which were used to train the model. The
Y-axis shows the distribution of the error values for warm and cold periods.
The training dataset size was increased step by step in order to investigate and improve the prediction accuracy of the model. The prediction accuracy improved with the increase in size of the training set. This was especially significant in the cold period; for example, if the training set was increased from seven days to 90 days, the median MAE of the cold period decreased from 51 W to 45 W (almost 12%).
The next important point, which can be seen in
Figure 8, is that the scale-dependent errors MAE and RMSE in the cold period were lower than in the warm period (see
Figure 8a,b). These results can be explained by the fact that the measured values of PV power in winter were much lower than in summer. The percentage error MAPE had the same disadvantage. For this reason, it was important to calculate the scale-independent metric MASE and to use it for comparison of the prediction accuracy across different seasons.
The distribution of the daily MASE values for the two seasons and four training sets are also presented as boxplots in
Figure 8d. It is obvious from this figure that the prediction of the PV power in the cold period was less accurate than that in the warm period. The MASE medians of the cold period lay above 1.0 for almost all training sets, except for the set with 90 days, and the MASE medians in the warm period were about 0.90 for all training sets. One of the possible reasons for the better prediction in the warm period is that solar irradiance and, consequently, PV power output in the warm season was more stable, whereas the cold season had a lot of days with strongly fluctuating solar irradiance during the day. However, the developed predictive model should forecast the PV power output for all seasons of the year equally well. In this case, only the training set with 90 days could ensure appropriate prediction accuracy for both warm and cold seasons; the MASE medians of the PV power prediction for this training set were about 0.90, regardless of the season.
After testing whether the predictive model could accurately predict PV power for different seasons, the same model was also tested with regard to forecasting PV power for a completely different PV system. This system is located in Munich, Germany, and its installed capacity is almost one hundred times greater than the PV system in Oldenburg. The technical parameters of this PV system were presented in
Table 1. The power output prediction for the PV system in Munich was also made for 23 days from 8 June until 30 June 2019. The dataset of the Munich PV system was split in the same way as the dataset of the Oldenburg PV system (see
Figure 6).
Because the installed capacity of the Munich PV systems was much greater than the capacity of the Oldenburg PV system, only the scale-independent statistical metric MASE could be used for comparison of the prediction accuracy of these two systems. The average values of MASE for the whole test periods of the two PV systems are displayed as a dot chart in
Figure 9.
The predicted values of the Munich PV system had similar average values of MASE to the predicted values of the Oldenburg’s system. The most accurate prediction occurred again after 90 days of training, but the extension of the Munich training set to 90 days led to a greater improvement of the prediction accuracy.
Figure 9 not only shows the forecasting quality; it also verifies that the developed predictive model was able to forecast the power output for the different PV systems without any technical information about these systems, except for the measured power values, using only publicly available weather reports without direct prediction of GHI.
4.3. Prediction with Fee-Based Solar Irradiance Data
In this section, the PV power prediction with publicly available weather data was compared to the prediction with fee-based solar irradiance data. The main difference between these two data sources lies in the fact that publicly available weather data contain only indirect values of the GHI such as cloudiness and precipitation, while fee-based data contain measurements and predictions of the GHI, which are highly correlated with PV power output. The prediction of PV power output presented in this section was also made using the same predictive model described in
Section 3.
In the previous subsection, it was proven that the developed predictive approach could be used to make predictions for two different PV systems. This is why fee-based solar irradiance data were used to make predictions for only one PV system. The PV system in Munich was chosen for this purpose.
Firstly, the MASE values of the PV power predictions with publicly available weather reports and fee-based solar irradiance data for all training sets were compared with each other, in order to determine the optimal sizes of the training set for each data origin.
Figure 10 shows these values.
Figure 10 shows that the prediction accuracy of the model with the solar irradiance data was much better when using shorter training datasets. The extension of the training set with solar irradiance data from 30 days to 90 days led to an increase in MASE. The predictive model made the most accurate prediction if the training set contained 14 days of solar irradiance data or 90 days of publicly available data. The PV power predictions with these exact training set sizes are compared below.
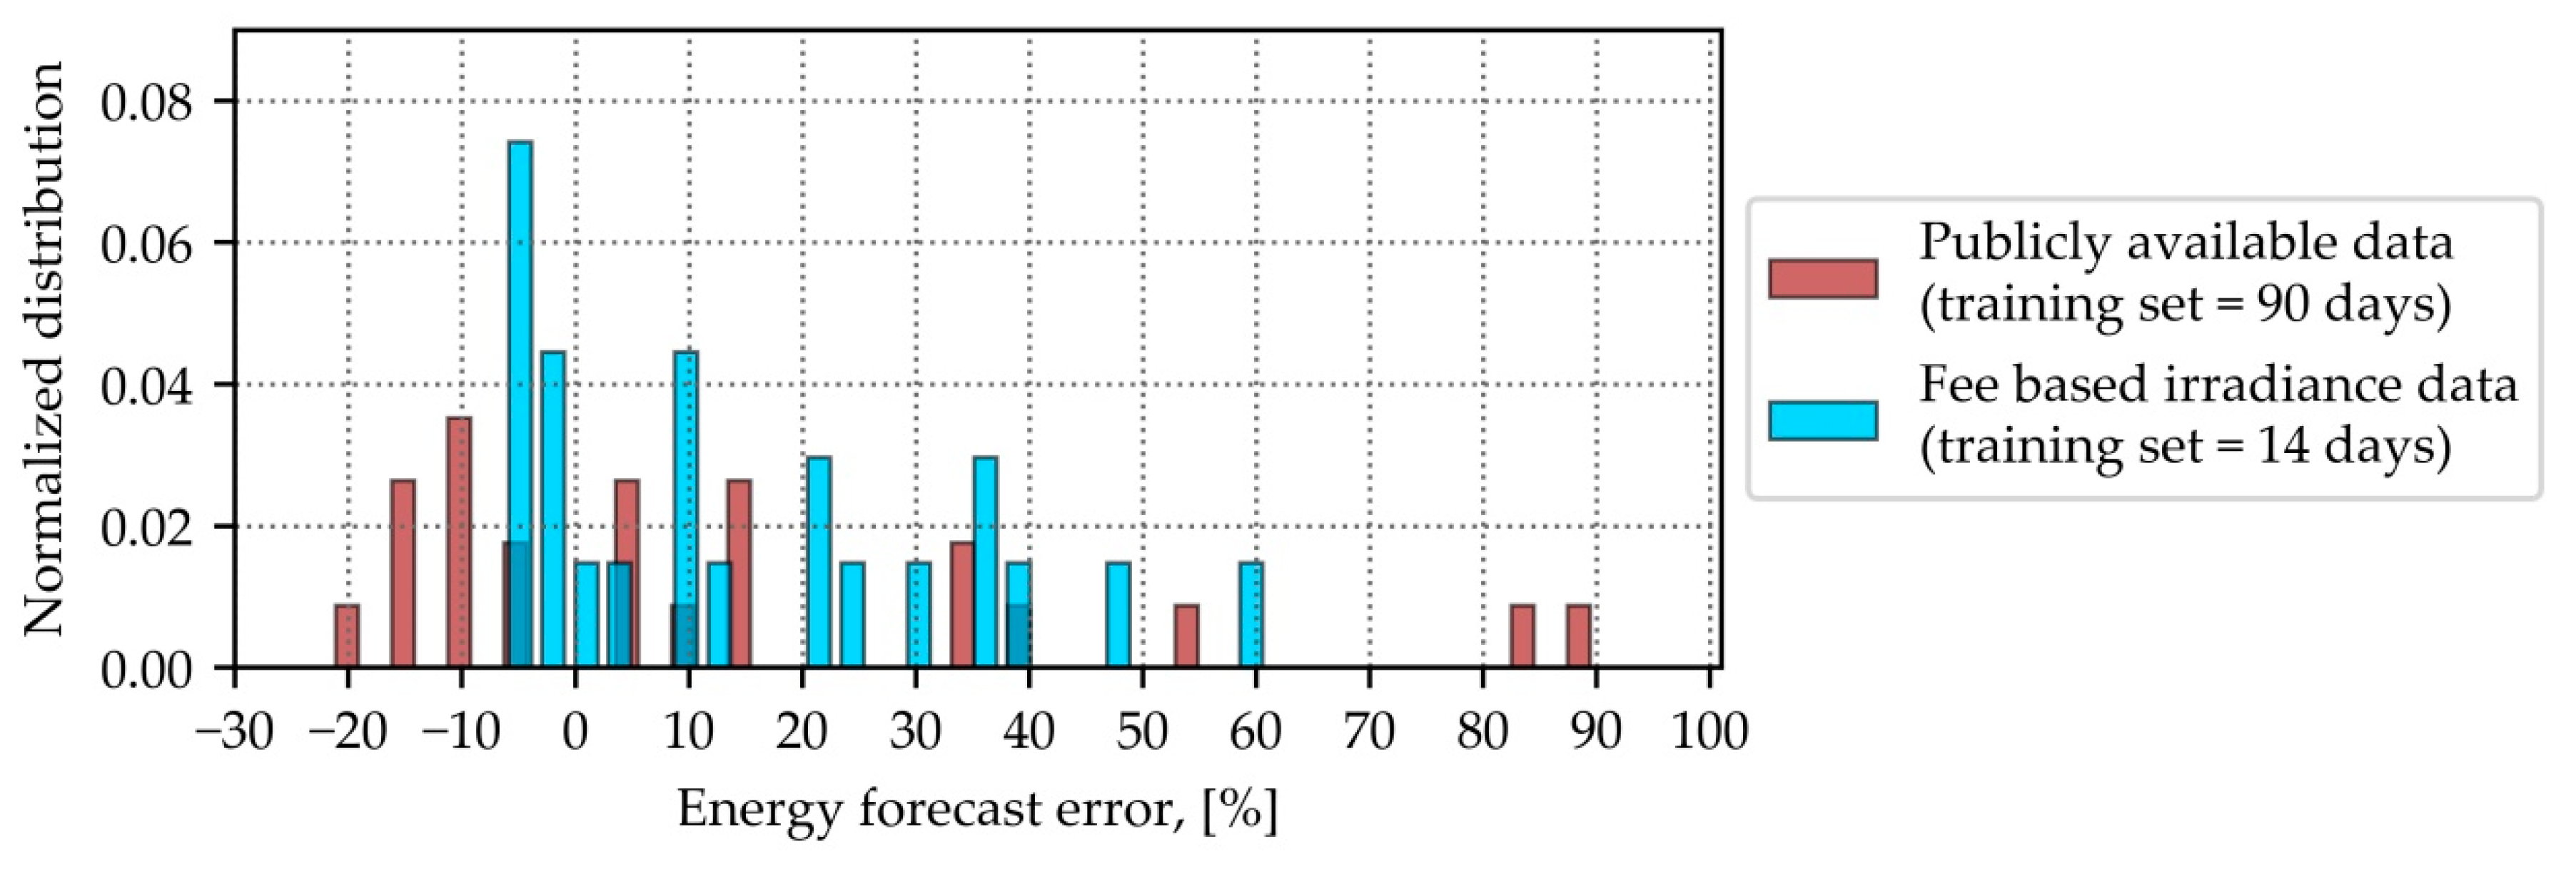
The next measure for the comparison between predictions, made with two data origins, was the error between the predicted and measured daily energies, calculated using Equation (9). The normalized distribution of energy forecast errors of the predictive model, which was trained with 90 days of publicly available weather data and 14 days of fee-based data, is displayed in
Figure 11.
Two main conclusions can be drawn from
Figure 11. The first conclusion is that the developed predictive model was slightly inclined to overestimate the measured values regardless of the input data used; about 60% of the energy forecast errors had a positive sign The second conclusion is that the predictive model with fee-based solar irradiance data could predict daily energy more accurately than the same model trained with publicly available weather reports. The energy forecast errors of the prediction with solar irradiance data varied between −10% and 60%, but the usage of publicly available weather reports for the input data led to an increase in forecast errors in both directions, i.e., overestimating and underestimating.
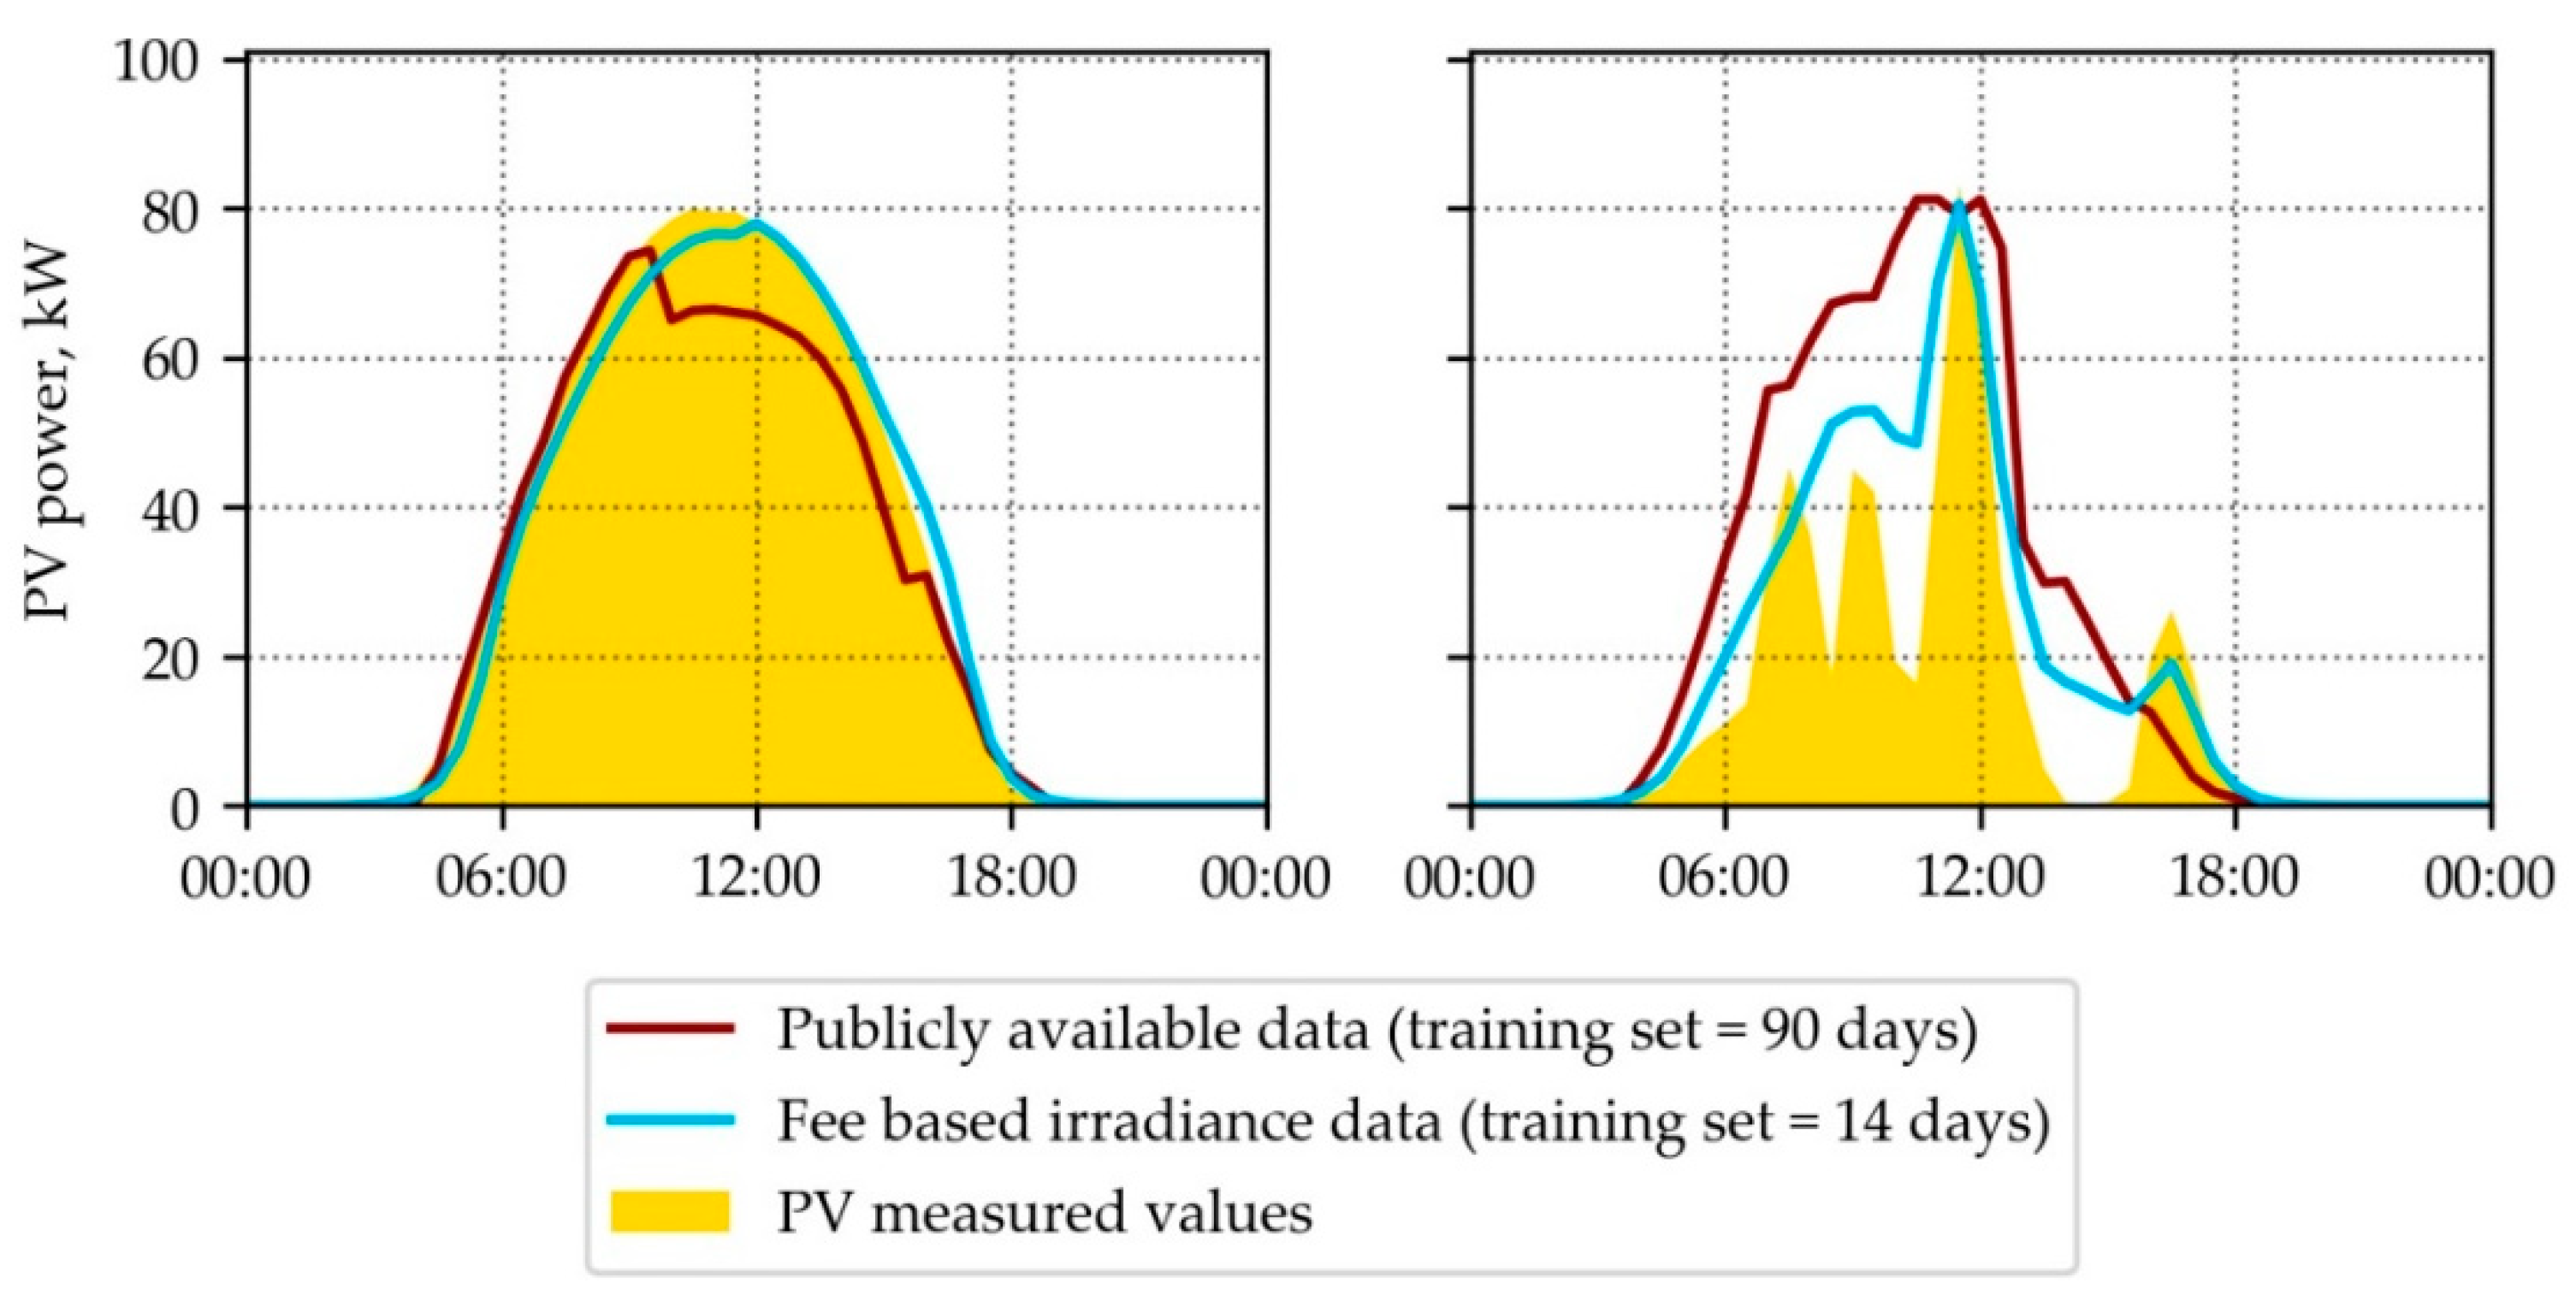
It is relevant to consider the predicted PV power output not only for the whole test period, but also for single days. This is why two days with different solar irradiance were selected from the test set: one with clear-sky conditions during the whole day (29 June 2019) and another with strongly fluctuating solar irradiance (20 June 2019). The developed model was used to make predictions for these days with publicly available weather reports and fee-based solar irradiance data. The results were compared to each other and to the measured values. The predicted and measured power curves for the selected days are presented in
Figure 12.
Despite the smaller training set, the model trained with fee-based irradiance data could predict PV power output more accurately for both selected days than the model trained with publicly available weather reports. Moreover, the training with solar irradiance data led to the model predicting single peaks and drops of the PV system accurately even with fluctuating PV power production on 20 June 2019. Despite the fact that publicly available weather reports do not have direct predictions of the GHI, the model trained for 90 days with this dataset could forecast the main trends of the PV power production for both days. Furthermore, this model was also able to predict the rapid power drop on the day with strongly fluctuating solar irradiance (20 June 2019 at 12:00).
5. Conclusions
The developed predictive approach is a data-driven method, where the quality of input data plays a key role. Therefore, the accuracy of the publicly available weather reports was investigated at the very beginning of the study. The accuracy of the PV power output prediction cannot be better than the accuracy of the used input data.
The evaluation of the prediction accuracy indicated that the machine learning approach provided adequate results of PV power prediction for the next 24 h even with publicly available weather reports. Although the publicly available weather data from OWM are to be used mainly on websites and mobile applications, they can be also used for the purposes of PV power prediction. This study also proved that it is possible to predict the PV power output without solar irradiance measurements and forecasts, and without any technical information about the PV system, except the measured power values. Because publicly available weather reports do not provide GHI values, this input dataset was extended with an additional descriptive feature, i.e., the maximum PV power of the last five days. The addition of this feature improved the prediction accuracy, prevented the prediction of PV power overnight, and avoided overestimated predictions of PV power by day.
The requirements of the predictive approach were defined in the motivation of the study. The first requirement was a fully automated online operation of the day-ahead PV power forecasting. This requirement was proven during the simulation, where the weather forecast was updated every 3 h. In the same time interval, the PV power was predicted for the next 24 h. The constant updating of the training set with current weather data and PV measurements resulted in a periodic re-training of the predictive model every 12 h. The second requirement was the transferability of the model for different seasons and PV systems. The suitability for different seasons was tested using a simulation with the dataset from Oldenburg, which contains weather data for warm and cold periods. The comparison of the simulation results with these two datasets pointed to an influence of seasons on prediction accuracy, as well as the ability of the model to adapt to seasonal weather changes. The transferability of the model to the PV systems with different locations, sizes, and technical parameters was proven by the prediction of the PV power for two completely different PV systems. During the transferability check, the main disadvantage of MAE, RMSE, and MAPE was detected. Therefore, the seasonal MASE was selected to compare the forecasting accuracies across different seasons and PV systems.
Afterward, the PV power predictions with publicly available weather reports were compared to the predictions with fee-based solar irradiance data. The predictive model, which was fitted with publicly available weather data, needed more training data in order to make more accurate predictions of the PV power. The best accuracy of the prediction with publicly available weather reports occurred using the training set with data from the last 90 days (the time resolution of all data was 30 min). If fee-based solar irradiance data were used, the training set with the last two weeks of data led to the most accurate prediction. The predictive model which used solar irradiance data not only had better prediction accuracy, but it also forecasted single power peaks and drops of the PV system more accurately than the model which used publicly available data.
The developed predictive approach with publicly available weather data is not suitable for applications which require higher accuracy and finer resolution, e.g., grid stabilization. However, the accuracy of the developed predictive approach with publicly available weather reports is suitable for other applications, such as forecast-based energy management system for buildings with PV systems. An energy management system based on PV power prediction can increase the self-consumption of the PV system and optimize its operation and flexible loads, such as BEVs and heat pumps. Moreover, if the PV power prediction is considered for the distribution of energy demand over the day, it can support a reduction in peak load, which prevents power limits on the house connection point from being exceeded and avoids high grid fees.
The publicly available weather reports from OWM and the PV power measurements are continuously recorded in order to collect more input data for training and validation of the developed predictive approach with a greater input dataset. This greater input dataset contains more information about seasonal circumstances, rapid weather changes, and relationships between weather data and PV power, which can improve the accuracy of the predictive approach.
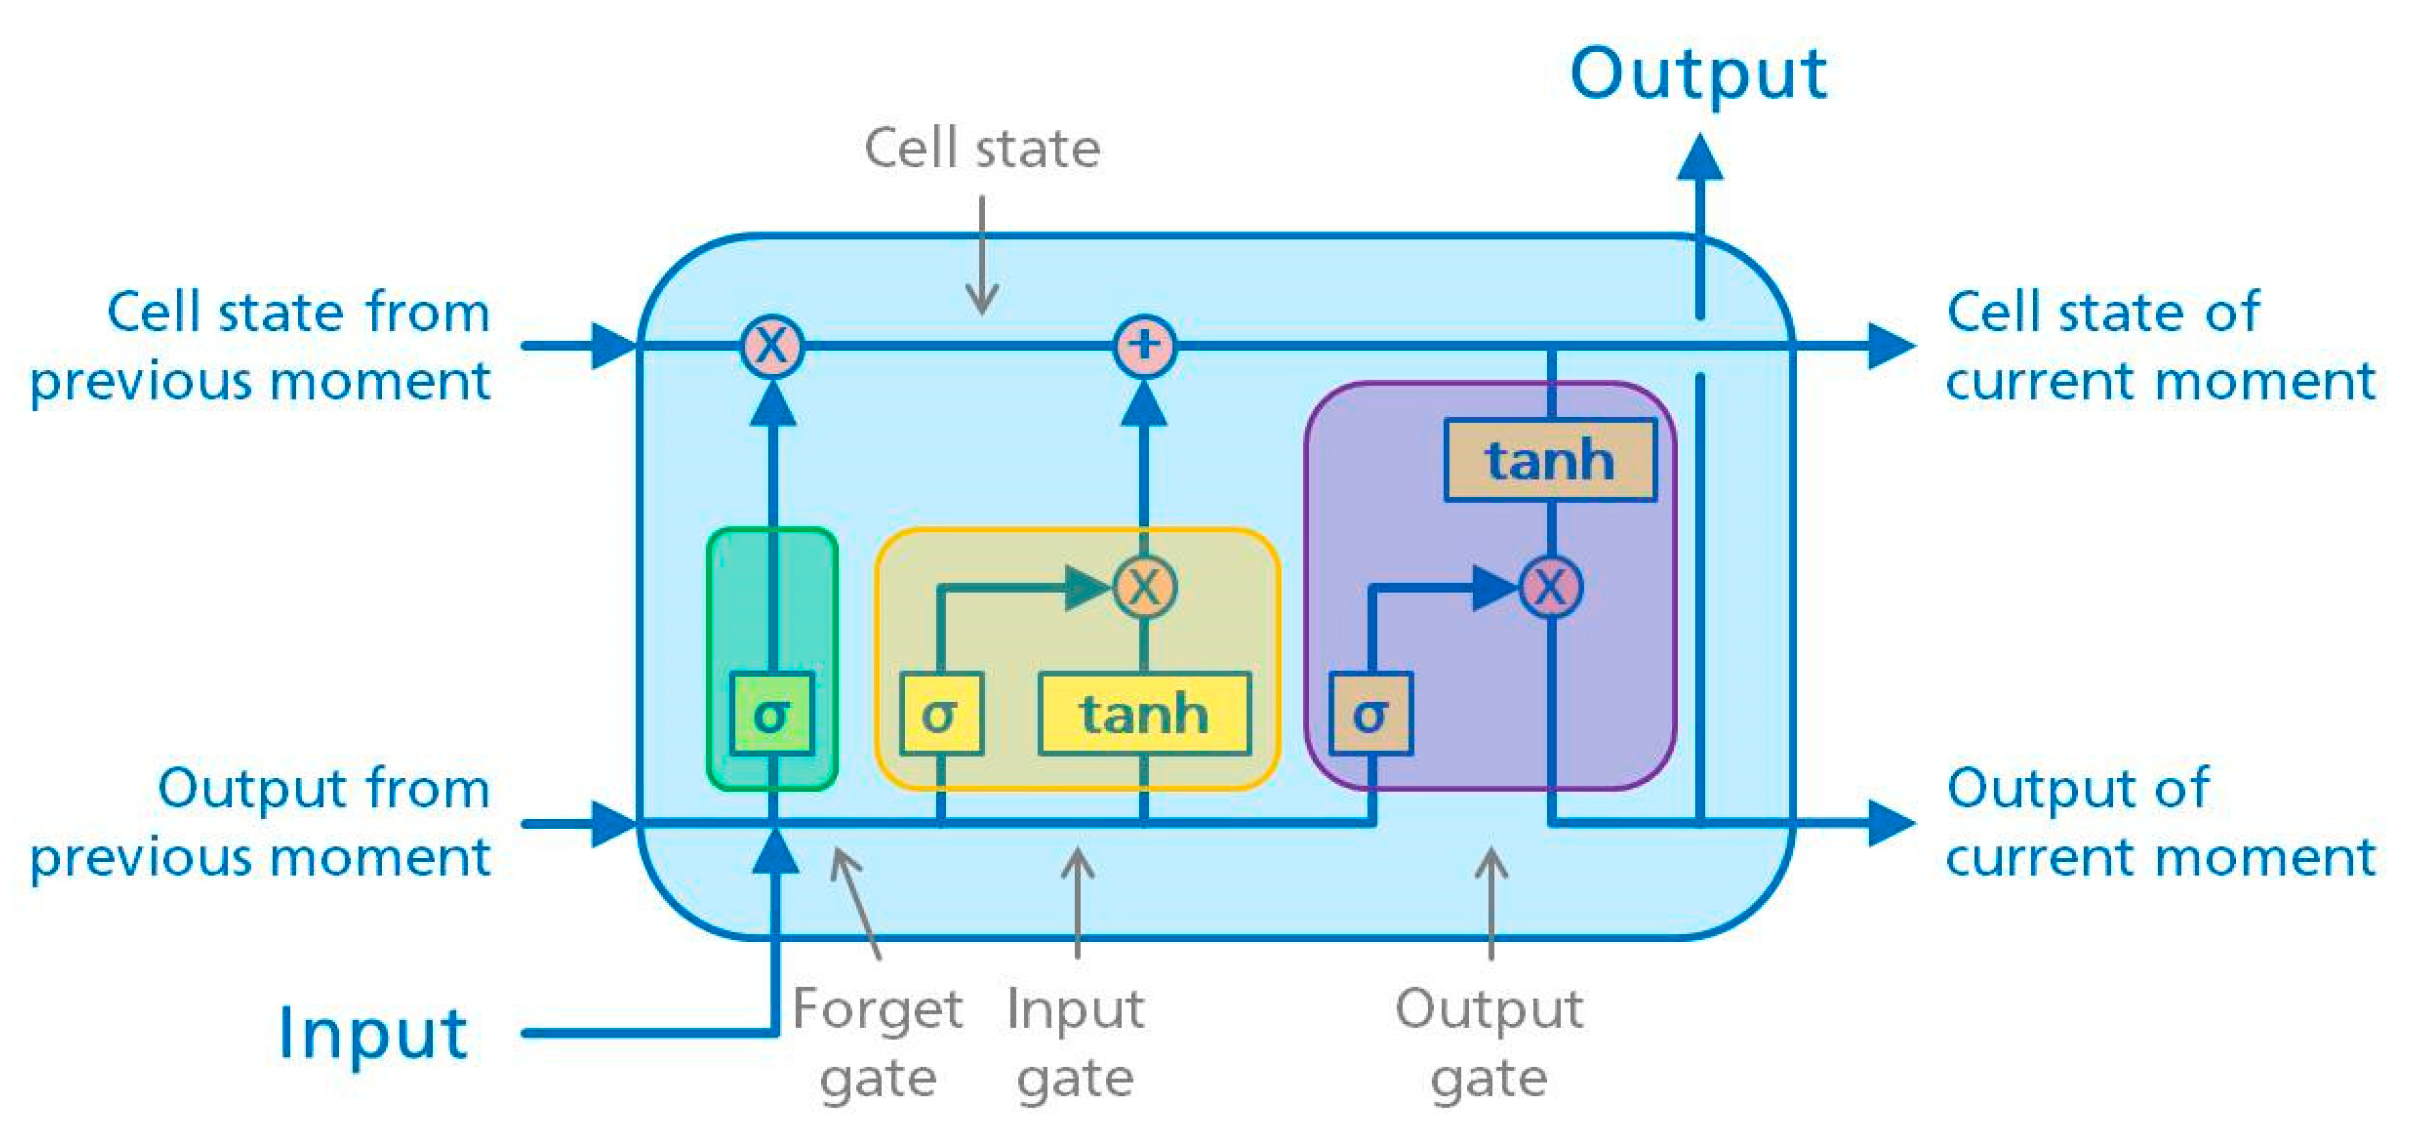
In this study, the accuracy of the developed predictive model with publicly available weather reports was improved in different ways, such as selection of appropriate input features and machine learning algorithm, optimal configuration of the LSTM network, increase in training set size, etc. However, the prediction accuracy may also be improved in the future if publicly available weather data sources provide measurements and prediction of solar irradiance.
Future investigations should not only deal with the improvement of the developed predictive approach, but also investigate many other questions. One of these refers to the optimal size of the training set. The accuracy of PV power prediction strongly depends on the type of solar irradiance for the next 24 h; in other words, the prediction accuracy depends on whether the prediction is made for a day with constant solar irradiance or for a day with strongly fluctuating solar irradiance. Therefore, it will be interesting to investigate dynamic sizes of the training set, i.e., the training set size can be adapted automatically depending on the weather forecast and type of solar irradiance. Dynamic training set sizes can also be more efficient in cases of disruptive changes like snow cover on PV modules or the failure of strings.
The focus for future investigation can be on an economic analysis of the PV power prediction. This study used only statistical metrics (MAE, RMSE, MAPE, and MASE) to evaluate the performance of the developed predictive approach and to estimate influences of the data origin on the prediction accuracy. Additionally, predictions made with different data origins can also be evaluated with economic metrics, e.g., whether paying for solar irradiance data can provide considerable economic benefit. Another goal for further investigations is a combination of the developed machine learning approach for PV power prediction with another approach for load prediction. These two approaches use different input features, predict different target features, and can use different measures for prediction accuracy evaluation. However, in order to evaluate the combination of these predictions uncertainty quantification needs to be conducted for both approaches. Afterward, these predictive tools can be integrated into the energy management system of the buildings.
