Abstract
One of the major causes of unintentional electrical fires is short circuit of an electrically and/or mechanically damaged alternating power supply cord. Detecting of such an event and interrupting the power supply may be beyond the capability of a conventional electro-mechanical circuit breaker. A lot of research papers have been published related to arc fault of wiring and its detection method. Furthermore, arc fault circuit interrupters have been put into practical use. The objective of the present paper is to understand fault of damaged power supply cord under two selected situations observed in practical use or considered suitable to understand fire ignition. Using two kinds of samples similar to but different from samples prescribed in UL1699 standard, the ignition mechanism of combustibles is discussed based on the results of laboratory experiments. The findings herein underscore the important role of the arc in the ignition of combustibles that are placed on the damaged part of a power supply cord, which is normally followed by a short circuit of broken element conductors or breakage of intact element conductors. Moreover, a possible arc detection feature in the two situations is discussed based on a distorted voltage waveform.
1. Introduction
Statistics show that, out of the 3972 fire incidents that occurred within the jurisdiction of the Tokyo Fire Department in Japan in 2018, 1205 originated from electrical equipment in domestic and industrial environments [1]. Moreover, the total number of annual electric fire incidents has increased gradually in the past five consecutive years (2014–2018), as depicted in Figure 1, eventually reaching 30.3% in 2018 [1]. Table 1 points out that one of the major causes of these fires was the wirings of electrical equipment, which include power supply cords and interior wirings. In fact, it has been reported that 38 out of the 448 fire occurrences that broke out from electrical appliances were due to faulty power supply cords, mainly from damaged or deteriorated electrical insulation, disconnection of element conductors by mechanical force, and/or aging [1].
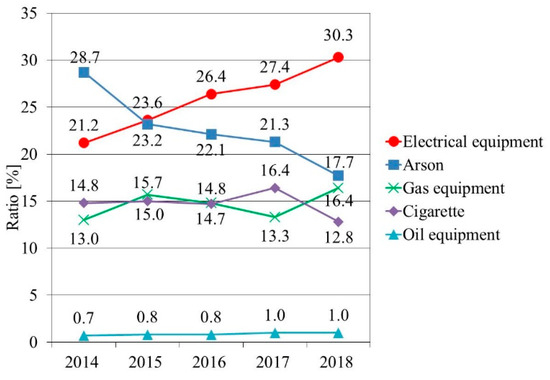
Figure 1.
Major causes of fire accidents within the jurisdiction of Tokyo Fire Department in Japan from 2014 to 2018 [1].

Table 1.
Origin of fires from electrical equipment [1].
Some or all of the element conductors in a power supply cord get broken when the cord is trampled by a heavy material, caught in something, or subjected to repetitive bending and stretching. External force acting on a cord during a large earthquake is also a possible cause [2]. The resultant short circuit of such a damaged power supply cord usually does not trip on a conventional electro-mechanical circuit breaker installed in a distribution panel, because the magnitude and duration of this short-circuit current are below the operation threshold [3,4].
A lot of research related to the arc fault of wire and its detection method has been carried out earnestly. Standards of AFCI (arc-fault circuit interrupter) or AFDD (arc-fault detection device) have been established [5,6]. In studies carried out in accordance with UL1699 standard [7,8], the sample is prepared by slicing polyvinylchloride (PVC) across the wire to reveal the conductor, and then, the wire is wrapped with two layers of electrical tape and two layers on fiberglass cloth tape. A conducting path across the insulation at the slit is created using a high voltage power source. Parallel arcing is discussed with the sample. In a series arcing sample, the wire of one cable is completely broken and there is a space between conductors. It is considered that an arc progresses along carbonized PVC surface or in the space between broken conductors. It has also been reported that fire starts from volatile gases produced by decomposition of PVC and the arc continues with the help of carbon produced by the arc [8]. Furthermore, phenomenon of short circuit in damaged power supply cords or wirings was also studied [9,10,11,12], along with the possible methods for its detection.
An arc is characterized by reduced current, voltage drop across the arc, high frequency chatter, zero-current section in each half cycle of current, steep rise of current, and so on [3]. Several types of AFCI (Branch/Feeder, outlet circuit, and combination) have been realized [3]. An AFCI seems to detect frequency component around 100 kHz of current and break the circuit when the component sustains for more than a few milliseconds [13]. In order to detect a series arc, a band-pass filter was proposed with the use of a discrete wavelet transform [14]. A discrete wavelet transform and a radial basis function neural network were also proposed to identify the occurrence of a series arc in indoor low-voltage power lines [15]. In order to identify arc faults from load states, an algorithm is introduced based on a weighted least squares support vector machine [16]. Another power supply interruption method, by converting a short-circuit fault into a line-to-ground fault, was also proposed [17]. Additionally, detecting ultraviolet light, which is emitted by discharge during short circuit, was mentioned as an effective technique [18], whereas another proposed method focused on the distortion of voltage waveform during short circuit [4].
It is worth mentioning that providing a highly reliable fire prevention system requires a better understanding of the physical mechanism of fire occurrences in all prospected scenarios. In line with the arc in damaged power supply cords, two possible physical mechanisms of the ignition of combustibles on the cord are discussed in this paper based on the experimental results using two kinds of samples similar to but different from samples prescribed in UL1699 standard. Essentially, short circuit occurs when a broken element conductor in one cable of a cord comes into contact with an element conductor in another cable, followed by an arc. An arc is also observed when an intact element conductor is melted and disconnected by Joule heating. This paper also provides a possible feature based on a distorted voltage waveform, which can potentially be used to detect an arc in the two situations.
2. Arc at Short Circuits Caused by Contact of Broken Element Conductors
2.1. Sample
A commercially available AC power supply cord (125 Vrms, 7 Arms, 0.75 mm2 nominal cross section) was considered for the arc test. Each cable of the cord had 30 bundled copper element conductors (0.18 mm in diameter), with polyvinylchloride (PVC) acting as the electrical insulation.
A bending test of the cords was performed with a bending tester (Yasuda Seiki Seisakusyo Ltd., No.225, Nishinomiya, Japan) in accordance with the Japanese Industrial Standard [19]. Conditions of the bending test are summarized in Table 2. The test was conducted so that there was no apparent damage on the surface of the PVC. Samples with about 26 broken element conductors in both cables of the cord could be prepared under the conditions. In order to increase the probability of ignition of combustibles, bending test was performed at two locations of a cord, which were separated by a distance of 5 cm.
Table 2.
Bending test conditions.
Appearance of the cord after bending test is shown in Figure 2. The white marks on the cord in Figure 2 do not indicate damage, but are indication of the location of bending. A microfocus X-ray computed tomography (CT) system (Shimadzu Corporation, SMX-225CT) enabled the nondestructive inspection of a sample. Condition of the element conductors in the sample was observed clearly without removing the PVC. Figure 3 shows an example of X-ray CT image.
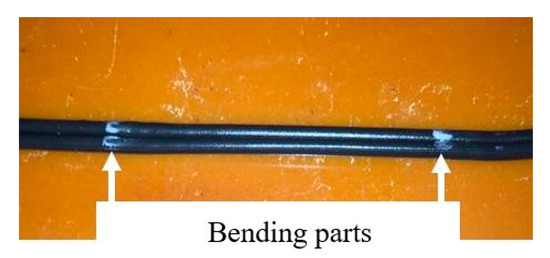
Figure 2.
A typical power supply cord after bending test.
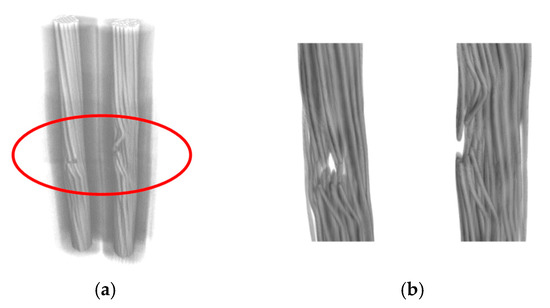
Figure 3.
Example of X-ray computed tomography image. (a) overall image (b) magnified image of circled part in (a).
Herein, “partially broken” is used to describe the status in which some of the element conductors are broken and at least one element conductor remains intact.
The present sample is similar to a sample described in UL1699 standard [5], which is used for a parallel arc experiment. The latter is prepared by slicing PVC across the wire to reveal the conductor and then the wire is wrapped with two layers of electrical tape and two layers of fiberglass cloth tape. Conducting path across the insulation at the slit is created using a high voltage power source [7]. Conversely, PVC is not sliced in the present sample, which is probably close to a practical situation.
2.2. Experimental Procedures
The experimental circuit is shown in Figure 4. Here, an AC voltage of 100 Vrms and 60 Hz was supplied to the sample from a distribution board in the laboratory. The resistance of the internal wirings was simulated with two 0.4 Ω resistors. A 45 cm long sample cord was laid straight and flat, with the load being eight incandescent lamps (1600 W in total). Combustibles cut from a cushion were placed on the sample to cover the two partially broken parts. The principal component of the combustibles was dry cotton.
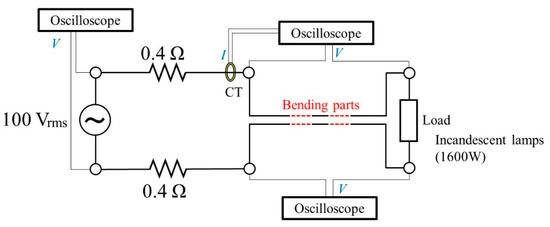
Figure 4.
Experimental circuit for samples with the partially broken element conductors.
The voltage and current waveforms were recorded simultaneously using a digital oscilloscope (Tektronix TDS3034B). Subsequently, these voltage and current data were applied for calculating the resistances of the cables. An infrared thermometer (Keysight U5855A) and a video camera were also used. Based on the preliminary experiments, the temperature on the PVC surface increased just after the commencement of current flow and tended to saturate after 10 min. About 10 min was enough for the sample to be cooled down to ambient temperature [12]. Considering these conditions, a 60 min cycle was adopted in the experiment, in which a 13.5 Arms current was supplied to the sample for 45 min, followed by a pause for 15 min. The cycle was repeated intermittently.
2.3. Results and Discussion
Figure 5 illustrates the temperature variation on the PVC surface with respect to the number of cycles. Here, temperature means the highest value reached in a cycle. At the beginning, the temperature increased gradually with the number of cycles. Then, a sudden increase was distinctly observed during the 10th cycle, when the temperature rose to approximately 180 °C, before becoming almost constant afterwards. A remarkable variation in the resistance of each cable could also be confirmed at the 10th cycle; it is worth noting that such variation of resistance was slight before and after the 10th cycle. Similar changes in the temperature and resistance of cables, such as the ones depicted in Figure 5, were observed in other samples.
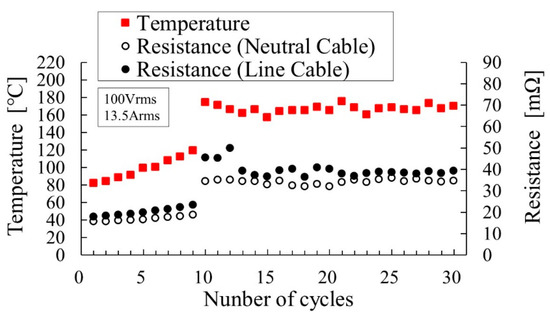
Figure 5.
Temperature on the polyvinylchloride (PVC) near the partially broken part and the resistances of the cables with the partially broken element conductors.
Figure 6 shows temperature distribution around the partially broken part measured with an infrared thermometer. Note that the steep rise in temperature of the power supply cord is observed in a limited region, as shown in Figure 6a. The temperature on the outside surface of the combustibles is almost the same as the ambient temperature, as shown in Figure 6b. Moreover, Figure 6c shows the temperature distribution when the combustibles are turned over. It is confirmed that the temperature of the power supply cord and the surface of the combustibles in contact with it reaches approximately 200 °C.
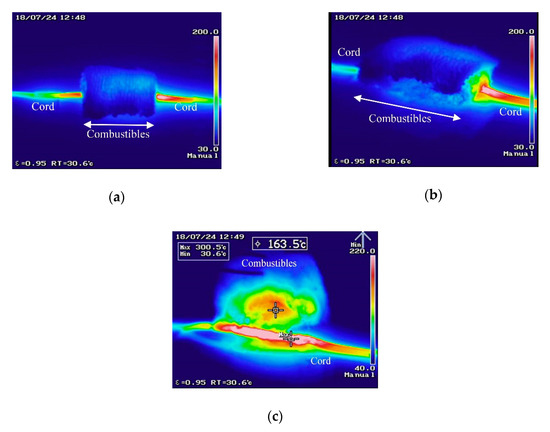
Figure 6.
Temperature distribution around the partially broken part (Voltage 100 Vrms, Current 13.5 Arms). (a) External appearance (front view); (b) External appearance (oblique view); (c) Surface of combustibles and power supply cord (combustibles are removed and turned over).
Figure 7 shows X-ray computed tomography images, which clearly show the condition of the element conductors at a partially broken part of the sample before the start of the experiment and after the 6th cycle has been completed. The broken element conductors were tightly bundled together and assumed contact with other element conductors prior to the onset of the experiment. On the contrary, the element conductors were seemingly loosely bundled after being subjected to a temperature of approximately 150 °C for six cycles. A large space was also found between the broken element conductors. Considering that the glass transition temperature of PVC is within 70–80 °C [20], these changes in the condition of the element conductors have probably been formed by thermal expansion and shrinkage of PVC during the cycles. Although different samples were used in Figure 5 and Figure 7, it is suggested that the sudden increase in temperature and resistance, as illustrated in Figure 5, may be explained by such a change in the condition of the element conductors.
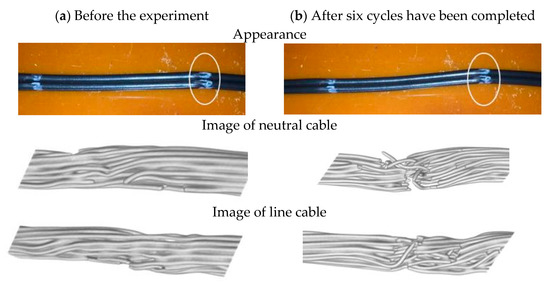
Figure 7.
Appearance of partially broken power supply cords and images of element conductors in cords obtained with the microfocus X-ray CT system.
For the sample shown in Figure 5, the arc occurred just after the commencement of current flow in the 31st cycle; thus, ignition of the combustibles in Figure 8 was observed. At the partially broken part of the sample, the current concentrates on the remaining intact element conductors and causes the generation of a large amount of Joule heat. Accordingly, the PVC is softened and expanded. Because the PVC contracts in the cooling process when the current flow pauses, a broken element conductor in one cable of the cord may pierce and break through the PVC between cables by shrinkage stress. When the element conductor comes into contact with that in the other cable, a short circuit occurs by bridging conductors of cables. Thereby, an arc may be generated when current is supplied again in the next cycle. This hypothesis is probably supported by a small hole found sometimes in thermally deformed PVC.
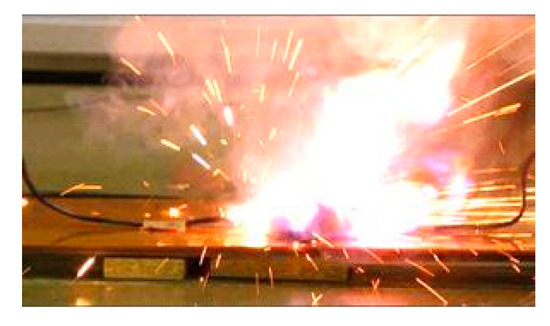
Figure 8.
Ignition of combustibles.
The results of the eight samples are summarized in Table 3. Here, the word “temperature” indicates the highest temperature recorded by the end of the experiment of a sample, whereas “commencement time” denotes the time when the short circuit occurred after current has been supplied in the cycle. In most samples, short circuit occurred immediately or shortly after the cycle current flow commenced, which suggests that the broken element conductors of both cables contact with each other during the cooling process in the previous cycle, as mentioned above. Such a short circuit continued for a rather long time or repeated intermittently until all of the element conductors were broken. It is noted that an arc during the short circuit did not always lead to the ignition of combustibles. The thermal circuit breaker (20 Arms) that was installed in the circuit did not trip in these experiments, because the short-circuit current and its duration, as shown in Table 3, were below the threshold values of operation.
Table 3.
Experimental results for the partially broken samples.
It has been reported that fire starts from volatile gases produced by decomposition of PVC and the arc continues with the help of the carbon produced by the arc [8]. In the present experiment, short circuit mostly occurs, and the arc generates immediately or shortly after the commencement of current supply. It is considered temperature of PVC is not so high to produce volatile gases. Thus, the following scenario may be proposed.
- (1)
- Mechanical forces break some of the element conductors, thus allowing the formation of a partially broken part in the power supply cord.
- (2)
- At the partially broken part, the current runs through the remaining intact element conductors, which results in a rise in temperature of the PVC due to a large amount of Joule heat.
- (3)
- The softened PVC releases a tightening force applied to the element conductors.
- (4)
- The broken element conductor in one cable of the cord pierces and breaks through the PVC between cables and comes into contact with other element conductors in the other cable, probably by shrinkage stress acting on PVC during the cooling process when the current supply is paused.
- (5)
- Since the element conductor bridges conductors of two cables by the end of a cooling process, a short circuit occurs immediately or shortly when current flows again in the next cycle, and an arc generates.
- (6)
- By coming into contact with an arc or a piece of melted element conductor, a minute portion of the combustible occasionally reaches its flash point temperature, which results in probabilistic ignition.
In real life situations, these phenomena are possibly observed in a power supply cord of household appliances and in an extension cord when they are trampled by heavy material such as a chest of drawers, caught in something, or subjected to repetitive bending and stretching. There may be a possibility to observe these phenomena in cords subjected to frequent heat cycle, for example, caused by repetition of supplying and pausing current. More investigation will be necessary to validate the proposed scenario.
3. Arc Caused by the Breakage of Intact Element Conductor
3.1. Sample
The tested sample was a commercially available AC power supply cord (300 Vrms, 12 Arms, 1.25 mm2 nominal cross section). Each cable of the cord had 50 bundled copper element conductors (0.18 mm in diameter), with PVC acting as the electrical insulation.
Two cables of the sample cord were separated from each other. After partially removing the PVC of one of the cables, 49 element conductors were broken artificially and also removed. Thus, only one element conductor remained intact, as shown in Figure 9. No treatment was given in the other cable. The sample was 10 cm long, and its partially broken part was 1 cm long.
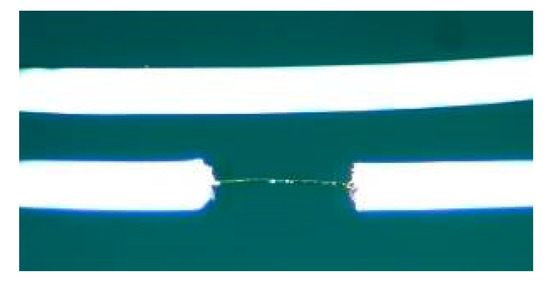
Figure 9.
Appearance of a sample with one intact element conductor.
This sample is similar to a sample used for series arcing experiment [7], where conductor is completely broken and there is a space between conductors. It is considered that arc progresses along PVC surface or in the space between broken conductors. On the contrary, in the present sample, element conductors are not completely broken and one remains intact. An arc generates when an intact conductor element is melted by Joule heating.
3.2. Experimental Procedures
The experimental circuit is shown in Figure 10. The sample was connected to a load of 10 incandescent lamps (1000 W in total), with 100 Vrms (60 Hz) and 9.7 Arms being supplied continuously to the sample from a wall outlet in the laboratory. As the ignition of the combustibles was investigated by arc discharge, they were placed on the sample to cover the intact element conductor, as shown in Figure 11. The principal component of the combustibles was dry cotton cut from a cushion: the same material used in the experiments in Chapter II.
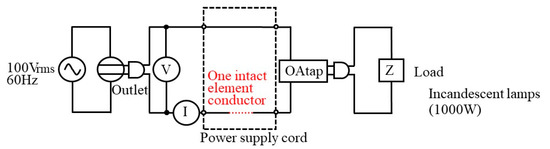
Figure 10.
Experimental circuit for sample with one intact element conductor.
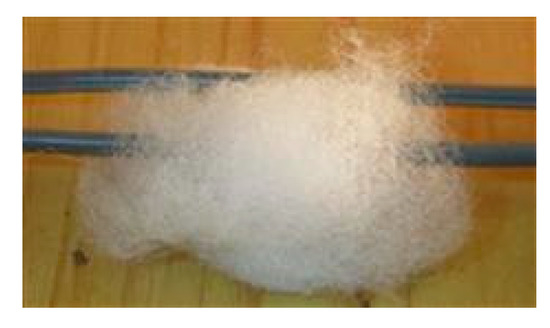
Figure 11.
Combustibles placed on the sample cord.
Voltage and current waveforms were recorded with 1 μs sampling time using a digital oscilloscope (Agilent 54832B) until the intact element conductor was melted by Joule heating. A high-speed camera (Photron FASTCAM SA1.1) was used to record the phenomenon.
3.3. Results and Discussion
Figure 12 shows a photograph at the time of arc generation in the case of no combustibles. Continuous current flowing in the intact element conductor resulted in a rise in its temperature by Joule heating. Finally, the element conductor melted and arc occurred. The arc ceased within a few milliseconds with the breakage of the element conductor. Dispersion of high-temperature pieces of the melted element conductor is confirmed in Figure 12.

Figure 12.
Arc observed at the time of breakage of an element conductor.
When there were combustibles, their ignition, as illustrated in Figure 13, could be observed occasionally. However, note that the probability of ignition of the combustibles was much lower than that described in the experiment in Chapter II, which could be attributed to the weak and short-duration arc in the present experiment. Nevertheless, the ignition probability might increase with the increase in the number of intact element conductors. The thermal circuit breaker (20 Arms) installed in the distribution panel did not trip.
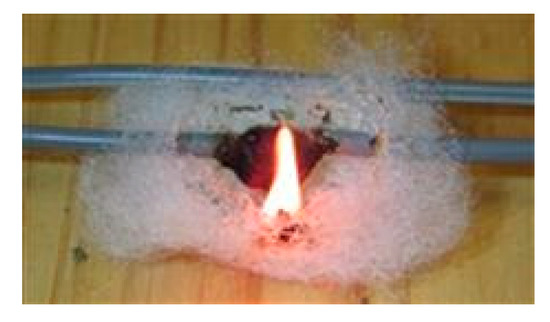
Figure 13.
Ignition of combustibles.
A possible ignition mechanism of combustibles caused by arc at the time of breakage of an intact element conductor can be described as follows:
- (1)
- An external mechanical force breaks most of the element conductors of a power supply cord.
- (2)
- Current runs through the intact element conductors and its temperature rises because of Joule heating.
- (3)
- The intact element conductors melt and arc generates.
- (4)
- The temperature of a minute portion of the combustibles occasionally reaches the flash point through contact with arc or a piece of the melted element conductor, which results in the probabilistic ignition of combustibles.
In a real world, this type of damage might be observed when a power supply cord is deteriorated seriously, for example, under thermally and/or chemically severe environment. It is well known that oxidation of insulating materials will result in reduction of their mechanical and electrical properties and that high temperature will generally accelerate degradation of insulating materials.
4. Possible Arc Detection Feature
A possible feature will be discussed here, which can potentially be used to detect an arc in the two samples described above. In our previous paper [21], a feature was proposed for detecting an arc at the time of breakage of an intact element conductor under a condition without combustibles. The distortion of a recorded voltage waveform from a sinusoidal voltage was focused on as the characteristic of the arc. Subsequently, the voltage waveform recorded just before arc generation was used as the “checking voltage” for comparison.
The checking voltage is the voltage in the absence of arc. It is obtained by the following procedures; (1) the arc is detected by the proposed criteria described below, (2) a half-cycle voltage waveform at arc generation is extracted, (3) a half-cycle voltage waveform of the same polarity with that obtained in (2) just before arc generation is called form recorded data, which is named checking voltage; (4) the two voltage waveforms are superimposed so that the zero cross points coincide with each other. The procedures are illustrated in Figure 14. In the practical case, the checking voltage can be obtained by continuous recording of voltage at an outlet or at a distribution panel.
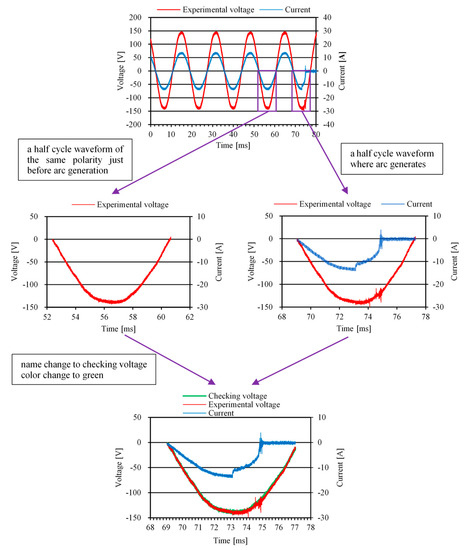
Figure 14.
Procedures to obtain checking voltage.
The “deviation time” was also introduced for judging the arc generation [21]. It was defined as the sum of the durations when the instantaneous experimental voltage exceeded ±6 V of the instantaneous checking voltage. Arc generation is diagnosed when the following two criteria are satisfied:
- (1)
- The deviation time is 70 μs or longer in a half cycle.
- (2)
- Current becomes zero within the next half cycle.
The first criterion is derived from the results of a series of experiments in the laboratory, whereas the second criterion is necessary to prevent incorrect judgment due to transient phenomena, which may cause the distortion of voltage waveforms, for example, when a household appliance is turned on or when its operation condition is changed. However, in these cases, current continues to flow for more than one cycle. Values of ±6 V and 70 μs, and a half cycle in the criteria are determined by trial and error and their optimization will be necessary through further experiments.
The criteria will be applied to detection of two kinds of arc described in Chapters II and III. To begin with, the case of arc at a short circuit caused by contact of broken element conductors is considered. Figure 15 shows waveforms recorded under a condition similar to that obtained Figure 8. The experimental voltage waveform showed a line voltage between line and neutral, which was distorted from the sinusoidal during arc. At arc extinction, the current ceased and voltage got restored to the sinusoidal. The waveform during the arc (surrounded by a green ellipsoid in Figure 15) is shown in a magnified view in Figure 16. Note that the amplitude of the current exceeded 100 A for one period and that the distortion of the voltage waveform is clearly confirmed. Figure 17 is a magnified view of the waveforms that were surrounded by a yellow ellipsoid in Figure 16, which is used to calculate deviation time. Here, the experimental voltage is drawn in red, while the checking voltage and the range of checking voltage ±6 V are shown in green and light green, respectively. Moreover, the arrows in Figure 17 indicate the durations when the experimental voltage has exceeded the checking voltage ±6 V. The deviation time defined by the sum of the durations is 4300 μs, which is longer than 70 μs. This case satisfied both of the criteria above, which implies that detection of the arc is possible.
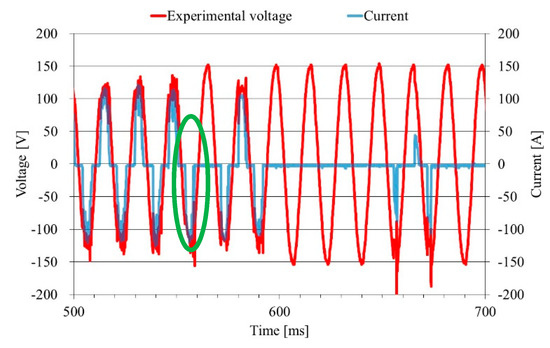
Figure 15.
Sample voltage and current waveforms at a short circuit.
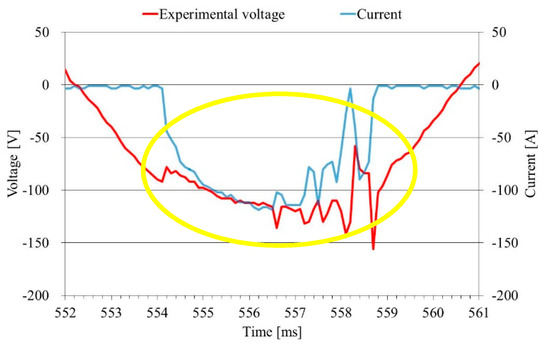
Figure 16.
Magnified view of the part surrounded by a green ellipsoid in Figure 15.
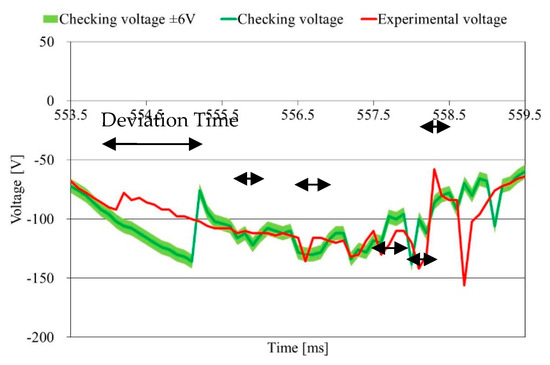
Figure 17.
Magnified view of the part surrounded by a yellow ellipsoid in Figure 16.
The next discussion will underscore the case of arc at the breakage of the intact element conductor. Figure 18 shows the waveforms recorded under a condition similar to that in Figure 13. Based on the figure, the arc would result in a distortion in both waveforms with a smaller degree than in the first case, because only one element conductor is broken in the present case. The current ceased and the voltage waveform got restored to the sinusoidal at arc extinction, within a cycle after the onset of voltage distortion. Figure 19 shows a magnified view of the waveforms during arc (surrounded by a green ellipsoid in Figure 18), in which a distortion of the voltage waveform is clearly confirmed. The deviation time could be obtained from Figure 20, which is a magnified view of the waveforms surrounded by a yellow ellipsoid in Figure 19. The experimental voltage is drawn in red, while the checking voltage and the range of checking voltage ±6 V are in green and light green, respectively. The arrows in Figure 20 indicate the durations when the experimental voltage exceeded the checking voltage ±6 V. The deviation time is 276 μs, which is longer than 70 μs. This case satisfies both of the criteria above, which implies that detecting the arc is possible.
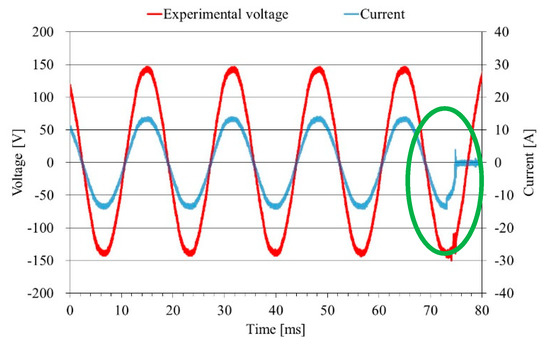
Figure 18.
Sample voltage and current waveforms at disconnection of the intact element conductor.
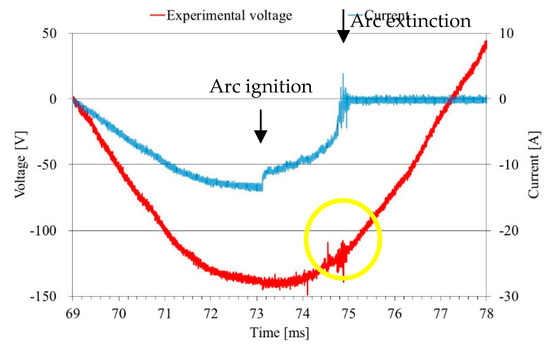
Figure 19.
Magnified view of the part surrounded by a green ellipsoid in Figure 18.
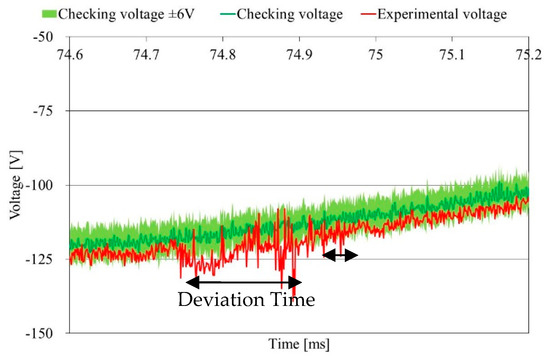
Figure 20.
Magnified view of the part surrounded by a yellow ellipsoid in Figure 19.
In the case of nonlinear loads, it is considered that the checking voltage is obtained by the same procedures as the case of a resistive load shown in Figure 14. It was confirmed that the checking voltage was obtained for a vacuum cleaner. Further examination will be necessary using other nonlinear loads. Acquisition of the checking voltage when an arc generates within a half cycle after the commencement of current supply is also a subject to be investigated.
5. Conclusions
Ignition of combustibles related to an arc was studied, which were placed on two kinds of damaged power supply cords. The first is caused by an arc at the time of a short circuit, which occurs when broken element conductors in one cable assume contact with conductors in the other cable at the damaged part of a power supply cord. Here, shrinkage stress acting on PVC during the cooling process may be a possible cause. The second is caused by an arc observed at the time of breakage of a remaining intact element conductor by Joule heating. In both cases, combustibles probabilistically ignite when the temperature of a minute portion of them may exceeds the flash point by contact with arc and/or a hot piece of melted element conductor.
A possible feature, deviation time, which is obtained by comparing distorted voltage waveform at arc with the checking voltage waveform, can potentially be used to detect arc in the two scenarios. On this note, further investigations are required to verify the proposed ignition mechanisms of combustibles and to evaluate validity of the feature in other situations.
Author Contributions
Conceptualization, K.T., Y.I., Y.M., and W.L.; methodology, K.T., Y.I., and W.L.; validation, K.T.; formal analysis, K.T.; investigation, K.T. and Y.I; resources, K.T. and Y.I.; data curation, K.T. and Y.I.; writing—original draft preparation, K.T.; writing—review and editing, Y.I., Y.M., and W.L.; visualization, K.T.; supervision, Y.M.; project administration, Y.M.; funding acquisition, Y.M. All authors have read and agreed to the published version of the manuscript.
Funding
This research was funded by JSPS KAKENHI Grant Number JP17K06299.
Acknowledgments
The authors would like to thank Japan Electric Cable Technology Center for the preparation of the samples by performing the bending test of the power supply cords.
Conflicts of Interest
The authors declare no conflict of interest.
References
- Tokyo Fire Department. Survey of Fires Accidents in 2019. Available online: http://www.tfd.metro.tokyo.jp/hp-cyousaka/kasaijittai/h31/ (accessed on 18 December 2019).
- Committee for Investigating Electric Fire Prevention Methods at a Big Earthquake. Report of Investigation and Promotion of Electric Fire Prevention Methods at a Big Earthquake. 2015, pp. 11–13. Available online: http://www.bousai.go.jp/jishin/syuto/denkikasaitaisaku/pdf/guideline_houkoku.pdf (accessed on 18 December 2019).
- Gregory, G.D.; Wong, K.; Dvorak, R.F. More About Arc-Fault Circuit Interrupters. Ieee Trans. Ind. Appl. 2004, 40, 1006–1011. [Google Scholar] [CrossRef]
- Abe, T.; Fukagawa, K.; Mizuno, Y.; Yoshida, A. Arc Discharge Detection Caused by Short-Circuit in Ac Power Supply Cord. In Proceedings of the IEEE Conference on Electrical Insulation and Dielectric Phenomena, Toronto, Canada, 16–19 October 2016. Paper No. 4B-21. [Google Scholar]
- UL 1699. Standard for Safety, Arc-Fault Circuit-Interrupters, 3rd ed.; UL: Bensenville, IL, USA, 2017. [Google Scholar]
- IEC 62606. General Requirements for Arc Fault Detection Devices, 1st ed.; International Electrotechnical Commission: Geneva, Switzerland, 2017. [Google Scholar]
- Shea, J.J. Comparing 240 Vrms to 120 Vrms Series Arcing Faults in Residential Wire. In Proceedings of the 54th IEEE Holm Conference on Electrical Contacts, Orlando, FL, USA, 27–29 October 2008; pp. 218–224. [Google Scholar]
- Shea, J.J. Identifying Causes for Certain Types of Electrically Initiated Fires in Residential Circuit. Fire Mater. 2011, 35, 19–42. [Google Scholar] [CrossRef]
- Kato, K.; Kataoka, M. Study of the Electric Fire Mechanism Caused by the Fault of Electric Cords for Domestic Use. Rep. Fire Technol. Saf. Lab. 2000, 37, 144–150. [Google Scholar]
- Awart, J.; Loud, J.; Slee, D. Arcing and Fire–Case Studies. In Proceedings of the IEEE Symposium on Product Compliance Engineering, Toronto, ON, Canada, 26–28 October 2009. [Google Scholar]
- Shea, J.J. Conditions for Series Arcing Phenomena in PVC Wiring. IEEE Trans. Compon. Packag. Technol. 2007, 30, 532–539. [Google Scholar] [CrossRef]
- Ishikawa, Y.; Takenaka, K.; Mizuno, Y.; Yoshida, A. Discharge-Induced Ignition of Combustibles on Ac Power-Supply Cords. In Proceedings of the IEEE Conference on Electrical Insulation and Dielectric Phenomena, Cancun, Mexico, 21–24 October 2018. Paper No. 6A-13. [Google Scholar]
- Restrepo, C.; Staley, P.S. Systems, Devices, and Methods for Arc Fault Detection. US Patent 0252603 A1, 1 November 2007. [Google Scholar]
- Ji, H.-K.; Wang, G.; Kim, W.-H.; Kil, G.-S. Optimal Design of a Band Pass Filter and an Algorithm for Series Arc Detection. Energies 2018, 11, 992. [Google Scholar] [CrossRef]
- Wu, C.J.; Liu, Y.W. Smart detection technology of serial arc fault on low-voltage indoor power lines. Int. J. Electr. Power Energy Syst. 2015, 69, 391–398. [Google Scholar] [CrossRef]
- Yang, K.; Zhang, R.; Yang, J.; Liu, C.; Chen, S.; Zhang, F. A Novel Arc Fault Detector for Early Detection of Electrical Fires. Sensors 2016, 16, 500. [Google Scholar] [CrossRef] [PubMed]
- Parise, G.; Parise, L. Unprotected Faults of Electrical and Extension Cords in AC and DC Systems. IEEE Trans. Ind. Appl. 2014, 50, 4–9. [Google Scholar] [CrossRef]
- Moon, W.-S.; Kim, J.-C.; Jo, A.; Bang, S.-B. Ignition Characteristics of Residential Series Arc Faults in 220-V HIV Wires. IEEE Trans. Ind. Appl. 2015, 51, 2054–2059. [Google Scholar] [CrossRef]
- JIS C 3005. Test Methods for Rubber or Plastic Insulated Wires and Cables; Japanese Standards Association: Tokyo, Japan, 2014; Section 4.27. [Google Scholar]
- Polymer Properties Database. Available online: http://polymerdatabase.com/polymers/polyvinylchloride.html (accessed on 18 December 2019).
- Takenaka, K.; Mizuno, Y.; Yoshida, A. Condition Monitoring of Damaged AC Power Supply Cord Using Voltage Waveform. In Proceedings of the International Conference on Condition Monitoring and Diagnosis (CMD2018), Perth, Australia, 23–26 September 2018. Paper No. P.47. [Google Scholar]


© 2020 by the authors. Licensee MDPI, Basel, Switzerland. This article is an open access article distributed under the terms and conditions of the Creative Commons Attribution (CC BY) license (http://creativecommons.org/licenses/by/4.0/).