Experimental Measurement of Bulk Thermal Conductivity of Activated Carbon with Adsorbed Natural Gas for ANG Energy Storage Tank Design Application


Abstract

1. Introduction
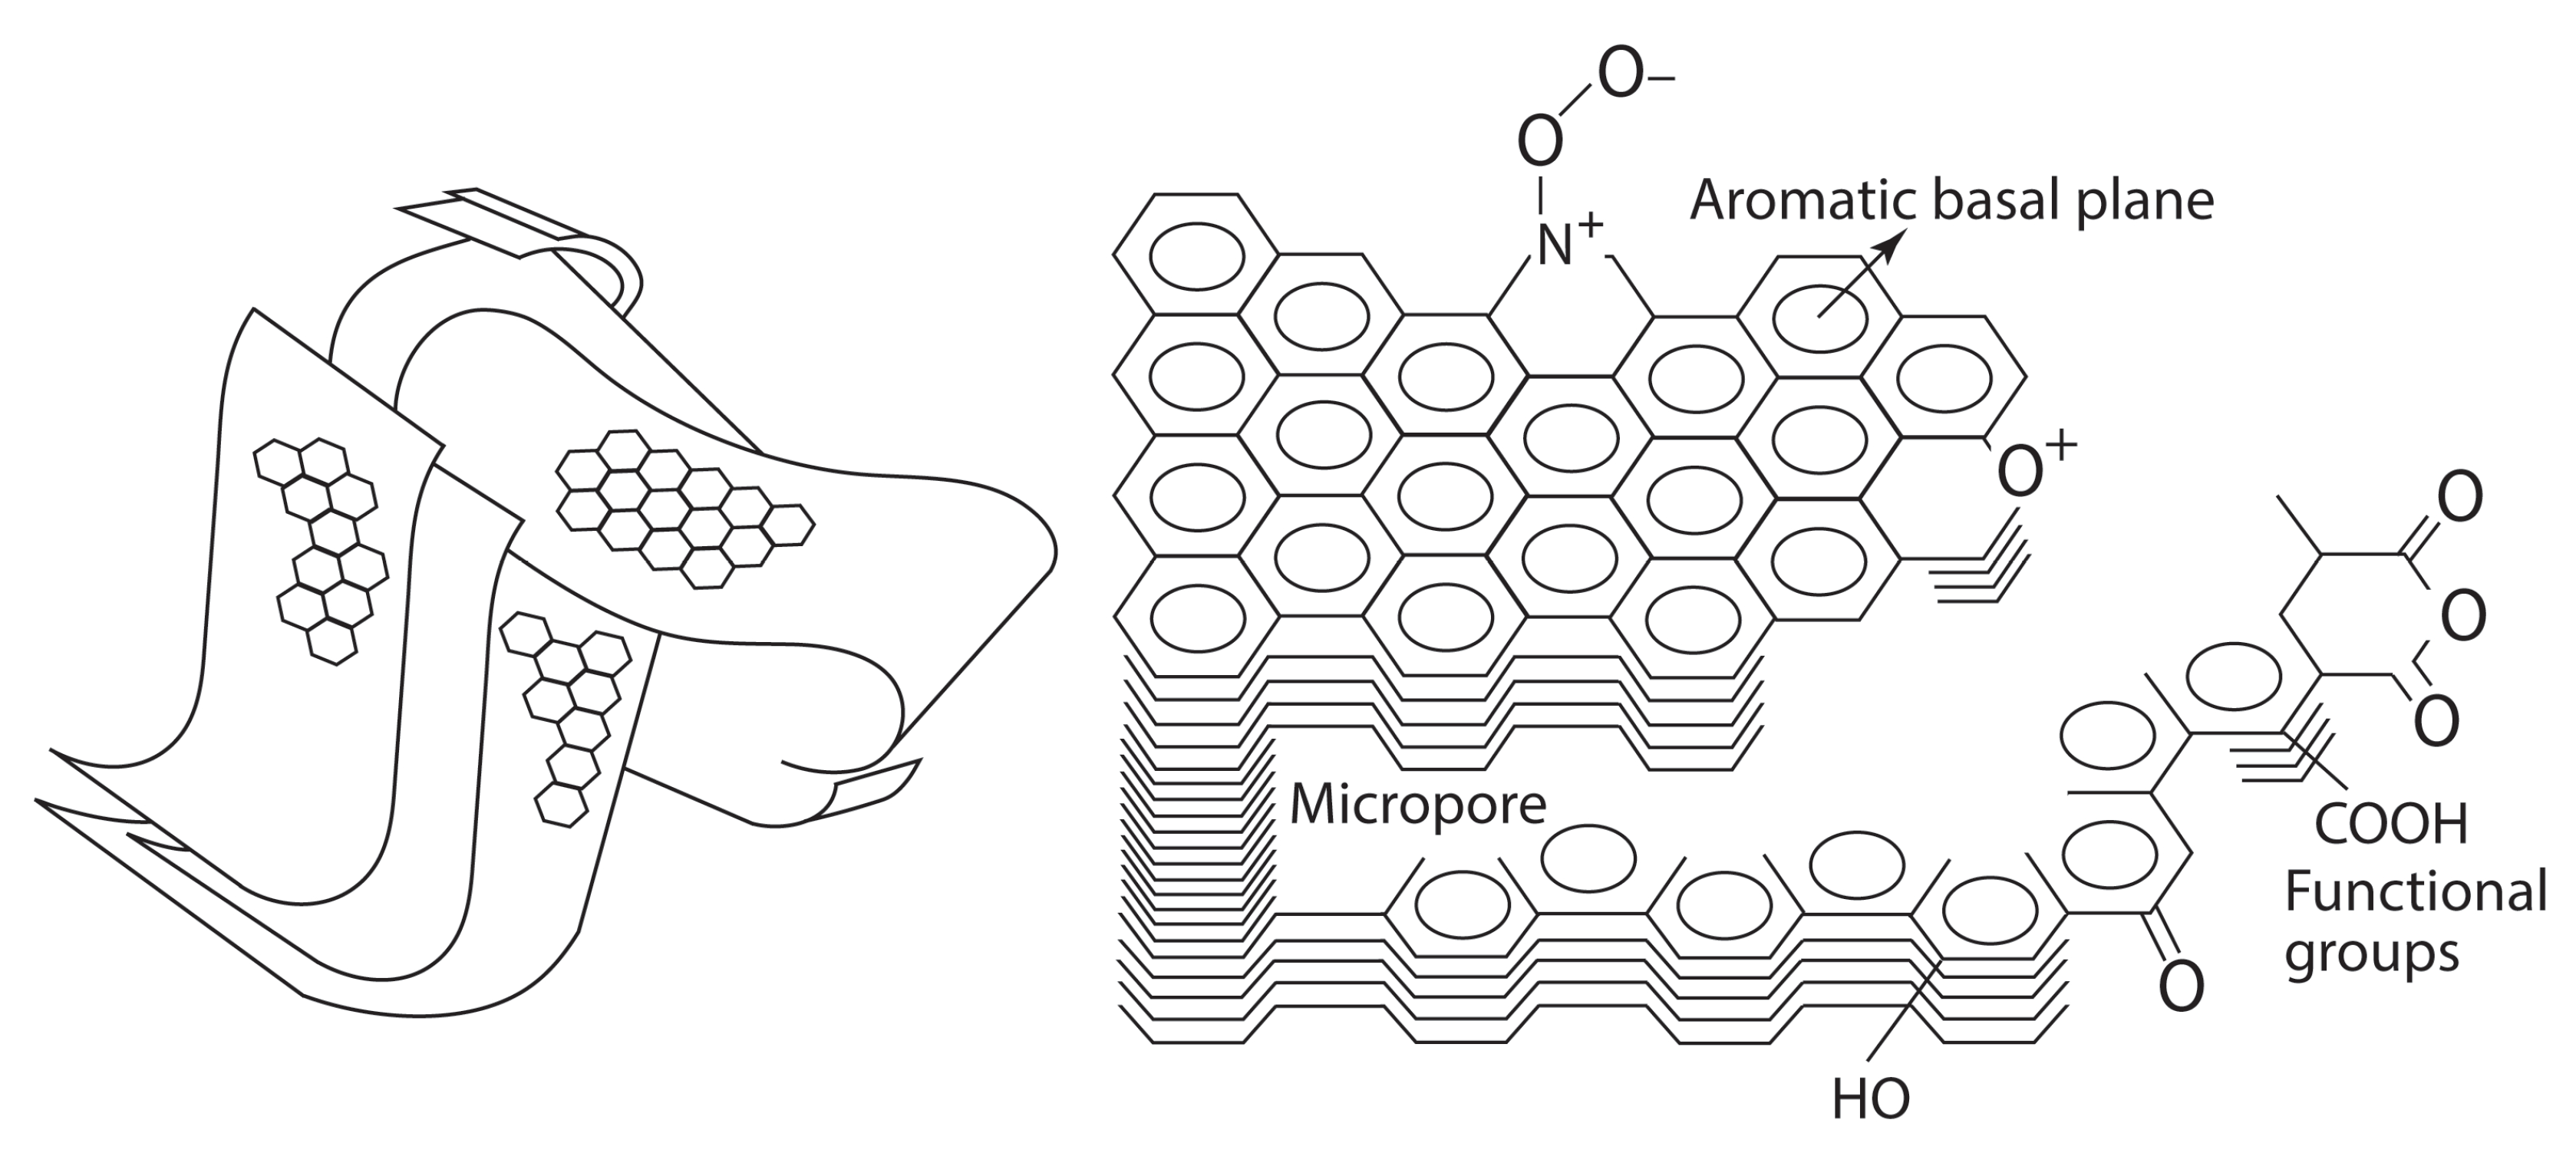
2. Activated Carbon
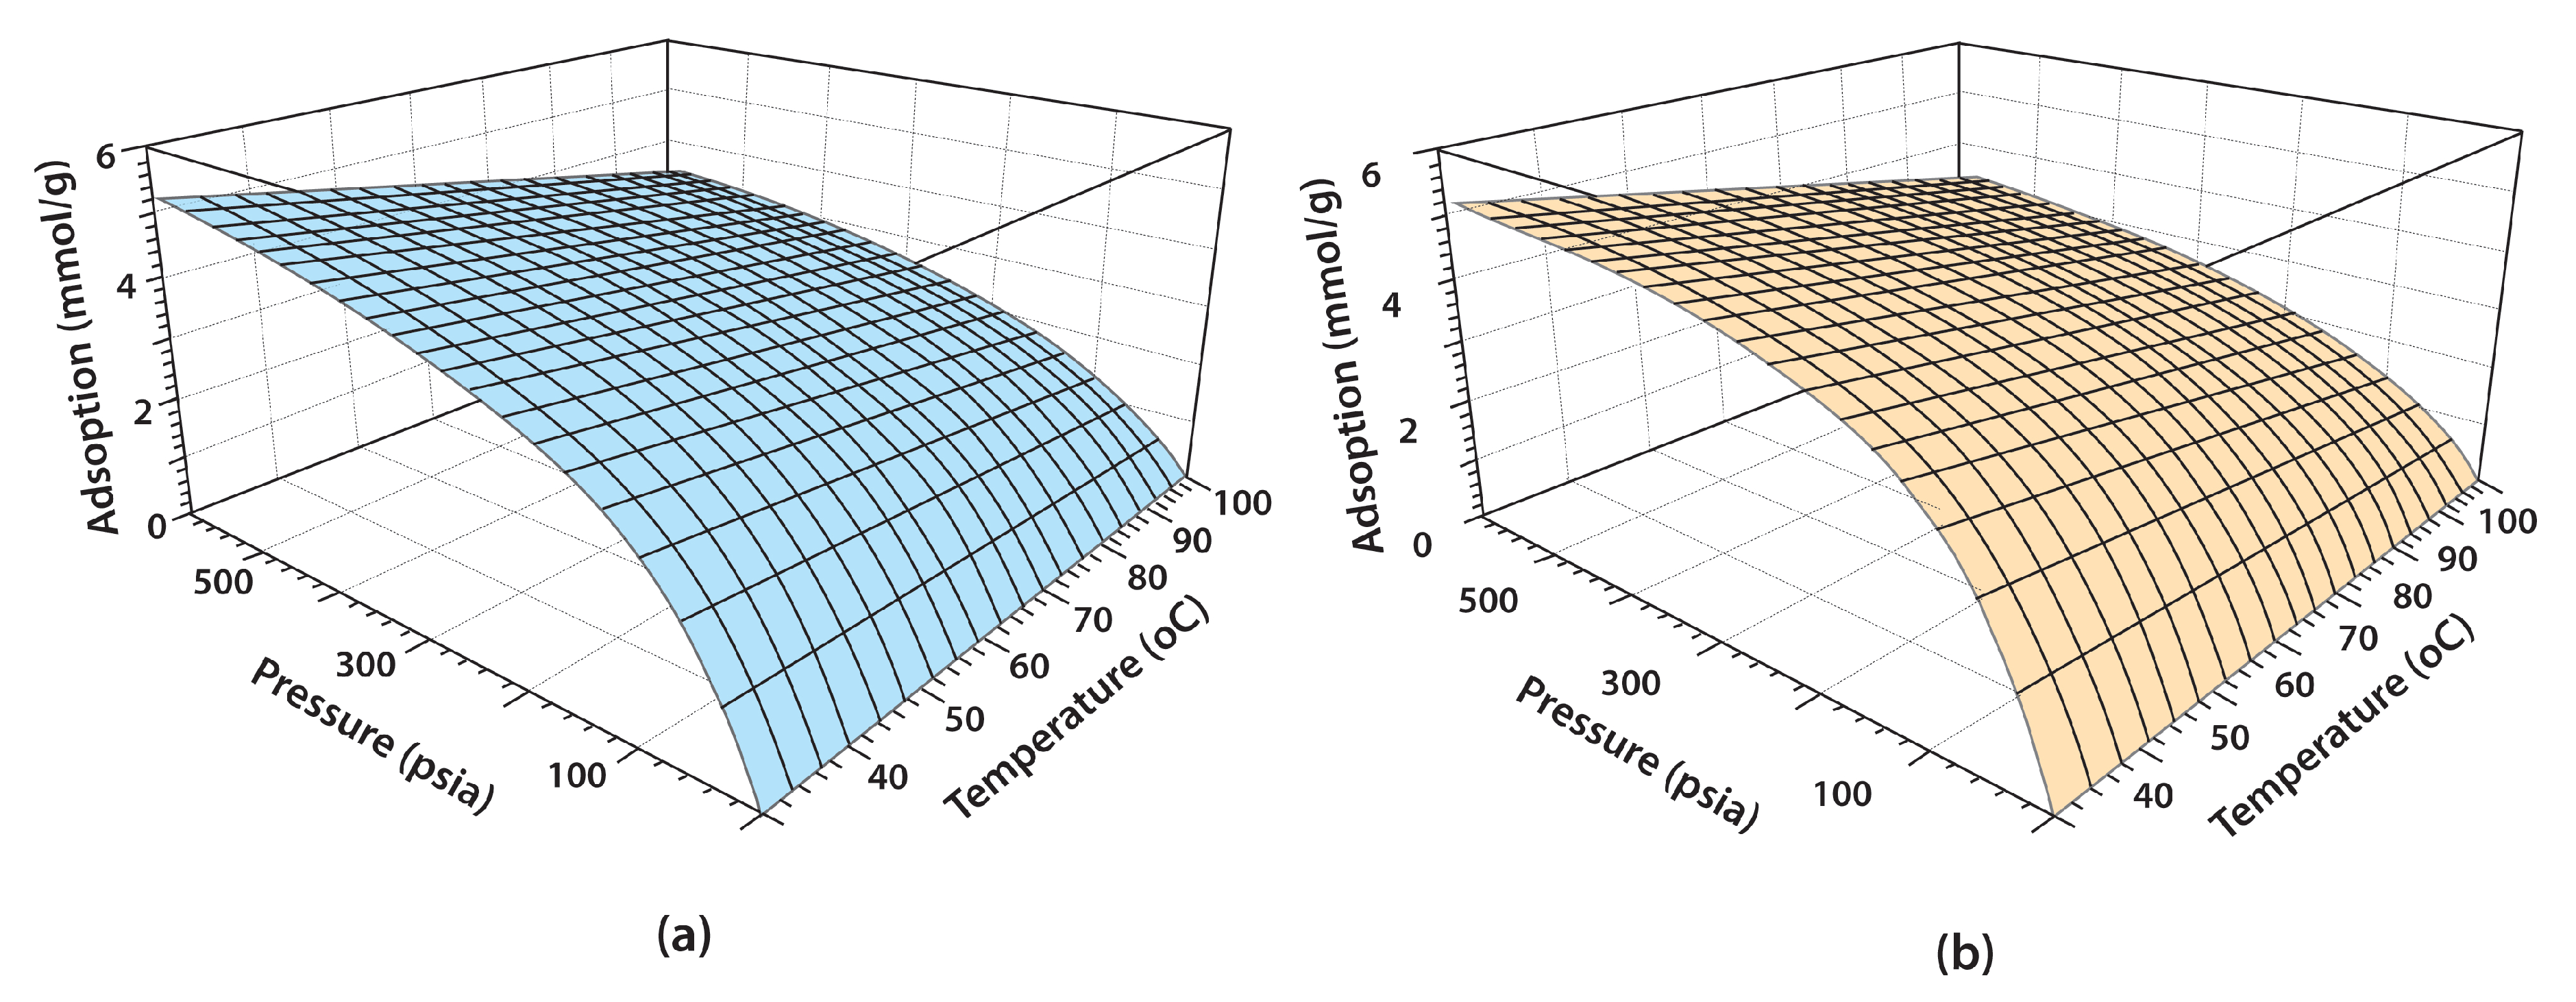
3. Adsorption Theory
- is the total volume of micropores (mg g),
- is the affinity coefficient and for () is equal to 0.5 (mol kj) [20],
- is the characteristic adsorption energy (kj/mol),
- is a homogeneity exponent which varies from 1.5 to 3.
- is the adsorbate gas constant (8.314 j mol K),
- is the temperature (K),
- is the gas critical pressure (atm).
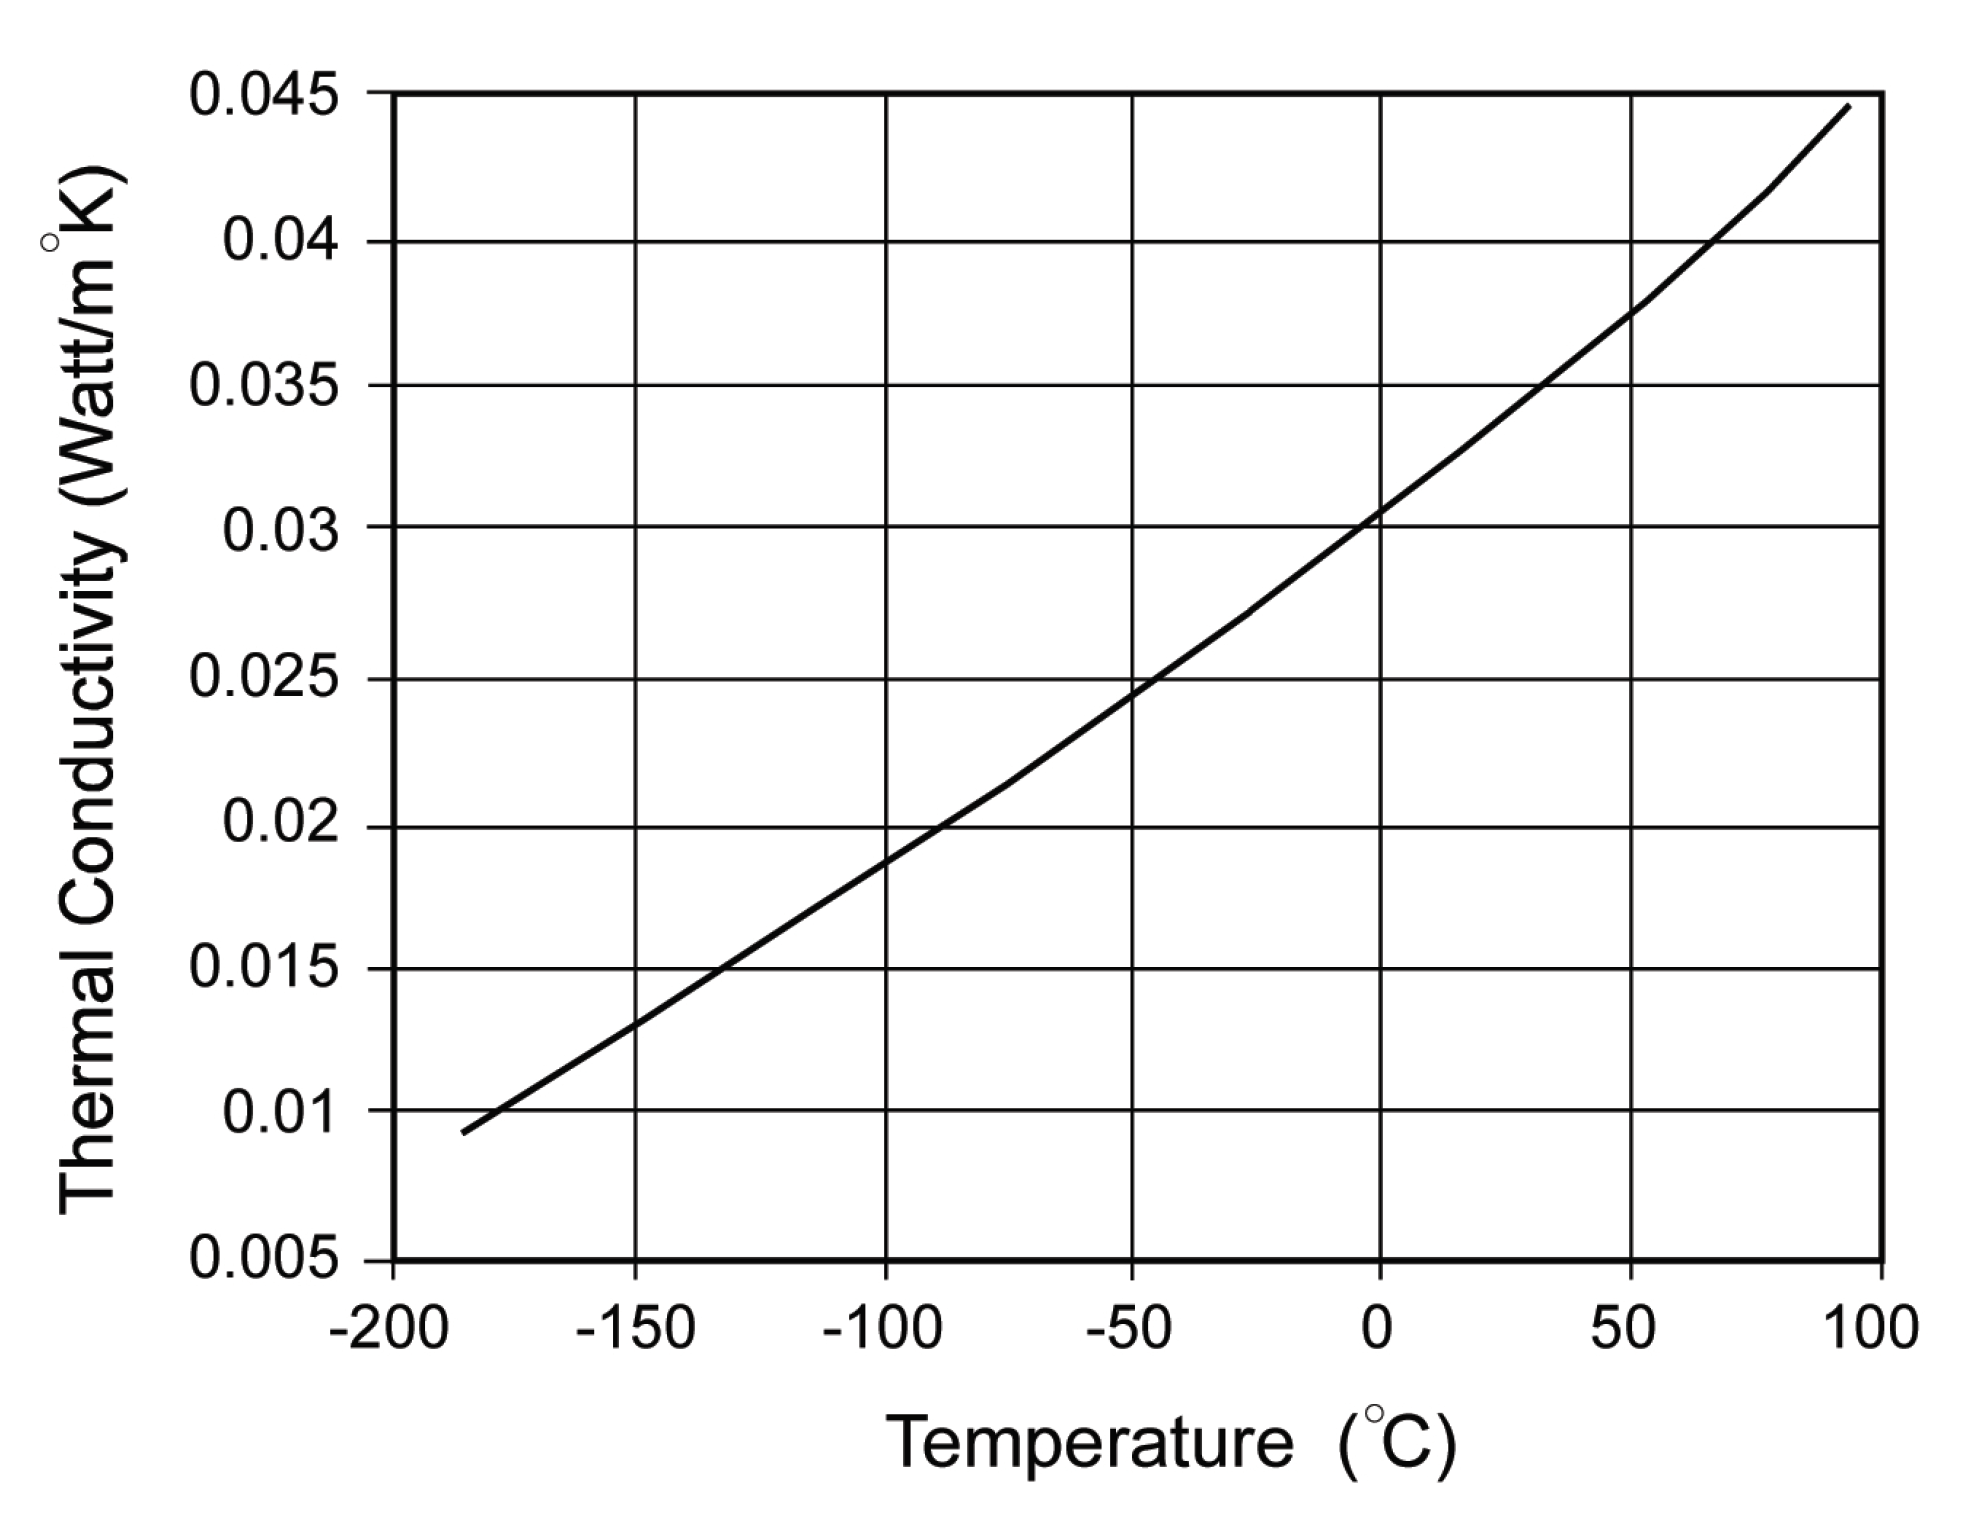
4. Thermal Conductivity
5. Thermal Conductivity Measurement Method
- is the heat flow rate (W/m),
- is the thermal conductivity (W/mK),
- is the area through which the heat flows (m),
- is the temperature gradient (K).
- is the height of the cylinder (m),
- is the radius of the cylinder (m).
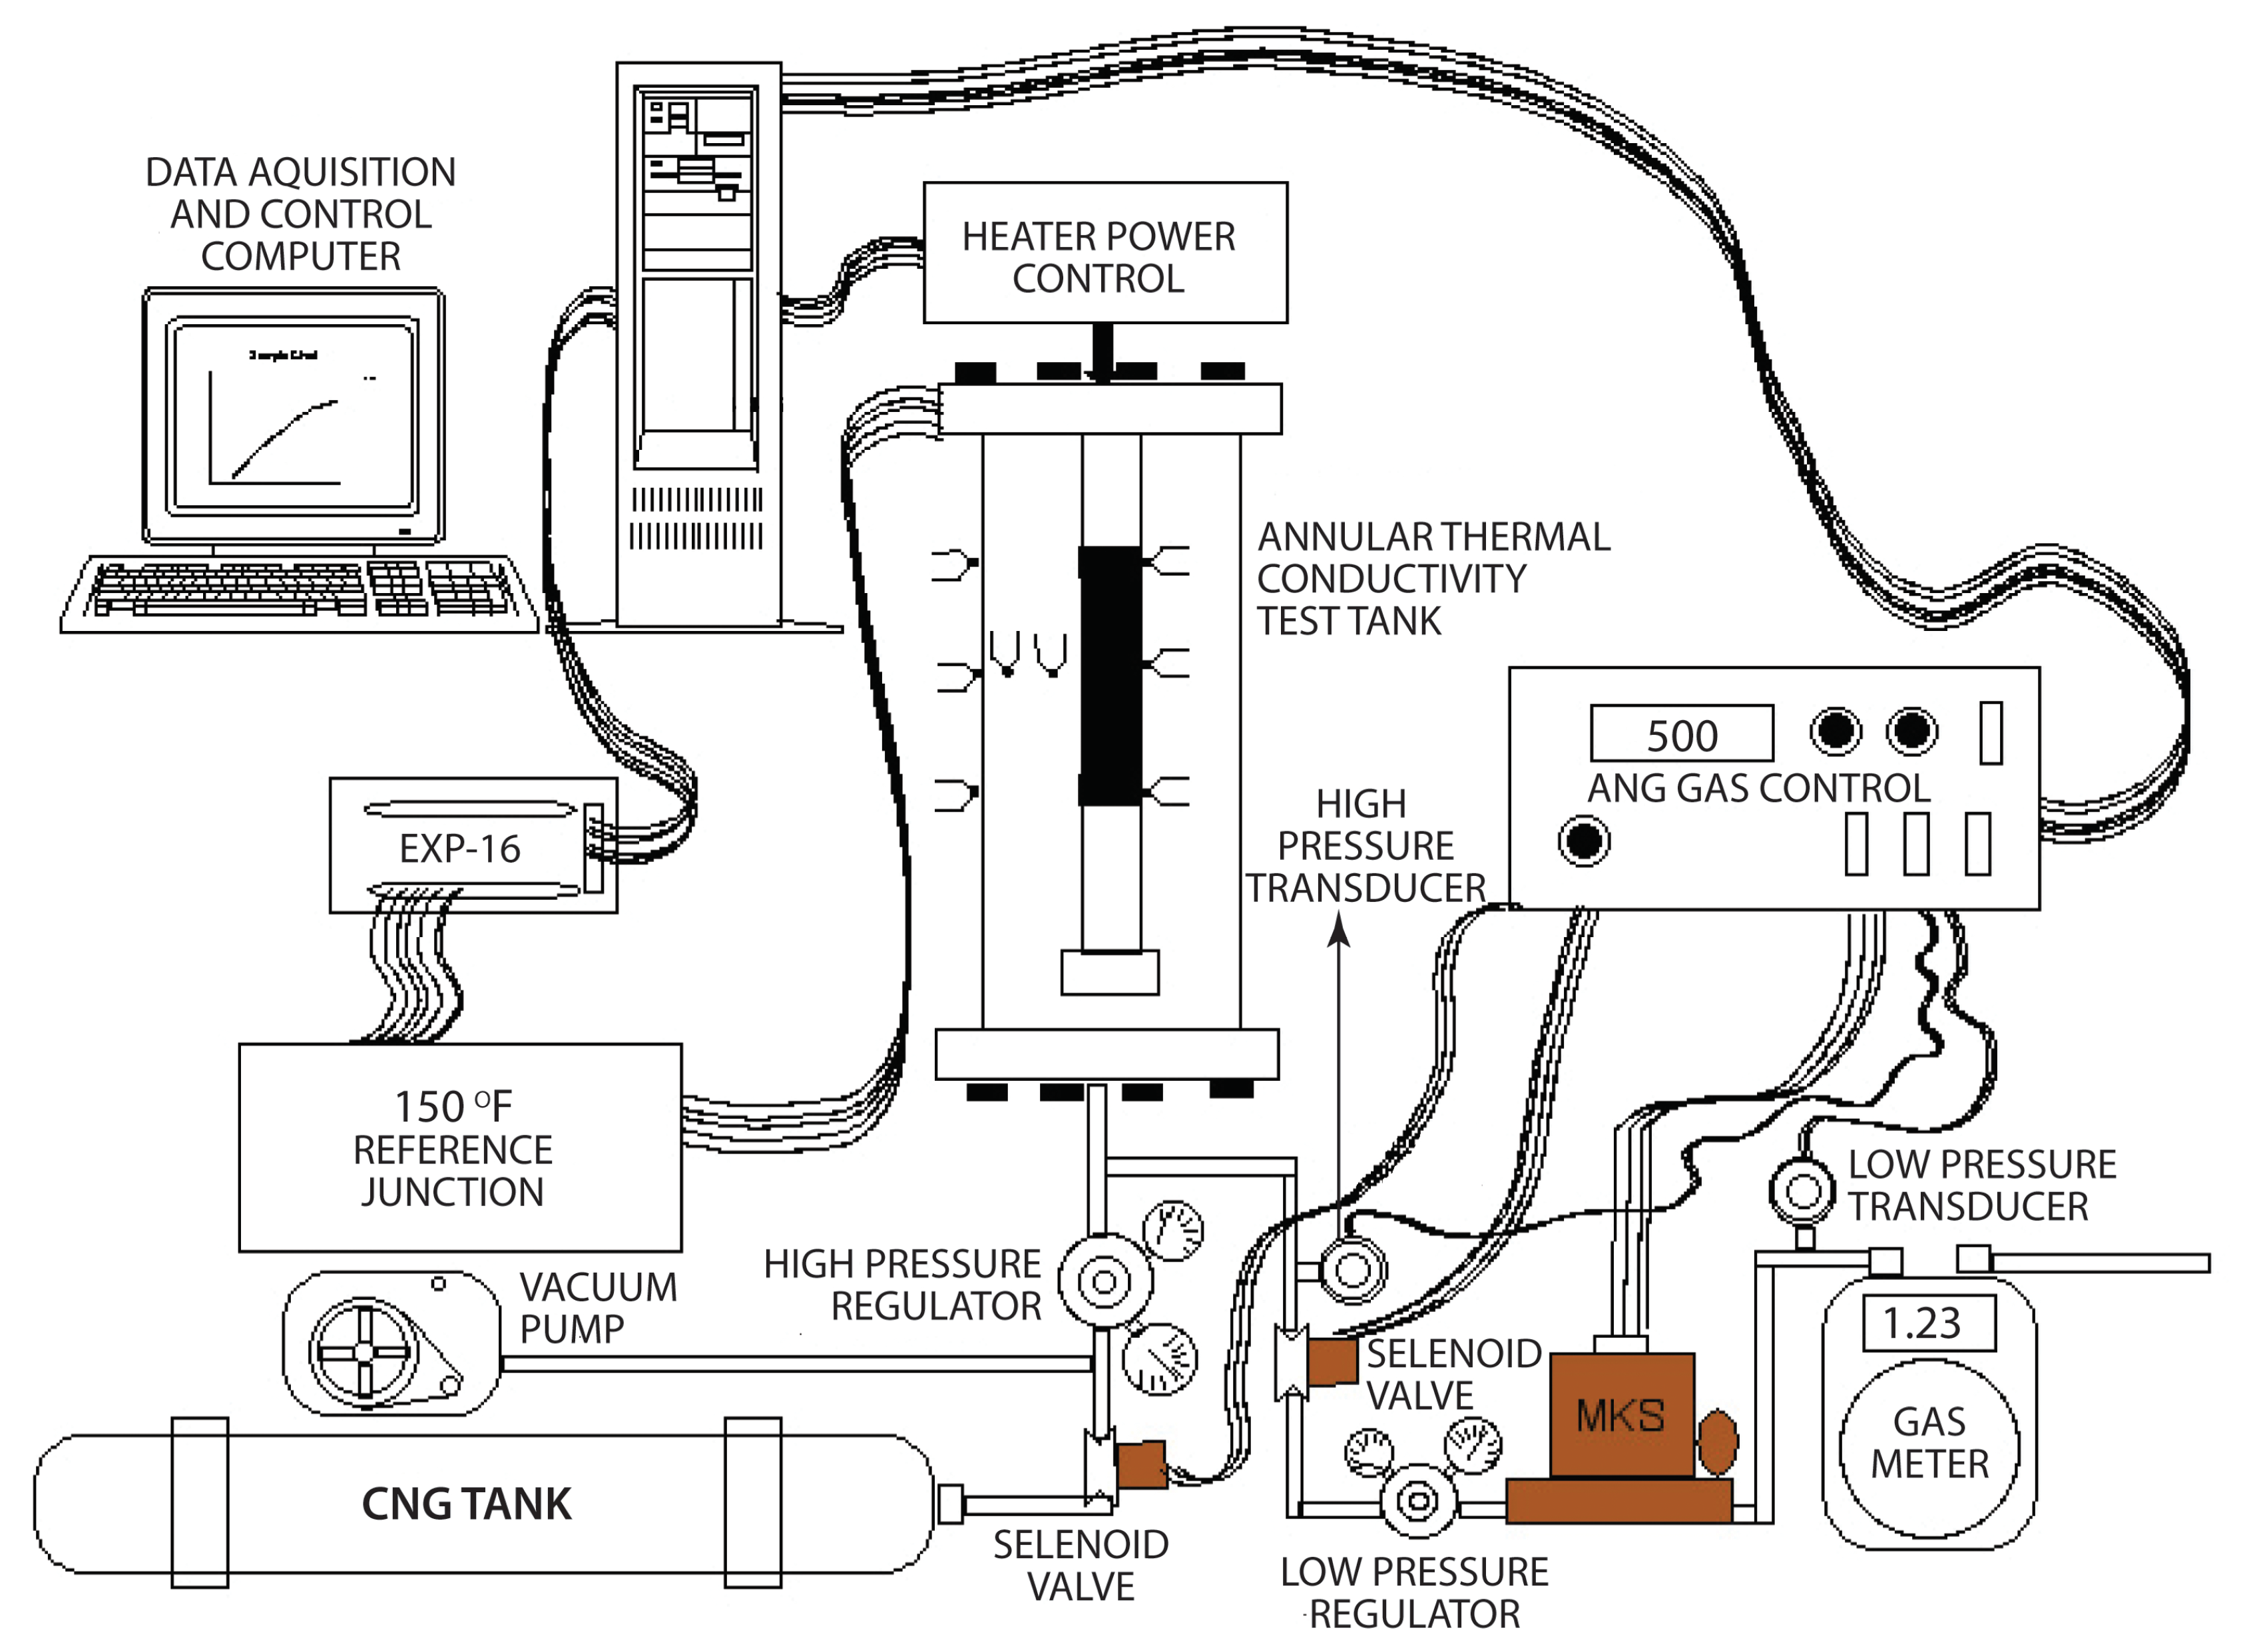
6. Experimental Test Setup
6.1. Heater Power Control
6.2. Gas Measurement and Control
6.3. Test Tank
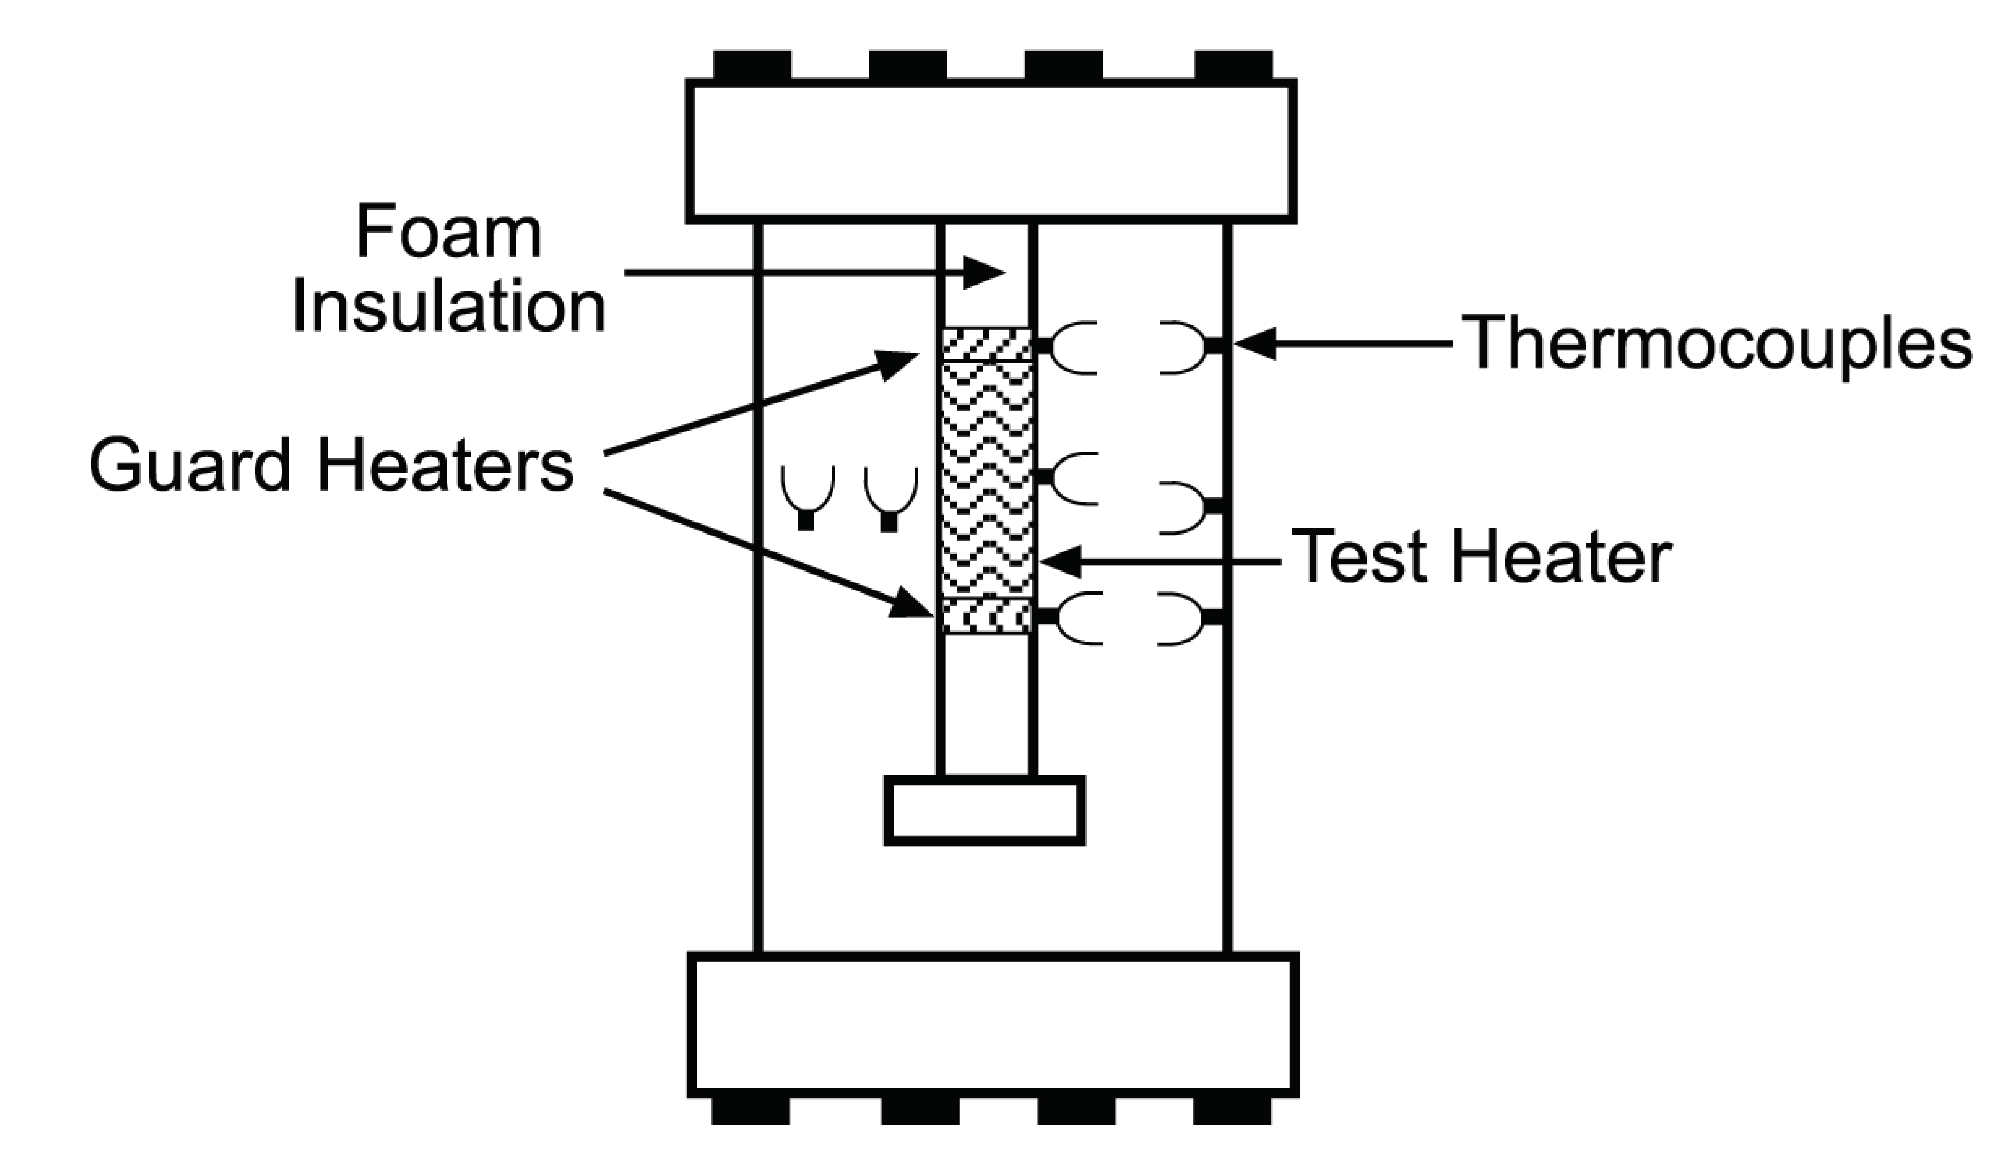
6.4. Heater Pipe Insert
7. Test Procedure
7.1. Carbons Tested
7.2. Steady State Tests
8. Results and Discussion
9. Conclusions
- The bulk thermal conductivity will be fairly constant for ANG vehicle applications.
- The heat transfer in the tank is not dominated by free convection in the activated carbon bed.
- The bulk thermal conductivity appears to be the result of methane adsorbed in the micro-pores of the carbon at near liquid densities.
- Transport phenomena caused by adsorption and desorption do not appear to be a mechanism for heat transfer in ANG tank applications.
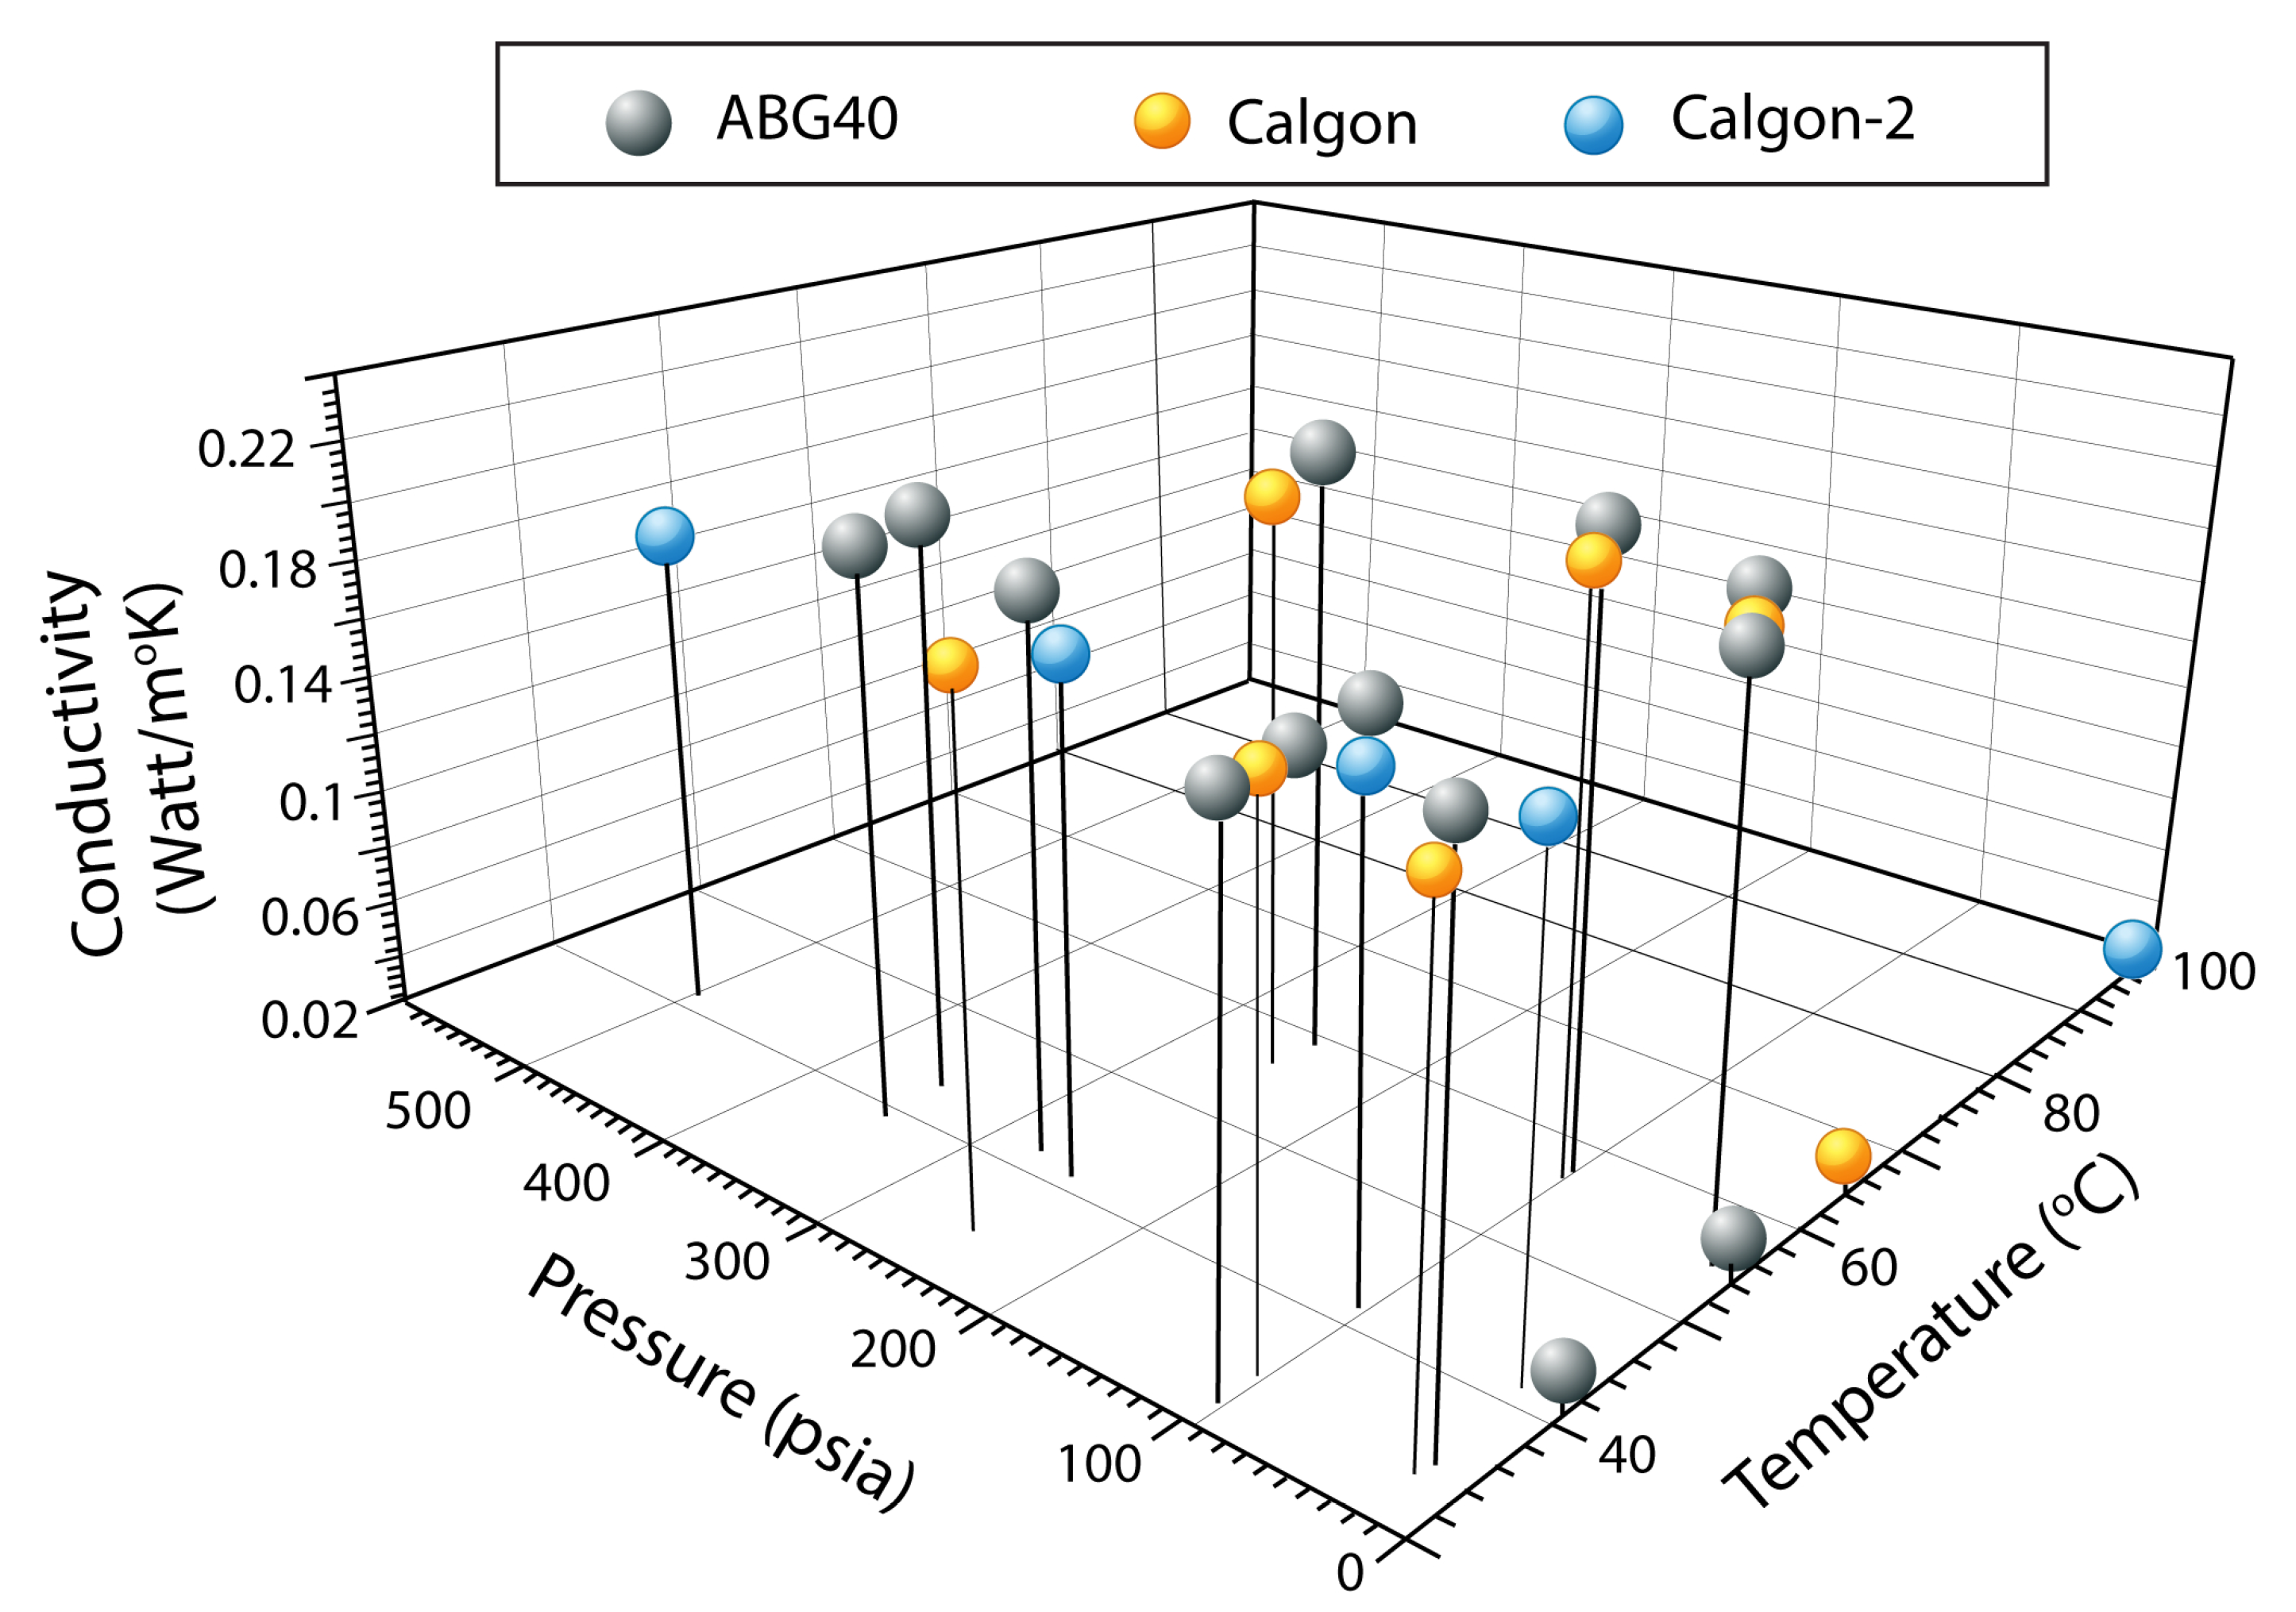
- The bulk thermal conductivity for CALGON PCB and ABG-40 was found to be approximately 0.200 Watt/mK for the pressure range of 20 to 500 psia. Design of ANG storage systems may be improved using the information found by this research.
Author Contributions
Funding
Conflicts of Interest
Abbreviations
| A | Area of heat flow (m) |
| Affinity coefficient and for () is equal to 0.5 (mol kj) | |
| Characteristic adsorption energy (kj/mol) | |
| k | Thermal conductivity (W/mK) |
| Mean thermal conductivity and mean temperature | |
| L | Height of the cylinder (m) |
| n | Homogeneity exponent which varies from 1.5 to 3 |
| Gas critical pressure (atm) | |
| Q | Heat flow rate (W/m) |
| r | Radius of the cylinder (m) |
| R | Adsorbate gas constant (8.314 j mol K) |
| T | Temperature (K) |
| Mean temperature | |
| Temperature gradient (K) | |
| Total volume of micro-pores (mg g) |
References
- Pressure Vessels for Alternative Fuels, 2014–2023. CW Composite World. Available online: https://www.compositesworld.com/articles/pressure-vessels-for-alternative-fuels-2014-2023 (accessed on 13 November 2019).
- Dubois, L.H. Adsorbed Natural Gas On-Board Storage for Light-Duty Vehicles. California Energy Commission, Energy Research and Development Division, Final Project Report; 2017. Available online: https://ww2.energy.ca.gov/2017publications/CEC-500-2017-038/CEC-500-2017-038.pdf (accessed on 21 November 2019).
- Cumalioglu, I.; Ertas, A.; Ma, Y.; Maxwell, T.T. High pressure hydrogen storage tank: A parametric design study. Trans. ASME J. Press. Vessel Technol. 2007, 129, 216–222. [Google Scholar] [CrossRef]
- Cumalioglu, I.; Ertas, A.; Ma, Y.; Maxwell, T.T. State of the art: Hydrogen storage. Trans. ASME J. Fuel Cell Sci. Technol. 2008, 5, 34002-1–34002-10. [Google Scholar] [CrossRef]
- Wegrzyn, J.; Wiesmann, H.; Lee, T. Low pressure storage of natural gas on activated carbon. In Proceedings of the SAE Post-Conference—Annual Automative Technology Development Contractors’ Coordinating Meeting (ATD/CCM), Dearborn, MI, USA, 2–5 November 1992. [Google Scholar]
- Vasiliev, L.L.; Larisa, K.; Mishkinis, D.; Rabetsky, M.I. Adsorbed natural gas storage and transportation vessels. Int. J. Therm. Sci. 2000, 39, 1047–1055. [Google Scholar] [CrossRef]
- Akbarnrejad, M.M. Adsorbed natural gas technology development for transportation fuel. In Proceedings of the 19th World Petroleum Congress, Madrid, Spain, 29 June–3 July 2008. Document ID: WPC-19-2827. [Google Scholar]
- BeVier, W.; Mullhaupt, J.; Notaro, F.; Lewis, I. Adsorbent-Enhanced Methane Storage for Alternate Fuel Powered Vehicles. SAE Technical Paper 891638. 1989. Available online: https://doi.org/10.4271/891638 (accessed on 2 December 2019).
- Jasionowski, W.J.; Kountz, K.J.; Blazek, C.F.; Tiller, A.J.; Gauthier, S.W.; Takagishi, S.K. A Thermal Energy Storage System for Adsorbent Low-Pressure Natural Gas Storage. In Proceedings of the International Conference and Exhibition on Natural Gas Vehicles-NGV-92, Gothenburg, Sweden, 23–25 September 1992. [Google Scholar]
- Bansal, R.C.; Donnet, J.B.; Stoeckli, F. A Review of Active Carbon; Marcel Dekker: New York, NY, USA, 1988; p. 482. [Google Scholar]
- Kurzweil, P. Electrochemical double-layer capacitors: Carbon materials. In Encyclopedia of Electrochemical Power Sources; Garche, J., Dyer, C., Moseley, P.T., Ogumi, Z., Rand, D.A.J., Scrosati, B., Eds.; Elsevier: Amsterdam, The Netherlands, 2009; Volume 1, pp. 634–648. ISBN 978-0-444-52093-7. [Google Scholar]
- Park, J.E.; Lee, G.B.; Hwang, S.Y.; Kim, J.H.; Hong, B.U.; Kim, H.; Kim, S. The effects of methane storage capacity using upgraded activated carbon. Appl. Sci. 2018, 8, 1596. [Google Scholar] [CrossRef]
- Chiang, Y.C.; Yeh, C.Y.; Weng, C.H. Carbon dioxide adsorption on porous and functionalized activated carbon fibers. Appl. Sci. 2019, 9, 1977. [Google Scholar] [CrossRef]
- Bernal, V.; Giraldo, L.; Moreno-Pirajjän, J.C. Physicochemical properties of activated carbon:their effect on the adsorption of pharmaceutical compounds and adsorbate–Adsorbent. Interact. J. Carbon Res. 2018, 4, 62. [Google Scholar] [CrossRef]
- Pam, A.A. Innovative activated carbon based on deep eutectic solvents (DES) and H3PO4. J. Carbon Res. 2019, 5, 43. [Google Scholar] [CrossRef]
- Karatza, D.; Prisciandaro, M.; Lancia, A.; Musmarra, D. Silver impregnated carbon for adsorption and desorption of elemental mercury vapors. J. Environ. Sci. 2011, 23, 1578–1584. [Google Scholar] [CrossRef]
- Vorokhta, M.; Morávková, J.; Řimnáčová, D.; Pilař, R.; Zhigunov, A.; Švábová, M.; Sazama, P. CO2 capture using three-dimensionally ordered micromesoporous carbon. J. CO2 Util. 2019, 31, 124–134. [Google Scholar] [CrossRef]
- Santonastaso, G.F.; Erto, A.; Bortone, I.; Chianese, S.; Di Nardo, A.; Musmarra, D. Experimental and simulation study of the restoration of a thallium (I)-contaminated aquifer by Permeable Adsorptive Barriers (PABs). Sci. Total Environ. 2018, 630, 62–71. [Google Scholar] [CrossRef]
- Hernández-Monje, D.; Giraldo, L.; Moreno-Piraján, J.C. Immersion enthalpy of benzene/cyclohexane and toluene/cyclohexane binary mixtures into modified activated carbons. J. Therm. Anal. Calorim. 2019, 138, 2565–2575. [Google Scholar] [CrossRef]
- Agarwal, R.K.; Schwarz, J.A. Analysis of high-pressure adsorption data activated carbon to obtain generalized characteristic and heats of adsorption curves. J. Colloid Interface Sci. 1988, 130, 137–145. [Google Scholar] [CrossRef]
- Gregg, S.L.; Sing, K.S.W. Adsorption Surface Area and Porosity, 2nd ed.; Academic Press Inc.: Cambridge, MA, USA, 1992. [Google Scholar]
- Valenzuela, D.P. Adsorption Equilibrium Data Handbook; Prentice-Hall Inc: Upper Saddle River, NJ, USA, 1989. [Google Scholar]
- Costa, E.; Calleja, G.; Marron, C.; Jimenez, A.; Pau, J. Equilibrium adsorption of methane, ethane, and propylene and their mixture on activated carbon. J. Chem. Eng. Data 1989, 34, 156–160. [Google Scholar] [CrossRef]
- Talu, O. An overview of adsorption storage of natural gas. In Proceedings of the 4th International Conference on Fundamentals of adsorption, Kyoto, Japan, 17–22 May 1992. [Google Scholar]
- Kunii, D.; Smith, J.M. Heat transfer characteristics of porous rocks. AIChE J. 1960, 6, 71–78. [Google Scholar] [CrossRef]
- Luikov, A.V.; Shashkov, A.G.; Vasiliev, L.L.; Yu, E.F. Thermal conductivity of porous systems. Int. J. Heat Mass Transf. 1968, 11, 117–140. [Google Scholar] [CrossRef]
- Cheng, G.J.; Yu, A.B.; Zulli, P. Evaluation of effective thermal conductivity from the structure of a packed bed. Chem. Eng. Sci. 1999, 54, 4199–4209. [Google Scholar] [CrossRef]
- Wanga, L.W.; Tamainot-Teltob, Z.; Thorpeb, R.; Critophb, R.E.; Metcalfb, S.J.; Wanga, R.Z. Study of thermal conductivity, permeability, and adsorption performance of consolidated composite activated carbon adsorbent for refrigeration. Renew. Energy 2011, 36, 2062–2066. [Google Scholar] [CrossRef]
- Verma, R.; Nagendra, H.N.; Kasthurirengan, S.; Shivaprakash, N.C.; Behera, U. Thermal conductivity studies on activated carbon based cryopanel. Mater. Sci. Eng. 2019, 502, 012197. [Google Scholar] [CrossRef]
- Soffel, R.W. Activated Carbon, ETC 3rd ed.; Union Carbide Corp.: Houston, TX, USA, 1991; Volume 4. [Google Scholar]
- ASHRAE HANDBOOK, Fundamentals SI Edition; American Society of Heating and Air-Conditioning Engineering Inc.: Atlanta, GA, USA, 1985.
- Sangani, N. Effects of Heat of Adsorption on Methane Adsorption on Activated Carbon. Master’s Thesis, Cleveland State University, Cleveland, OH, USA, 1991. [Google Scholar]
- Ho, C.Y.; Taylor, R.E. High temperature thermal conductivity of soils. Thermal Conductivity. In Proceedings of the Eighth Conference; Plenum Press: New York, NY, USA, 1968. [Google Scholar]
- Milton, J.S.; Arnold, J.C. Introduction to Probability and Statistics; McGraw Hills Inc.: New York, NY, USA, 1990. [Google Scholar]
- Wang, L.W.; Wu, J.Y.; Wang, R.Z.; Xu, Y.X.; Wang, S.G.; Li, X.R. Study of the performance of activated carbon-methanol adsorption systems concerning heat and mass transfer. Appl. Therm. Eng. 2003, 23, 1605–1617. [Google Scholar] [CrossRef]
- Kuwagaki, H.; Meguro, T.; Tatami, J.; Komeya, K.; Tamura, K. An improvement of thermal conduction of activated carbon by adding graphite. J. Mater. Sci. 2003, 38, 3279–3284. [Google Scholar] [CrossRef]
- Py, X.; Daguerre, E.; Menard, D. Composites of expanded natural graphite and in situ prepared activated carbons. bCarbon 2002, 40, 1255–1265. [Google Scholar] [CrossRef]
- Hlosta, J.; Zurovec, D.; Gelnar, D.; Zegzulka, J.; Necas, J. Thermal conductivity measurement of bulk solids. Chem. Eng. Technol. 2017, 40, 1876–1884. [Google Scholar] [CrossRef]


| Properties ↓ | ABG-40 | CALGON PCB |
|---|---|---|
| Precursor | bitimus coal | Coconut shell |
| U.S Sieve Size | 8 × 40 | 12 × 30 |
| N2 BET Surface Area | 1000 m/g | 1250 m/g |
| Bulk Density | 0.52 g/cc | 0.44 g/cc |
| Particle Density | 1.3 g/cc | 0.85 g/cc |
| Pore volume | 0.85 cc/g | 0.72 cc/g |
| Specific heat | 580 J/kg | 580 J/kg |
| Cost | $2.00 per kg | $4.98 per kg |
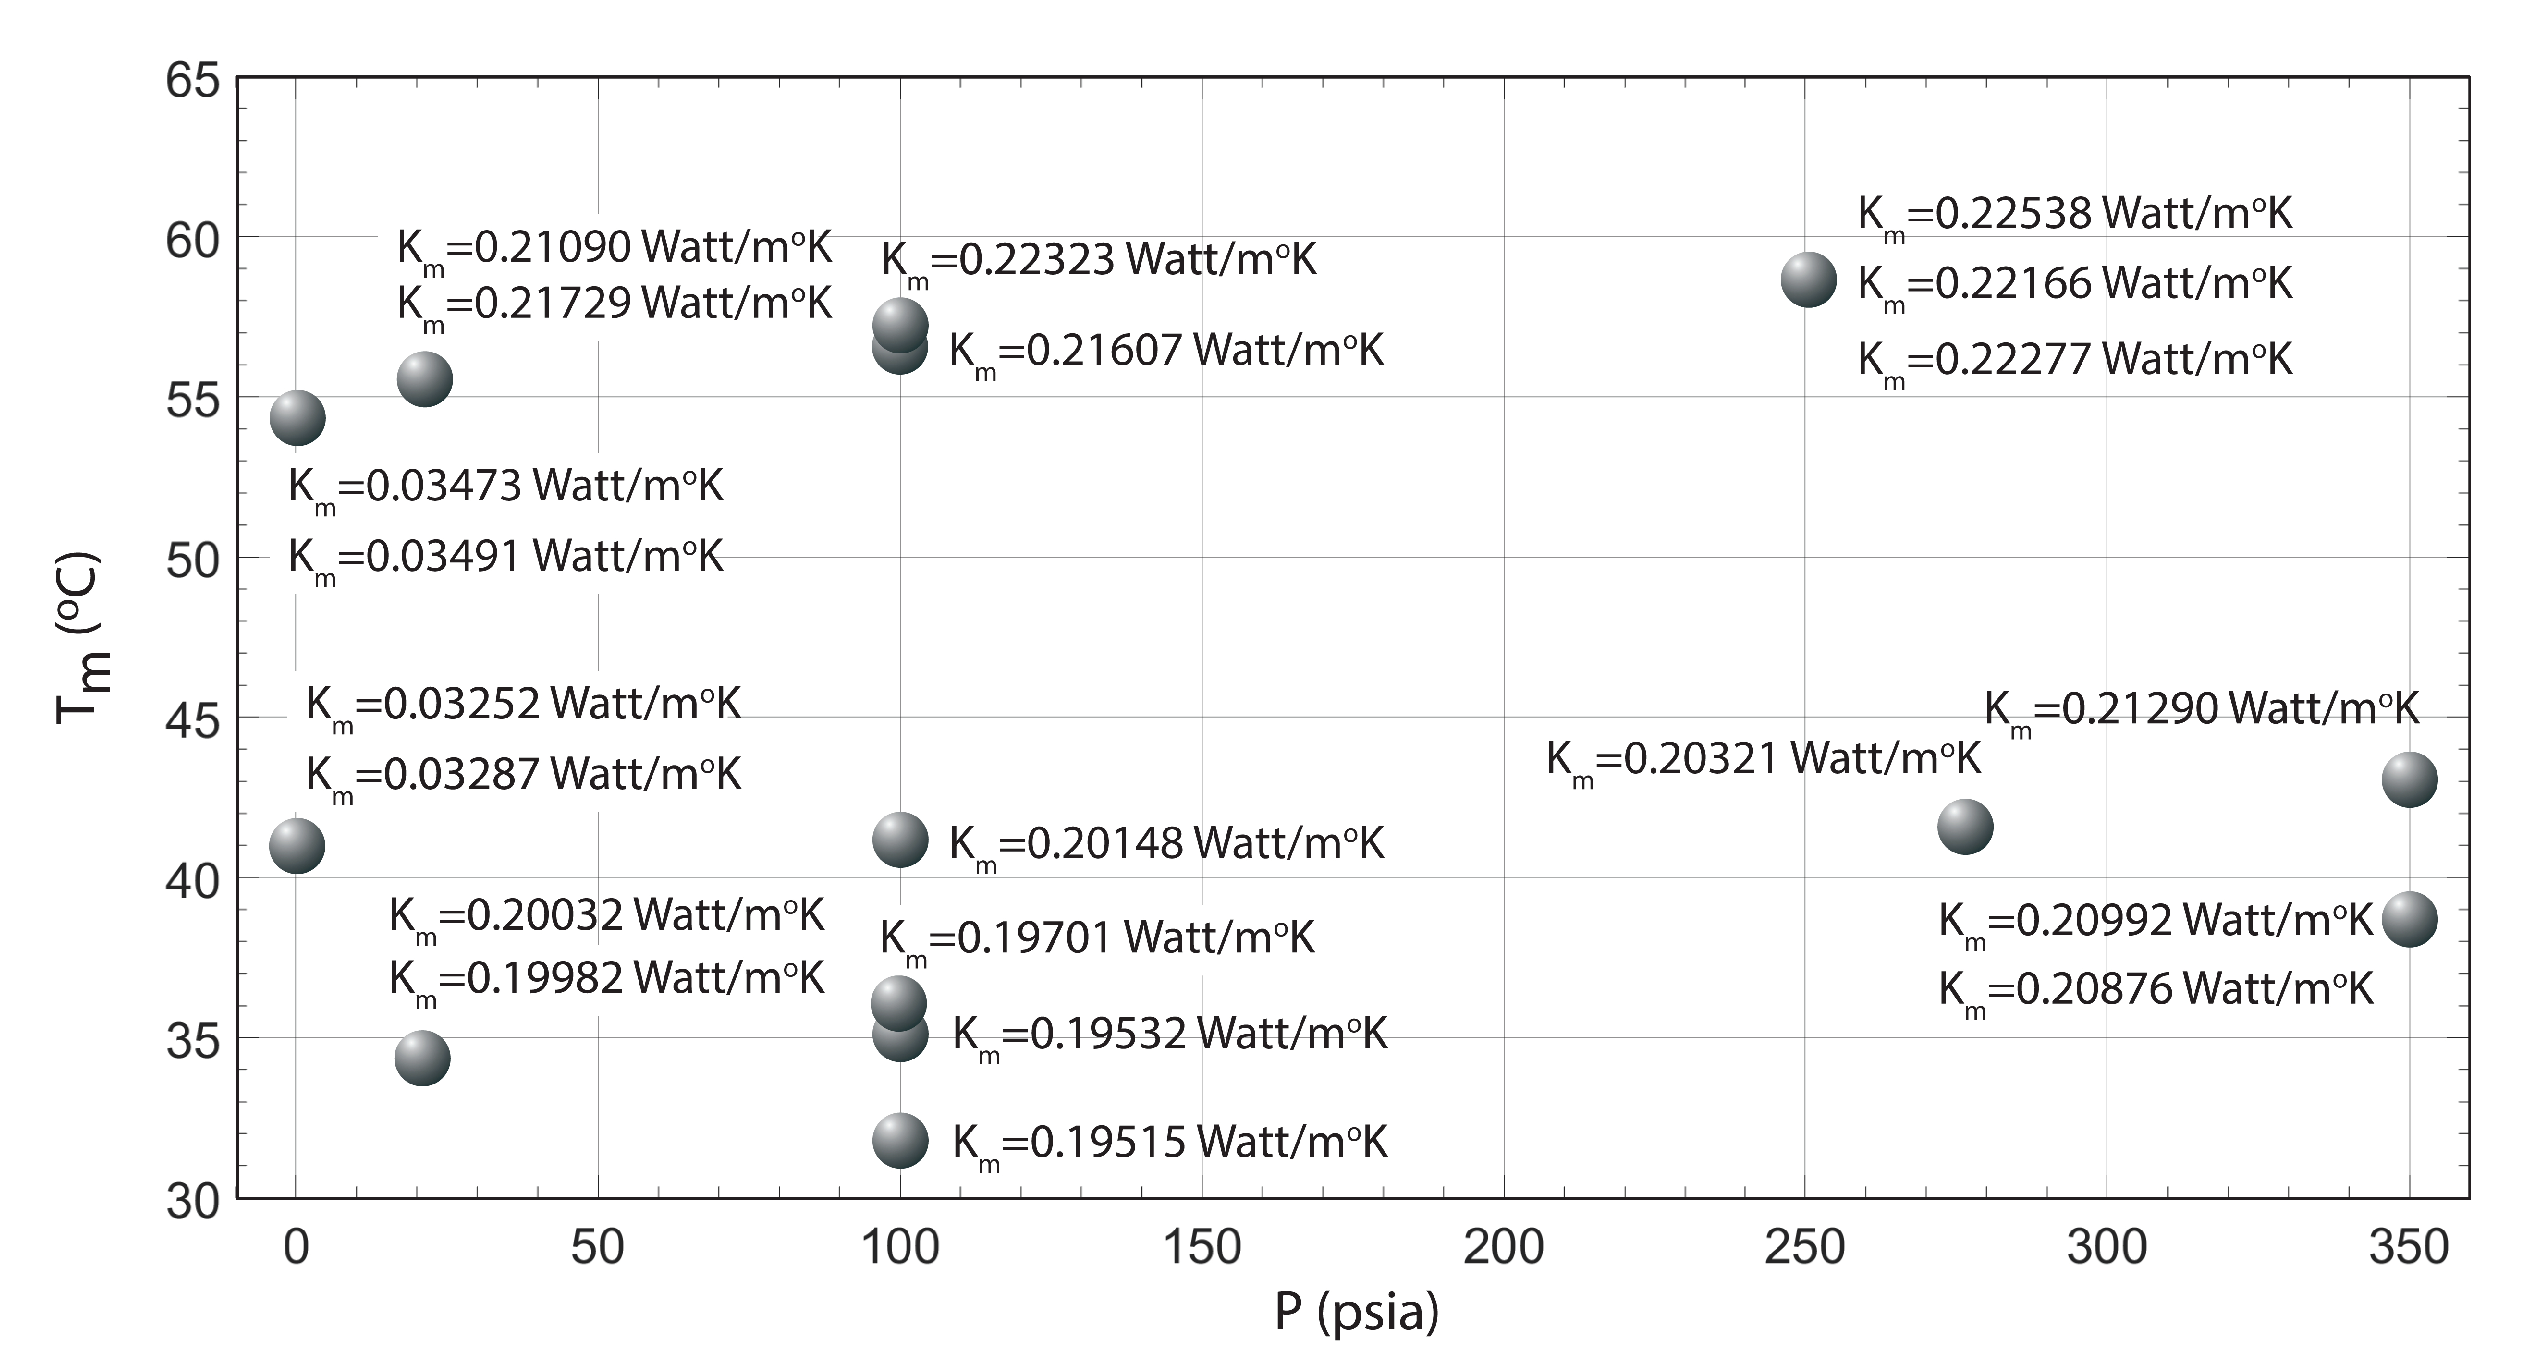
| T (C) | P (psia) | K (Watt/mK) |
|---|---|---|
| 40.82 | 0 | 0.03252 |
| 40.86 | 0 | 0.03287 |
| 54.45 | 0 | 0.03473 |
| 54.45 | 0 | 0.03491 |
| 34.35 | 20 | 0.19982 |
| 34.46 | 20 | 0.20032 |
| 55.43 | 20 | 0.21090 |
| 55.54 | 20 | 0.21729 |
| 31.68 | 100 | 0.19515 |
| 35.13 | 100 | 0.19532 |
| 36.24 | 100 | 0.19701 |
| 41.14 | 100 | 0.20148 |
| 57.18 | 100 | 0.21607 |
| 57.38 | 100 | 0.22323 |
| 58.58 | 250 | 0.22538 |
| 58.60 | 250 | 0.22166 |
| 58.60 | 250 | 0.22277 |
| 41.45 | 275 | 0.20321 |
| 38.63 | 350 | 0.20992 |
| 38.65 | 350 | 0.20876 |
| 42.65 | 350 | 0.21290 |
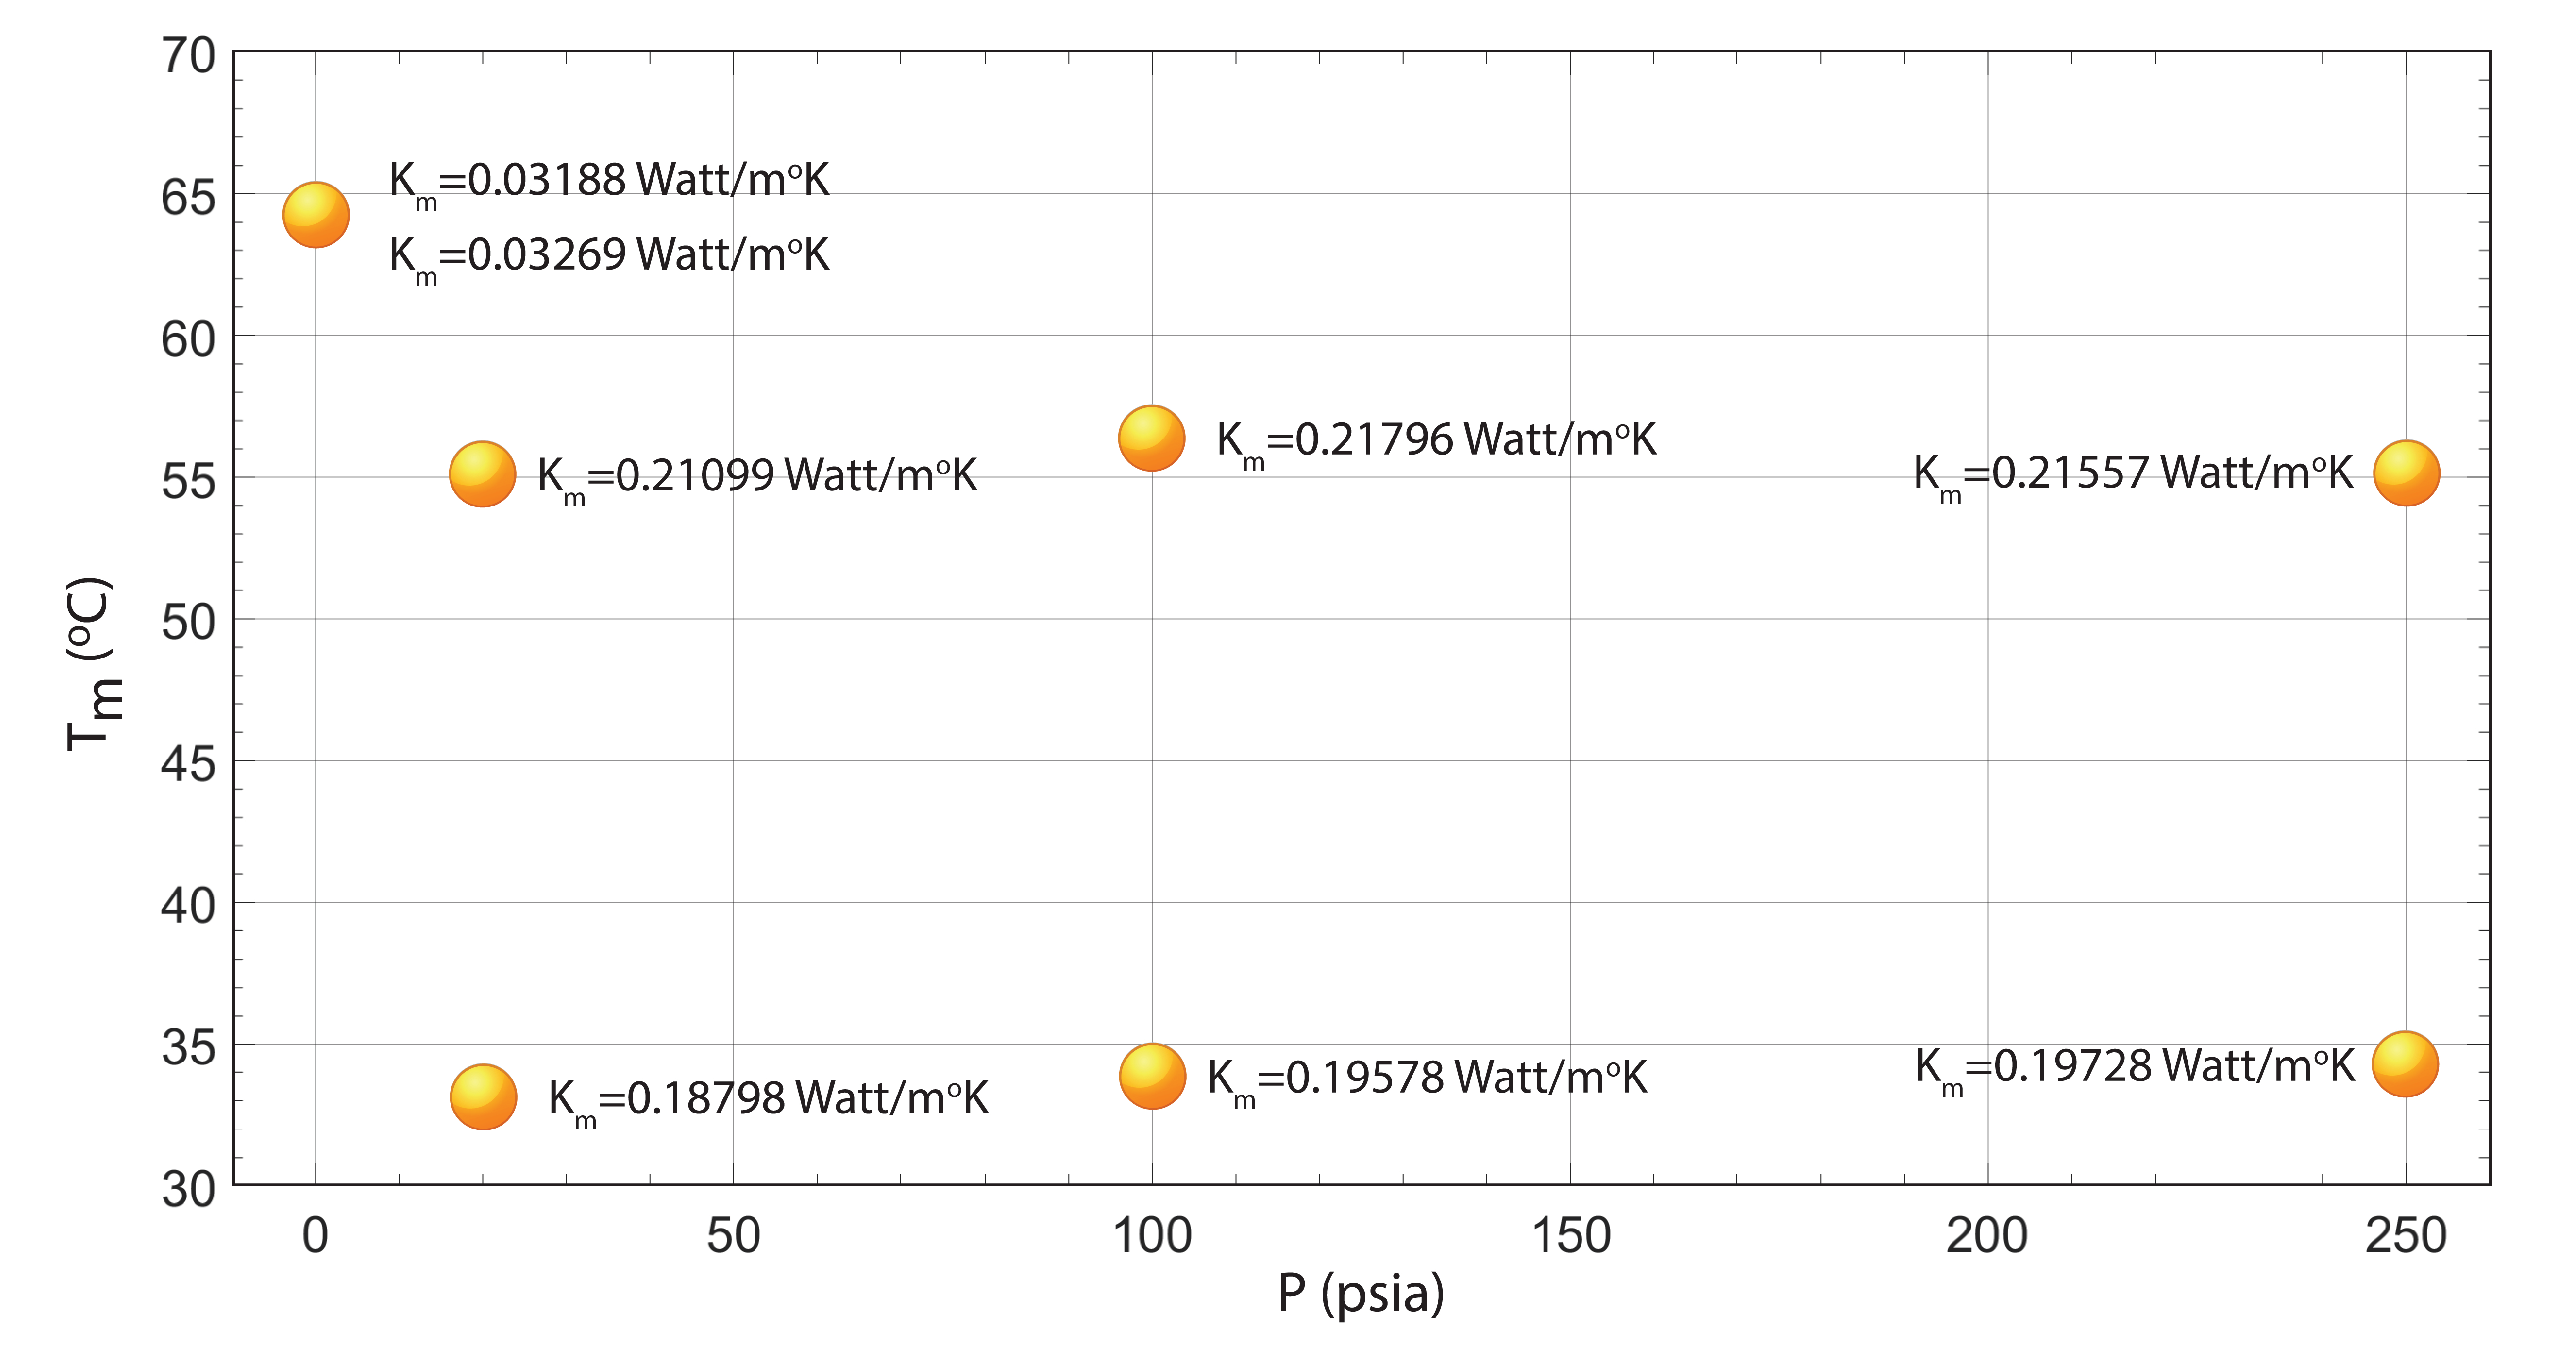
| T (C) | P (psia) | K (Watt/mK) |
|---|---|---|
| 64.33 | 0 | 0.03188 |
| 64.33 | 0 | 0. 03269 |
| 33.3 | 20 | 0. 18798 |
| 55.46 | 20 | 0.21099 |
| 34.09 | 100 | 0.19578 |
| 56.62 | 100 | 0. 21796 |
| 33.92 | 250 | 0. 19728 |
| 55.04 | 250 | 0.21557 |
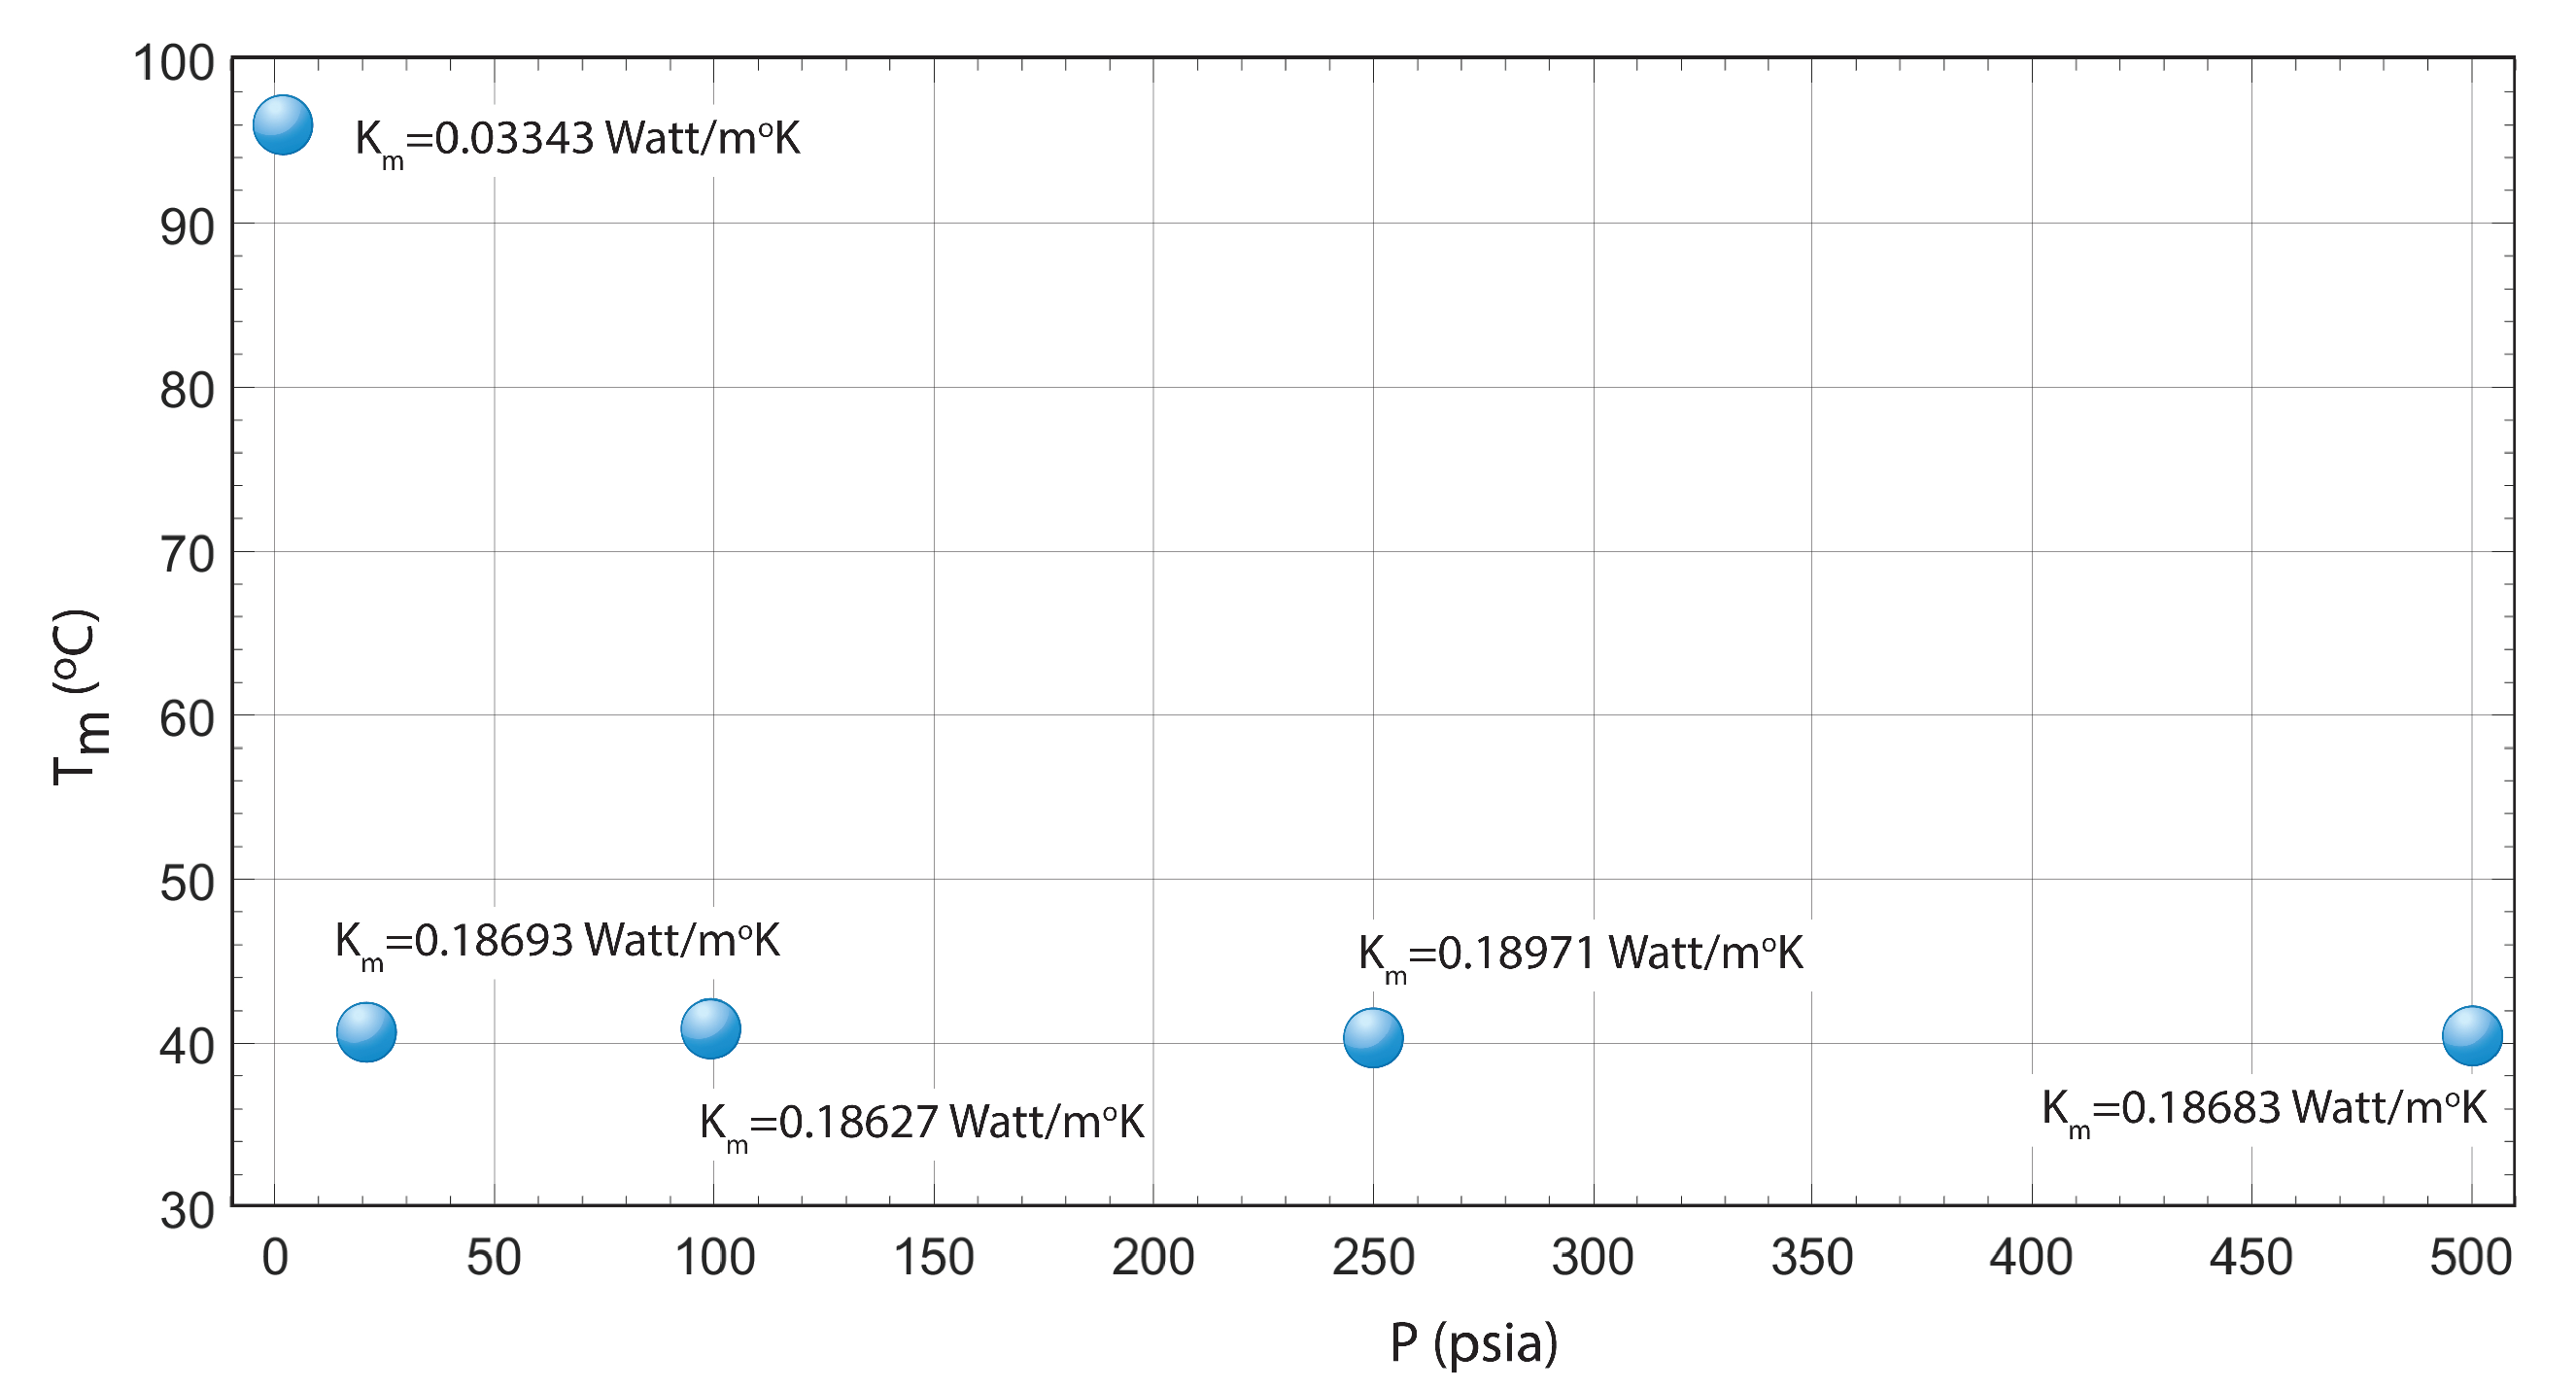
| T (C) | P (psia) | K (Watt/mK) |
|---|---|---|
| 95.82 | 0 | 0.03343 |
| 40.54 | 20 | 0.18693 |
| 40.81 | 100 | 0.18627 |
| 40.50 | 250 | 0.18971 |
| 40.57 | 500 | 0.18683 |
© 2020 by the authors. Licensee MDPI, Basel, Switzerland. This article is an open access article distributed under the terms and conditions of the Creative Commons Attribution (CC BY) license (http://creativecommons.org/licenses/by/4.0/).
Share and Cite
Ertas, A.; Boyce, C.T.R.; Gulbulak, U. Experimental Measurement of Bulk Thermal Conductivity of Activated Carbon with Adsorbed Natural Gas for ANG Energy Storage Tank Design Application. Energies 2020, 13, 682. https://doi.org/10.3390/en13030682
Ertas A, Boyce CTR, Gulbulak U. Experimental Measurement of Bulk Thermal Conductivity of Activated Carbon with Adsorbed Natural Gas for ANG Energy Storage Tank Design Application. Energies. 2020; 13(3):682. https://doi.org/10.3390/en13030682
Chicago/Turabian StyleErtas, Atila, Christopher T. R. Boyce, and Utku Gulbulak. 2020. "Experimental Measurement of Bulk Thermal Conductivity of Activated Carbon with Adsorbed Natural Gas for ANG Energy Storage Tank Design Application" Energies 13, no. 3: 682. https://doi.org/10.3390/en13030682
APA StyleErtas, A., Boyce, C. T. R., & Gulbulak, U. (2020). Experimental Measurement of Bulk Thermal Conductivity of Activated Carbon with Adsorbed Natural Gas for ANG Energy Storage Tank Design Application. Energies, 13(3), 682. https://doi.org/10.3390/en13030682