Abstract
An aerosol shock tube has been developed for measuring the ignition delay times (tig) of aerosol mixtures of low-vapor-pressure fuels and for visualization of the auto-ignition flow-field. The aerosol mixture was formed in a premixing tank through an atomizing nozzle. Condensation and adsorption of suspended droplets were not observed significantly in the premixing tank and test section. A particle size analyzer was used to measure the Sauter mean diameter (SMD) of the aerosol droplets. Three pressure sensors and a photomultiplier were used to detect local pressure and OH emission respectively. Intensified charge-coupled device cameras were used to capture sequential images of the auto-ignition flow-field. The results indicated that stable and uniform aerosol could be obtained by this kind of atomizing method and gas distribution system. The averaged SMD for droplets of toluene ranged from 2 to 5 m at pressures of 0.14–0.19 MPa of dilute gases. In the case of a stoichiometric mixture of toluene/O2/N2, ignition delay times ranged from 77 to 1330 μs at pressures of 0.1–0.3 MPa, temperatures of 1432–1716 K and equivalence ratios of 0.5–1.5. The logarithm of ignition delay times was approximately linearly correlated to 1000/T. In contrast to the reference data, ignition delay times of aerosol toluene/O2/N2 were generally larger. Sequential images of auto-ignition flow-field showed the features of flame from generation to propagation.
1. Introduction
A wide range of pressures and temperatures can be produced by the static airflow behind the reflected shock wave, so that the ignition phenomena of gas, liquid and nano-solid fuels can be studied in shock tubes. Compared with conventional methods, shock wave heating reduces the influence of heat transfer and pressurization on the experimental results. The test time (several to 10 ms) can be effectively adjusted by changing the length and conditions of the driver and driven section of the shock tube. Therefore, the shock tube is the main tool for hydrocarbon fuel ignition and combustion chemistry kinetics research [1,2,3,4,5].
For low-vapor-pressure fuels, shock tubes can be divided into two categories: (a) Heated shock tube. Brezinsky’s group built high-pressure shock tubes [2,3] for the study of high-temperature decomposition, oxidation mechanisms of hydrocarbon fuels. This kind of shock tube uses a single (or double) diaphragm, which is suitable for studying the gas phase reaction at high temperatures (up to 2000 K) and ultra-high pressures (up to 100 MPa), and the test time is usually 0.5–2 ms. External heating is used to form a premixed gas of the hydrocarbon fuel. At room temperature, the saturated vapor pressures of JP-7 and n-dodecane are less than 133.3 Pa, and the high equivalence ratio requires a higher ambient temperature (greater than 120 °C) than that required for an aerosol to prevent fuel condensation. When the heating temperature is too high, the fuel will be thermally decomposed, and components with low saturated vapor pressures will be distilled. Some components must be added to keep the fuel composition unchanged. (b) Aerosol shock tube. This kind of shock tube can be applied to studies of the ignition delay and chemical kinetics of hydrocarbon fuels with low vapor pressures. There are two methods of producing aerosols in shock tubes. (1) Diffusion. Liquid fuel is injected or sprayed into the experimental section, and aerosols are formed by natural evaporation (or by heating) or spraying (pressure atomization) [6,7]. This method is suitable for small-scale shock tubes, but not for high heat distillation or the thermal decomposition of fuel. It is difficult to form uniform aerosols by spraying, and this also can cause wall adsorption to change the equivalent ratio of the mixture. Thus, this method is rarely used. (2) Premix. The liquid fuel is atomized outside the shock tube to form an aerosol mixture, and then the aerosol is filled into the test section [1]. Hanson’s group built a large size (cross section of 100 mm × 100 mm) aerosol shock tube using a supersonic nebulizer to atomize liquid fuel to form an aerosol with a concentration of 5–20 ppm [8,9,10,11,12]. The vapor concentration was measured by absorption spectroscopy, and the particle size distribution was measured by laser extinction. The dilute gas (21% O2 + 79% Ar) was used to carry droplets into the driven section. The measurements showed that the liquid droplets quickly evaporated in the high-temperature airflow after the shock wave. The aerosol did not sediment, the composition remained stable in the aeration process, and there was no evident adsorption in the air inlet valve and observation window. The average particle size, measured by a Malvern particle size analyzer, was about 4.5 μm with a logarithmic-normal distribution. The particle size was independent of the fuel species, but it was related to the density and viscosity of the droplets. The main purpose of this paper was to obtain aerosol by another atomization method rather than a supersonic nebulizer, which was verified in the designed shock tube.
Ignition delay measurements in shock tubes also involve transient pressure, a high-resolution spectrum, absorption spectrum [1], imaging technology [13,14,15,16,17], time-of-flight mass spectrometry (TOF) [18] and a laser extinction method [19]. However, previous research of visualization for auto-ignition flow-field of hydrocarbon fuels is relatively limited due to camera performance. It should be noted that this apparatus was briefly outlined in Yingjia’s work [20]. That is because the first author had been a short-term visitor in our laboratory, and the published images and ignition delay data for kerosene were obtained in the laboratory also. However, some new improvements were achieved after that, such as the acquisition method for optical measurement, the new design of the premixing tank for aerosol generation, and so on. Furthermore, the detailed mechanism, calculation and verification experiments have never been published. Therefore, in this paper, a rectangular aerosol shock tube was developed to generate aerosol based on the premix method. The ignition delay times of toluene/O2/N2 and high-speed photographs of the auto-ignition flow-field were preliminarily studied to ensure the performance of the aerosol shock tube.
2. Aerosol Shock Tube
The structure of the aerosol shock tube is shown in Figure 1. The aerosol shock tube consisted of a driver section, driven section, aerosol intake section, gas distribution section and premixing tank. The main tubes were constructed from rectangular cold-drawn galvanized seamless steel pipes with a 10 mm wall thickness and an internal cross section dimension of 130 mm × 80 mm, which were connected through round flanges. Two kinds of fillet welds with radii of 10 mm and 20 mm were used to link the internal and external adjacent walls. In addition, 10 mm-diameter probe ports on the wall were used to obtain pressure and optical signals.
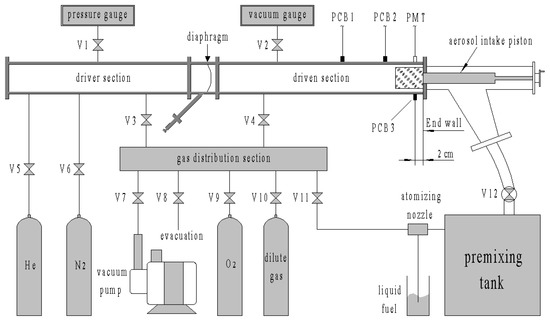
Figure 1.
Sketch of the aerosol shock tube and gas distribution system.
The lengths of the driver and driven sections were 2 m and 2.6 m, respectively. The Biaxially Oriented Polypropylene (BOPP) diaphragm was burst by a needle driven by a spring, which was set at 45° to the diaphragm. A pressure gauge with 0–10 MPa range and 0.05% accuracy and a capacitive film vacuum gauge with 0–10 kPa range and 1 Pa accuracy were used to monitor the pressure of the driver gases and the driven aerosol mixture, respectively.
The aerosol intake section was used to connect the driven section and the premixing tank. There was a piston valve with a 60 mm diameter and 375 mm length inside the aerosol intake section, which was driven by a screw wheel outside. A flange with a 60 mm internal diameter was welded at 45° to the lateral side of the aerosol intake section and connected with the premixing tank by a rubber hose with a 64 mm diameter and 1100 mm length.
The premixing tank had a 500 mm internal diameter and 1500 mm length and was made of stainless steel. To observe the fuel atomization, deposition and residue phenomena, two transparent sheets made of polymethyl methacrylate (PMMA) were installed on both sides of the premixing tank. One sheet was installed with a large ball valve to connect the aerosol intake section, and the other was installed with the atomizing nozzle.
The vacuum pump system consisted of a Leybold TRIVAC rotary vane pump and RUVAC roots pump. The shock tube was first vacuumed to less than about 10 kPa by the rotary vane pump and then to less than 60 Pa by the roots pump, which was the ultimate vacuum pressure. The leak rate of the overall shock tube was about 10 Pa/min. Research grade gas sources (99.999%), such as helium, nitrogen and oxygen, were applied during experiments. The liquid hydrocarbon fuels are generally analytical grade with approximately 98% purity.
3. Fuel Atomization and Aerosol Intake
3.1. Fuel Atomization
Most of the low-vapor-pressure fuels are liquid or nano-solid at room temperature and pressure, so how to mix the fuel and dilute gas to form a homogeneous aerosol mixture is the primary problem. In this paper, the mechanism and structure of the fuel atomizing nozzle is illustrated in Figure 2a,b where P0 is the pressure of the dilute gas, Pf0 is the pressure of the liquid fuel, Pb is the pressure of aerosol mixture in the premixing tank, P* is the pressure at the throat of the nozzle, v* and vf are the velocities of the dilute gas and the liquid fuel at the throat of nozzle, σf is the cross-sectional area of the intersection. The schematic structure of the atomizing nozzle can be considered as a simplified de Laval nozzle. For manufacturing convenience, the contraction and expansion sections of the atomizing nozzle were simplified as two 60° cones with a 2 mm-diameter throat and 8 mm-diameter outlet, respectively.
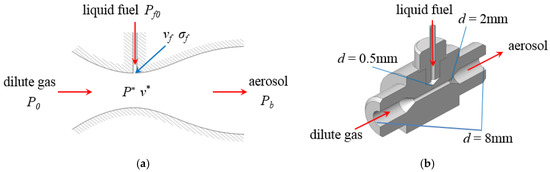
Figure 2.
Schematic diagram and structure of the atomizing nozzle. (a) Schematic diagram of the atomizing nozzle; (b) structure of the atomizing nozzle.
With the ideal gas assumption, the airflow conditions at the nozzle are shown in Table 1. All through this work, fuel is drawn into the nozzle under case 3 due to the large range of Pb for preventing the change of the working conditions caused by the increase in Pb during the atomization process. Furthermore, the velocity of the outlet airflow in case 3 was lower than that in the other cases, which reduced the collision effect between the droplets and the premixing tank. It should be noted that P0 and Pb should be recalculated when the bath gas is not N2.

Table 1.
Different conditions within the atomizing nozzle with different Pb/P0.
Take air as an example, based on the one-dimension isentropic relationship, the following relation holds when the airflow in the throat reaches the critical speed of sound:
The Bernoulli equation is as follows:
Then the mass flow rate of the fuel is as follows:
Obviously, the following relation Pf0 > P* should be satisfied to draw the liquid fuel into the throat. Based on Equations (1) and (3), when P0 is increased, P* is correspondingly increased, the difference between Pf0 and P* is reduced, and is reduced. On the contrary, increases when P0 decreases. Therefore, P0 can be adjusted to control the air and fuel intake speed such that both intake times are generally the same, which is conducive to the full mixing of air and fuel. Moreover, fuel atomization should be completed before the air intake. Take 0.1 MPa as the final pressure of the aerosol mixture in the premixing tank, when P0 is 0.18 MPa, the times of fuel atomization and air intake are approximately equal.
The fuel atomization process is described as follows. First, based on the volume of the premixing tank and the final pressure of the aerosol mixture, the relative air quality could be calculated. The required amount of fuel is calculated using the predetermined equivalence ratio, and acquired using an analytical balance with a range of 0–620 g and an accuracy of 0.01 g. Next, the premixing tank is evacuated to vacuum state, and then the high pressure dilute gas is filled into the tank through the atomizing nozzle. The ratio of the inlet and outlet pressures of the nozzle is adjusted by the pressure relief valve. When Pb reaches the predetermined background pressure, P* is slightly lower than atmospheric pressure. Then the liquid fuel is automatically inhaled into the nozzle throat, atomized by the shear of the high-speed airflow and mixed with the dilute gas. When the liquid fuel is fully inhaled, the valve of the fuel filter is closed and the dilute gas is filled into the premixing tank until Pb reaches the predetermined value, indicating that the aerosol mixture achieved the equivalence ratio. After fuel atomization, the aerosol has about 30 min to produce the uniform mixture. Condensation and deposition of droplets are not found visibly through the transparent windows.
3.2. Aerosol Intake
The structure of the aerosol intake section is shown in Figure 3a. The aerosol intake piston is driven horizontally by a screw rotated by an external wheel to control the aerosol intake. The expansion structure, which had a diameter of more than 60 mm and a steering angle of 45°, was used to slow down the aerosol and prevent gas-liquid separation during the diversion. If the end wall is constructed from a common blind flange, there would be a distance between the end wall and the window, which results in the auto-ignition flow-field occurring near the end wall, which would not be visible from the window. Therefore, a flange with a convex plate was adopted at the end of the driven section to facilitate the initial ignition flow-field visualization. When the valve was closed, the piston moved to the left to create the reflection end-wall.
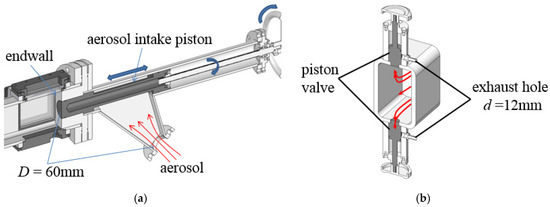
Figure 3.
Schematic of aerosol intake process. (a) Structure of the aerosol intake section; (b) structure of the exhaust valve.
The process of aerosol intake is briefly described as follows. First, the intake piston is moved to the right, and then the driven section and aerosol intake section are vacuumed. Then, when the large ball valve is opened, the aerosol is filled into the driven section. Meanwhile the aerosol is still exhausted by the pump from the valves near the diaphragm to generate continuous airflow in the driven section, as shown in Figure 3b. After repeated flushing of aerosol for several times, the wall of the driven section would be fully wetted and no longer adsorb droplets. Considering that the volume of the premixing tank is approximately ten times that of the driven section, the equivalence ratio of the mixture remains stable after such operation. Then move the intake piston to the left and close the ball valve. The aerosol in the driven section is pumped to the initial pressure through the vacuum pump eventually.
4. Sauter Mean Diameter Measurement and Droplet Evaporation
4.1. SMD Measurement
The SMD (Sauter Mean Diameter) distribution of the droplets was measured by a laser particle size analyzer with a range of 0.5–1000 μm and an accuracy of 1%, which was based on Mie scattering theory. The analyzer consisted of a semiconductor laser, detector for the scattered light and data acquisition system, as shown in Figure 4a. A laser with a wavelength of 532 nm and a beam diameter of 1 mm crossed the test section of the driven section of the shock tube directly, then it was scattered by droplets and eventually entered the detector. Droplets of different particle sizes produce different scattering angles, and the histogram of the SMD distribution can be calculated by data processing software based on the light intensity distribution on the detector.
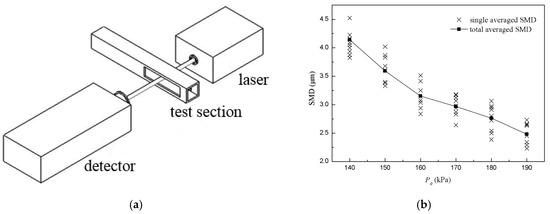
Figure 4.
Optical diagram of laser particle size analyzer and SMD measurements of aerosol. (a) Optical diagram of laser particle size analyzer; (b) SMD measurements of aerosol of toluene/O2/N2 at different P0.
Results of SMD measurement for toluene droplets at different P0 are shown in Figure 4b, where the cross point is the averaged value in a single measurement and the solid square point is the total averaged value for different P0. The results showed that the SMD of droplets changed when P0 changed, and the SMD range was 2–5 μm. When P0 increased, the SMD of droplets decreased slightly. According to the aerosol theory, a stable and suspended aerosol should be generated when particle sizes are less than 10 μm, so as to make the shock wave front not curved and emission not refracted. Therefore, the aerosol obtained in this study could be considered as a steady and uniform mixture.
4.2. Droplet Evaporation and Diffusion Estimation
It was necessary to figure out the status of the droplets of Region 2 (the flow field behind the incident shock) for calculating the temperature and pressure of Region 5 (the flow field behind the reflected shock), so we needed to estimate the time of droplet evaporation and diffusion. Assuming ideal spherical droplets with a diameter of d spaced on a cubic grid with an edge length of Ld and the rate of change of the square of droplet diameter during evaporation was a constant [21,22], the characteristic time at which 95% of the droplets had evaporated can be rearranged as follows:
where D is the diffusion coefficient for the fuel vapor in the dilute gas, ρg/ρl is the density ratio of dilute gas to liquid fuel. Similarly, using the binary Fickian diffusion model, the characteristic time at which the fuel has spread to the center of the droplet cube can be shown as follows:
Meanwhile, based on the ideal one-dimensional flow theory of the shock tube, the characteristic time between the arrival of incident shock and reflected shock at the location of sensors, taken as duration time of Region 2, can be listed as follows:
where L3g is the distance from the sensor to the end wall of the driven section, a1 is the sound velocity of Region 1, γ1 is the adiabatic exponent of Region 1, and Ms is the Mach number of the incident shock.
With d = 3 μm, D = 0.3 cm2/s, ρg(air) = 1.29 kg/m3, ρl(fuel) = 800 kg/m3, p1 = 1.6 kPa, T1 = 300 K, L3g = 20 mm, Equations (4)–(6) were used to estimate te,95, td and t2 as a function of Mach number of incident shock, as shown in Figure 5. With increased Ms, te,95 and td were almost constant while t2 decreased slightly. Additionally, te,95 and td were one order of magnitude less than t2, which meant that the droplets had fully evaporated and evenly diffused to the whole area before the reflected shock arrived at the sensor.
Figure 5.
Characteristic time estimated for evaporation of droplets and diffusion at different Mach number of incident shock.
An aerosol shock tube has already been used by the Hanson group at Stanford University [8,9,10,11,12]. Although both shock tubes adopt the idea of premixing outside the shock tube to avoid the size limitation of a shock tube, there are several differences between the reference and the shock tube designed in this work, as shown in Table 2. The main difference was the atomization method: the Hanson group used an ultrasonic nebulizer, and our shock tube used high-speed airflow to shear the liquid fuel. However, both shock tubes achieved stable and suspended aerosol in the test section, and the SMDs of the aerosols produced by different methods were roughly the same. Another difference was the aerosol intake method, which affected the adsorption of droplets on the wall. The real-time state of the aerosol was detected by optical measurements in Hanson group’s shock tube, and this made it more suitable for ignition delay measurement. However, in addition to ignition delay measurement, we also focused on auto-ignition flow-field visualization, such as high-speed photography, schlieren and PLIF, and this shock tube was designed for these.
Table 2.
Differences between two kinds of aerosol shock tubes.
5. Results and Discussion
5.1. Pressure and Optical Measurements
There were three pressure sensors (PCB Model 112A) and one optical fiber (400-025-UV-VIS) used to measure the shock speed and ignition time on the top and bottom of the test section, as shown in Figure 6. The distances from the pressure sensors to the end wall were 639 mm, 237 mm and 20 mm, respectively. The optical fiber was right against PCB3. The optical signal was transferred to the PMT (Photo Multiplier Tube, Model R928, side-on) to generate electrical signals with a bias voltage of −800 V. All the pressures and optical signals were transmitted to the oscilloscope (Tektronix TDS2014C).
Figure 6.
Sketch of pressure and optical measurements.
A molten quartz glass window with dimensions of 120 mm × 80 mm was used for flow-field visualization on the lateral side at the end of the driven section. A high-speed camera (Stanford Computer Optics, XXRapidFrame with 3 Nos. 4 Picos), which contained four independent ICCD cameras, a beam split system and a time synchronization system, were used just in front of the window. The camera was triggered by DG645 (Stanford Research Systems DG645 Digital Delay/Pulse Generator, 8 delay channels, 5ps resolution) immediately when the PMT signal reached −0.2 V. The camera gain could be set within 600–1000, and the minimum exposure time was 0.2 ns.
Using the measurements described above, three pressure time histories, one light intensity time history and four photographs could be obtained in a single experiment. Thus, the ignition delay time and sequential images of the auto-ignition flow-field could be derived from the aforementioned data.
5.2. Ignition Delay Time Measurements
Typical profiles of the pressure and light intensity signals are shown in Figure 7, using aerosol of stoichiometric toluene/21%O2/N2. The frame shows typical signal profiles of PCB3 and PMT. The pressure profile shows a classic shock tube behavior. The incident shock wave first goes through PCB3 and results in the first pressure rise plateau, which signifies that a uniform flow field has formed. The pressure behind the reflected shock wave was recorded as the second plateau. The rapid rise in the pressure indicated the start of ignition after about 500 μs, which was coincident with the rise in OH* emission. When the ignition stage ended, the combustion stage corresponded to heat release, and the increase in the local temperature led to a pressure rise. Local shock waves spread to surroundings when the partial pressure rise rate was high. Local shock waves propagated between the reflected shock wave front and the end wall, resulting in rapid pressure fluctuations. As for OH* emission, the profile showed a simple crest. Additionally, after the crest, the OH* emission profile weakened as time marching, and varied roughly the same with the pressure profile.
Figure 7.
Typical profiles of pressure and OH* emission signals for toluene/21%O2/N2.
The arrival time of the reflected shock wave at PCB3 was used to initiate ignition, and the start of the maximum slope point of OH* emission was taken as the end of ignition [23]. The ignition delay time was calculated as the time difference between the two times. According to the measured shock velocity (or Mach number) and the initial pressure and temperature of the driven section, the ignition pressure and temperature were obtained by the Gaseq software [24] with frozen chemistry assumption. Thus the ignition delay times were obtained from the aerosol shock tube.
To verify the performance of the aerosol shock tube, ignition delay times of toluene/O2/N2 with pressures of 0.1–0.3 MPa, temperatures of 1432–1716 K and equivalence ratios of 0.5–1.5 were measured, as shown in Figure 8a. Under these conditions, shorter ignition delay times were measured at higher temperatures, and this meant that the reaction rate increased with rising temperature. The logarithm of the ignition delay time, ln(tig), showed a highly linear correlation with 1000/T. Similar trends were observed for three equivalence ratios. This indicated that there was a consistent trend with the reactivity of toluene/O2/N2 and with the equivalence ratio throughout the study. For a fixed temperature, the ignition delay time increased with increasing equivalence ratios, which meant that fuel-lean mixtures ignited faster than the fuel-rich mixtures. Using the Arrhenius equation, the results can be summarized as follows:
where ignition delay time (tig) is in μs, pressure (p) is in kPa, and temperature (T) is in K.
Figure 8.
Ignition delay times of toluene/O2/N2. (a) Diagram of ignition delay times of toluene/O2/N2 and fitted curves with pressures of 0.1–0.3 MPa, temperatures of 1432–1716 K, and equivalence ratios of 0.5–1.5; (b) previously published data [7,25,26,27] is provided for comparison, normalized to a pressure of 0.1 MPa and an equivalence ratio of 1.0.
Ignition delay times from this study and other heated shock tubes were normalized to an equivalence ratio of 1.0 and pressure of 0.1 MPa, as shown in Figure 8b. Results showed that ignition delay times of spray droplets of toluene [7] were rather closer to that of the current study than the other studies, and ignition delay times of aerosol toluene/O2/dilute gas were generally greater than that of a gaseous mixture. There are several reasons for this disagreement: (1) Different ignition delay time definitions used in these studies. For example, Cadman [7] used the ratio of the emissions at the two wavelengths of 441.6 nm and 546.6 nm as a indication of temperature rise in the reaction zone, Vasudevan [25] used 50% of the peak OH concentration as the end of ignition, Pitz [26] used 10% of the peak OH concentration, Burcat [27] used the onset of the ignition pressure. On the other hand, the different locations of sensors may also have differed ignition delay times. (2) Different configurations and dimensions of shock tubes. These would affect the uniformity of flow-field behind the reflected shock, especially for rectangle and round shock tubes. (3) Different dilute gases. Although dilute gas does not participate in the chemical reaction, it may affect the collision efficiency resulting in differences of ignition delay times.
5.3. High-Speed Photography of Auto-Ignition Flow-Field
Figure 9 shows the sequential images of auto-ignition flow-field using toluene/O2/N2 at pressure of 0.1 MPa, temperature of 1696 K, equivalence ratio of 0.5, and tig is 124 μs. To facilitate analysis, the X-axis and Y-axis were taken as horizontal and vertical directions, respectively. The end of the driven section is located at x = 0. The optical fiber and PCB3 were located at x = 20 mm. Δt is the time interval between the photograph and the trigger. While the velocity of the reflected shock wave is estimated about 400 m/s and the length of the window is 100 mm, the intervals among images are set to 25 μs. The exposure times of images are all 1 μs, and the camera gain is set to the maximum of 1000.
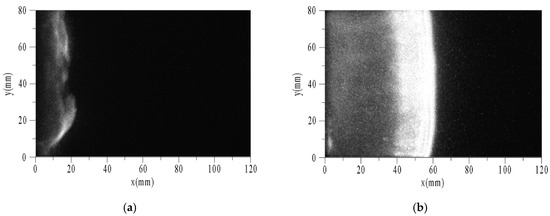
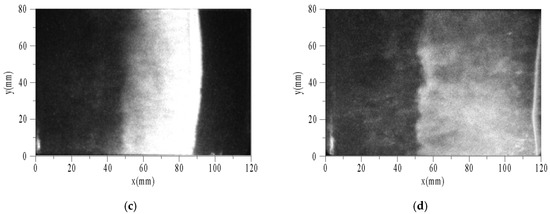
Figure 9.
Sequential images of auto-ignition flow-field of toluene/O2/N2. (a) Δt = 0; (b) Δt = 25 μs; (c) Δt = 50 μs; (d) Δt = 75 μs.
The characteristic phenomena of flame are described as follows. When Δt = 0, a weak discrete flame appeared in the area near the end (x < 20 mm). The flame surface consisted of multiple curved shapes, not a plane as expected. This is because the boundary layer induced by the incident and reflected shock waves led to a non-uniform region after reflecting the shock waves. Thus, the flat flame was distorted. When Δt = 25 μs, the flame surface had reached the position of x = 60 mm. According to the velocity of the reflected shock wave, the flame had caught up with it, and then propagated to the right coupling together. There was a wide combustion area behind the flame surface, and on the left was the high temperature area after combustion. When Δt = 50 μs, the flame surface had reached the position of x = 90 mm. According to the positions of the flame surface and time interval between the two images, the absolute velocity of flame could be obtained as about 1200 m/s. When Δt = 75 μs, the flame surface had ran nearly out of the window. The width of combustion area increased with time.
6. Conclusions
Based on the idea of premix out of shock tube, an aerosol mixture with particle sizes of 2–5 μm can be generated through the shear method by high speed airflow presented in this paper. The aerosol can be considered as a uniform mixture as well after inhaled into the driven section. The aerosol droplet would evaporate and diffuse fast to form a homogeneous mixture before the arrival of the reflected shock. The ignition delay times of toluene/O2/N2 are close to the previous data, which proves the reliability of this method. The sequential images of the auto-ignition flow-field shows features of the flame from generation to propagation, and further studies on the visualization of auto-ignition flow-field for low-vapor-pressure fuels will be carried out.
Author Contributions
Q.L. and S.X. planned the initial idea of aerosol shock tube. E.L. and Q.L. designed the structure of the shock tube. E.L. carried out the experiments and wrote the original manuscript. All authors have read and agreed to the published version of the manuscript.
Funding
This research was funded by the National Natural Science Foundation of China (No. 11372306).
Acknowledgments
In this section you can acknowledge any support given which is not covered by the author contribution or funding sections. This may include administrative and technical support, or donations in kind (e.g., materials used for experiments).
Conflicts of Interest
The authors declare no conflict of interest.
References
- Davison, D.F.; Haylett, D.R.; Hanson, R.K. Development of an aerosol shock tube for kinetic studies of low vapor-pressure fuels. Combust. Flame 2008, 155, 108–117. [Google Scholar] [CrossRef]
- Tranter, R.S.; Fulle, D.; Brezinsky, K. Design of a high-pressure single pulse shock tube for chemical kinetic investigations. Rev. Sci. Instrum. 2001, 72, 3046–3054. [Google Scholar] [CrossRef]
- Tranter, R.S.; Sivaramakrishnan, R.; Brezinsky, K.; Allendorf, M.D. High pressure, high temperature shock tube studies of ethane pyrolysis and oxidation. Phys. Chem. Chem. Phys. 2002, 4, 2001–2010. [Google Scholar] [CrossRef]
- Bakali, A.E.; Dagaut, P.; Pillier, L.; Desgroux, P.; Pauwels, J.-F.; Rida, A.; Meunier, P. Experimental and modeling study of the oxidation of natural gas in a premixed flame, shock tube and jet-stirred reactor. Combust. Flame 2004, 137, 109–128. [Google Scholar] [CrossRef]
- Hanson, R.K.; Davidson, D.F. Recent advances in laser absorption and shock tube methods for studies of combustion chemistry. Prog. Energy Combust. Sci. 2014, 44, 103–114. [Google Scholar] [CrossRef]
- Tsuboi, T.; Hozumi, T.; Hayata, K.; Ishii, K. Study of diesel spray combustion in air containing burnt gas using a shock tube. Combust. Sci. Technol. 2005, 177, 513–537. [Google Scholar] [CrossRef]
- Cadman, P. Shock tube combustion of liquid hydrocarbon sprays of toluene. Phys. Chem. Chem. Phys. 2001, 3, 4301–4309. [Google Scholar] [CrossRef]
- Campbell, M.F. Studies of Biodiesel Surrogates Using Novel Shock Tube Techniques. Ph.D. Thesis, Stanford University, Palo Alto, CA, USA, July 2014. [Google Scholar]
- Haylett, D.R.; Davidson, D.F.; Hanson, R.K. Second-generation aerosol shock tube: An improved design. Shock Waves 2012, 22, 483–493. [Google Scholar] [CrossRef]
- Campbell, M.F.; Tulgestke, A.M.; Davidson, D.F.; Hanson, R.K. A second-generation constrained reaction volume shock tube. Rev. Sci. Instrum. 2014, 85, 055108. [Google Scholar] [CrossRef]
- Haylett, D.R.; Lappas, P.P.; Davidson, D.F.; Hanson, R.K. Application of an aerosol shock tube to the measurement of diesel ignition delay times. Proc. Combust. Inst. 2009, 32, 477–484. [Google Scholar] [CrossRef]
- Haylett, D.R.; Davidson, D.F.; Hanson, R.K. Ignition delay times of low-vapor-pressure fuels measured using an aerosol shock tube. Combust. Flame 2012, 159, 552–561. [Google Scholar] [CrossRef]
- Hedman, T.D.; Cho, K.Y.; Pfeil, M.A.; Satija, A.; Mongia, H.C.; Groven, L.J.; Lucht, R.P.; Son, S.F. High speed OH PLIF applied to multiphase combustion (Review). Combust. Explos. Shock Waves 2016, 52, 1–13. [Google Scholar] [CrossRef]
- Lobasov, A.S.; Chikishev, L.M.; Dulin, V.M. Comparison between premixed and partially premixed combustion in swirling jet from PIV, OH PLIF and HCHO PLIF measurements. J. Phys. Conf. Ser. 2017, 899, 062002. [Google Scholar] [CrossRef]
- Donbar, J.M.; Driscoll, J.F.; Carter, C.D. Reaction zone structure in turbulent non-premixed jet flames from CH-OH PLIF images. Combust. Flame 2000, 122, 1–19. [Google Scholar] [CrossRef]
- Donbar, J.M.; Gruber, M.R.; Jackson, T.A.; Carter, C.D.; Mathur, T. OH planar laser-induced fluorescence imaging in a hydrocarbon-fueled scramjet combustion. Proc. Combust. Inst. 2000, 28, 679–687. [Google Scholar] [CrossRef]
- Kamel, M.R.; Morris, C.I.; Stouklov, I.G.; Hanson, R.K. PLIF imaging of hypersonic reactive flow around blunt bodies. Symp. Combust. 1996, 26, 2909–2915. [Google Scholar] [CrossRef]
- Tranter, R.S.; Giri, B.R.; Kiefer, J.H. Shock tube/time-of-flight mass spectrometer for high temperature kinetic studies. Rev. Sci. Instrum. 2007, 78, 034101. [Google Scholar] [CrossRef]
- Timmler, J.; Roth, P. Measurements of high-temperature evaporation rates of solid and liquid aerosol particles. Int. J. Heat Mass Transf. 1989, 32, 1887–1895. [Google Scholar] [CrossRef]
- Zhang, Y.; Huang, Z.; Wang, J.; Xu, S. Shock tube study on auto-ignition characteristics of kerosene/air mixtures. Chin. Sci. Bull. 2011, 56, 1399–1406. [Google Scholar] [CrossRef][Green Version]
- Landry, E.S.; Mikkilineni, S.; Paharia, M.; Mcgaughey, A.J.H. Droplet evaporation: A molecular dynamics investigation. J. Appl. Phys. 2007, 102, 124301. [Google Scholar] [CrossRef]
- Faeth, G.M. Current status of droplet and liquid combustion. Prog. Energy Combust. Sci. 1977, 3, 191–224. [Google Scholar] [CrossRef]
- Davidson, D.F.; Hanson, R.K. Interpreting shock tube ignition data. Int. J. Chem. Kinet. 2004, 36, 510–523. [Google Scholar] [CrossRef]
- Chris, M. Gaseq Version 0.79. Available online: http://www.gaseq.co.uk (accessed on 21 January 2005).
- Vasudevan, V.; Davidson, D.F.; Hanson, R.K. Shock tube measurements of toluene ignition times and OH concentration time histories. Proc. Combust. Inst. 2005, 30, 1155–1163. [Google Scholar] [CrossRef]
- Pitz, W.J.; Seiser, R.; Bozzelli, J.W.; Costa, I.D.; Fournet, R.; Billaud, F.; Battin-leclerc, F.; Seshadri, K.; Westbrook, C.K. Chemical Kinetic Characterization of Combustion of Toluene. In Proceedings of the Second Joint Meeting of the U. S. Section of the Combustion Institute, Oakland, CA, USA, 20 March 2001. UCRL-JC-142415. [Google Scholar]
- Burcat, A.; Farmer, R.C.; Espinoza, R.L.; Matula, R.A. Comparative ignition delay times for selected ring-structured hydrocarbons. Combust. Flame 1979, 36, 313–316. [Google Scholar] [CrossRef]


© 2020 by the authors. Licensee MDPI, Basel, Switzerland. This article is an open access article distributed under the terms and conditions of the Creative Commons Attribution (CC BY) license (http://creativecommons.org/licenses/by/4.0/).