Article

Envelope Thermal Performance Analysis Based on Building Information Model (BIM) Cloud Platform—Proposed Green Mark Collaboration Environment

1
Digitalization Department, Built Environment Research and Innovation Institute (BERII), Building and Construction Authority, Zero Energy Building (ZEB), 200 Braddell Road, Singapore 579700, Singapore
2
School of Science and Technology, Singapore University of Social Science, 463 Clementi Road, Singapore 599494, Singapore
3
BCA Academy, 200 Braddell Road, Singapore 579700, Singapore
4
Department of Building, School of Design and Environment, National University of Singapore, 4 Architecture Drive, Singapore 117566, Singapore
5
Department of Civil and Environmental Engineering, The Hong Kong University of Science and Technology, Clear Water Bay, Kowloon, Hong Kong 999077, China
*
Author to whom correspondence should be addressed.
Energies 2020, 13(3), 586; https://doi.org/10.3390/en13030586
Submission received: 19 November 2019 / Revised: 20 January 2020 / Accepted: 21 January 2020 / Published: 27 January 2020
(This article belongs to the Special Issue Building Thermal Envelope)

Abstract

:
Building Information Modeling (BIM) and sustainable buildings are two future cornerstones of the Architectural, Engineering and Construction (AEC) industry. In Singapore’s context, the Green Mark (GM) scoring system is prevalently used to assess the sustainability index of green buildings. BIM provides the semantic and geometry information of buildings, which is proliferated as the technological and process backbone for the green building assessment. This research, through vast literature reviews, identified that the current procedure of achieving a Green Mark score is tedious and cumbersome, which hampers productivity, especially in the calculation of building envelope thermal performance. Furthermore, the project stakeholders work in silos, in a non-collaborative, manual and 2D-based environment for generating relevant documentation to achieve the requisite green mark score. To this end, a cloud-based BIM platform was developed, with the aim of encouraging project stakeholders to collaboratively generate the project’s green mark score digitally in accordance with the regulatory requirements. Through this research, the authors have validated the Envelope Thermal Transfer Value (ETTV) calculation, which is one of the prerequisite criteria to achieve a Green Mark score, through a case study using the developed cloud-based BIM platform. The results indicated that using the proposed platform enhances the productivity and accuracy as far as ETTV calculation is concerned. This study provides a basis for future research in implementing the proposed platform for other criteria under the Green Mark Scheme.

Graphical Abstract

1. Introduction

In the recent decade, Building Information Modeling (BIM) has widely been adopted in the Architectural, Engineering, and Construction (AEC) industry and completely upended the way we build [1]. Building Information Modeling (BIM) has been identified by the Building and Construction Authority (BCA) of Singapore as one of the key drivers to improve productivity in the Architectural, Engineering, and Construction (AEC) industry. In 2010, the first BIM Roadmap was implemented and had since achieved progressive and positive results in various facets of building design [2]. The one-stop BIM submission to a number of agencies is one of the transformative policies introduced to the construction industry that made Singapore the first country in the region to accept and approve building plan submissions with BIM models [3]. With the increasing benefits of BIM, firms have been challenged to extend their BIM capabilities from modeling to design and coordination. Design integration of multiple disciplines with BIM has been improving steadily with better coordination and interfacing between different discipline models.
While BIM continues to gain momentum, especially in building plan submissions and coordination, it is also important to look at the other aspects of BIM, such as BIM for sustainability. There is an increasing demand for developing sustainable buildings because of rising energy costs and environmental impacts. Using BIM during the early stages of a project can facilitate complex building performance analyses, especially if it is used during the early design and pre-construction phases [4]. The traditional CAD-based practice often leads to retroactive modification of the design to achieve building performance requirements [5]. The information required for sustainable design, analyses, and certification can be readily and routinely made available by using BIM during the early design stages.
There are challenges in both developing a project in compliance with the Green Mark requirements and assessing the level of sustainability with partial and fragmented data. Project development, along with the emergence of integrated digital delivery (IDD) within the collaborative environment, could potentially ease these processes.
In this paper, a cloud-based platform for automated analysis and digital analysis technology, to be used for Green Mark envelope thermal performance analysis based on a BIM and 3D graphic environment is proposed. The calculations and data have been validated for accuracy.

2. Literature Review

2.1. Building Information Modeling (BIM)

The concept of BIM originated in the late 1970s with Professor Charles Eastman from Georgia Tech [6]. Since its development, different definitions have been given by scholars. To date, the most authoritative and highly recognized by the AEC industry is the National Building Information Modeling Standard (NBIM) published by the National Institute of Building Sciences (NIBS): “A BIM is a digital representation of physical and functional characteristics of a facility. As such it serves as a shared knowledge resource for information about a facility forming a reliable basis for decisions during its lifecycle from inception onward [7].” From the definition of BIM by NIBS, it can be seen that BIM includes a Building Information Model, Building Information Modeling and Building Information Management, which are interrelated but independent, the details are as follows:
  • From a static perspective, BIM is a digital model that integrates all information. This model can be used for virtual simulation and information sharing, that is, a building information model.
  • From a dynamic perspective, BIM is a behavioral process that continuously updates, inputs and extracts information. In this process, the model was gradually perfected to meet the needs of all stakeholders, namely Building Information Modeling.
  • From a management perspective, BIM provides a collaborative working environment, which integrates work and management processes, facilitates information sharing and connects stakeholders on the same project throughout the building life cycle. It allows timely identifying problems, making correct decisions and improving management efficiency, that is, Building Information Management.
In the above three perspectives of BIM, Building Information Model is the foundation, Building Information Modeling is the core and Building Information Management is the basic guarantee to achieve a Building Information Model, which is complementary and indispensable. The reasonable coupling of the three functions enables BIM technology to have the characteristics of operation visualization and integration of information completeness, coordination and interoperability, etc. BIM technology can provide basic support for improving the productivity of the construction industry, increasing professional communication and reducing resource waste.

2.2. Green Building Assessment (GBA) Systems

In order to better regulate the development of green buildings and improve the living environment of human beings, countries around the world have started to develop relevant assessment standards. The most common green building assessment (GBA) systems worldwide include but are not limited to Leadership in Energy and Environmental Design (LEED), Building Research Establishment Environmental Assessment Method (BREEAM), Building Environmental Assessment Method (BEAM) Plus, Green Star, Green Building Index (GBI) and Green Mark. All these GBA systems provide a quantitative and comprehensive assessment of the sustainability level of building that is influenced by energy efficiency, water efficiency, environmental protection, indoor environment quality (IEQ) and life cycle assessment (LCA) [8]. Table 1 compares the various green building certifications.
It can be observed from Table 1 that most green building assessments have clear requirements on the thermal building envelope.

BCA Green Mark Scheme

The BCA’s Green Mark scheme, launched in 2005, is an internationally recognized green building rating system for tropical climates. Green Mark provides a meaningful differentiation and stratification of buildings, in terms of how green and sustainable they are, in the real estate market with a benchmarking scheme, which incorporates internationally recognized best practices in environmental design and performance [15]. It encompasses a range of assessment standards for different types of buildings, which covers new buildings, existing buildings, user-centric spaces (office interior, retail, supermarket) and beyond buildings (districts, parks and infrastructure).
Green Mark for Non-Residential Building (NRB 2015) was launched in 2016. The NRB 2015 includes significant amendments to the previous rating system. For example, Envelope Thermal Transfer Value (ETTV) had been tightened for all Non-Residential projects, with 45 W/m2 being set as the new baseline instead of the previous 50 W/m2.

2.3. Building Envelope Thermal Performance

The building envelope is composed of walls, roofs, windows, shading devices and thermal insulation materials, which greatly affects the indoor environment quality in terms of daylight, the energy consumption of HVAC systems and thermal comfort [16]. Existing studies [17,18,19,20] have proved that the building envelope has an extremely important influence on thermal performance and is one of the critical factors in obtaining green building certifications. Bressch and Janssens [17] applied a standardized regression coefficient (SRC) to identify the factors that had the greatest impact on thermal comfort on the south side of a typical Belgian office building. They observed that air tightness and heat gains were the two most important variables. Natephra et al. [19] proposed a method (integrating time-stamped 3D thermal data in the BIM) to collect environmental and thermal data and to integrate them with BIM to be used for various applications. Furthermore, Natephra et al. [20] presented the integration of BIM and visual scripting to automatically extract thermal properties from BIM to computing thermal transfer value.

Envelope Thermal Transfer Value (ETTV)

Since 1979, the Building Control Regulation of Singapore had stipulated that the overall thermal transfer value (OTTV) of air-conditioned buildings shall not be more than 45 W/m2 of the design value. In 2004, OTTV was replaced by the Envelope Thermal Transfer Value (ETTV) because the OTTV formula tended to underestimate the solar radiation gain component through the fenestration system and did not fully account for the full extent of heat gain through the building envelope [21].
The ETTV is a prerequisite or mandatory requirement for BCA Green Mark Non-Residential Building, which means that project stakeholders have to meet minimum requirements in order to qualify for Green Mark certification.
The ETTV is similar to OTTV in that it considers the three basic components of heat gain through the external walls and windows of a building [21]. These three components are:
  • Heat conduction through opaque walls;
  • Heat conduction through glass windows;
  • Solar radiation through glass windows.
The benchmarking of ETTV enforces the optimizing of the design of the building envelop to reduce external heat gain and hence reduce the cooling load for the air-conditioned building [22]. The ETTV concept was extended to cover residential buildings in 2008. As air conditioners in residential buildings are usually turned on in the night, the envelope thermal performance standard for residential buildings is given the name Residential Envelope Transmittance Value (RETV) to differentiate it from ETTV, which is meant for buildings that operate air conditioning systems during or throughout the day [21]. The ETTV formula is as follows:
ETTV = 12 (1 − WWR) Uw + 3.4(WWR)Uf + 211(WWR)(CF)(SC)
where ETTV: envelope thermal transfer value (W/m2); WWR: window to wall ratio (fenestration area/gross area of exterior wall); Uw: thermal transmittance of opaque wall (W/m2K); Uf: thermal transmittance of fenestration (W/m2K); CF: correction factor for solar heat gain through fenestration; SC: shading coefficients of fenestration.
Chua et al. [23] studied the diverse building parameters that affect the energy performance of commercial buildings in Singapore and found that there are two key indexes to measure building energy performance, namely, envelope thermal transfer value (ETTV) and the annual cooling energy requirements. The authors then performed a relative ranking of the ETTV functional parameters to evaluate their effectiveness in lowering the ETTV of a building. These parameters are the shading coefficient, window-to-wall ratio, the U-values of the wall and windows, and the absorptance of the opaque wall.
A case study to identify the relationship between Singapore’s Green Mark Scheme (GMS) and the Buildable Design and Appraisal System (BDAS)’s requirements for building envelopes was conducted by Singhaputtangkul et al. [24]. Singhaputtangkul et al. [24] discovered that the lengths of windows and walls and the associated materials influence the Green Mark (GM) score of the building envelope and the buildability score of the wall system. In addition, they further concluded that varying the window-to-wall (WWR) ratio has a stronger effect on the GM score, in terms of the building envelope in comparison with the buildability score of the wall system. To illustrate more detail, WWR shows a negative relationship with the GM score of the building envelope as when WWR increases from 0.151 to 0.510, the GM score of the building envelope decreases from 15 points to 0 points [24].

2.4. BIM for Green Building Assessment

Existing studies [8,25,26,27] have demonstrated that BIM supported the green building assessment. Lu et al. [8] summarized that BIM could support the green building assessment in three aspects. (1) BIM assists stakeholders in choosing effective strategies to achieve a green building, (2) BIM interprets the credits of GBAs, and (3) BIM facilitates documentation management. Ansah et al. [26] conducted an in-depth review of the bibliographic related to BIM for various Green Building Assessments, including LEED, BREEAM, BEAM Plus, Green Mark and GBI and highlighted that cloud-based BIM and GBAS will be the future direction. BIM could assist in automating the Green Mark process, and it was observed that 31 Green Mark items could be attained through BIM software and building performance analysis (BPA) tools [25]. Moakher et al. [27] provided an overview of how purpose-built BIM solutions and integrated analysis tools can help to assess building performance, prioritize investments and evaluate proposals to reduce operational costs, conserve energy, reduce water consumption and improve building air quality, helping to meet sustainability and energy-efficiency goals.

BIM for Envelope Thermal Performance

BIM is able to capture project information and generate documents and the advent of BIM technology, particularly anecdotal evidence of its widespread use in green building projects, has led professionals and researchers to envision the integration of the BIM and green building certification processes. In particular, the application of BIM in envelope thermal performance measurement has attracted attention, such as project Helios [28], Integrated Environmental Solutions Virtual Environment (IES VE) Green Mark Navigator [29], ETTV Assessment through BIM and VPL [22] and a BIM-based OTTV Calculation [20].
Project Helios aimed to develop an add-on application that utilizes the parameters captured within the digital building model created by Autodesk Revit [28]. Although the concept looked promising for ETTV calculation from Autodesk Revit, there seems to be little to no information available on this project after its inception in the year 2009. In addition, the project stakeholders must have a Revit license, which is an additional cost.
A BIM-based building performance analysis (BPA) software was developed by IES VE to calculate ETTV/RTTV by using a solar tracking technique to help the calculation of shading effect from structures with more complex geometry. IES VE aims to provide a step-by-step guide to assess performance elements of the Green Mark scoring system [29]. Envelope thermal performance simulation can be evaluated by importing the extracted information from BIM models with the defined data exchange schema, such as IFC and the gbXML schema [22]. However, Moon et al. [30] pointed out that there are varying levels of interoperability between existing BIM-based BPA software and BIM authoring software, and additional effort and modification to BIM model are ineluctable when transferring information from BIM to BIM-based BPA software. Furthermore, Chen et al. [31] summarized the interoperability issue from BIM to mainstream BPA software into the following six categories: building geometry, space composition, building construction, internal loads, operation schedules and HVAC systems.
Recently, researchers from Universiti Teknologi Malaysia developed a BIM-VPL based tool for building envelope design and assessment support. The research demonstrated the importance and potential of BIM and VPL integration for ETTV assessment, and how it is an important step to automate ETTV calculation [22]. However, the study required additional data extraction and management and had limitations. For instance, curtain walls or tilt walls could not be handled, and the effective shading coefficient of external shading devices (SC2) were not taken into consideration. Furthermore, the author suggested developing a plug-in or application programming interface (API) for Revit to measure thermal envelope performance.
Recently, Natephra et al. [20] presented a BIM approach integrating with scripting to automatically extract thermal parameters from a database and provide an instant OTTV calculation.

3. Research Gaps

According to Inhabit Group [32], “ETTV compliance presents design challenges for architects, builders and suppliers in Singapore’s building and construction market. Recently introduced benchmarks mean that ETTV has to be considered more closely when undertaking any design decisions that influence the façade outcome”.
It is well known that generating an envelope thermal performance calculation report is a cumbersome and time-consuming process for project stakeholders. The current manual calculation method is time-consuming, and human error can occur throughout the completion of the calculation process [20]. In addition, the current envelope thermal calculation method does not consider some of the contributions by non-conventional shading devices, shading of opaque construction, and shading from surrounding buildings [29]. There is an information delay if the architect initiates a change, such as changing the glazing size and U values. Figure 1 illustrates the current process to calculate the ETTV.

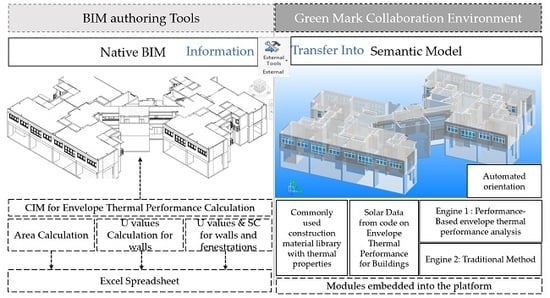
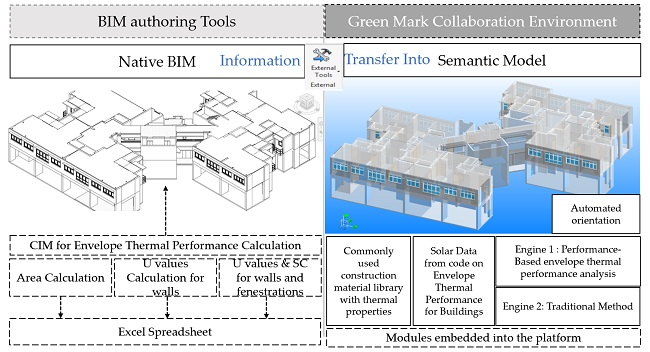
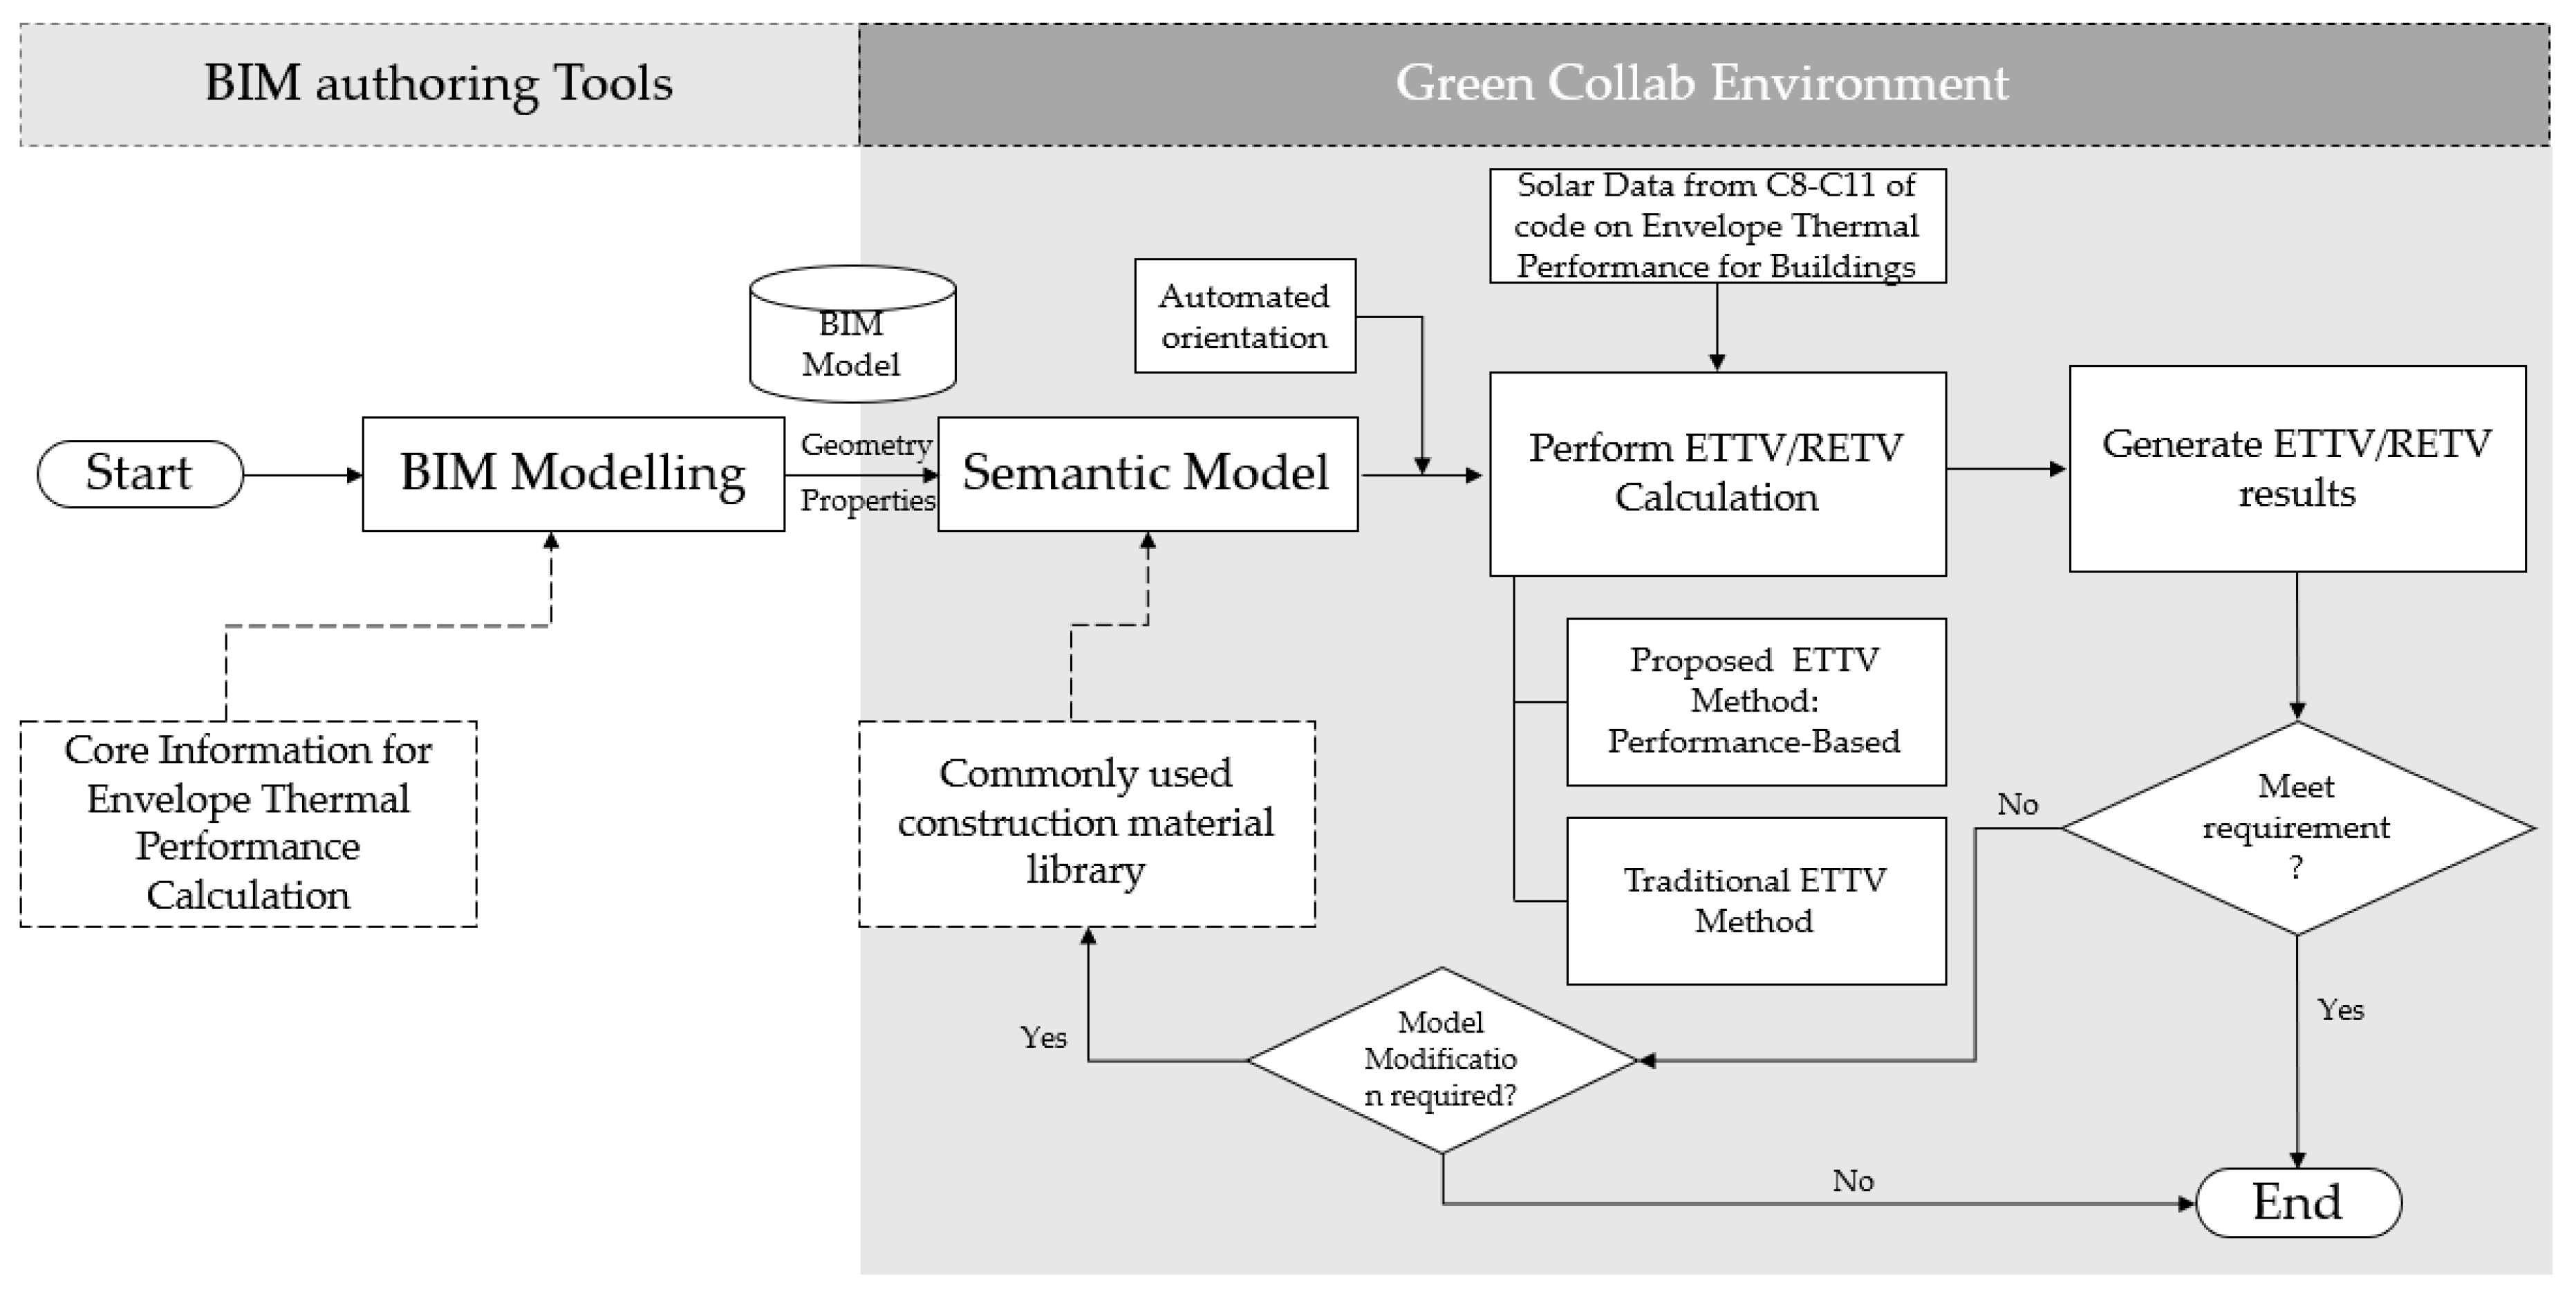
4. Proposed Green Mark Collaboration Environment

The proposed methodology comprises several main steps, as shown in Figure 2. The proposed method starts by creating a design model in BIM authoring tools. In order to streamline the process in computing the ETTV/RETV, the design BIM model in native format follows certain detailed modeling rules, which are provided in Section 4.1. The geometric and semantic information in the design BIM model is then extracted and converted into energy models (in IFC 2 × 3 format) using a customized program embedded in BIM software. As most of the designers are not able to assign the thermal properties to a BIM model during the early design stage, a common construction material library with all the necessary thermal properties of building materials is provided to enable designers to specify the material property for ETTV/RETV calculation at the early stage. Next, a conventional method is leveraged and integrated with the semantic model to facilitate ETTV/RETV calculation. In addition, a performance-based ETTV/RETV calculation method is also proposed in Section 4.3. The fourth step is to compute ETTV/RETV. The fifth step is to evaluate the ETTV/RETV result. If the results fail to comply, then the Green Mark Collaboration Environment provides functions to change the new material with better thermal properties. It is worth mentioning that the solar data are taken from Table C8–C11 from code on Envelope Thermal Performance for Buildings [33]. The solar data from Table C8–C11 has been built into the proposed platform to facilitate the building envelope thermal performance computation.

4.1. Modeling Requirements and Core Information for ETTV/RETV Computation

Most parameters needed for the envelope thermal performance analysis can be obtained in the BIM model. The modeling requirements for thermal envelope performance calculation in the BIM model are listed in Table 2.
If the core information in the information table above is not completed in the original BIM model, the missing information can be patched to the semantic model.

4.2. Features of Green Mark Collaboration Environment

4.2.1. Auto Building Orientation

Project Orientation from the BIM Authoring Tool will automatically be captured when the model is imported to the Green Mark Collaboration Environment. However, the orientation amendment can be easily done in the Green Mark Collaboration Environment, and everything will be followed accordingly, including the calculated results.

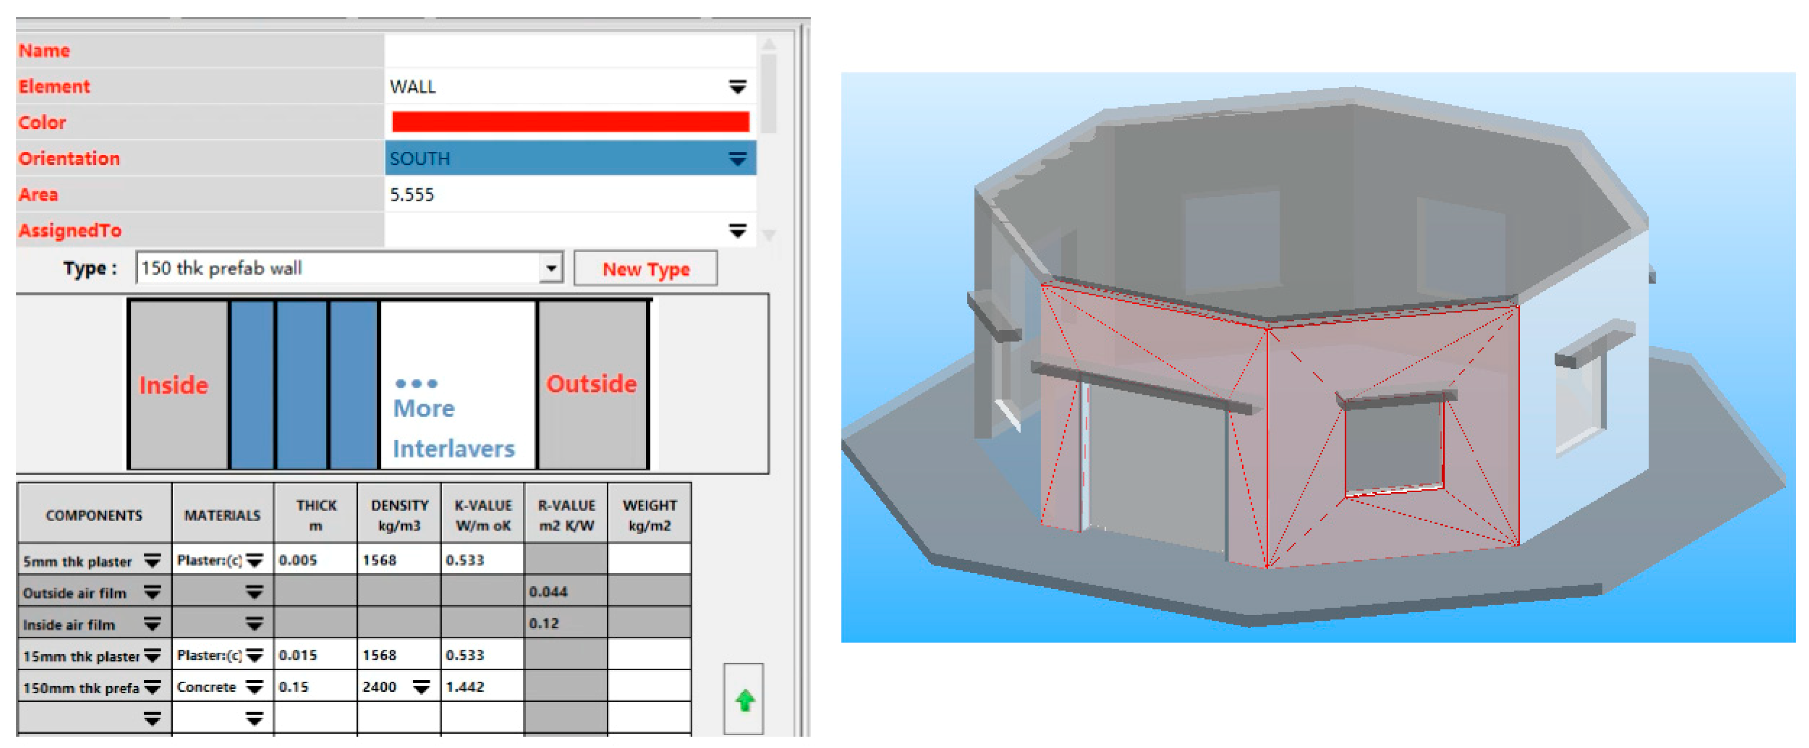
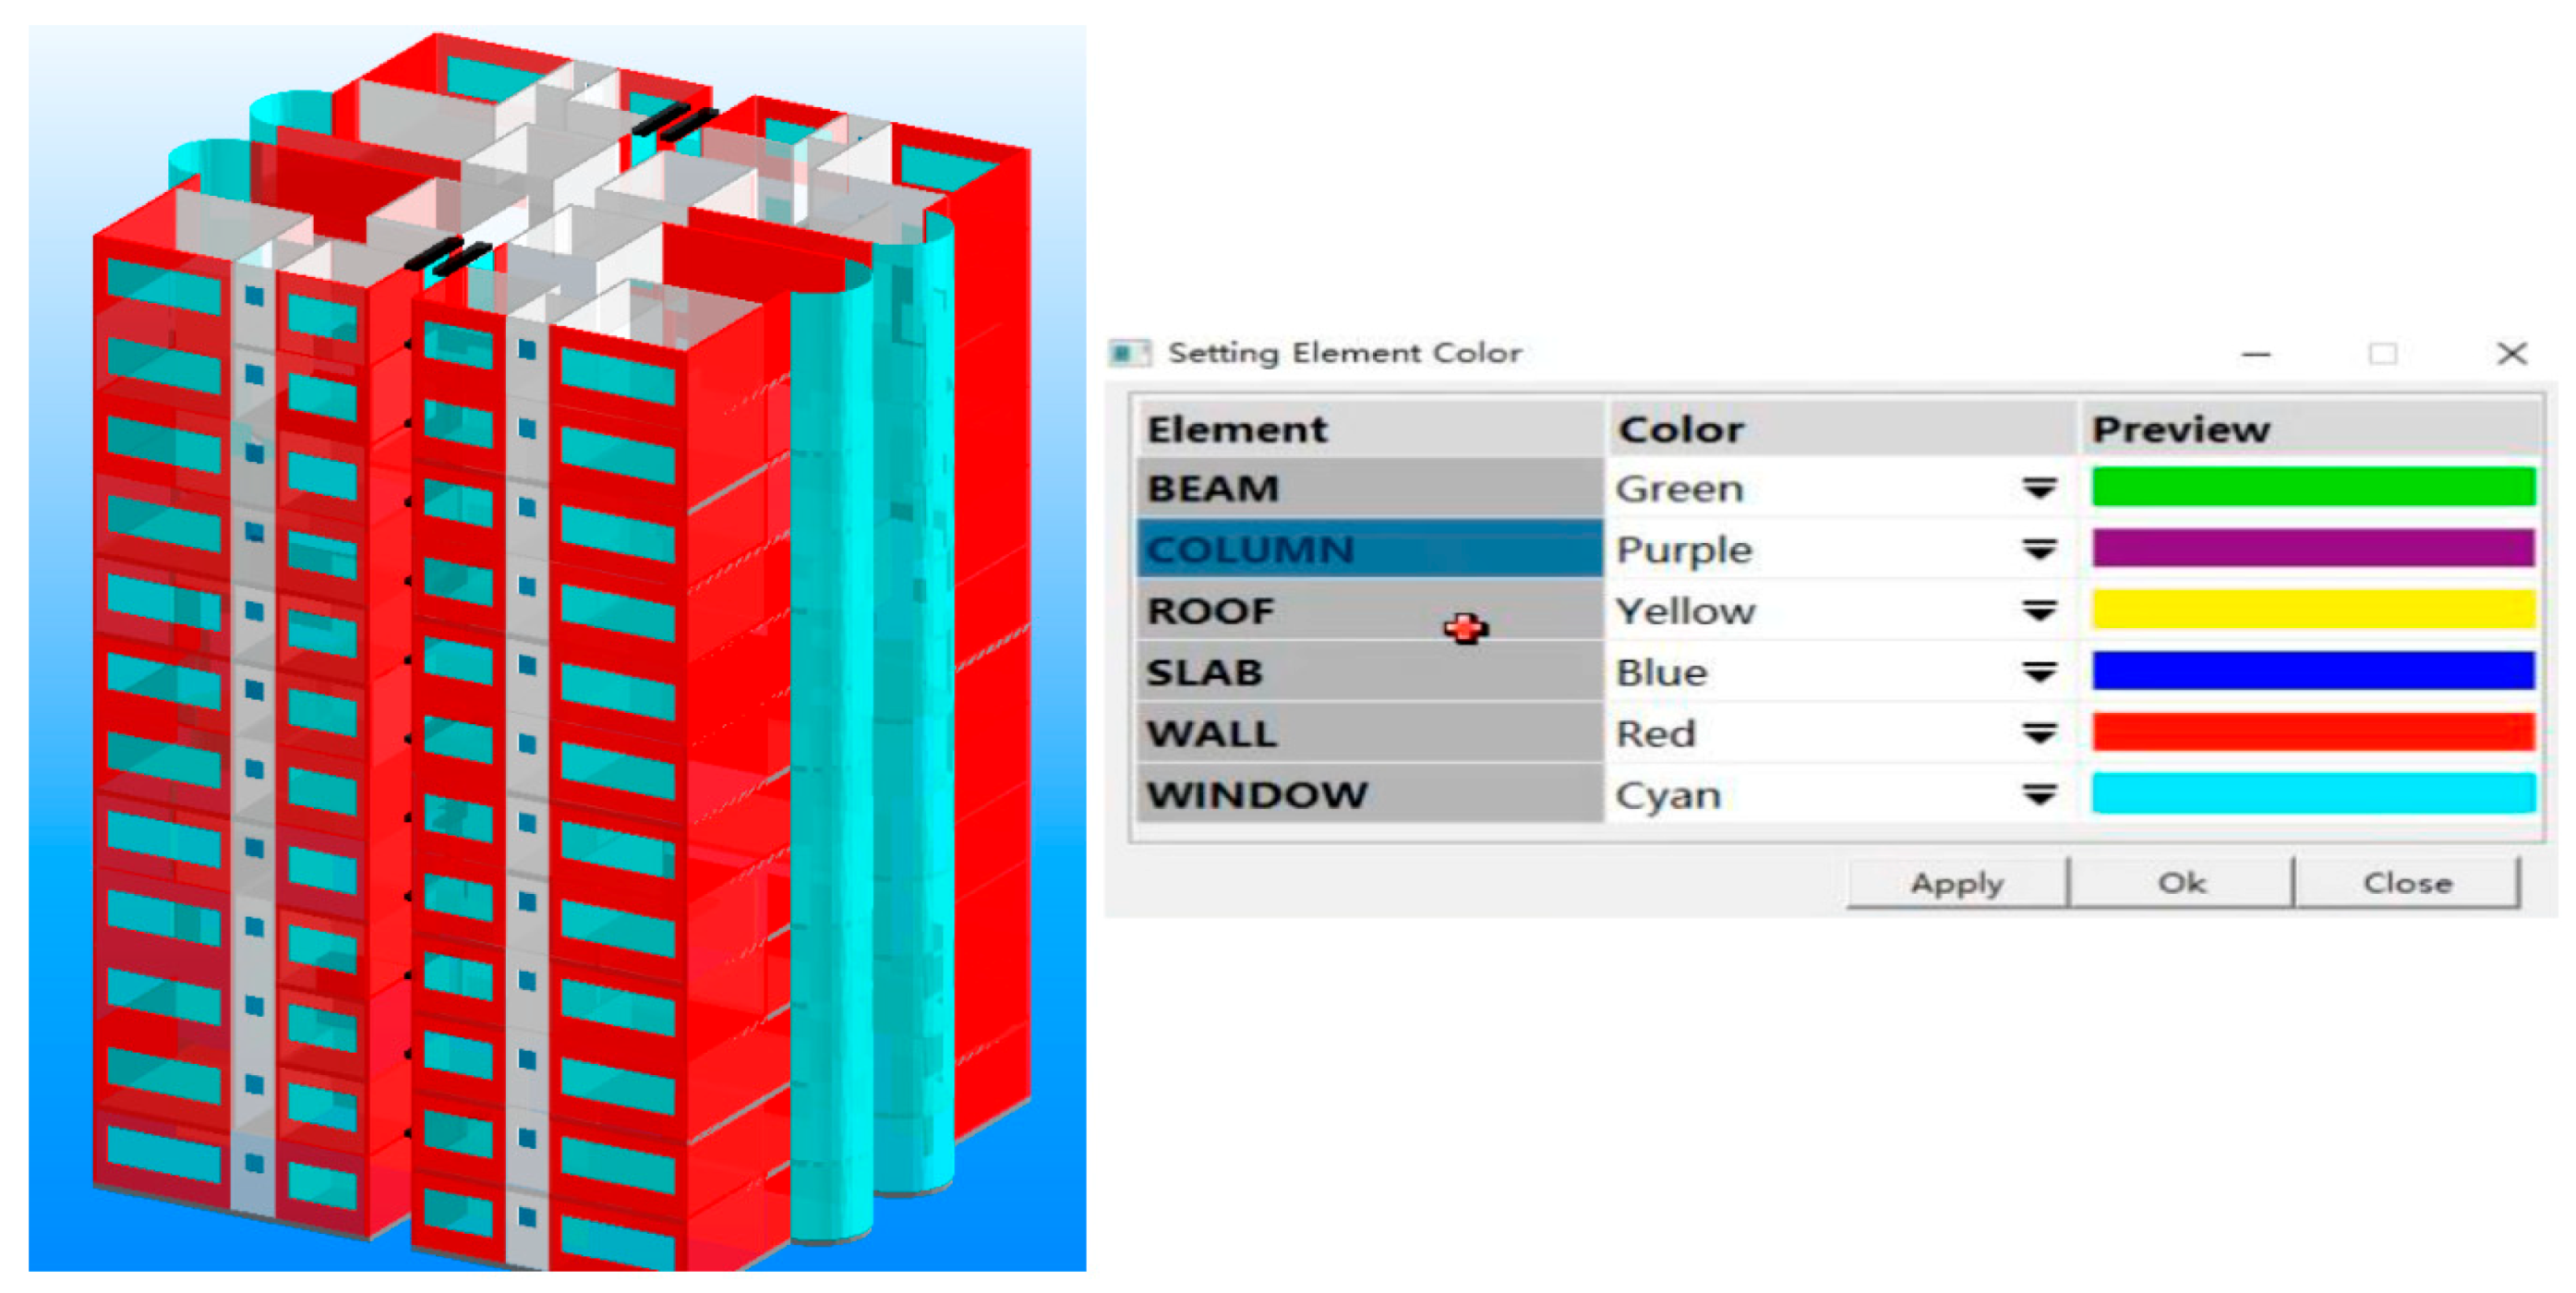
4.2.2. Multi-Element Selection

The Green Mark Collaboration Environment is capable of selecting model elements with the same properties and applying the green data to it. Figure 3 shows the selecting and assigning parameters for the elements with the same properties. This would largely reduce the time and procedures of preparing the model for calculation.

4.2.3. Model Element-Equation Mapping

Model elements, such as windows, walls, beams, columns and others necessary for thermal performance calculation, can be mapped to the Green Mark Collaboration Environment. Manufacturer’s data, such as glassing information in Microsoft format or PDF, can also append to the element type. Stakeholders can retrieve the data of the elements whenever verification is needed. As shown in Figure 4, elements with the same thermal properties will have their own assigned color code as per the Green Mark Submission Requirement once it has been mapped with the green building data.

4.2.4. Report Generation

The Proposed Green Mark Collaboration Environment has a built-in report template. The template will capture all calculated data while restoring its linkage to the building model elements. This will help in assessing the Green Mark information of the project. Any changes made in the model will be automatically reflected in the reports.

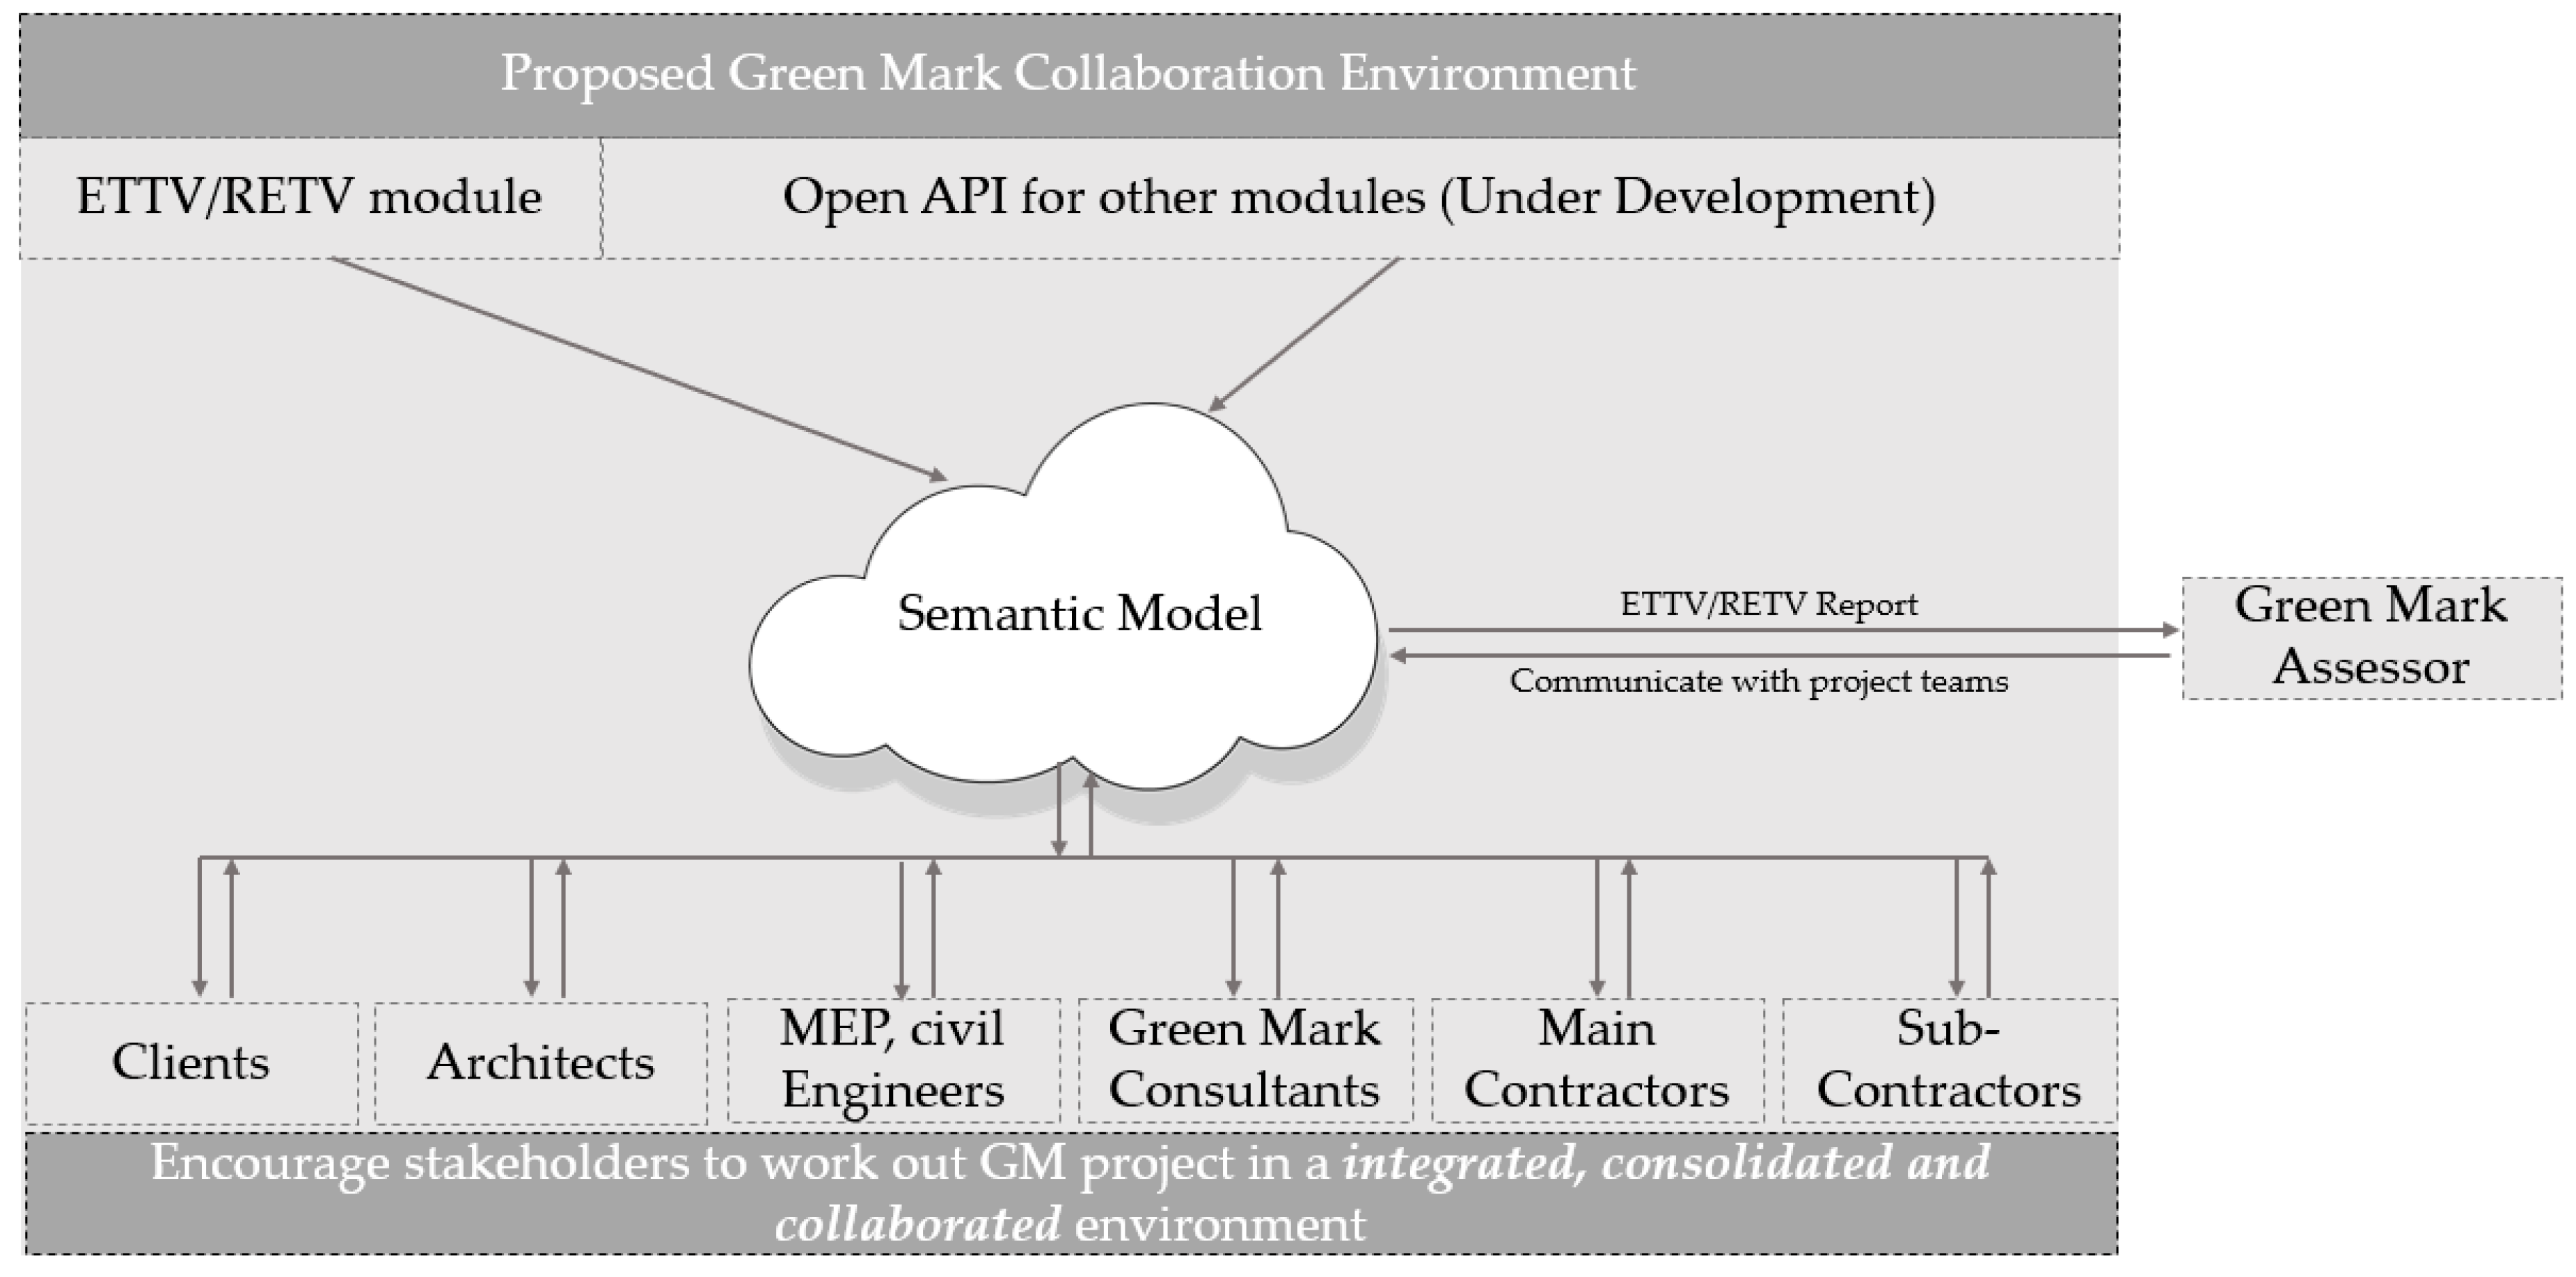
4.2.5. Green Mark Collaborative Working Environment

The Green Mark Collaborative environment is to bridge the gaps caused by isolated and fragmented Green Mark data generated by different stakeholders. It comprises several modules and each module focused on a particular requirement specified in Green Mark for Non-Residential Buildings (NRB) 2015. The ETTV/RETV is the first module embedded into the proposed Green Mark Collaboration Environment. Future research will look into other modules in the Green Mark assessment, such as Concrete Usage Index (CUI), Lighting efficiency and Computational Fluid Dynamic (CFD).
The proposed Green Mark Collaboration Environment was capable of efficiently managing the semantic model(s) and hosting the Green Mark project data and documentation generated, updated and consolidated along with the GM project delivery. Semantic model-based communication and collaboration allows architects, Green Mark Consultants, contractors and other parties, or even Green Mark Assessors, to view reports of real-time information. Its emphasis is on streamlining the automated GM documentation generation, managing GM submission, monitoring the GM score and tracking the GM project status. Figure 5 illustrates the framework of the collaborative working environment.
To sum up, the collaborative working environment provides various benefits for stakeholders: (1) The collaborative working environment allows remote real-time access and concurrent ETTV analyzing; and (2) integrated GM data acquisition, processing, and management along the project lifecycle with enhanced collaboration among all the stakeholders.

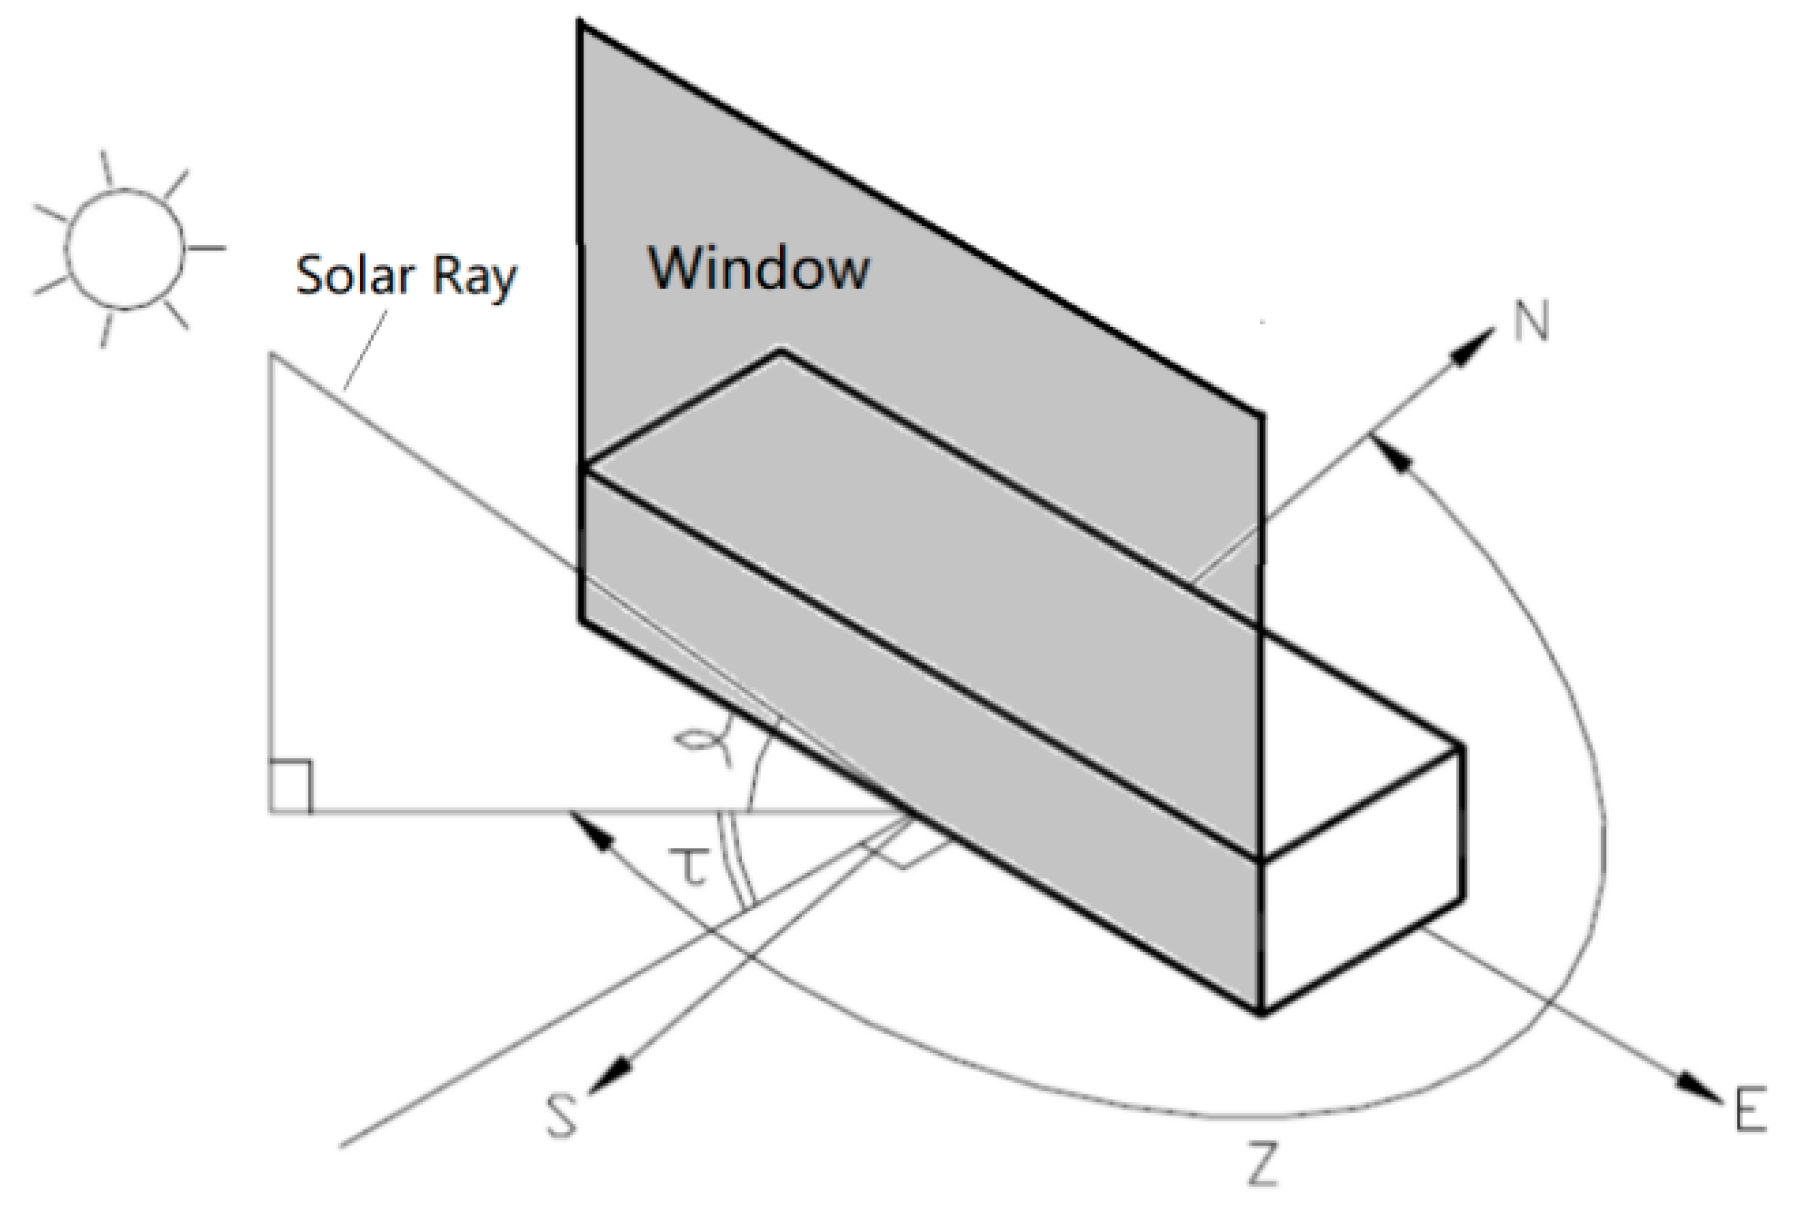
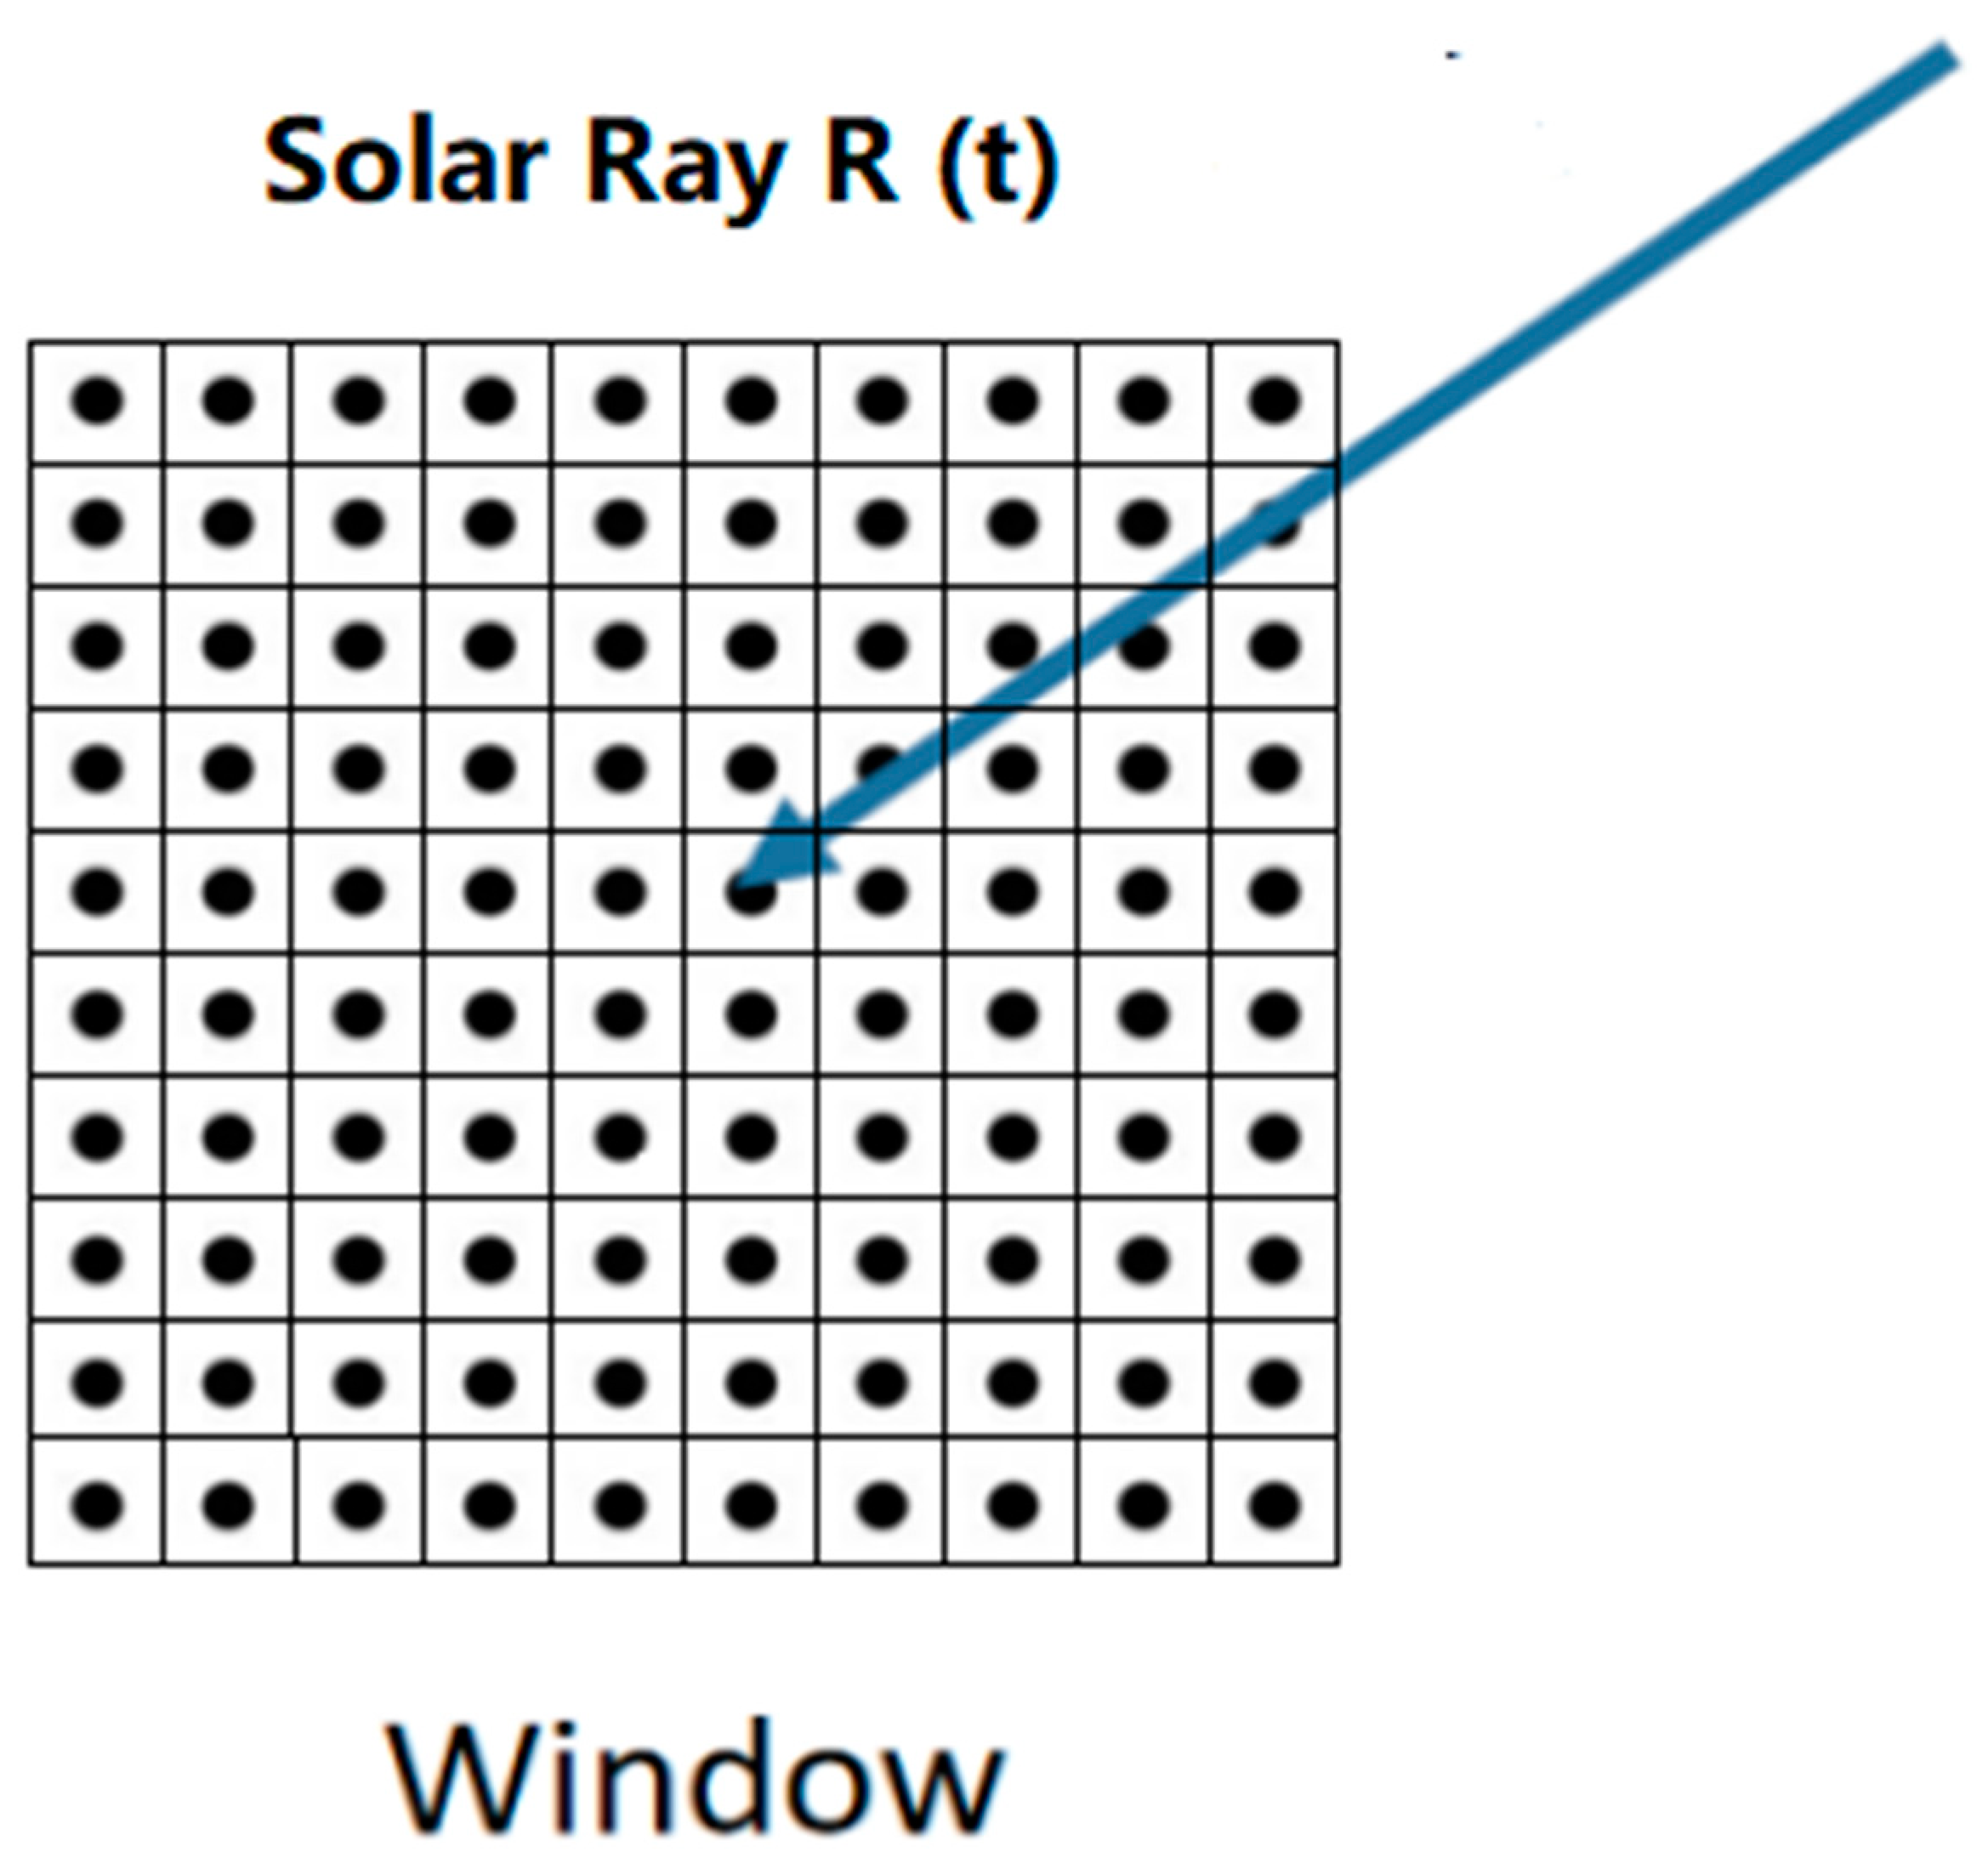
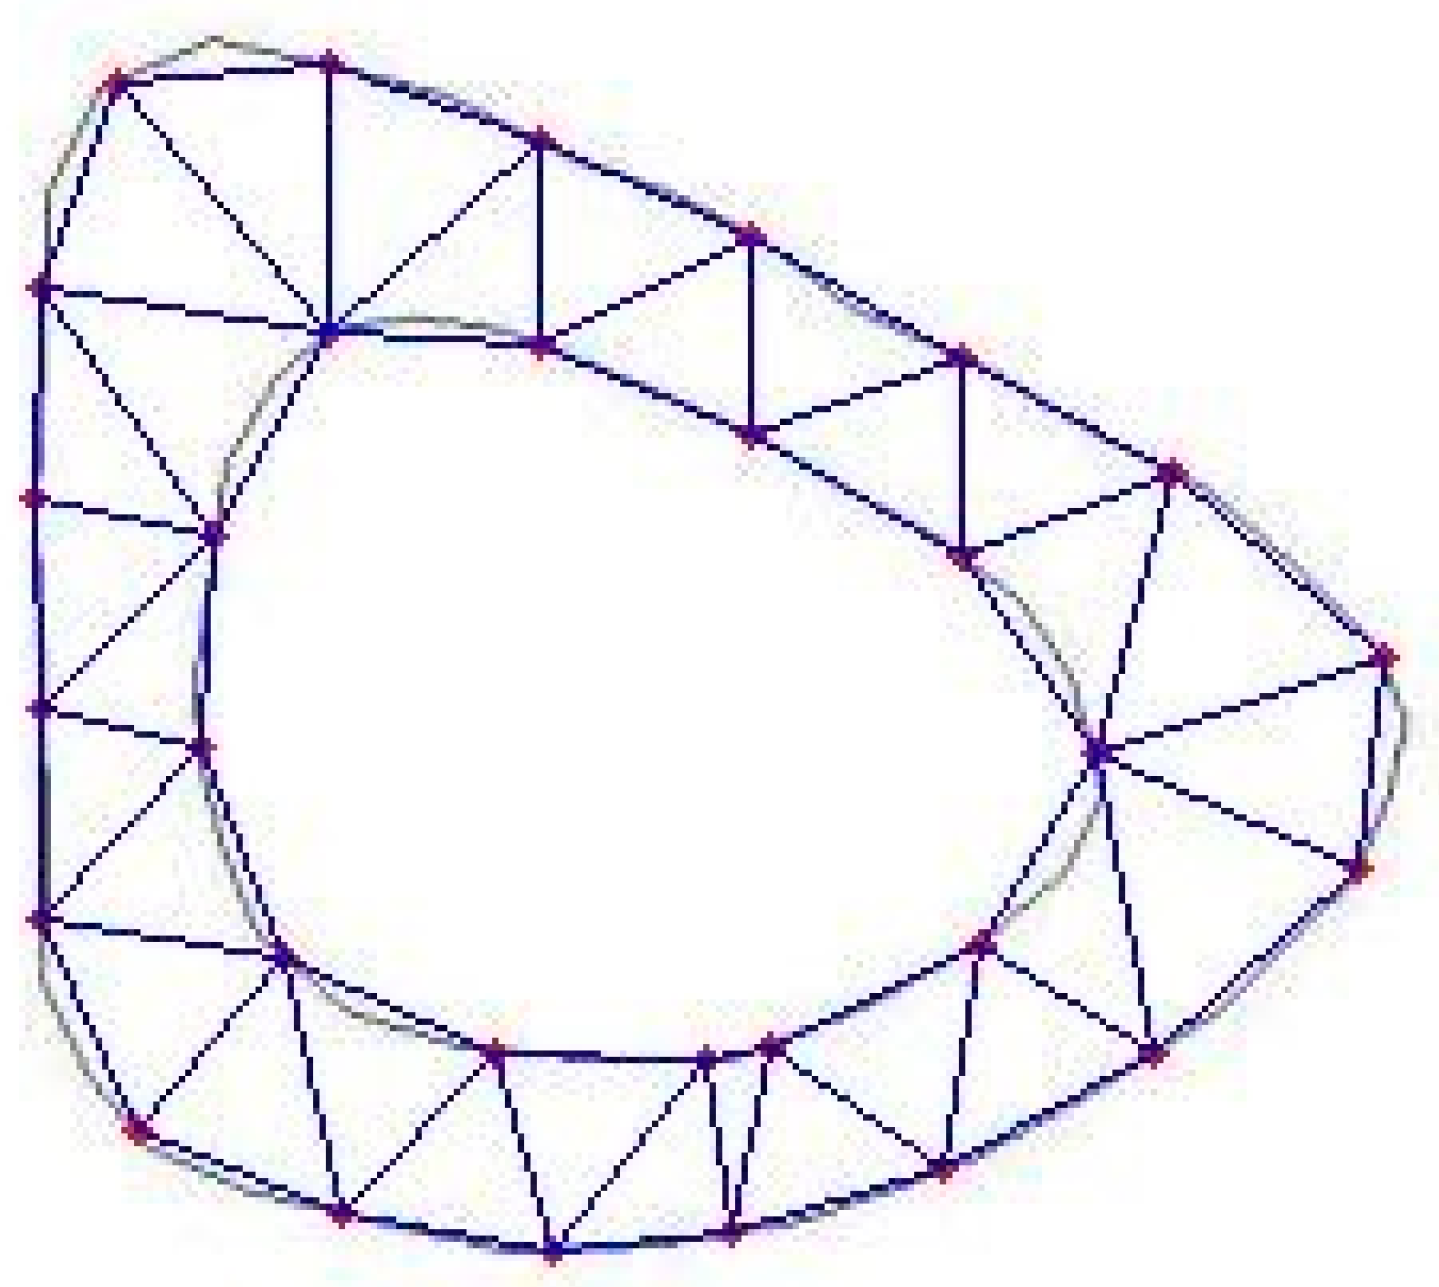
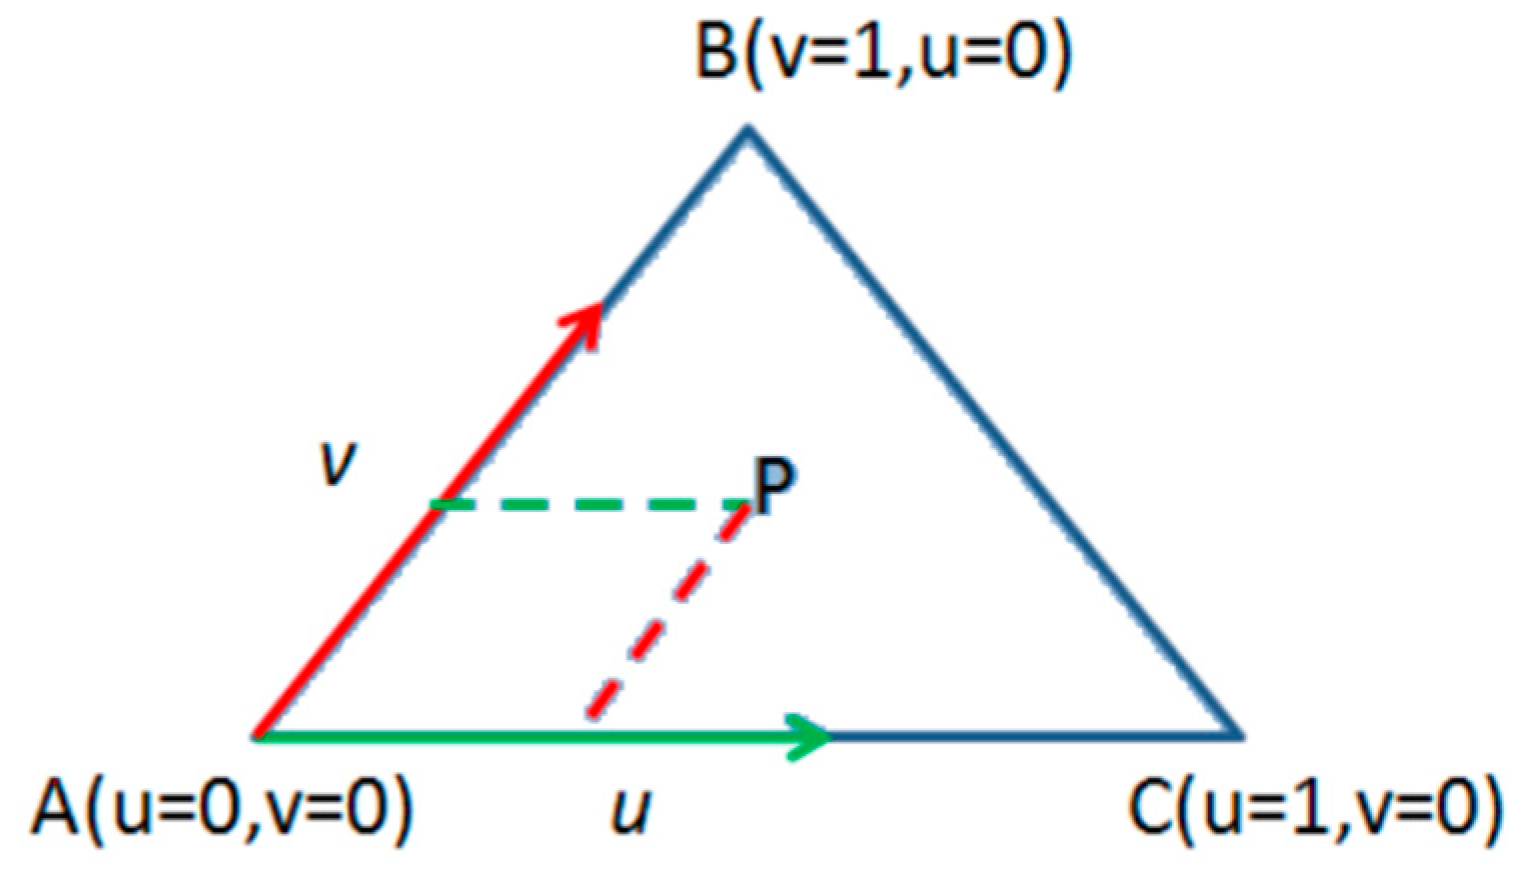
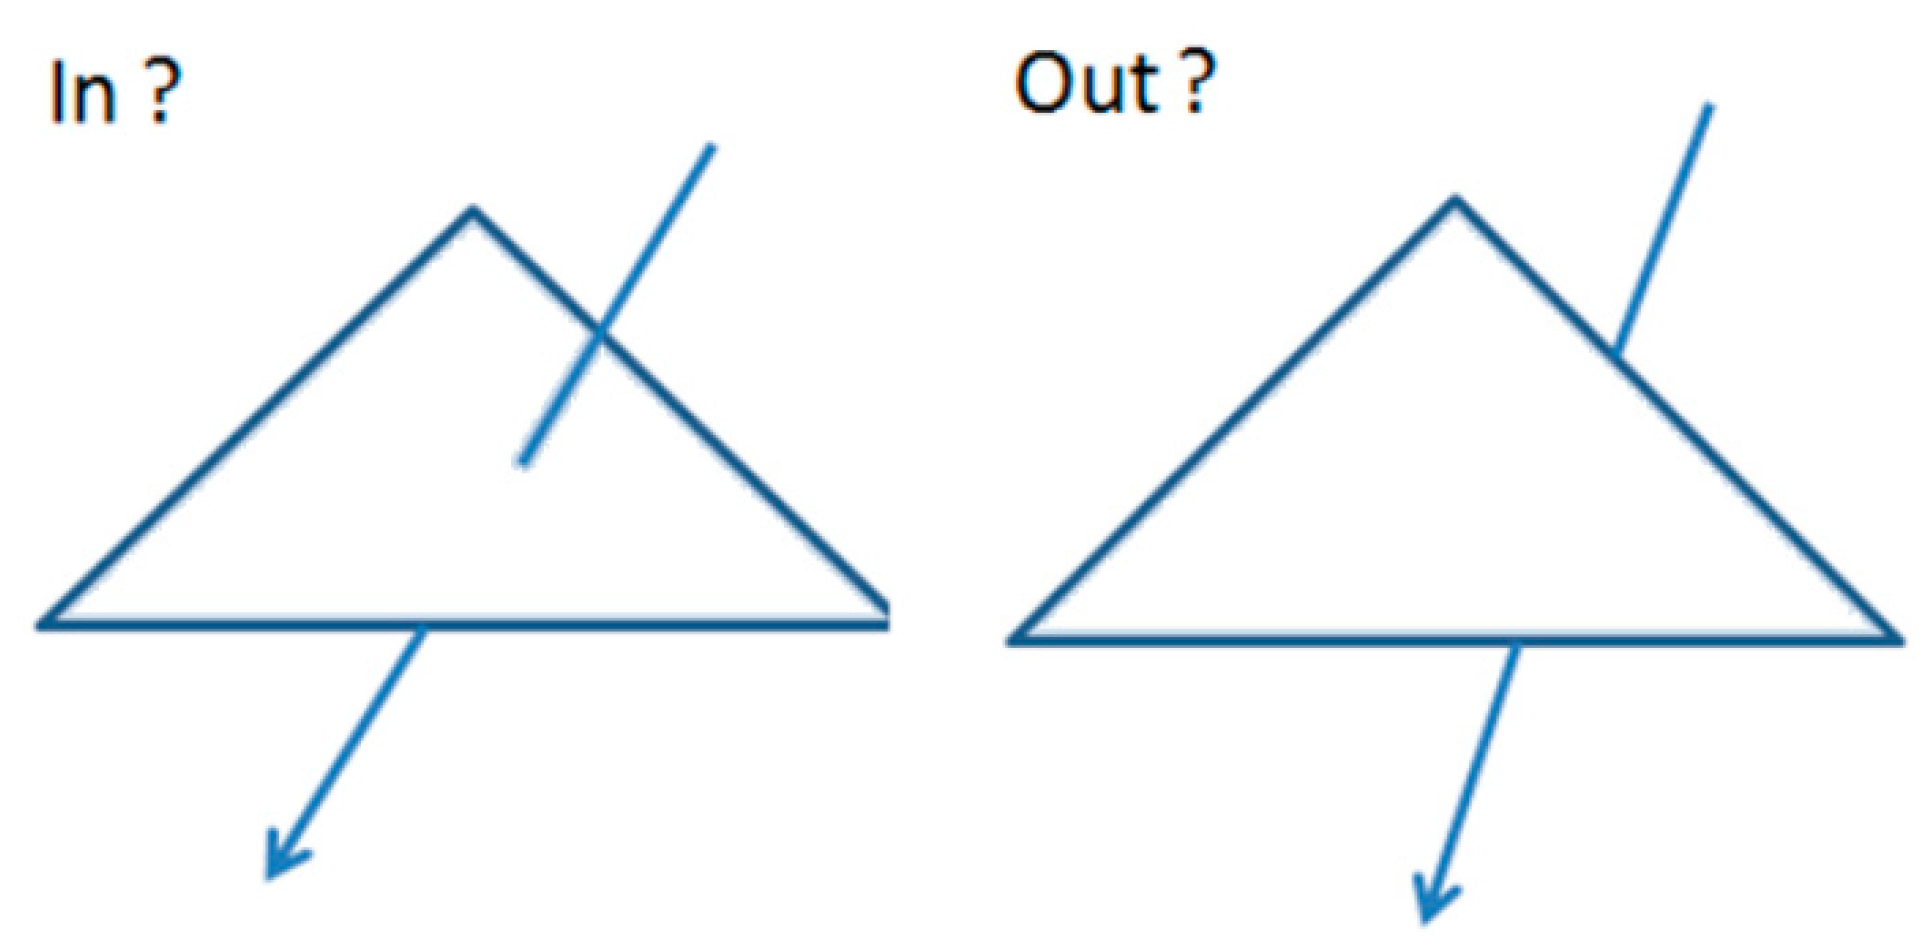
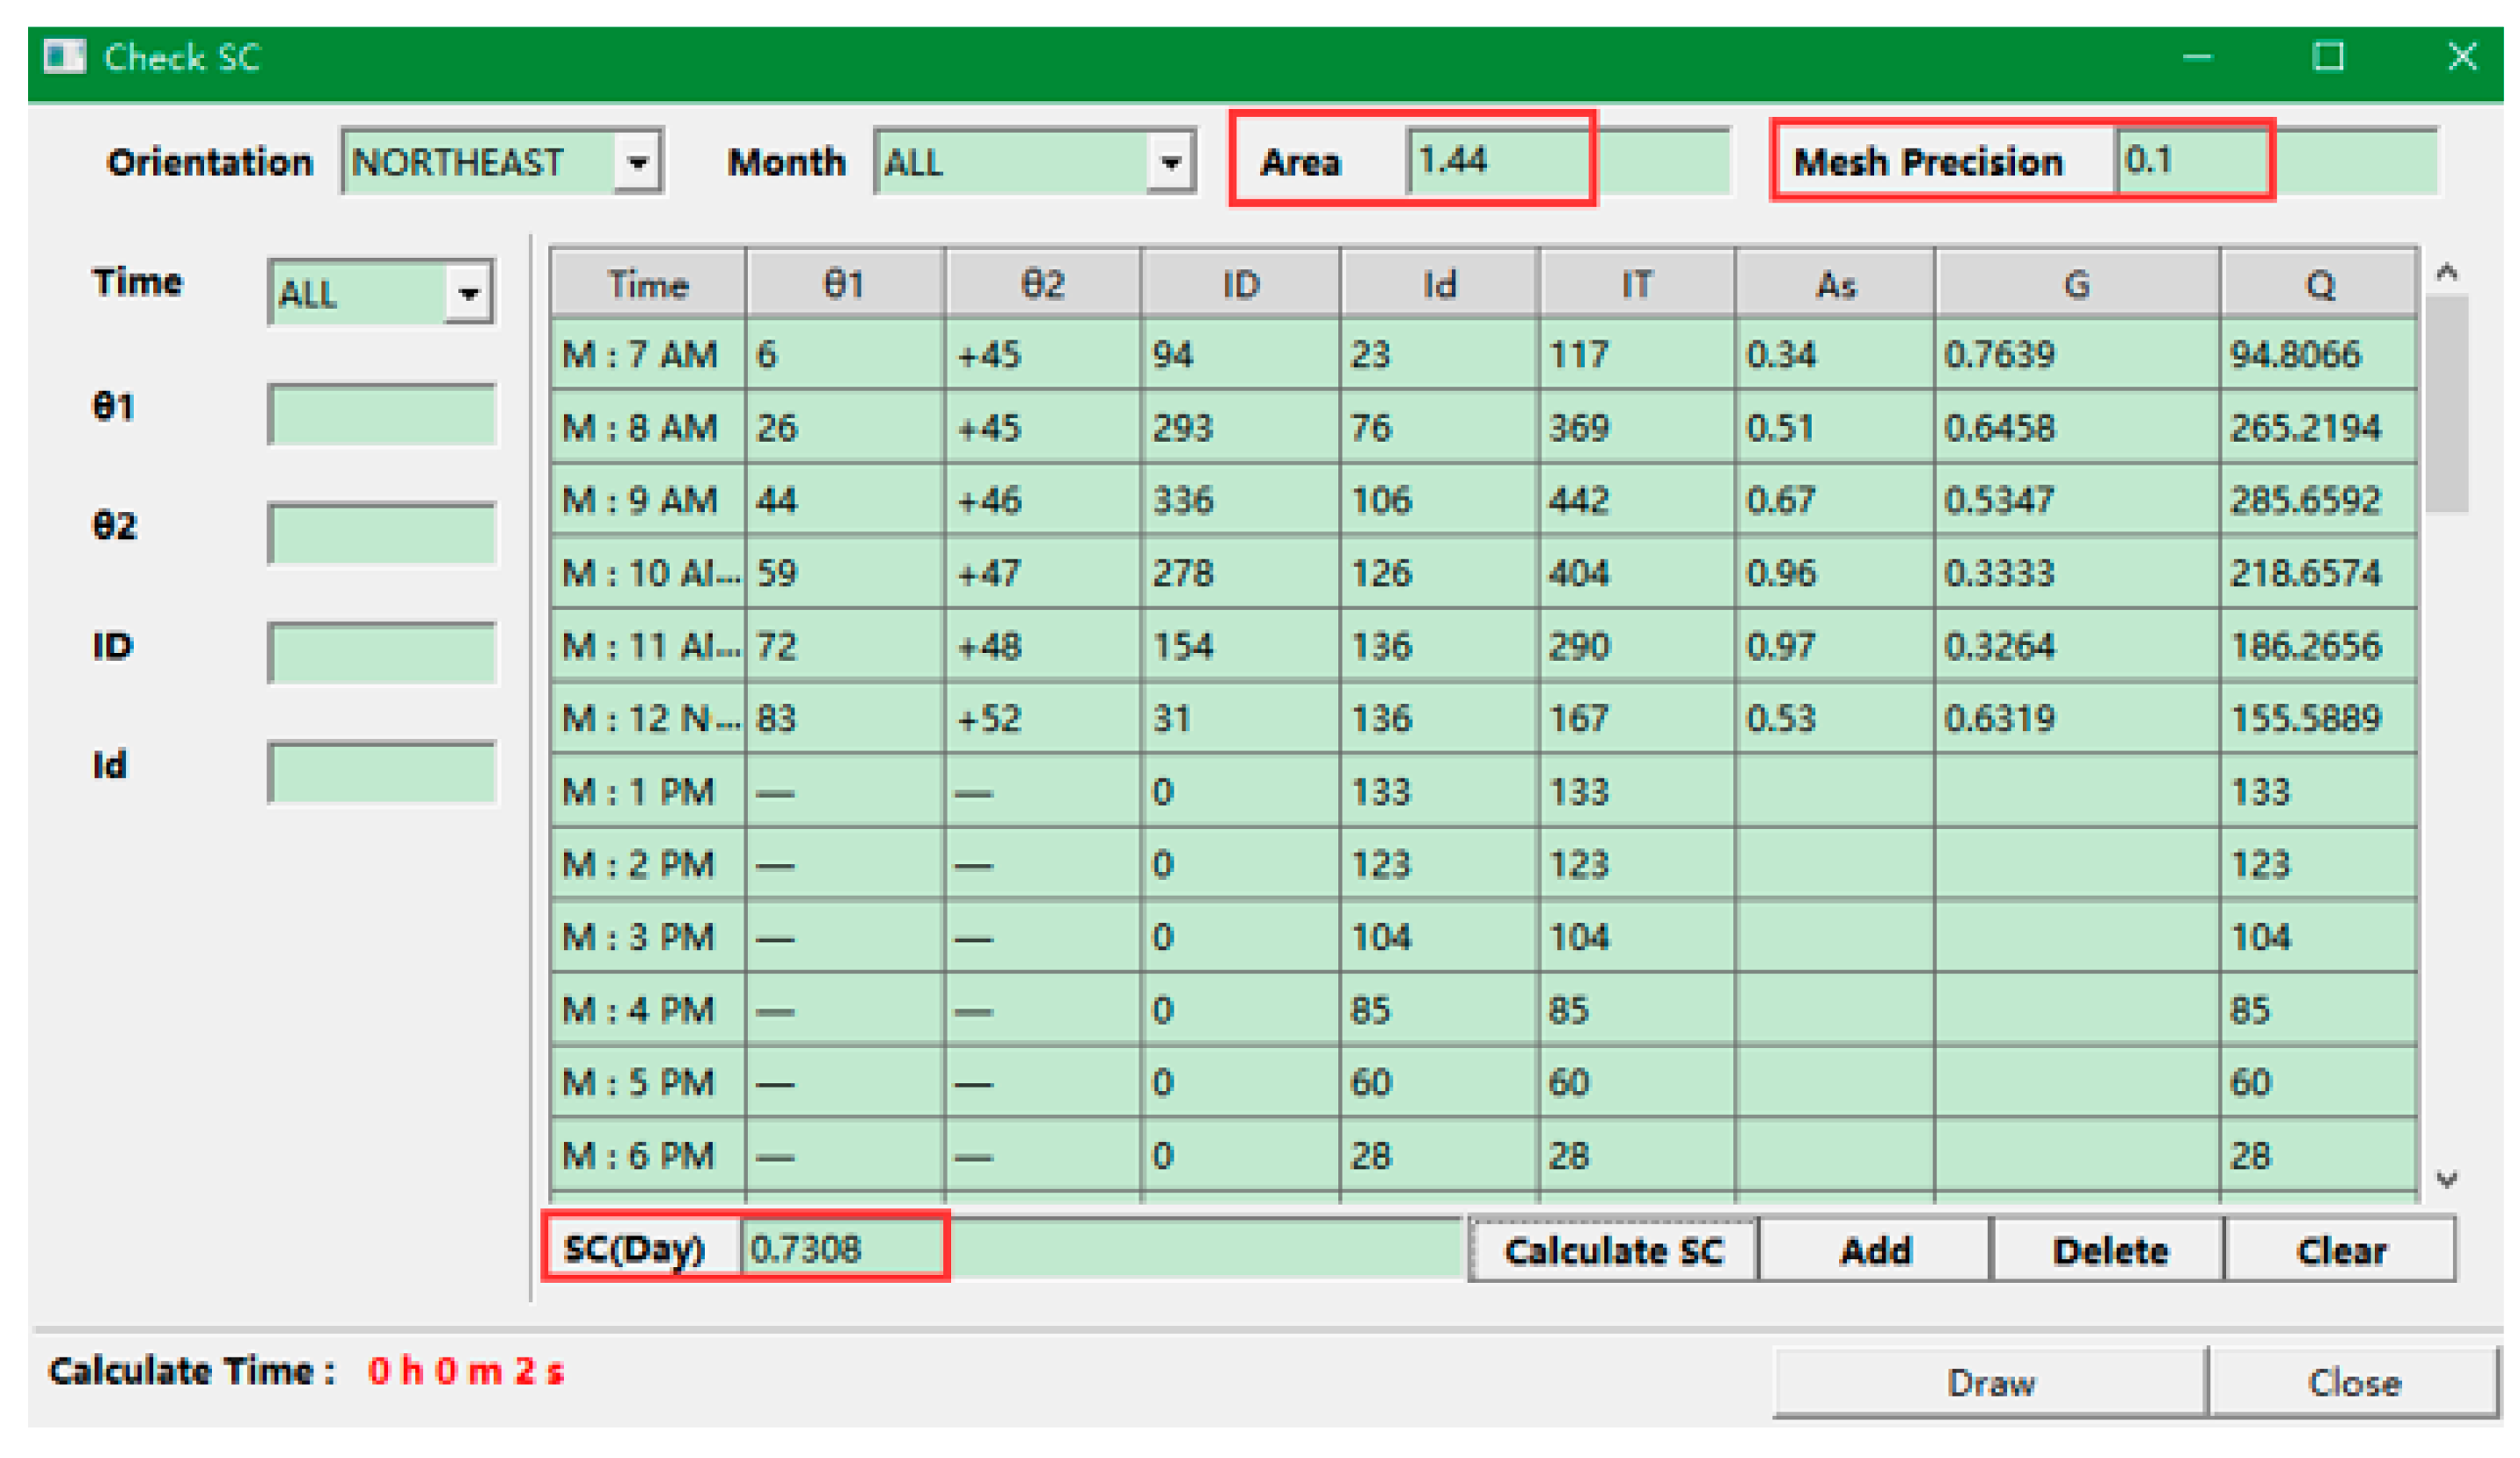
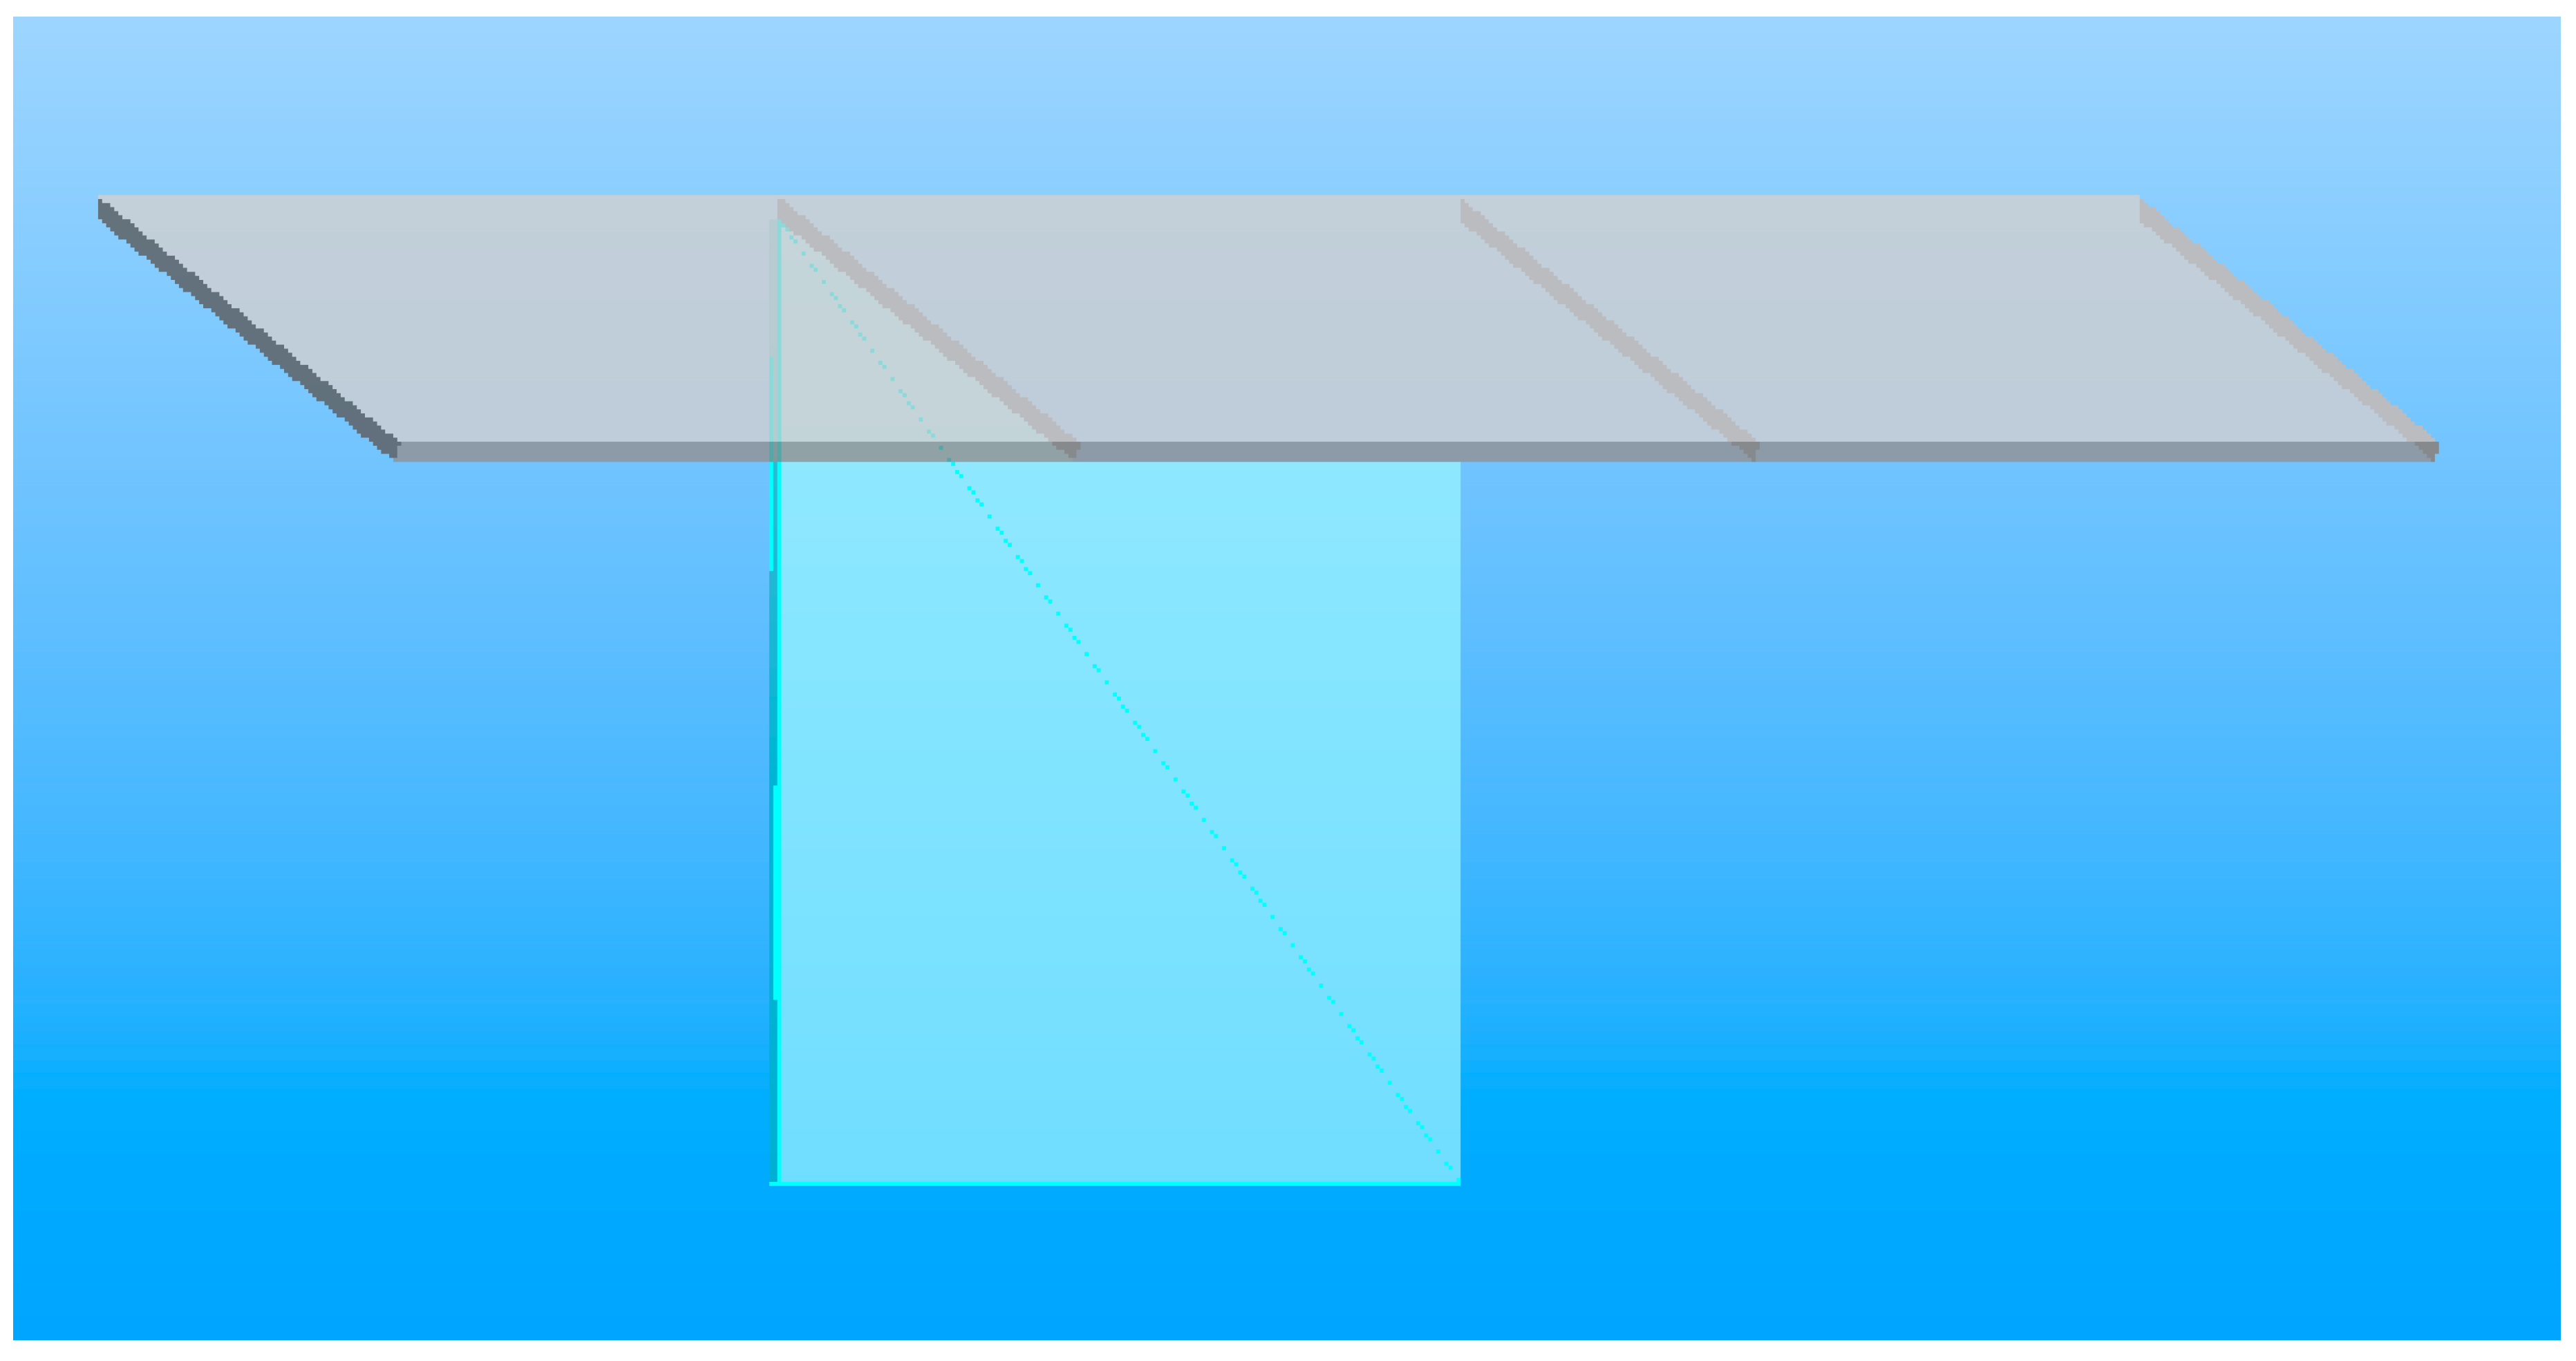
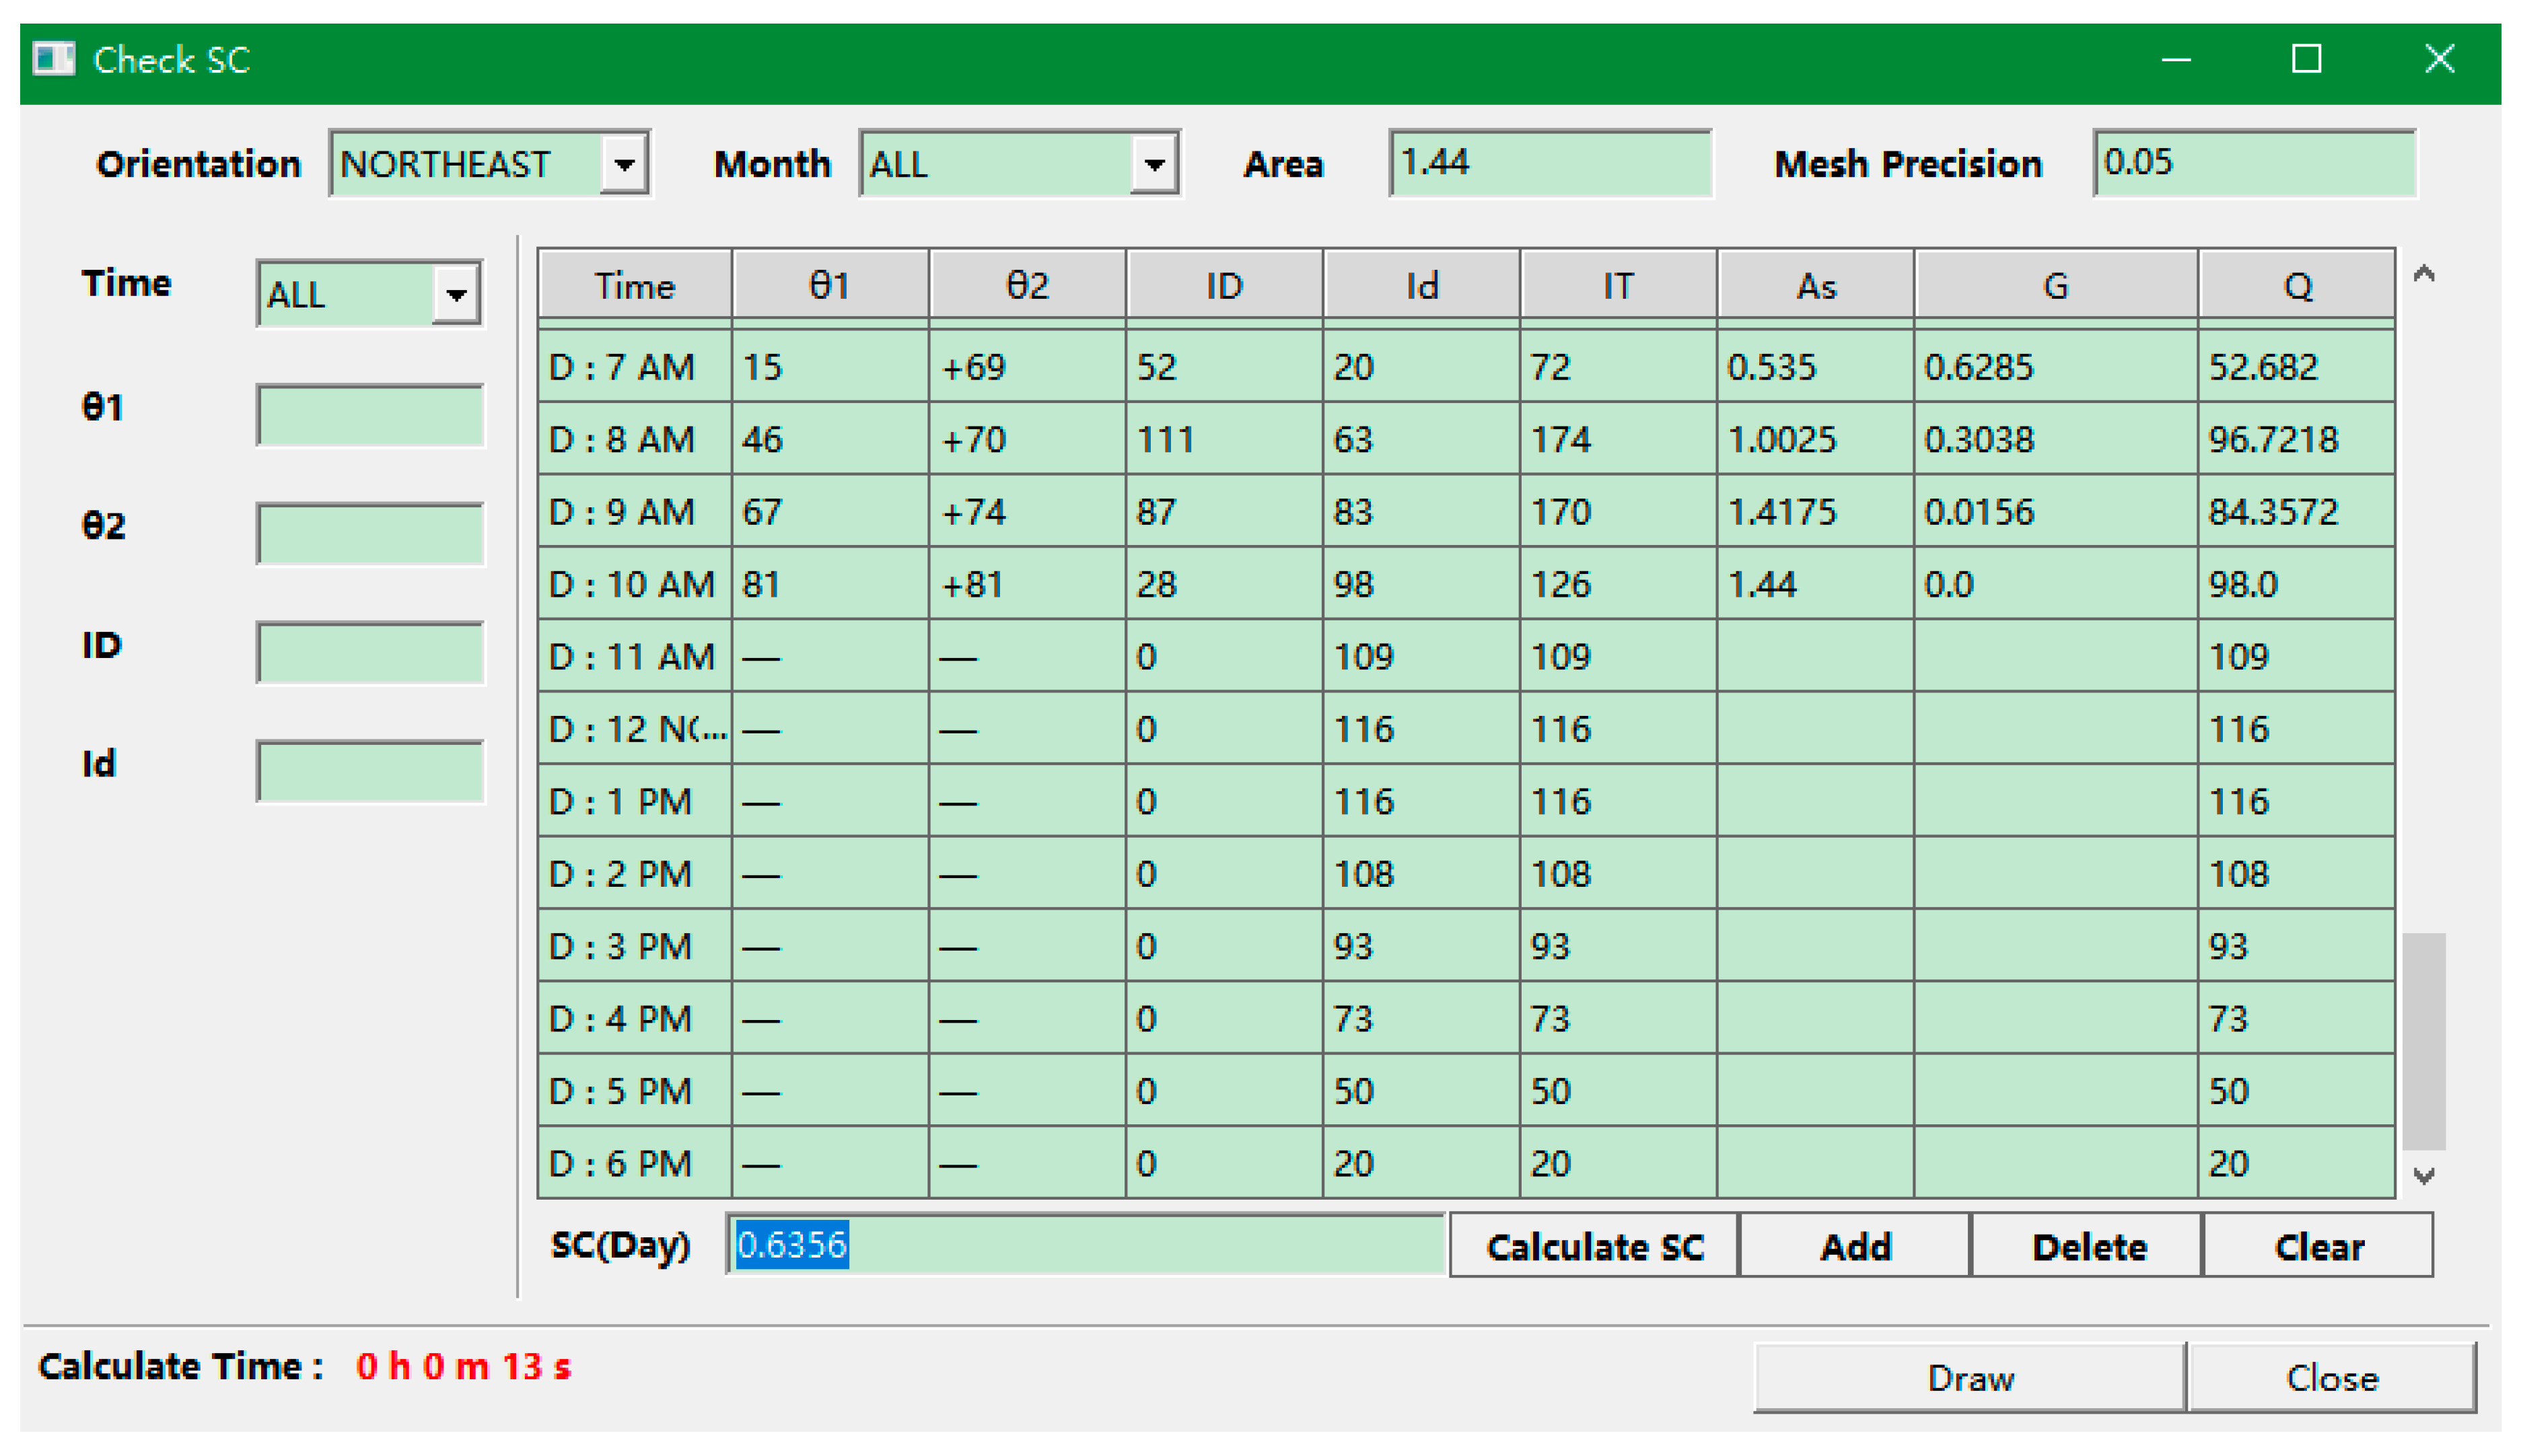
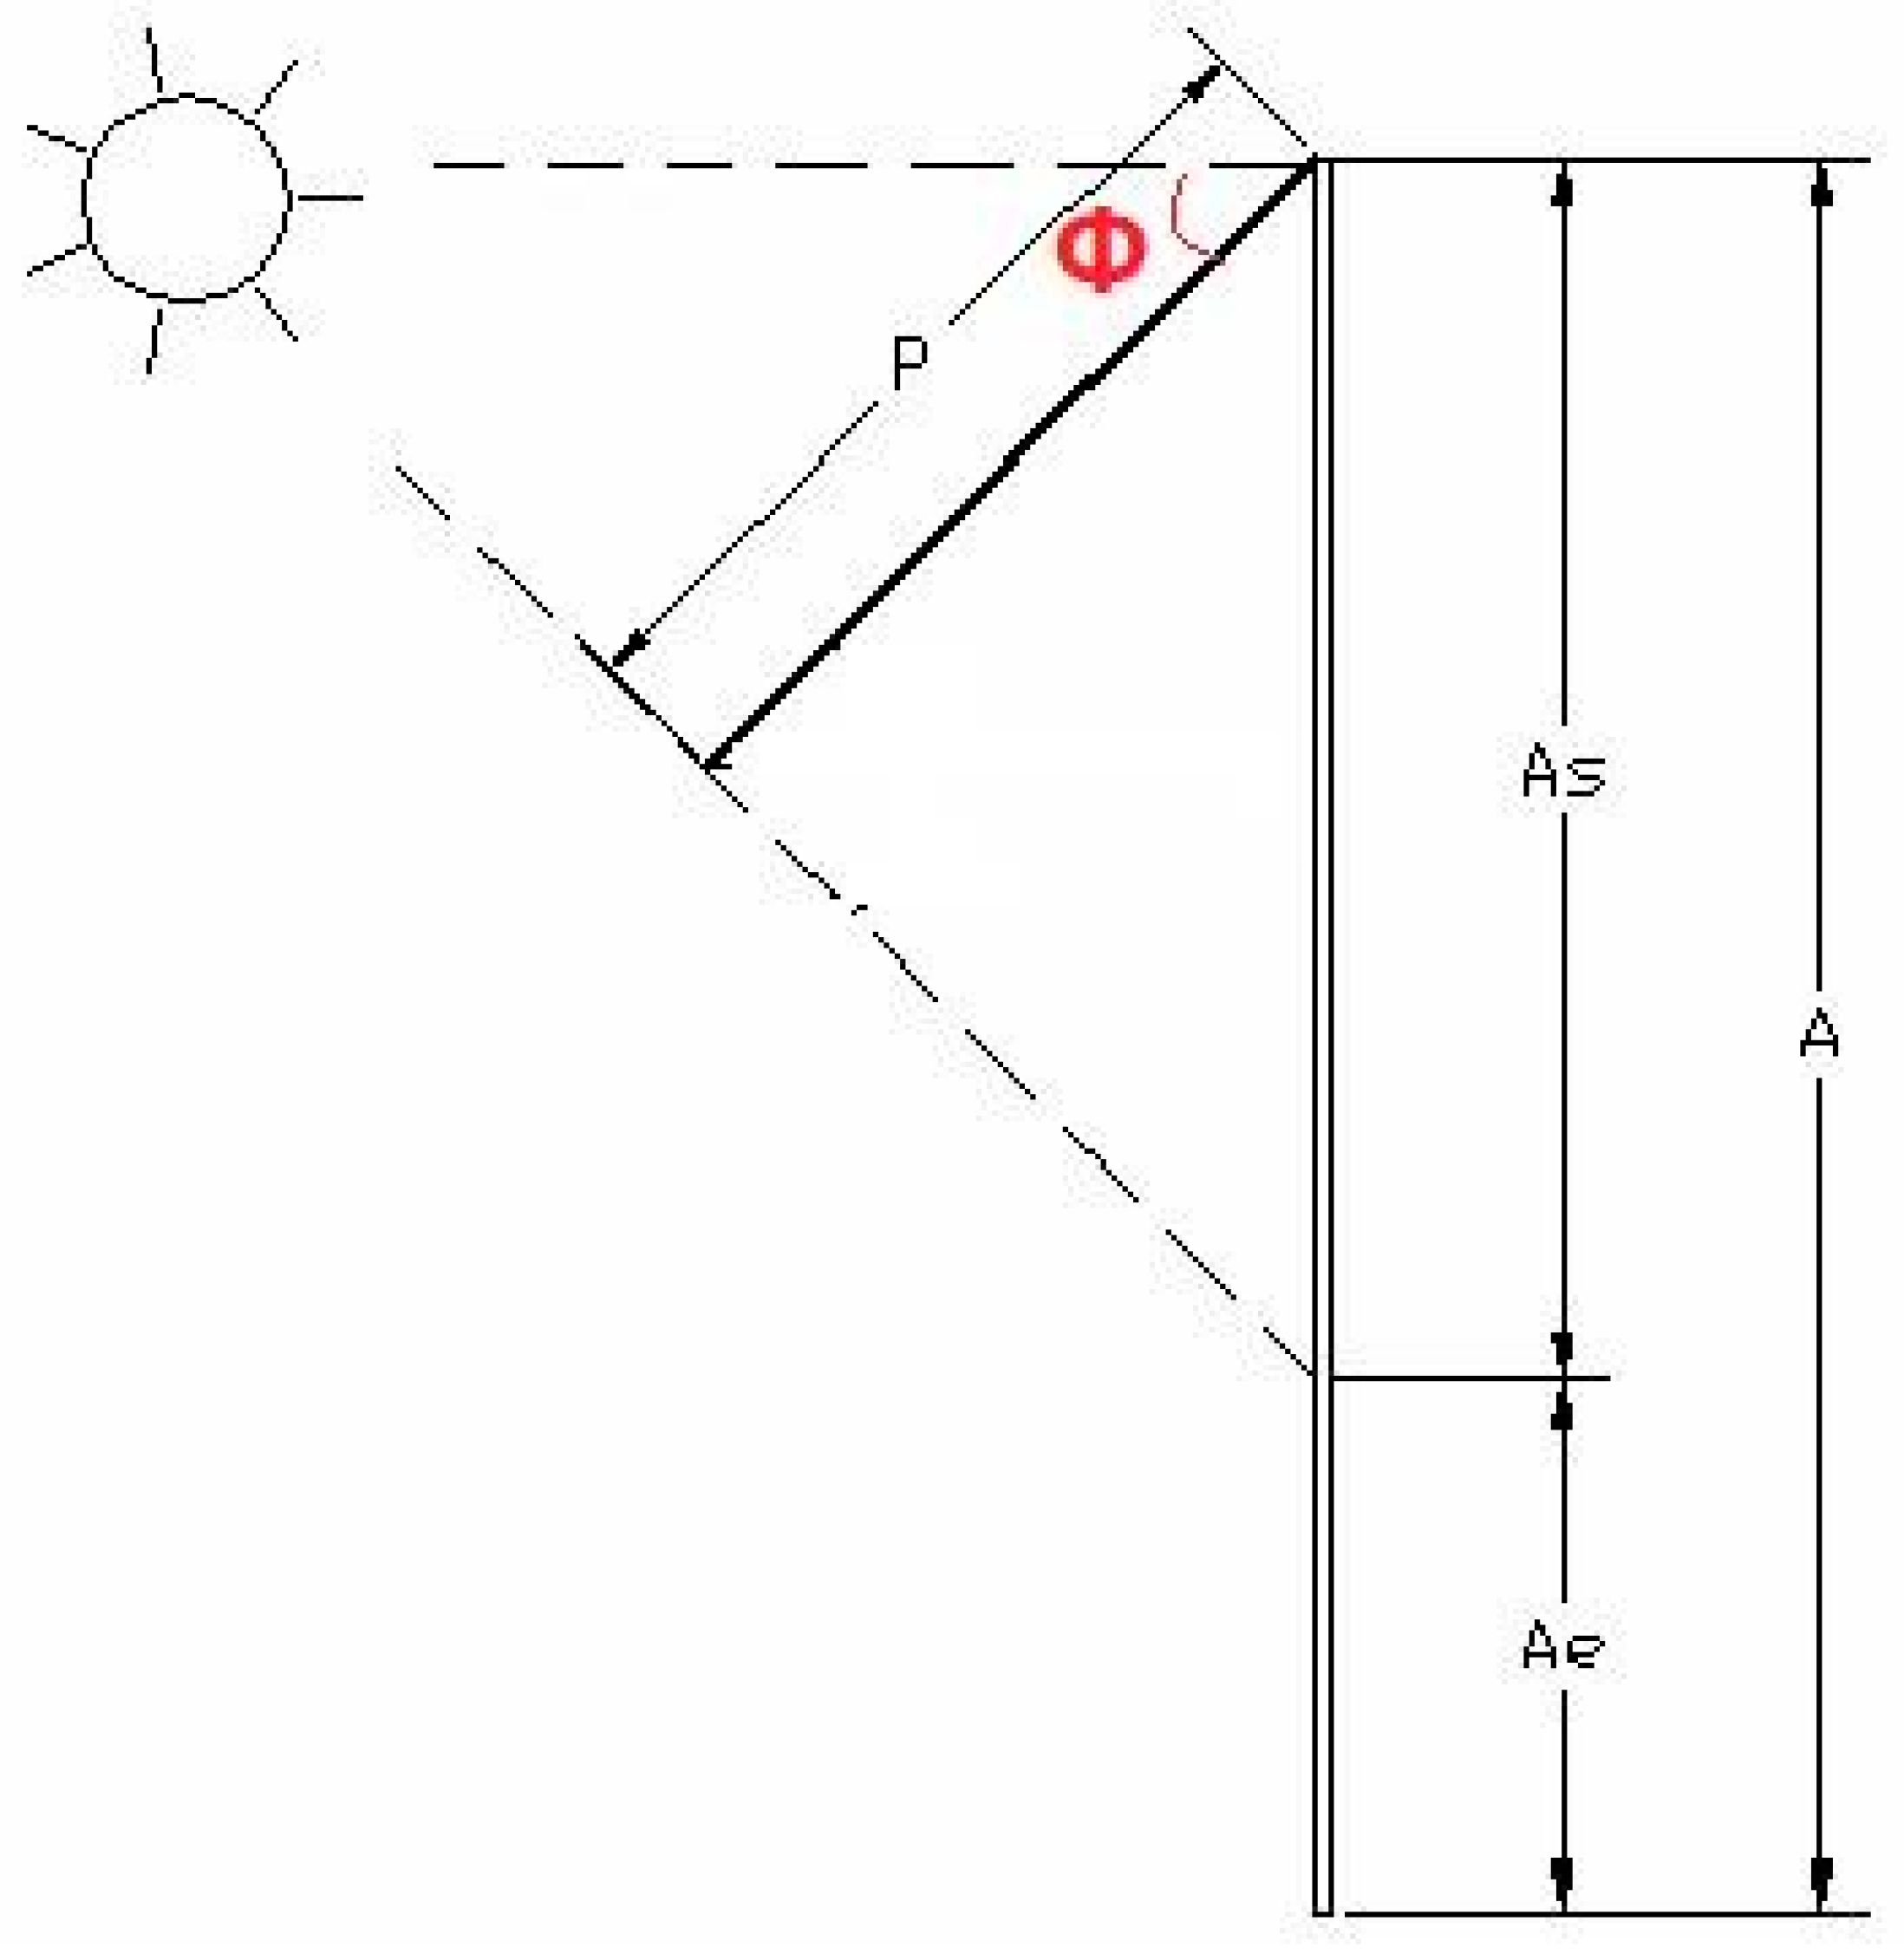
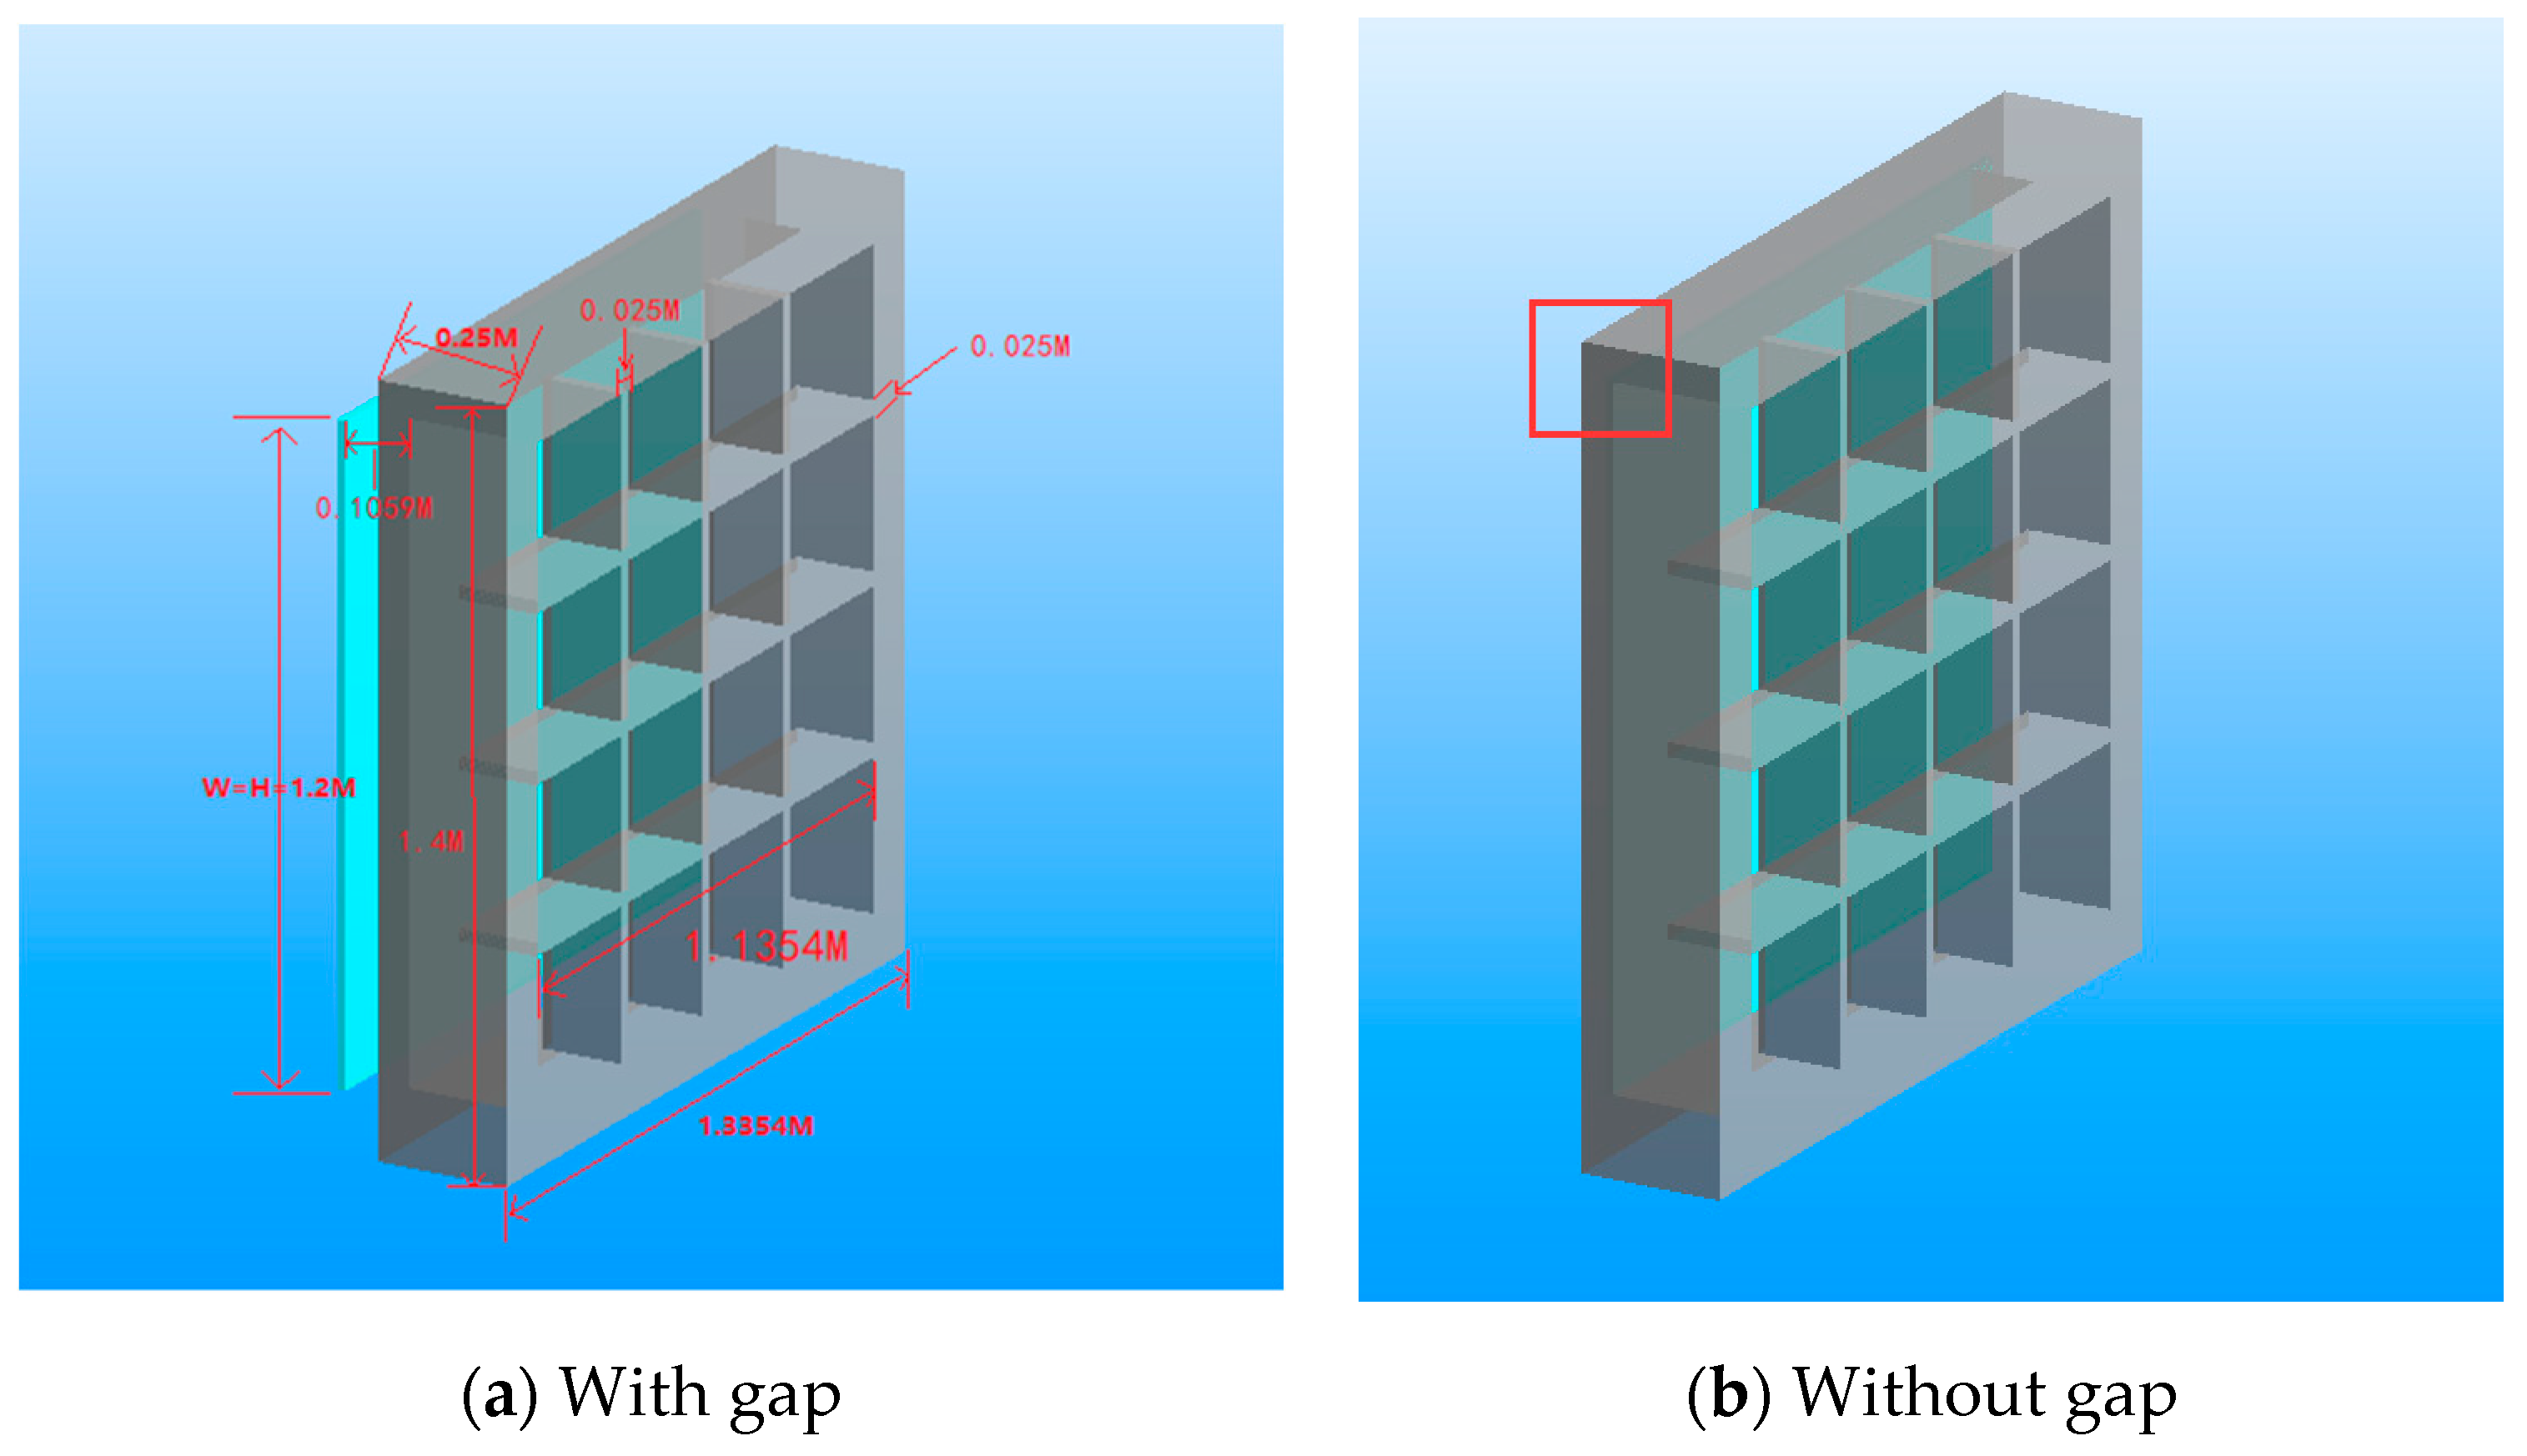
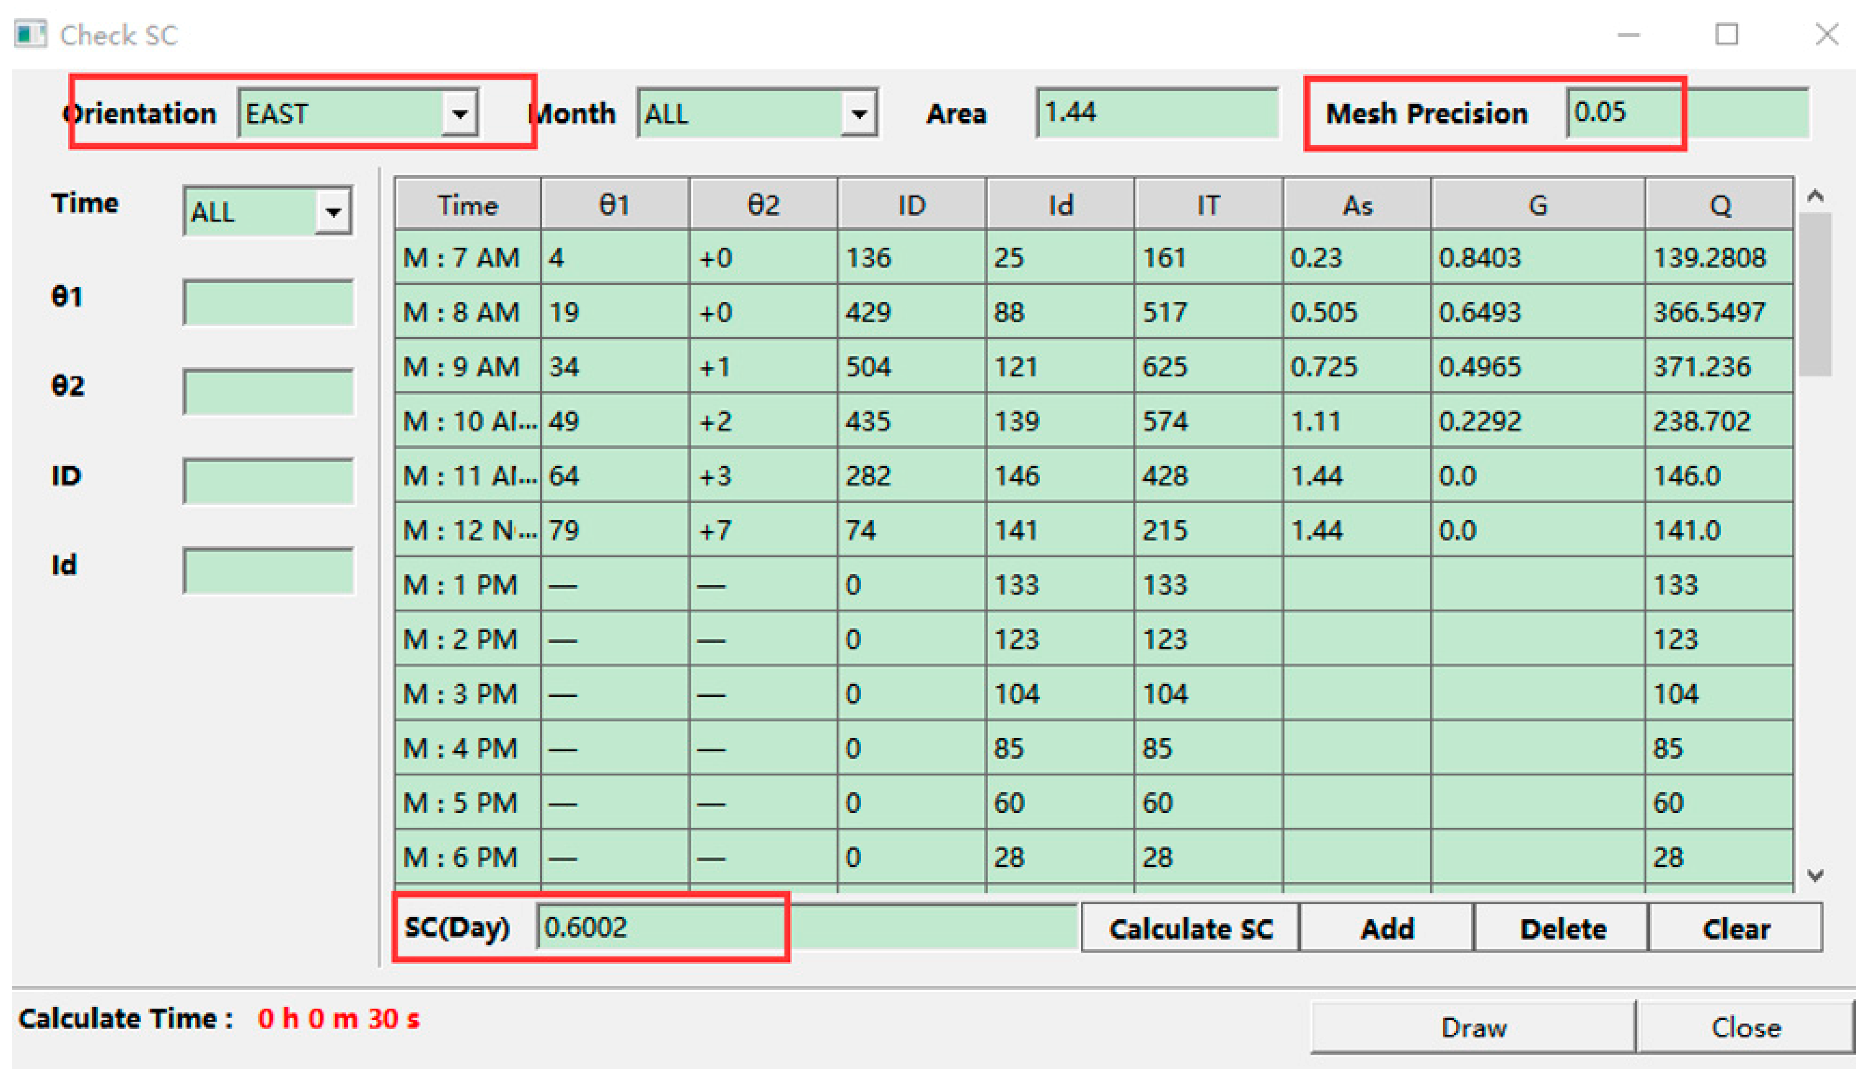
4.3. Performance-Based Method—Proposed Digital Analysis Method for Arbitrarily Shaped Shading Device

The window shading analysis can be very difficult for arbitrarily shaped shading devices. To simplify the analysis process, the tabular reference and analysis sample for the most often used shading device shapes have been provided in the Code on Envelope Thermal Performance for Buildings [33]. However, nowadays, more and more modern buildings have been designed with special shapes and render the simplified analysis process inadequate for envelope thermal transmittance analysis. Therefore, an effective digital analysis technology for envelope thermal transmittance analysis of windows with arbitrarily shaped shading devices is necessary.
This paper hereby proposes a numerical analysis method to analyze envelope thermal transmittance with arbitrarily shaped shading device windows.
Assume the position of the sun can be specified by the angles illustrated in Figure 6, which is adapted from [21,33].
By using the finite element approach, the window can be divided into smaller grids. Each small grid will be represented by its central point, as shown in Figure 7.
A solar ray R(t) with origin O and normalized direction D can be defined as:
R(t) = O + tD.
Assume the shading device of a window is divided into triangle elements, which is always needed for computer graphical display, as shown in Figure 8.
Each individual triangle element can be expressed, as illustrated in Figure 9.
Using this approach, the three joints of a triangle element (A, B, C) can also be expressed as vectors V(a), V(b), V(c). By introducing the local parameters (u, v) as shown in Figure 9, any point P within the triangle element can be expressed as:
P(u, v) = (1 − u − v) V(a) + uV(c) + vV(b) (u ≥ 0, v ≥ 0, u + v ≤ 1).
A solar ray in a window point to each individual triangle element can be calculated to determine its intersection, as shown in Figure 10.
Computing the intersection between the individual triangle element and solar ray is done by using following equation:
O + tD = (1 − u − v) V(a) + uV(c) + vV(b)
As shown in Figure 7, the window has been divided into several small triangle elements, and the center of each element can be defined as the solar point. Therefore, by referring to each solar point and the shading plan, the above equation can be solved. Inferably, it means that if there is a solution, the solar ray has been shaded; if there is no solution, there is no shading of the solar ray.
To check the results, a cloud-based platform has been developed to provide a 3D view of solar ray shading effects. The user graphic interface is shown in Figure 11a,b. By using the platform, any shape of shading devices and any direction of the solar ray can be calculated and viewed.

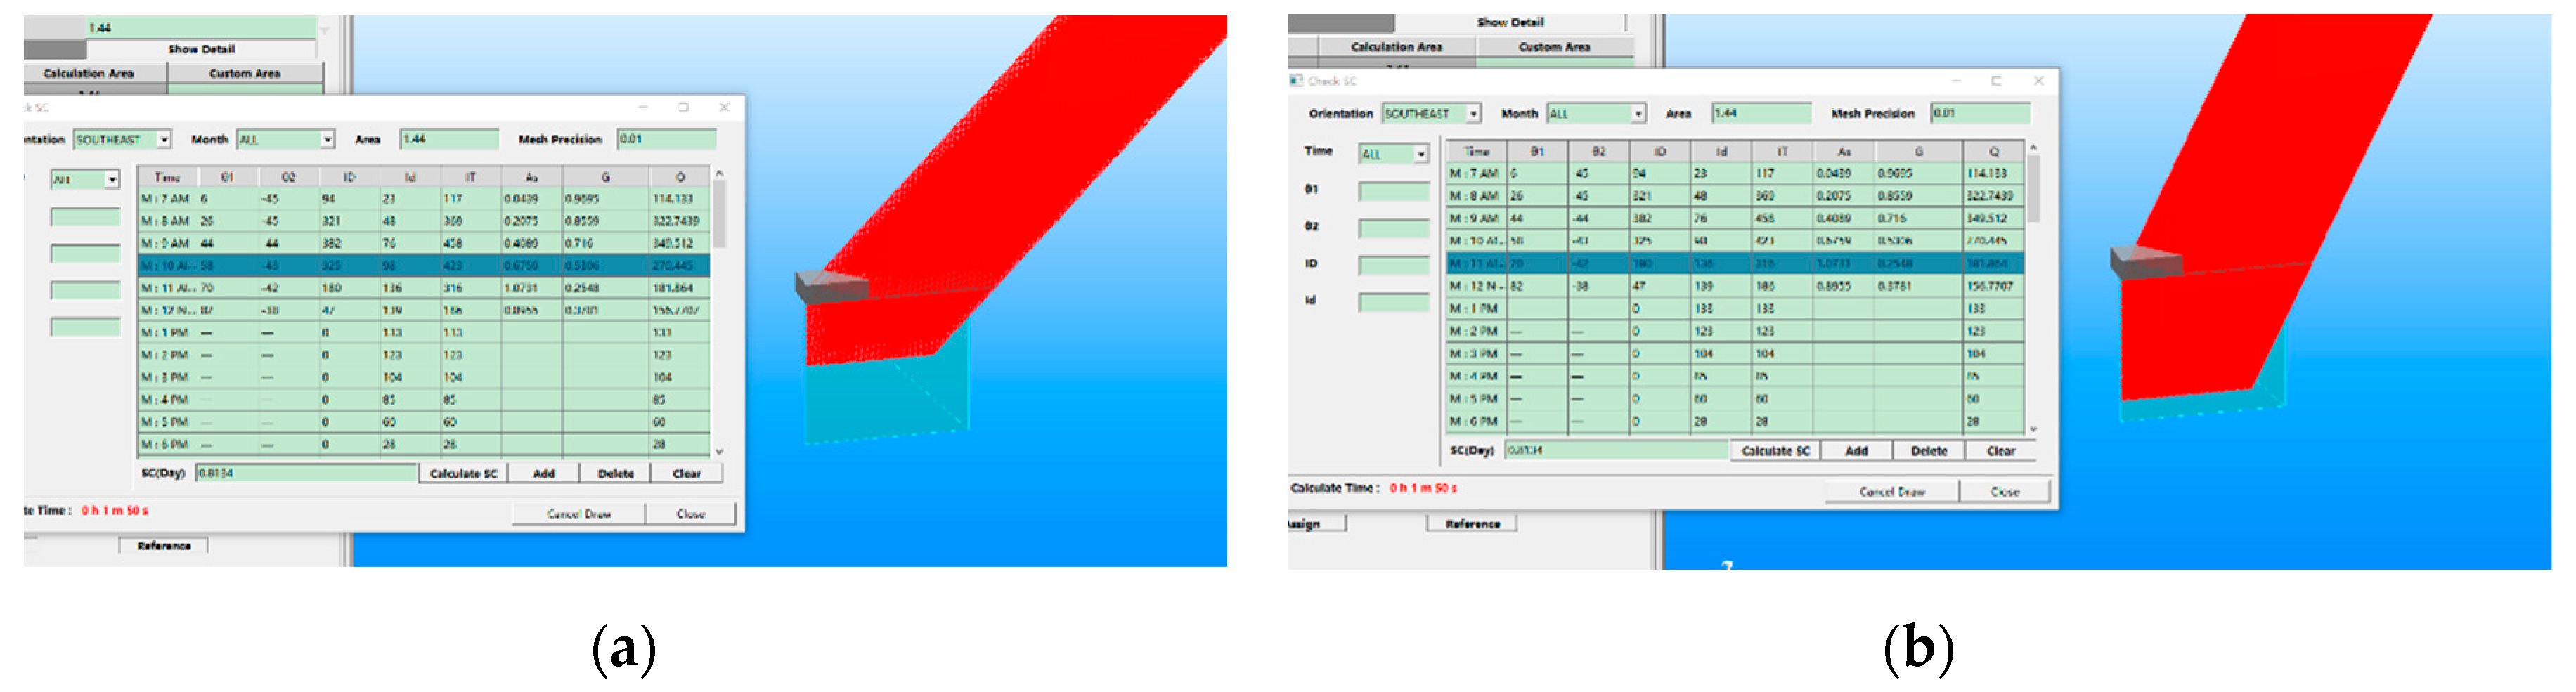
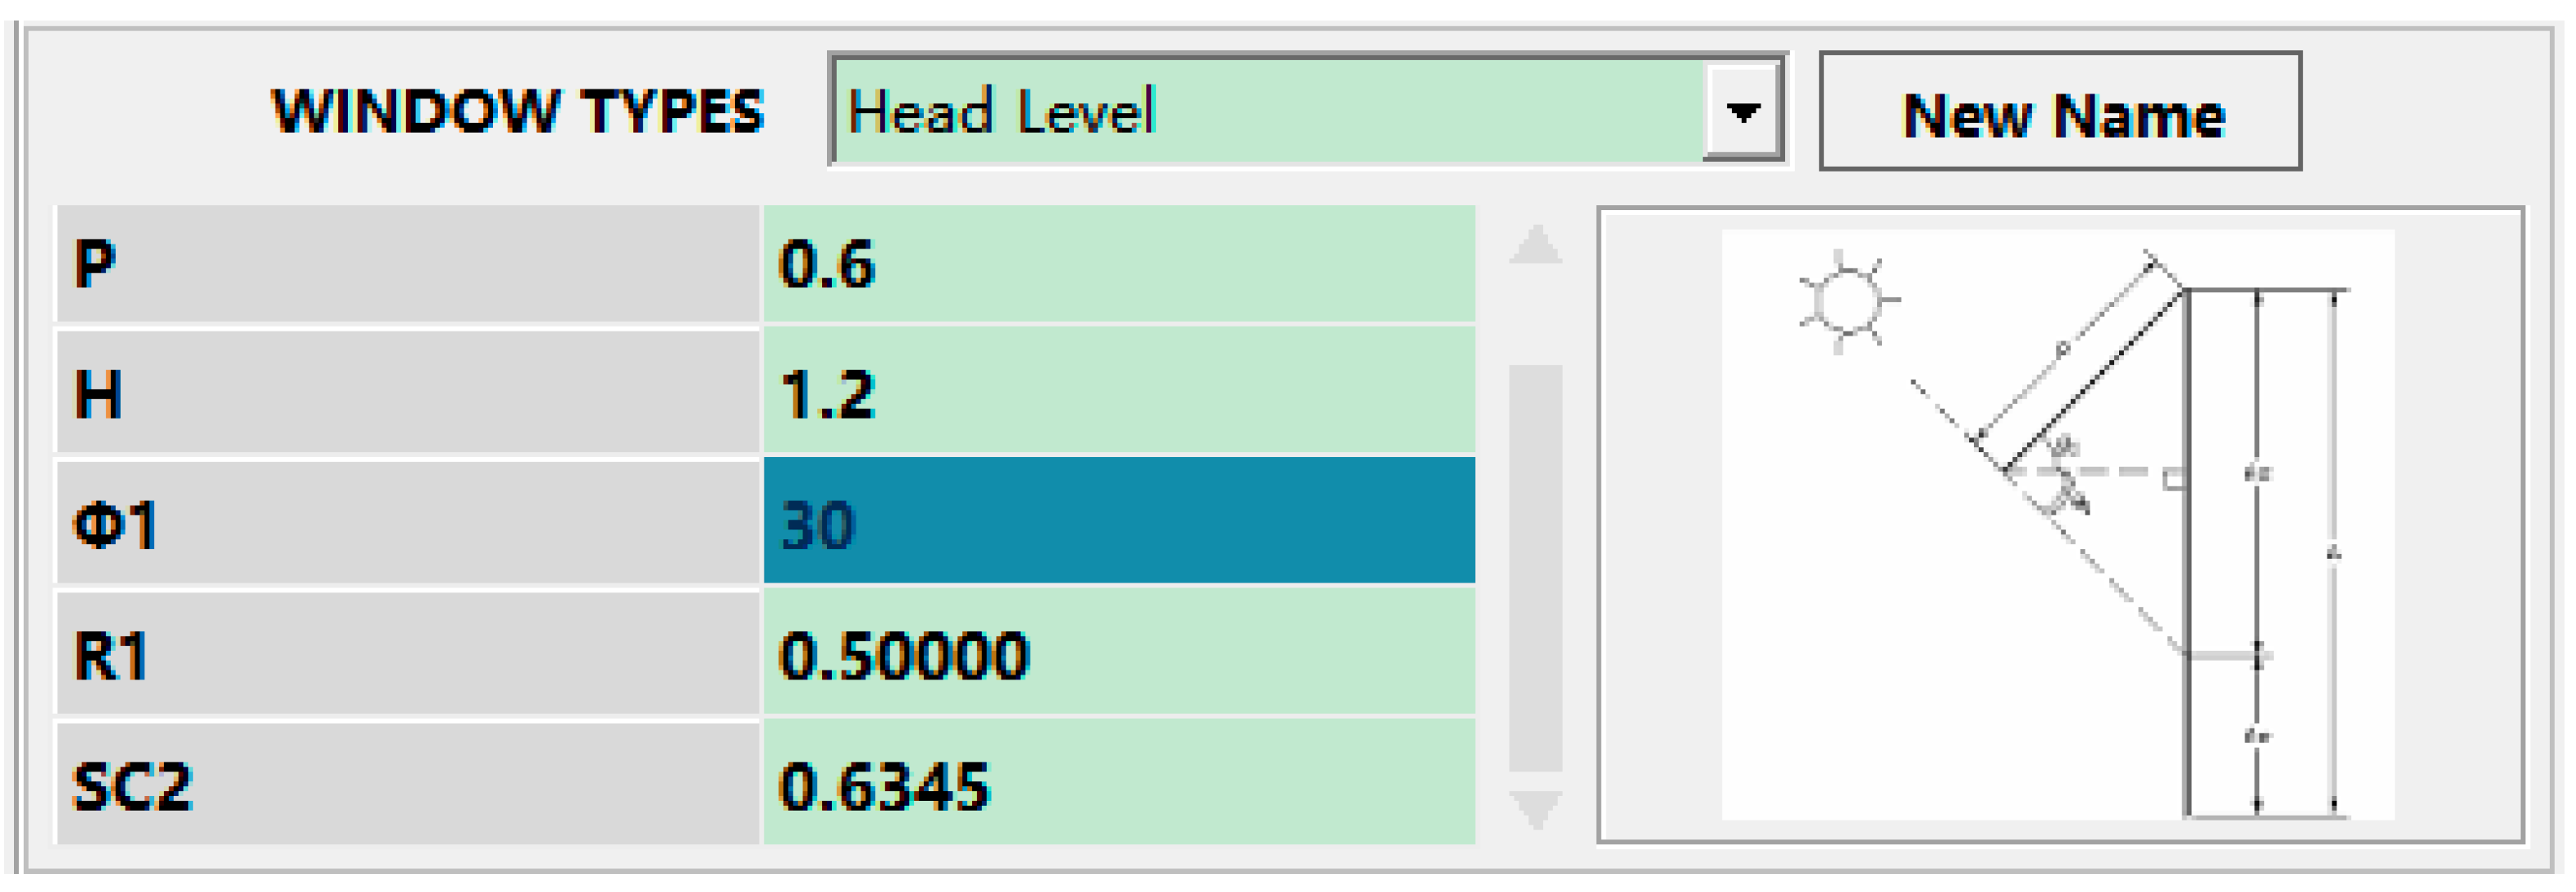
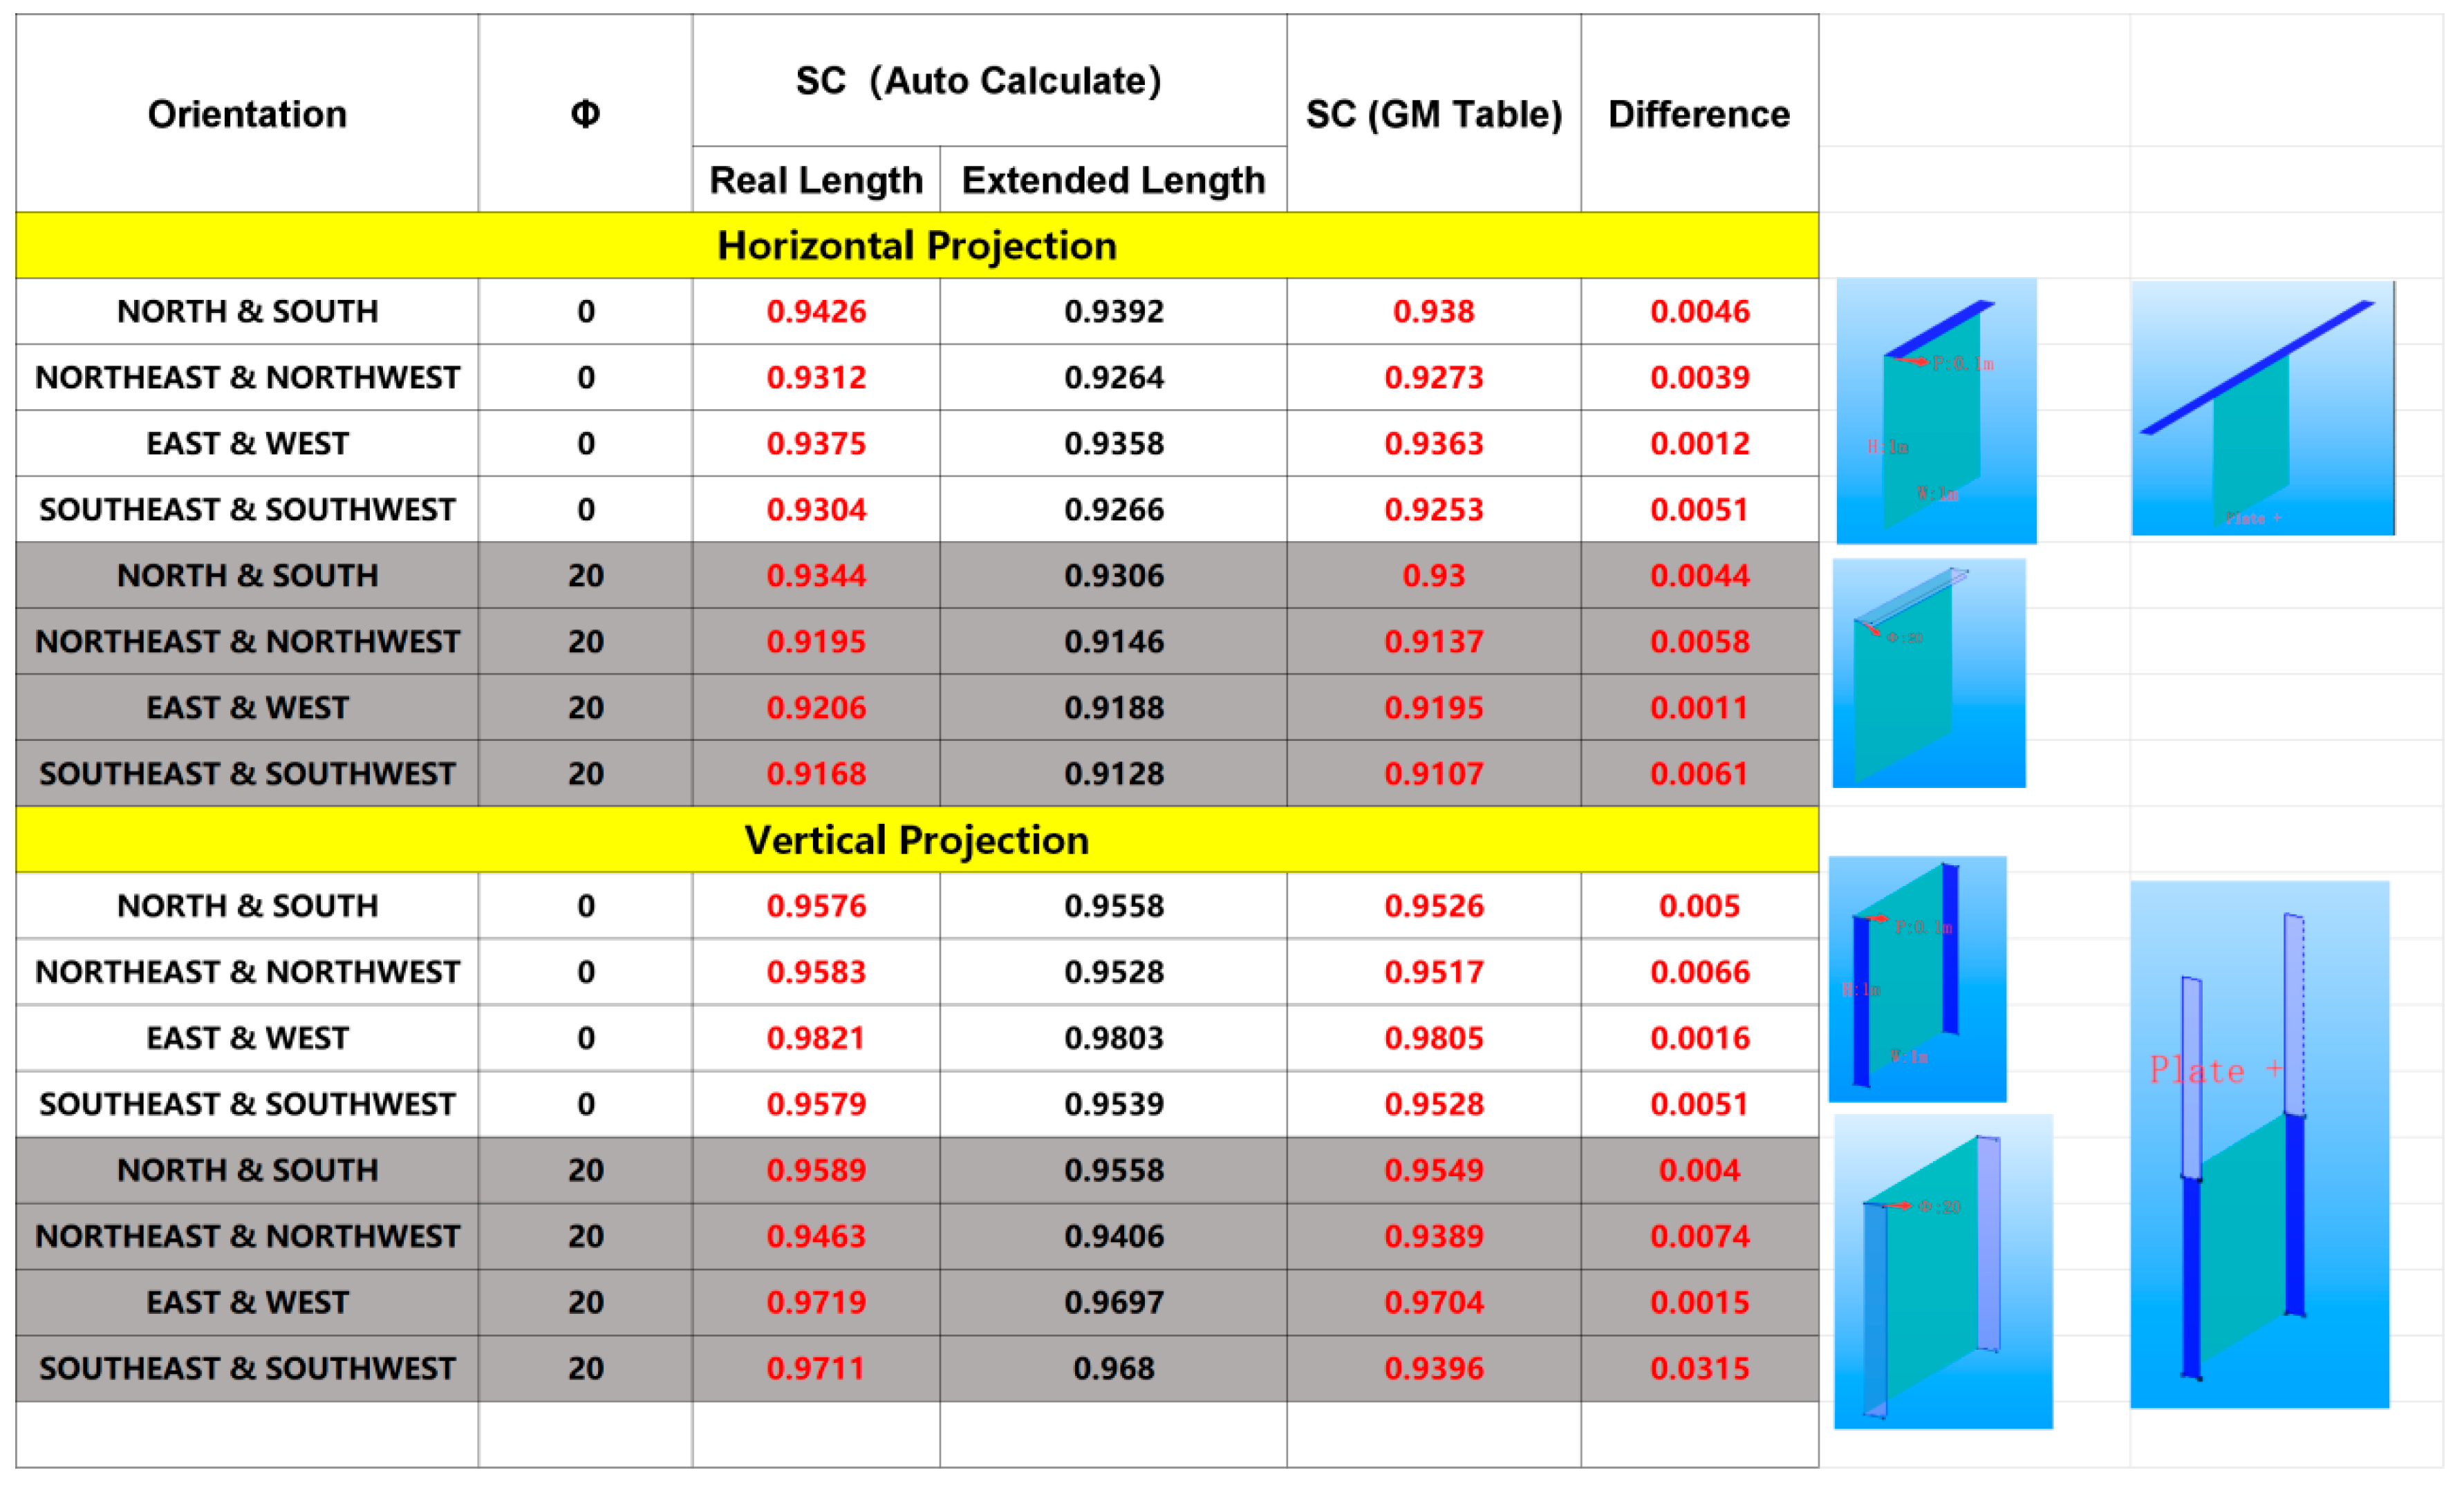
4.4. Analysis of Shading Coefficient

In the ETTV formula as described above, the solar factor has been derived from the annual average of solar radiation transmitted through a 3 mm clear glass window. For other systems of fenestration, the rate of solar heat gain is modified by the shading coefficient of the fenestration system, which is defined as the ratio of solar heat gain through the fenestration system having a combination of glazing and shading device to the solar heat gain through an unshaded 3 mm clear glass. This ratio is a unique characteristic of each type of fenestration system and is represented by the equation:
S C =   S o l a r   h e a t   g a i n   o f   a n y   g l a s s   a n d   a n y   s h a d i n g   c o m b i n a t i o n S o l a r   h e a t   g a i n   t h r o u g h   a   3   m m   u n s h a d e d   c l e a r   g l a s s
In general, the shading coefficient of any fenestration system can be obtained by multiplying the shading coefficient of the glass (or effective shading coefficient of glass with solar control film where a solar control film is used on the glass) and the shading coefficient of the sun-shading devices as follows:
SC = SC 1   ×   SC 2
where SC: shading coefficient of the fenestration system; SC1: shading coefficient of glass or effective shading coefficient of glass with solar control film where a solar control film is used on the glass; SC2: effective shading coefficient of external shading devices.
Therefore, the key part of the analysis is to determine the SC2 parameter. A sample model with different types of windows and shading devices is selected for the digital analysis, as shown in Figure 12.
A typical shading plate, as shown in Figure 13, is selected for analysis and comparison. The orientation of the window is facing the north-east direction. The SC2 value calculated by using the table from the Singapore Green Mark Standard is 0.6345.
However, the SC2 value calculated by the proposed digital analysis method is 0.7308, which is larger than the calculation from the BCA Table, as shown in Figure 14. There is a gap of 0.0962.
The study found that the bulk of the variance was due to the assumption of the shading plate extended along the long axial direction when creating the BCA table.
When the length of the shading plate was altered (as shown in Figure 15) and stretched long enough to shade all the solar rays on both sides of the shading plate, the two values converged.
In this case, the calculated result for the SC2 value turned out to be 0.6356, as shown in Figure 16, which is very close to the result of 0.6345 obtained by the BCA table.
The comparison of the SC2 parameter calculated from the Green Mark Guide table and proposed analysis method is provided. The parameters used in our analysis are displayed in Figure 17, which is adapted from [21,33].
In the following analysis process, the window width is 1 m, window length A = 1 m, shading plate width p = 0.1 m, and the shading plate thickness is 0.01 mm (we set the thickness as almost zero to reduce the effect of the shading plate thickness).
The analysis results of the SC2 parameter compared with the ETTV Guide table for the case of Φ = 0 and Φ = 20 are provided in Figure 18. From the analysis results, it is concluded that the calculated results by using the Green Mark Guide table will lead the SC2 value to be smaller than the actual value since it assumes that the length of the shading device is infinitely extended.
As an example, a digital analysis technology is used to calculate a mesh-shaped shading device, as shown in Figure 19. The proposed numerical method should be adopted for this kind of shading shape.
The orientation of the window facing is in the east direction. The calculated SC2 value with the gap of 10.59 mm between the window and shading device is 0.5935. If the gap between the window and shading device is removed, the calculated SC2 value becomes 0.6002 (as shown in Figure 20), which means more space in the window will be shaded when the gap is removed.

5. Validation

The following three validation studies (as shown in Figure 21)with analysis and results are provided to test the accuracy of the envelope thermal performance calculations. The results were obtained using a BIM model and calculation using the proposed analysis method. In the proposed analysis method, the shading areas of sun shading devices are obtained by using proposed digital analysis technology, which is embedded in the Green Mark Collaboration Environment.

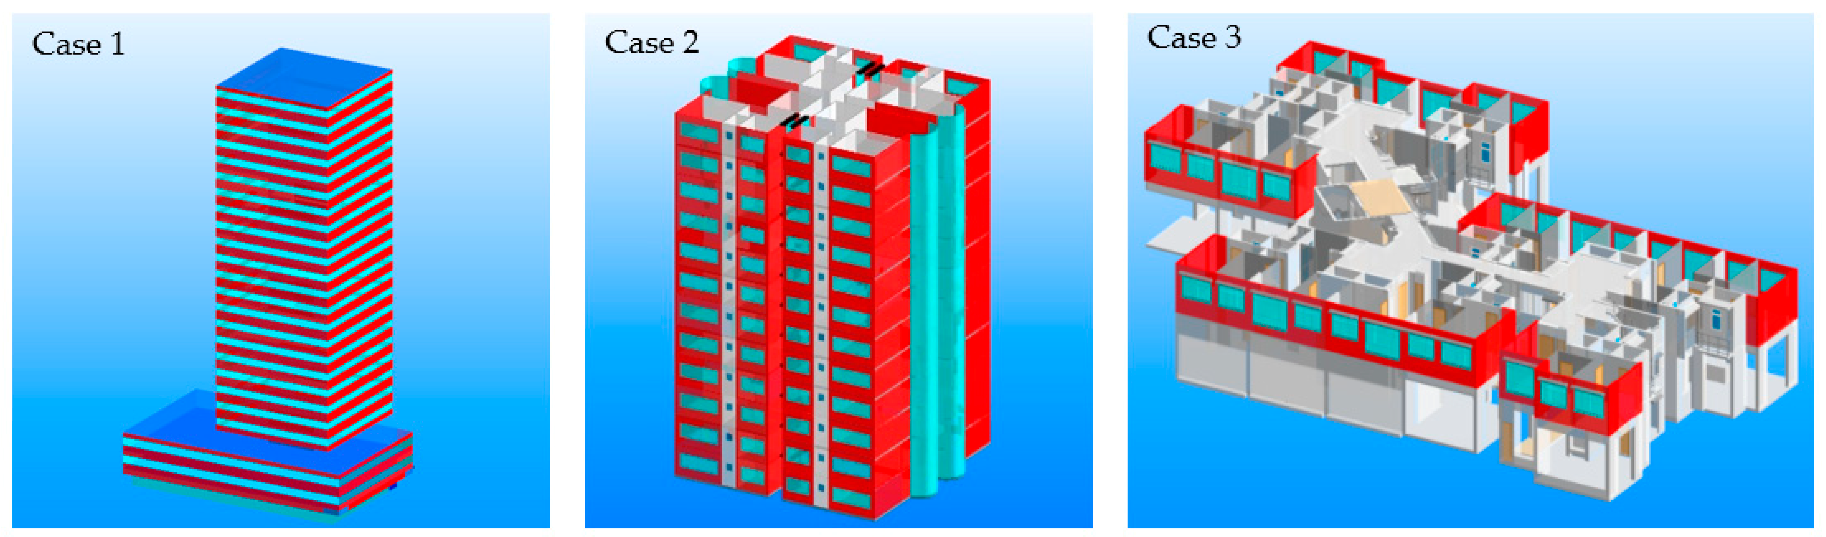
5.1. Case 1: Twenty-Five-Story Office Building

An example from the ETTV Guide for a 25-storey office building is calculated. The analysis results are compared in Table 3.

5.2. Case 2: Twelve-Storey Residential Building

An example of the Residential Envelope Transmittance Value for a 12-storey residential building is calculated. The analysis results are compared in Table 4.

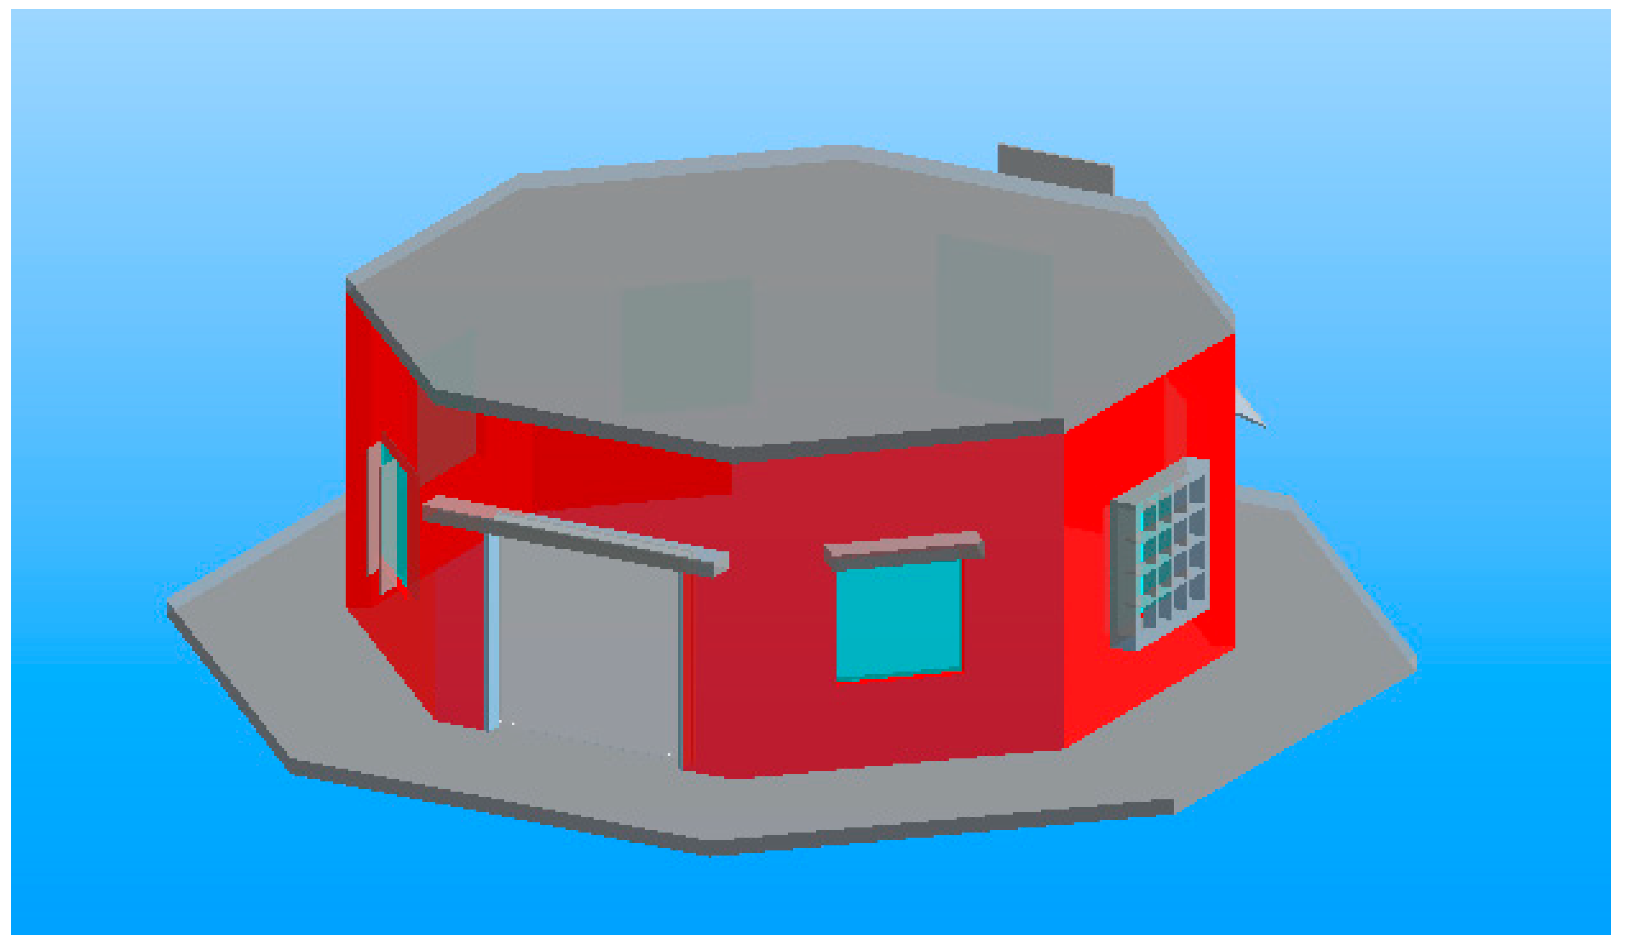
5.3. Case 3: TwoStorey Residential Building

An example of a Residential Envelope Transmittance Value for a two-storey residential building has been calculated. The RETV of this building has been calculated via spreadsheet tools. The results obtained by both Excel tools and the proposed method are compared in Table 5.
Based on the three cases above, the tolerance between the proposed method and manual calculation is about 0% to 4.05%.

6. Research Novelty

This research provides a thermal envelope performance engine based on a BIM cloud platform- Green Mark Collaboration Environment. Thermal data of the façade can be automatically extracted from the BIM model or manually assigned if the thermal data is not available in the BIM model. Solar data and calculation formulas have been embedded in the proposed platform to facilitate calculating the building envelope thermal performance in a more productive and convenient manner. The contribution of this research is elaborated as follows:
  • The thermal envelope performance analysis and calculation engine not only includes the function of computing through a traditional way but also provides the function of direct analysis and a calculation engine to address the complex situation (arbitrarily shaped shading devices), which is not covered in the ETTV guideline [21], as explained in Section 4.3, which provides a simplified building envelope thermal performance calculation procedure through interlinking formulas/equations with the building elements. The thermal information in the model can be easily tracked by stakeholders.
  • The consolidation of information from stakeholders could be eliminated because the information is progressively collected by the proposed Green Mark Collaboration Environment during the development of the green building project. Errors from the manual procedure could be avoided.
  • The proposed Green Mark Collaboration Environment marks the abandonment of the outdated and tedious extraction and collection of the information needed for building envelope thermal performance by providing a new and rapid approach for harnessing readily available information in the BIM model.
  • Dynamic information and fast decision-making: Stakeholders would be able to envision the green impact of design changes through involvement via Green Mark Collaboration Environment during the design stage. This would enable stakeholders to make quick decisions with regard to the project.

7. Future Research

It is worth mentioning that ETTV only takes into consideration the heat gain through external walls and windows of a building. Basically, it is a metric to measure the solar gain through the building envelope and does not directly link to energy efficiency. ETTV is more like a passive strategy to minimize the solar gain, whereas the actual energy efficiency in buildings is impacted by the performance of the HVAC system, operating strategies (e.g., cooling/heating set point) and energy-related occupant behaviors, which have large variations in reality [34].
This study only focuses on the proposed Green Mark Collaboration Environment, the proposed performance-based method for arbitrarily shaped shading devices and the validation of its accuracy. The relationship between ETTV and energy efficiency will be the future research direction that requires attention from scholars. Moreover, the research will also progressively develop other modules, such as the Concrete Usage Index (CUI) Calculator, Lighting Calculator and other modules to automate the Green Mark process and embed all the modules into the proposed Green Mark Collaboration Environment.

8. Conclusions

This study compared various BIM-based building envelope thermal performance software. Based on an initial comparative analysis, the study identified that there is an onerous amount of effort required by the users while exporting the building performance BIM model to the BPA software. Furthermore, the findings of this research also indicate that the current methods of calculating ETTV through spreadsheets are tedious and error-prone, which is quite cumbersome if there are any future changes raised by project stakeholders. In addition, the current methods of calculating ETTV is dependent upon the ETTV guidelines, which do not cater to complex and irregular shading devices. To address these various issues, this research proposed the development of a BIM-based platform to digitalize the ETTV calculation. This platform is an improvement over current methods, which require the import and export of a BIM model. At the same time, the platform also facilitates parametric capabilities that promotes change management, which means that any changes in the BIM model by the project stakeholders will directly update the ETTV.
Furthermore, the platform developed through this research is a cloud-based platform, which acts as a common data environment (CDE) for the Green Mark scheme. This allows various project stakeholders to access the Green Mark data simultaneously in a federated manner so that the relevant information can be shared, validated and allows project stakeholders to keep track of the GM data generated throughout the project lifecycle. The platform also allows the relevant documentation to be hyperlinked with the BIM model, which can finally be produced in the form of a report for regulatory approval purposes. The research validated that the use of this platform will enable productivity improvement as far as the ETTV calculation is concerned.

Author Contributions

Conceptualization, Z.L. and V.J., L.G.; methodology, Z.L.; software, Z.L.; validation, Z.L., Q.W. and V.J., L.G.; writing—original draft preparation, Z.L.; writing—review and editing, Z.L., Q.W. and V.J., L.G.; supervision, L.P., Q.W. and V.J., L.G. All authors have read and agreed to the published version of the manuscript.

Funding

The research project was funded by the Building and Construction Authority (BCA) of Singapore under an Innovation Grant (iGrant) with reference number BCA RID 94.15.2.39.

Acknowledgments

The development was conducted at ITI Hub Pte. Ltd. (ITI) and United Project Consultant Pte. Ltd. (UPC). Special thanks go to Sun Keming (ITI), Er. Tang Kian Cheong (UPC), and Felix Batad (UPC). The authors would also like to express their gratitude towards Tan Kee Wee, Programme Director, Digitalization Department, Built Environment Research and Innovation Institute (BERII), Building and Construction Authority (BCA).

Conflicts of Interest

The authors declare no conflict of interest.

Disclaimer

The opinions and recommendations expressed in this paper are the authors’ personal opinions and do not necessarily represent the official position of any organization. This paper does not endorse any software in any capacity.

References and Note

  1. LIU, Z.; LU, Y.; Peh, L. Review and Scientometric Analysis of Global Building Information Modeling (BIM) Research in the Architecture, Engineering and Construction (AEC) Industry. Buildings 2019, 9, 210. [Google Scholar] [CrossRef] [Green Version]
  2. Kaneta, T.; Furusaka, S.; Tamura, A.; Deng, N. Overview of BIM Implementation in Singapore and Japan. J. Civ. Eng. Archit. 2016, 10, 1305–1312. [Google Scholar] [CrossRef]
  3. Building and Construction Authority of Singapore. The BIM Issue. Build Smart Magazine, 2011; p. 4. [Google Scholar]
  4. Azhar, S.; Brown, J. Bim for Sustainability Analyses. Int. J. Constr. Educ. Res. 2009, 5, 276–292. [Google Scholar] [CrossRef]
  5. Schlueter, A.; Thesseling, F. Building Information Model Based Energy/Exergy Performance Assessment in Early Design Stages. Autom. Constr. 2009, 18, 153–163. [Google Scholar] [CrossRef]
  6. Eastman, C. An Outline of the Building Description System. Res. Rep. No. 50. 1974, 23, 5. [Google Scholar]
  7. US National Institute of Building Sciences. National Building Information Modeling Standard, Version 1-Part 1: Overview, Principles, and Methodologies, Glossary; US National Institute of Building Sciences: Washington, DC, USA, 2007. [Google Scholar]
  8. Lu, Y.; Wu, Z.; Chang, R.; Li, Y. Building Information Modeling (BIM) for Green Buildings: A Critical Review and Future Directions. Autom. Constr. 2017, 83, 134–148. [Google Scholar] [CrossRef]
  9. USGBC. LEED V4.1. Available online: https://new.usgbc.org/leed-v41 (accessed on 16 November 2019).
  10. BRE. BREEAM International New Construction 2016 Technical Manual; BRE Global Ltd.: Watford, UK, 2016; p. 1385. [Google Scholar]
  11. BEAM Society Limited. BEAM Plus For New Buildings 2012, 2. Available online: https://www.beamsociety.org.hk/files/BEAM_Plus_For_New_Buildings_Version_1_2.pdf (accessed on 19 November 2019).
  12. GBCA. Green Star. Available online: https://new.gbca.org.au/green-star/ (accessed on 11 November 2019).
  13. GreenBuildingIndex. GBI Assessment Criteria for Non-Residential New Construction (NRNC). Available online: https://new.greenbuildingindex.org/Files/Resources/GBI%20Tools/GBI%20NREB%20Data%20Centre%20Tool%20V1.0.pdf (accessed on 16 November 2019).
  14. Building and Construction Authority of Singapore. Green Mark for Non-Residential Buildings NRB: 2015 Including Hawker Centres, Healthcare Facilities, Laboratory Buildings and Schools; Building and Construction Authority of Singapore: Singapore, 2015.
  15. Building and Construction Authority. BCA Green Mark Assessment Criteria, Online Application and Verification Requirements. Available online: https://www.bca.gov.sg/GreenMark/green_mark_criteria.html (accessed on 19 November 2019).
  16. Chen, X.; Yang, H.; Lu, L. A Comprehensive Review on Passive Design Approaches in Green Building Rating Tools. Renew. Sustain. Energy Rev. 2015, 50, 1425–1436. [Google Scholar] [CrossRef]
  17. Breesch, H.; Janssens, A. Performance Evaluation of Passive Cooling in Office Buildings Based on Uncertainty and Sensitivity Analysis. Sol. Energy 2010, 84, 1453–1467. [Google Scholar] [CrossRef]
  18. Badescu, V.; Cathcart, R.B. Environmental Thermodynamic Limitations on Global Human Population. Int. J. Glob. Energy Issues 2006, 25, 129–140. [Google Scholar] [CrossRef]
  19. Natephra, W.; Motamedi, A.; Yabuki, N.; Fukuda, T. Integrating 4D Thermal Information with BIM for Building Envelope Thermal Performance Analysis and Thermal Comfort Evaluation in Naturally Ventilated Environments. Build. Environ. 2017, 124, 194–208. [Google Scholar] [CrossRef]
  20. Natephra, W.; Yabuki, N.; Fukuda, T. Optimizing the Evaluation of Building Envelope Design for Thermal Performance Using a BIM-Based Overall Thermal Transfer Value Calculation. Build. Environ. 2018, 136, 128–145. [Google Scholar] [CrossRef]
  21. Building and Construction Authority of Singapore. Guidelines on Envelope Thermal Transfer Value for Buildings; Building and Construction Authority of Singapore: Singapore, 2004.
  22. Seghier, T.E.; Lim, Y.W.; Ahmad, M.H.; Samuel, W.O. Building Envelope Thermal Performance Assessment Using Visual Programming and BIM, Based on ETTV Requirement of Green Mark and GreenRE. Int. J. Built Environ. Sustain. 2017, 4, 227–235. [Google Scholar] [CrossRef] [Green Version]
  23. Chua, K.J.; Chou, S.K. An ETTV-Based Approach to Improving the Energy Performance of Commercial Buildings. Energy Build. 2010, 42, 491–499. [Google Scholar] [CrossRef]
  24. Singhaputtangkul, N.; Low, S.P.; Teo, A.L. Integrating Sustainability and Buildability Requirements in Building Envelopes. Facilities 2011, 29, 255–267. [Google Scholar] [CrossRef]
  25. Liu, Z.; Chen, K.; Peh, L.; Tan, K.W. A Feasibility Study of Building Information Modeling for Green Mark New Non-Residential Building (NRB): 2015 Analysis. Energy Procedia 2017, 143, 80–87. [Google Scholar] [CrossRef]
  26. Ansah, M.K.; Chen, X.; Yang, H.; Lu, L.; Lam, P.T.I. A Review and Outlook for Integrated BIM Application in Green Building Assessment. Sustain. Cities Soc. 2019, 48, 101576. [Google Scholar] [CrossRef]
  27. Parisa, E.; Moakher, E.; Pimplikar, S.S. Building Information Modeling (BIM) and Sustainability—Using Design Technology in Energy Efficient Modeling. IOSR J. Mech. Civ. Eng. 2012, 1, 1684–2278. [Google Scholar]
  28. Hazel Joanne. Sustainable Architectural; 2009; p. 16.
  29. Integrated Environmental Solutions Limited. VE-Navigator for GM Pro A Professional Solution for a Comprehensive Green Mark®® Assessment. Available online: https://www.iesve.com/software/virtual-environment/modules/nav-gmpro (accessed on 19 November 2019).
  30. Yildirim, H.T.; Senturk, N. Analysis of Imp3 Expression in Prostate Adenocarcinomas. Turkish, J. Pathol. 2012, 28, 128. [Google Scholar] [CrossRef] [Green Version]
  31. Chen, S.; Jin, R.; Alam, M. Investigation of Interoperability between Building Information Modeling (BIM) and Building Energy Simulation (BES). Int. Rev. Appl. Sci. Eng. 2018, 9, 137–144. [Google Scholar] [CrossRef]
  32. Inhabitgroup. ETTV Façade Designer Released to Singapore Market. Available online: https://inhabitgroup.com/ettv-facade-designer-released-to-singapore-market-2/ (accessed on 10 November 2019).
  33. Building and Construction Authority of Singapore. Code on Envelope Thermal Performance for Buildings O. Available online: https://www.bca.gov.sg/PerformanceBased/others/RETV.pdf (accessed on 1 October 2019).
  34. Gan, V.J.L.; Lo, I.M.C.; Ma, J.; Tse, K.T.; Cheng, J.C.P.; Chan, C.M. Simulation Optimisation towards Energy Efficient Green Buildings. J. Clean. Prod. 2020. [Google Scholar] [CrossRef]
Figure 1. Traditional Envelope Thermal Transfer Value (ETTV) calculation process.
Energies 13 00586 g001
Figure 2. Proposed workflow for Building Information Model (BIM)-based ETTV computation.
Energies 13 00586 g002
Figure 3. Selecting and assigning parameters for the elements with the same properties.
Energies 13 00586 g003
Figure 4. Model elements are mapped with the equation.
Energies 13 00586 g004
Figure 5. Framework of a collaborative working environment.
Energies 13 00586 g005
Figure 6. Solar geometry.
Energies 13 00586 g006
Figure 7. Finite element approach.
Energies 13 00586 g007
Figure 8. Finite element approach.
Energies 13 00586 g008
Figure 9. Individual triangle element.
Energies 13 00586 g009
Figure 10. A solar ray in a window.
Energies 13 00586 g010
Figure 11. Three-dimensional view of solar ray shading effects.
Energies 13 00586 g011
Figure 12. Example model.
Energies 13 00586 g012
Figure 13. SC2 calculation by using the ETTV Guide table.
Energies 13 00586 g013
Figure 14. SC2 calculation by using the proposed digital method.
Energies 13 00586 g014
Figure 15. Shading plate with a longer length.
Energies 13 00586 g015
Figure 16. SC2 calculation by using the proposed method.
Energies 13 00586 g016
Figure 17. SC2 calculation by using the proposed method.
Energies 13 00586 g017
Figure 18. SC2 comparison calculation by using the proposed digital method and the traditional method.
Energies 13 00586 g018
Figure 19. Mesh-shaped shading device.
Energies 13 00586 g019
Figure 20. SC2 calculation by using the proposed digital method.
Energies 13 00586 g020
Figure 21. Models for validation.
Energies 13 00586 g021
Table 1. Comparison of various green building certifications.
Scheme & DevelopedLEED V4 By USGBCBREEAM By BREBEAM Plus By HKGBCGreen Star By GBCAGBI By PAM/ACEMGreen Mark By BCA
Logo Energies 13 00586 i001 Energies 13 00586 i002 Energies 13 00586 i003 Energies 13 00586 i004 Energies 13 00586 i005 Energies 13 00586 i006
Reference[9][10][11][12][13][14]
Origin & Launch YearUSA, 1998UK, 1990Hong Kong, 1996Australia, 2002Malaysia, 2009Singapore, 2005
No. of Countries/Regions adopted1607712115
ApplicationVarious Climate ConditionVarious Climate ConditionVarious Climate ConditionTropical/Subtropical Climate Tropical ClimateTropical/Subtropical Climate
Certified byGBCI (Green Business Certification Inc.) BREEAM Assessor (BRE Global monitor the assessment quality process of the assessor) BEAM Plus TRC (Technical Review Committee) Green Star Certified AssessorGBIAP (GBI Accreditation Panel) BCA Green Mark Department
Envelope Thermal Performance RequirementBuilding envelope opaque: roofs, walls, floors, slabs, doors, etc. Building envelope glazing: vertical fenestrationThe design analysis must cover peripheral microclimate conditions, building form, layout, building envelope, and thermal mass, as well as daylighting and ventilation strategies.Building Envelope: Overall Thermal Transfer Value (OTTV) calculationCredit considered in energy modeling OTTV ≤ 50, RTTV ≤ 25. Submit calculations using the BEIT software or other GBI approved software(s)Energy Efficiency (1-1: Thermal Performance of Building Envelope)
Table 2. Core information for thermal envelope performance calculation.
ElementModeling RequirementsCore Information
WallEnsure that overall partition thickness, including finishes, is correct as per design intent.
Model the walls individually for each story/level.
Terminate height of wall at soffit of beam and slab, or to exact intended design height.
Build Type
Material
Thickness
Area
Volume
WindowDefine the window “TYPE” clearly.
Ensure that locations and counts are correct per type. Do not over-model.
Ensure that overall window size is correct. Window details may refer to 2D typical details.
Window to be coordinated with structural openings if it is in the structural wall.
Build Type
Material
Thickness
Area
DoorDefine the door type clearly.
Ensure that locations and counts are correct per type. Location shall be from room or to room.
Dimensions
Location
ColumnIf the column is a structural column with an architectural cladding, model the cladding finish as the wall.
Model the structural column individually for each storey.
Dimension
Area
Volume
BeamModel the beams from and to the center of the column For CIP structures, join beams to slabs (clear the connections).Dimension
Area
Volume
SlabModel the structural floors at SFL to be coordinated with Architectural FFL.
Model slabs as individual elements from beams.
Thickness
Grade
Roof For flat roofs, only the roof finish, i.e., screed must be modeled in the architectural model.
The roof slab must be modeled in the structural model.
Ensure both finish and slab are aligned and not overlapping.
Thickness
Area
Table 3. Case 1 comparison.
MethodNESW
ETTV Guide 41.652.144.755.6
Proposed 41.652.144.6955.58
Differ000.010.02
Table 4. Case 2 comparison.
MethodNN-EES-ESS-WWN-W
ETTV Guide 18.04834.07517.14334.36818.6936.41917.61935.54
Proposed 18.4533.9717.1734.2618.7636.3117.6635.43
Differ0.4020.1050.0270.1080.070.1090.0410.11
Table 5. Case 3 comparison.
MethodNESW
Excel22.2410.3522.8510.48
Proposed23.1810.3723.8010.48
Differ0.940.020.950.0

