Abstract
The development of active hydrogen oxidation reaction (HOR) and oxygen reduction reaction (ORR) catalysts for use in anion exchange membrane fuel cells (AEMFCs), which are free from platinum group metals (PGMs), is expected to bring this technology one step closer to commercial applications. This paper reports our recent progress developing HOR Pt-free and PGM-free catalysts (Pd/CeO2 and NiCo/C, respectively), and ORR PGM-free Co3O4 for AEMFCs. The catalysts were prepared by different synthesis techniques and characterized by both physical-chemical and electrochemical methods. A hydrothermally synthesized Co3O4 + C composite ORR catalyst used in combination with Pt/C as HOR catalyst shows good H2/O2 AEMFC performance (peak power density of ~388 mW cm−2), while the same catalyst coupled with our flame spray pyrolysis synthesised Pd/CeO2 anode catalysts reaches peak power densities of ~309 mW cm−2. Changing the anode to nanostructured NiCo/C catalyst, the performance is significantly reduced. This study confirms previous conclusions, that is indeed possible to develop high performing AEMFCs free from Pt; however, the challenge to achieve completely PGM-free AEMFCs still remains.
1. Introduction
Fuel cells are excellent energy convertors due to their advantages of high efficiency and high energy density, and have the potential to provide continuous zero-emission power. Among the different alternatives, anion exchange membrane fuel cells (AEMFCs) have been identified as a promising fuel cell technology, due to their potential advantages over the mature proton exchange membrane fuel cells [1,2], which include the possibility of using non-noble metals as electrode catalysts due to the faster oxygen reduction reaction (ORR) kinetics in alkaline media [3,4]. A wide variety of catalysts may be used as ORR catalysts in AEMFC cathodes [5,6]. Among the non-precious metal catalysts for the cathode, Ag (or Ag/C) is the most widely used catalyst for AEMFCs [7,8]. However, Co-based catalysts in the form of Co3O4, have also been recognized as potential ORR catalytic materials due to their low cost, good electrical conductivity, and stability in alkaline media [9,10,11]. For instance, Xu et al. [12] prepared carbon-supported Co3O4 electrocatalysts with nano-rod and spherical structures via a solvent-mediated morphological control route, showing only slightly lower ORR catalytic activity than that measured with the noble Pd catalyst in the high potential region. Wang et al. [13] synthesized Co3O4 clad with graphene oxide (Co3O4@GO) by an ultrasonic method, which showed potentially good characteristics as a low-cost catalyst for ORR in AEMFCs. Liang et al. [14] reported that the catalytic behavior of Co3O4 grown on reduced graphene oxide (RGO) exhibits good activity towards ORR in alkaline electrolyte, close to that of Pt/C. These ex-operando results suggest that Co3O4 is a promising platinum group metal (PGM)-free electrocatalyst for ORR in AEMFCs. However, limited work has been reported on the performance of Co3O4-based ORR catalysts as real AEMFC cathodes [9,15,16].
Although the alkaline environment in AEMFCs potentially allows the use of Pt-free catalysts for ORR, the hydrogen oxidation reaction (HOR) kinetics in alkaline media are considerably more sluggish than for acidic media [10]. The HOR has several challenges in the alkaline medium [11]. A comprehensive review summarizing the development efforts over the past decades on HOR catalysts in alkaline medium was recently reported [17]. In this regard, Pd-based electrocatalysts have emerged as one of the few options for Pt-free AEMFCs [18,19]. A new class of Pd-based materials that exploit mixed carbon and cerium oxide supports has been reported to have excellent performance as anode catalysts in AEMFCs, with reported power densities of 0.5–1 W cm−2 [20,21]. In particular, the addition of CeO2 to Vulcan XC-72 carbon with a 50:50 weight ratio to support Pd nanoparticles was reported to yield a 5-fold improvement in anode performance when compared to Pd supported on carbon catalyst (without ceria) under the same fuel cell operating conditions. Miller et al. [18] posit that the presence of intimate contact between CeO2 and Pd enhances the OH– transfer from the anion-conducting regions in the anode electrode to the metal surface where the HOR takes place.
For PGM-free fuel cells, Ni-based electrocatalysts seem like a reasonable catalyst choice [21,22]. Various studies on Ni-based materials (Raney Ni, Ni-Cr, Ni-Ti, etc.) have found them to be suitable as anode catalysts when the electrolyte is liquid KOH. However, only limited work has been devoted to the development of Ni-based HOR catalysts for AEMFCs, where only a solid polymer electrolyte is present. The first fully PGM-free AEMFC test was demonstrated by Lu et al. [23] using a chromium doped Ni anode and Ag cathode. A maximum power density of 50 mW cm−2 at 60 °C was achieved without any degradation over 100 h. Another study by Hu et al. [24] showed a Ni-W anode and Co-based cathode for H2/O2 and H2/air AEMFCs, reaching peak power densities of around 40 mWcm−2 and 27 mWcm−2 respectively, demonstrating, for the first time, the potential of using PGM-free catalysts for AEMFCs. More recently, excellent performance has been demonstrated using NiMo/C [25] and NiCu/C [26] as anode catalyst, using the PGM Pd/C as cathode catalyst, showing AEMFC peak power densities of 120 mW cm−2 and 150 mW cm−2, respectively.
The present study deals with the development of the next generation of materials focusing on affordable and abundant catalyst materials for AEMFCs. In particular, three catalysts for the anodic HOR are compared, including: (i) The state-of-the-art 10 wt% Pd/C-CeO2 catalyst [18], (ii) a compositionally equivalent 10 wt% Pd/CeO2 + C catalyst in which a Pd-CeO2 nanocomposite is produced through a one-pot flame spray pyrolysis (FSP) synthesis before mixing with Vulcan XC-72, here denoted as “FSP Pd/CeO2 + C”, and (iii) a nanostructured 50 wt% Ni3Co alloy supported on Vulcan XC-72 (NiCo/C). The AEMFC cathode catalyst consists of Co3O4 prepared by hydrothermal synthesis and later mixed with Vulcan XC-72 (“Co3O4 + C”). The synthesized Pt-free catalysts were comprehensively characterized for their physicochemical properties using X-ray diffraction (XRD), transmission electron microscopy (TEM), and X-ray photoelectron spectroscopy (XPS) techniques. The paper focuses on the initial catalytic performance and kinetics of these catalysts towards HOR or ORR through conventional wet electrochemical methods, as well as their performance when integrated into AEMFC single cells using commercially available gas diffusion layers (GDLs), anion exchange membranes (AEMs) and ionomer. Here, the catalysts are evaluated for their beginning-of-life performance in H2/O2 AEMFCs single cells.
2. Results and Discussion
2.1. Physical Characterization
2.1.1. Physical Characterization of the Co3O4 ORR Catalyst
Figure 1c shows the fitted XRD for the cobalt oxide product phase after heat treatment at 250 °C in air, with fitted diffraction data for the cobalt carbonate precursor presented in the Supplementary Information (Figure S1). It is seen that the cobalt carbonate precursor forms as agglomerated platelets of an individual size of less than 10 µm (Figure 1a). Ball milling breaks up these agglomerates effectively, and it is confirmed that following heat-treatment, a product phase is obtained which comprises FCC nanoparticles in the order of 10–20 nm in size, arranged in highly anisotropic “platelets” which are up to micron-sized in two dimensions, but are only 1–3 particles in thickness (Figure 1b,d). The powder XRD pattern (Figure 1c) confirms that the sample is a single spinel structured Co3O4, with a fitted unit cell parameter of a = 8.0846(8) Å [27]. A volume-weighted crystallite size of 13.5(3) nm was calculated via whole powder pattern fitting of the peak profiles.
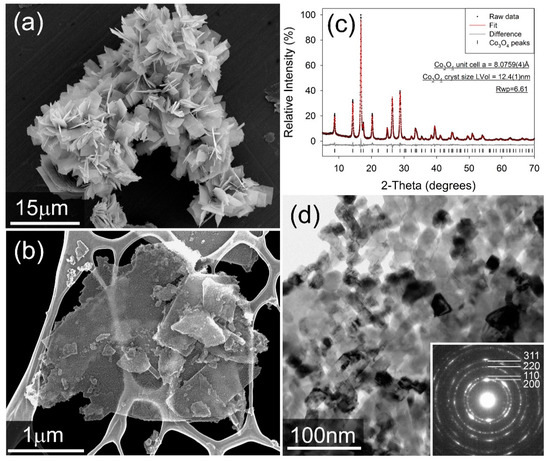
Figure 1.
(a) Secondary electron image of as-made Co2(CO3)OH2. (b) secondary electron image of the milled Co3O4 catalyst. We note that the sample was mounted on a Lacey Carbon TEM grid for imaging. (c) Fitted X-ray diffractogram for the Co3O4 catalyst. Data were collected in capillary transmission mode using a Mo-Kα source and modelled using a Rietveld-type approach. (d) bright-field TEM image of Co3O4 catalyst particles. Inset: Selected-area electron diffraction pattern, showing rings consistent with an FCC lattice.
2.1.2. Physical Characterization of the HOR Catalysts
Figure 2b–g display the annular dark field STEM images and associate chemical maps for the 10 wt% Pd/C-CeO2 catalyst. The catalyst is a mixed composite of crystalline Pd particles of size <10 nm, CeO2 agglomerates in the 10–40 nm size range, and carbon particles of around 50–70 nm. The CeO2 particles and Pd particles appear to be quite well distributed on the carbon support but are not strongly associated with each other.
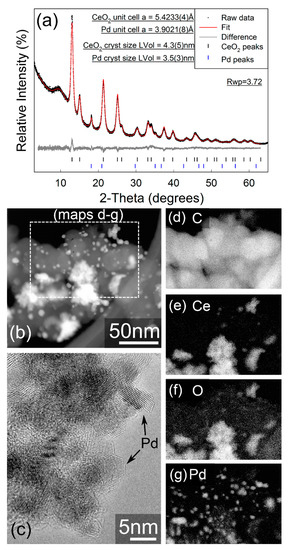
Figure 2.
(a) Fitted X-ray powder diffractogram for Pd/C-CeO2. Data were collected in capillary transmission mode using a Mo-Kα source and modelled using a Rietveld-type approach. The “amorphous bump” at approx. 9° 2θ is due to the Kapton capillary material. (b) Annular dark-field STEM image, (c) high-resolution TEM image showing crystalline Pd particles, (d–g) elemental EDX images acquired within the area indicated in (b). Gamma adjustments were applied in (b,d–g).
In contrast, the STEM imaging and EELS element mapping for the as-synthesized FSP Pd/CeO2 sample (Figure 3b–e) show an extremely even distribution of Pd and CeO2, which is a consequence of the single step FSP synthesis. The FSP sample also demonstrates regions of Pd enrichment which show no apparent crystallinity and are sufficiently small (~1 nm) that it is unclear whether these can even be considered as formal particles, and the Pd in a separate phase to the CeO2. The 10 wt% Pd/C-CeO2 catalyst has previously been characterized by XRD, XAS and other techniques [18,19,20,21]. However, the XRD data for both the 10 wt% Pd/C-CeO2 and as-synthesizes FSP Pd/CeO2 may be compared in Figure 2a and Figure 3a, respectively. For both samples nanocrystalline CeO2 is observed, with calculated crystallite sizes of 4.35(5) nm and 3.08(3) nm calculated for the 10 wt% Pd/C-CeO2 and FSP Pd/CeO2 samples, respectively. Similar unit cell parameters of a = 5.4230(4) Å and a = 5.4263(4) Å are obtained for the CeO2 phase in the two respective samples. For the 10 wt% Pd/C-CeO2 sample, relatively sharp diffraction lines due to crystalline Pd are also observed, which suggests that a portion of the Pd in this sample has a much larger particle/crystallite size than that observed by electron microscopy. No evidence of a crystalline Pd-containing phase is observed in the diffraction data for the FSP Pd/CeO2 sample.
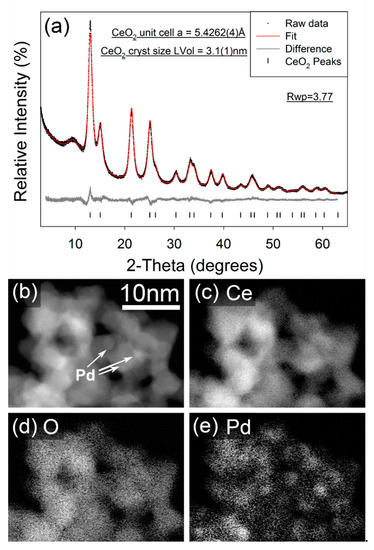
Figure 3.
(a) Fitted X-ray powder diffractograms for FSP synthesized FSP Pd/CeO2. Data were collected in capillary transmission mode using a Mo-Kα source and modelled using a Rietveld-type approach. The “amorphous bump” at ~9° 2-Theta is due to the Kapton capillary material, (b) STEM image, and (c–e) elemental EELS maps from FSP Pd/CeO2.
XPS data are presented in Figure 4a–d, with a summary of the Pd 3d5/2 binding energies presented in Table 1. Both samples show Ce(3d) spectra with binding energies characteristic of both Ce(IV) and Ce(III) species. Based on relative areas a ratio of approximately 70:30 is determined. However, the fitting and quantification of CeO2, especially CeO2 nanoparticles, are known to be challenging and unreliable, due to the heavy peak overlap in the spectra and surface stabilization of Ce(III). This causes a general over-estimation of the Ce(III) content in CeO2 nanomaterials, and can easily lead to misinterpretation of results [28,29]. Consequently, only a limited conclusion is drawn: That there are no significant differences between the Ce spectra of the 10 wt% Pd/C-CeO2 and FSP Pd/CeO2 samples. In contrast, the Pd XPS spectra show marked differences between the samples. The 10 wt% Pd/C-CeO2 Palladium spectrum in Figure 4a can be deconvoluted in terms of three Pd 3d5/2/3d3/2 doublets, while the FSP Pd/CeO2 sample in Figure 4b is predominantly a single doublet, with a small fraction of a second species present.
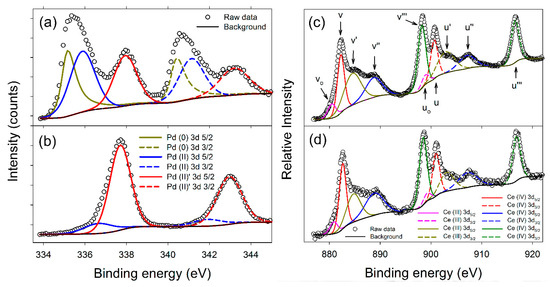
Figure 4.
XPS data for Pd for (a) Pd/C-CeO2, and (b) FSP Pd/CeO2. Lines marked Pd(0), Pd(II) and Pd(II) are assigned respectively to metallic Pd, sub-stoichiometric PdO and super-stoichiometric PdO. XPS data for Ce for (c) Pd/C-CeO2, and (d) FSP Pd/CeO2. To aid comparison with previous work, the commonly used nomenclature of Burroughs et al. [30] was adopted in (c).

Table 1.
Normalized Pd 3d5/2 binding energies for the Pd/C-CeO2 and FSP 18%Pd/CeO2 samples.
Bulk Pd3d5/2 lines are reported in the range Eb(Pd 3d5/2) = 335.1 to 335.4 eV, and bulk PdO values in the range Eb(Pd 3d5/2) = 336.7 to 336.8 eV [31,32]. Following these, the lowest energy line observed in the 10 wt% Pd/C-CeO2 spectrum is assigned to metallic Pd, and the line at Eb = 335.9 eV to a sub-stoichiometric PdO1−x species, due to the shift in binding energy (BE) relative to PdO. The FSP-synthesized FSP Pd/CeO2 shows no evidence of metallic Pd, and only a weak signal which can similarly be attributed to a PdO-type Pd(II) signal (Figure 4b). This peak is broad though, and likely also describes some sub-stoichiometric PdO1−x. Both the 10 wt% Pd/C-CeO2 and FSP Pd/CeO2 samples exhibit strong lines at a higher BE that can be attributed to a PdO type species, and at a similar energy to that for Pd(IV) [33,34]. This line is labelled Pd(II) so as to avoid confusion, as the composition PdO2 is not stable under the conditions of the sample preparation, and the presence of a formal Pd4+ bulk oxide cannot be concluded. Nevertheless, the high BE does indicate a high level of charge transfer from the Pd. Several authors have reported Pd 3d5/2 lines with similar binding energies for supported Pd catalysts [35,36]. Most ascribe the shift to a higher BE to an interaction between the catalyst and CeO2 support, though it is documented that for metallic systems a reduction in particle size at the extreme nano-scale can cause a shift to higher binding energies [37,38].
Figure 5a shows the fitted X-ray diffraction pattern for the PGM-free NiCo/C catalyst after annealing at 500 °C. The diffraction pattern for the sample, prior to annealing, is given in the Supplementary Information (Figure S2). The observed pattern after annealing can be fitted to a FCC unit cell with unit cell parameter a = 3.5306(5) Å, which corresponds well to a composition of approximately Ni0.6Co0.4 [39]. A broad region of unfitted intensity is also evident around the (100) reflection. The position of this correlates with that expected for the hexagonal crystal structure for Co or a Cobalt-rich Co-Ni, though the presence of no well-defined maxima suggests a high level of faulting or structural disorder in the hexagonal fraction. The cubic to hexagonal transformation, and concomitant formation of high stacking fault density is well known in the pure cobalt system [40]. It has also been reported that there is a strong correlation between particle size and the favored crystalline polymorph of Co, with the cubic phase being stable below a particle diameter of ~20 nm and a mixture of hexagonal and cubic phases being favored above that [41]. The NiCo catalyst in this study are spherical in morphology and are dispersed onto the carbon surface. The catalyst particles tend to agglomerate after annealing, resulting in an increased nanoparticle size from 7–10 nm range (pristine) to 15–20 nm (after annealing). The resulting particle size and size distribution of the catalyst after annealing may be seen in the bright and dark field images of NiCo/C (Figure S3). Figure 5b,c further show the HAAD-STEM image, as well as the corresponding STEM-EDX elemental line scan and mapping. The characterization data confirm that the NiCo nanoparticles consist of an alloy of Ni and Co, with the EDS line scan showing relatively homogeneous composition across the particle, with a slight Ni-enrichment suggested at the core. The measured particle composition is slightly more Ni-rich than that suggested by the unit cell parameter calculated from the XRD data. Also observed in the EDS data (but not shown), was the presence of a small amount of phosphorous on the surface of the alloys. Similar results of unpremeditated formation of P dopants and/or impurities were reported elsewhere [42].
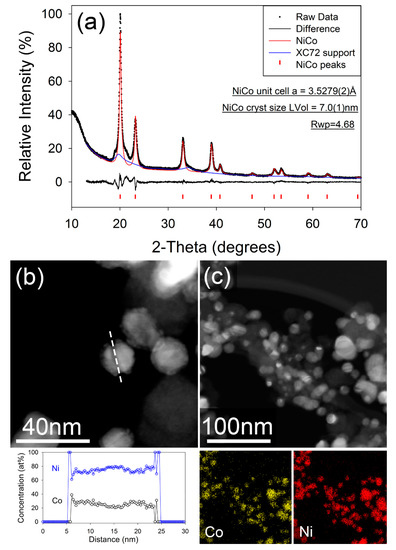
Figure 5.
(a) Fitted X-ray diffraction pattern for NiCo\C after annealing. Data were collected in capillary transmission mode using a Mo-Kα source and modelled using a Rietveld-type approach. (b) Dark field image of annealed NiCo/C nanoparticles, with composition measured along the dashed line. (c) Dark field STEM image of annealed NiCo/C nanoparticles with corresponding X-ray element maps of Co (yellow), and Ni (red).
In order to obtain further information about the surface of the alloy, XPS analysis was carried out. The deconvoluted spectra for both the Ni 2p3/2 and Co 2p3/2 are shown in the Supplementary Information Figure S4. The spectra consist of both Ni and Co at various oxidation states. Ni peaks at binding energies of 852.81 ± 0.1 eV and 854.72 ± 0.1 eV are respectively attributed to metallic Ni0 and Ni2+ in the form of NiO [43]. The line centered at 856.05 ± 0.1 eV could either be due to Ni2O3 or Ni(OH)2 and a shake-up satellite peak at 861.26 ± 0.1 eV are within the reported literature values [44,45]. A small peak at BE 858.66 ± 0.1 eV can be denoted as the peak due to the alloying of Ni with secondary metal [46]. Five peaks are fitted for Co 2p3/2, where the main BE at 781.39 ± 0.1 eV and its ratio with corresponding satellite peak centered at 786.68 ± 0.1 eV indicate a Co3+ oxidation state and/or hydroxide form of Co [47,48]. The peak corresponding to metallic Co is observed at 777.91 ± 0.1 eV, and the two other peaks fitted at 780.66 ± 0.1 eV and 784.11 ± 0.1 eV may be attributed to Co2+ oxide and the Co-Ni interaction [49]. The presence of oxides is unavoidable as the catalysts are stored and handled under ambient conditions. A surface pre-treatment is performed prior to the HOR measurements in half-cell, which is intended to reduce the metallic surface. The reducing environment under H2 in electrolyte should also be a favorable condition to control the surface passivation during the measurements.
2.2. Electrochemical Characterization
2.2.1. RRDE Characterization of Co3O4
Figure 6a shows the cyclic voltammograms (CVs) and the ORR activity of the Co3O4 + C composites compared to Pt/C catalysts in Argon saturated 0.1 M KOH electrolyte. The shape and peak positions of the Pt/C CV is consistent with the literature on Pt/C catalysts in 0.1 M KOH. The two CVs of the Co3O4 catalyst, using two different catalyst loadings, differ considerably from the voltammogram of Pt/C catalyst. Co3O4 show a typical double layer capacitive behavior and the absence of redox reactions. The absence of hydrogen absorption/desorption peaks, as well as Pt oxidation peaks are clear indications that there is no, or a negligible amount of dissolved Pt in the system that may have originated from Pt counter electrode dissolution and redeposition on the working electrode. It has recently been shown, that Pt dissolution of the counter electrode is considerably minimized in an alkaline environment [50]. It is, however, strongly recommended that for long-term measurements, recently recommended best practices are implemented [51].
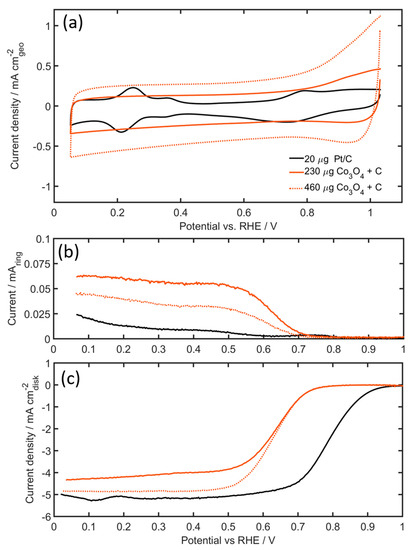
Figure 6.
(a) Cyclic voltammograms of Pt/C and Co3O4 + C (catalyst/carbon ratio = 1.25) in Ar-saturated electrolyte, (b) Rotating ring disk electrode (RRDE) ring current during ORR, and (c) disk current during ORR of Pt/C and Co3O4 + C (catalyst/carbon ratio = 1.25) in O2-saturated electrolyte. Disk current are both iR corrected (using electrochemical impedance spectroscopy (EIS) and background corrected (using CV currents from Figure 6a). All measurements performed in 0.1 M KOH, rotating speed: 1600 rpm, scan rate: 20 mVs−1, using catalyst loadings of 20 µg Pt, 230, and 460 µg of Co3O4.
The current density of the 460 µg Co3O4 electrode is approximately double the magnitude of the current density of the 230 µg Co3O4 electrode, which is consistent with expectations from doubling the electrode mass. Figure 6c shows the ORR activity in O2-saturated 0.1 M KOH solution with an anodic scan sweep taken at a rotating speed of 1600 rpm and at 20 mV s−1. The Pt/C showed the highest ORR onset potential of 0.854 V vs reversible hydrogen electrode (RHE), defined as the potential at 0.1 mA cm−2. Although this value is slightly lower compared to the optimized values of Campos-Roldan et al. [52], the activity is well within the values previously reported in the literature [52]. The PGM-free Co3O4 catalyst shows relatively good catalytic activity towards the ORR, with onset potentials of 0.684 V for both the 460 µg Co3O4 and 230 µg Co3O4 loadings. In these experiments, the addition of more catalyst does not seem to affect the catalytic activity at high potentials. But, the limiting current density increased significantly with the addition of more Co3O4 catalyst. Higher electrode loadings also influence the ring current, resulting in lower peroxide yields (Figure 6b). Calculated from the ring current of the Pt/C electrode, the formation of HO2− by the four-electron reduction of O2 is obvious (electron transfer number of 3.99–3.98 going from high to low potentials). For the Co3O4 catalyst, however, the electron transfer number was lower at ~3.98–3.92 for the 460 µg Co3O4 electrode and ~3.94–3.87 for the 230 µg Co3O4. The mass activity, on the other hand, is considerably lower for Co3O4 catalysts as compared to Pt/C. At 0.85 V the mass activity for the Pt/C is approximately 11 A g−1, whilst both Co3O4 electrodes, independent of the electrode loading, showed mass-activities three orders of magnitude lower than the Pt/C catalysts, in the region of 0.06 A g−1.
2.2.2. RDE Characterization of HOR Catalysts
The catalytic activities of the Pt/C, 10 wt% Pd/C-CeO2, FSP Pd/CeO2 + C and NiCo/C catalysts towards HOR in 0.1M KOH are compared in Figure 7, Figures S5 and S6. Figure 7 shows the currents during a voltammetric scan at 5 mV s−1 in hydrogen-saturated solutions, with the catalysts deposited on a rotating disc electrode (RDE) rotating at 1600 rpm. The catalyst loading was 0.5 mg metal for the NiCo/C catalyst and 0.05 mg for the PGM catalysts.
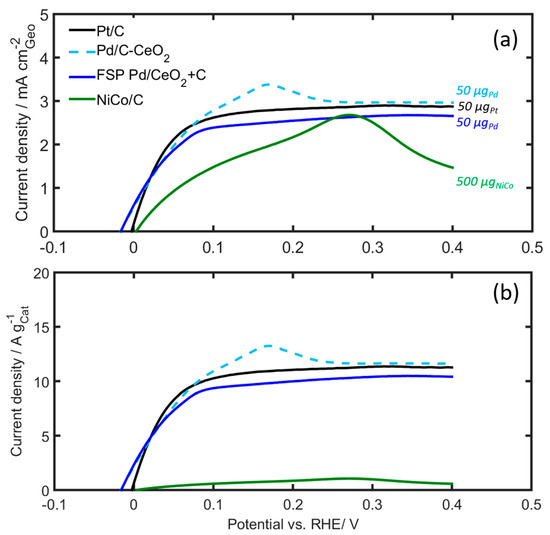
Figure 7.
RDE voltammograms of Pd/C-CeO2, Pd/CeO2 + C and NiCo/C compared to Pt/C in H2-saturated 0.1 M KOH. (a) Geometric current density, and (b) mass specific current density. Scan rate: 5 mV/s, rotating speed: 1600 rpm. The catalyst loading was 500 µg based on NiCo, and 50 µg for the PGM catalysts.
Currents normalized both with respect to the geometric surface area of the electrode (Figure 7a) and the mass of the catalyst deposited on the RDE (Figure 7b) are shown. The current normalized with respect to the geometric surface area is in the same order of magnitude for all catalysts. The Pd/CeO2 catalysts and the Pt/C catalysts display a similar performance overall, including a well-defined limiting current beyond 0.2 V. The current from the 10 wt% Pd/C-CeO2 catalyst, however, overshoots and displays a pronounced peak at 0.15 V, beyond which it decreases to the same limiting current as the FSP Pd/CeO2 + C and Pt/C catalysts. Owing to the much larger mass of the NiCo/C catalyst, the mass activity of this catalyst is much smaller than those of the other catalysts, as shown in Figure 7b.
It is worth noticing that beyond 0.3 V there is a sharp decline in the observed NiCo/C current (see Figure 7a), presumed to be due to reactions forming NiOH and Ni(OH)2 at the catalyst surface, which passivate the surface from further hydrogen oxidation [25,53]. Kabir, S. et al. [25] also observed a HOR current decay at potentials above 0.12 V for NiMo, without reaching the diffusion limiting value as observed for Pt electrodes. This was attributed to the blocking of the Ni surface by α-Ni(OH)2. The authors also performed a micro kinetic model able to reproduce and explain these results. Recently, Davydova et al. [53] studied the stability of Ni3M/C HOR catalysts (M = Co, Fe, Cu, Mo) in alkaline medium, using in situ and ex situ techniques, as well as online ICP-MS. The results showed that no Ni or Co dissolution was observed from Ni/C, Ni3Co/C, still neither of the catalysts was found to be electrochemically active toward the HOR after prolonged potential cycling to a potential higher than 0.3 V vs RHE. The authors attribute these phenomena to a “dissolution−precipitation” mechanism that results in the formation of Ni(OH)2 layered octahedral sheets representing the most thermodynamically favored phase/crystal.
Figure S5 further shows the CVs of the NiCo/C in Ar and H2-saturated solutions in more detail. The voltammograms in the Ar-sparged solutions demonstrate the typical features for bulk Ni [54,55], with forward wave peaking at 0.2 V, representing the formation of α-Ni(OH)2. On the reverse scan the current is small, negative and constant down to approximately 0.15 V, at which point the onset of the reduction of α-Ni(OH)2 appears and results in a cathodic peak at 0.05 V. In the H2-saturated electrolyte, the current increased significantly in the forward scan, which we assign to the oxidation of H2. Here, the current increases until the potential reaches 0.21 V. On the reverse scan in the hydrogen-saturated solution, the current is close to zero in the potential range 0.3 V through 0.15 V, which is a good indication that the working electrode is not contaminated by the possible Pt dissolution from the counter electrode: Any redeposited Pt would have resulted in clear and high H2 oxidation currents. As the potential reaches 0.15 V, an anodic wave appears in the H2-saturated electrolyte, also apparent on the return sweep, peaking at approximately 0.05 V. The onset potential for the anodic wave on the return sweep is approximately the same as that for the reduction of α-Ni(OH)2 in the voltammogram in the argon-saturated solution. We therefore associate the reverse-scan oxidation process with hydrogen oxidation at catalyst surface freed from α-Ni(OH)2 as the potential is decreasing. The reverse-scan hydrogen oxidation wave coincides with the current in the forward sweep as the potential approaches zero.
2.3. AEMFC Results
Figure 8 shows the fuel cell polarization curves and power density curves obtained for the AEMFCs with the Pt-free and PGM-free catalysts. The cells are operated at 70 °C under H2 and O2 gases with controlled dew points of 68 °C and 73 °C for the anode and cathode, respectively. The PGM-free Co3O4 + C shows good performance as a cathode catalyst, when using Pt/C on the anode, and when compared to the PGM-Pt cathode only a 20 mV difference at open circuit voltage (OCV) is observed, and approximately a 35 mV difference at 50 mA cm−2, see also Figure S7. It is noticed that the voltage difference is significantly smaller compared to the RDE measurements in liquid KOH, which shows a 170 mV difference at 10 mA cm−2 (see Figure 6c). Mamlouk et al. [15] reported similar results for their Co-based catalysts, e.g., a 50 mV difference at 50 mA cm−2 between Co-based and Pt ORR catalysts in AEMFC, while observing a 120 mV difference in RDE. Figure 8 further shows that at higher current densities, the cell voltage difference at 0.5 A cm−2 between the two cells is only 110 mV, i.e., 0.7 V and 0.59 V, for the Pt/C and Co3O4 + C cathodes, respectively, clearly showing the potential for utilizing Co3O4 catalysts in AEMFCs cathodes as an alternative to PGM catalysts. The difference in performance is also reflected in the resulting peak power densities (Figure 8b). While the Pt/C-Pt/C cell achieves 593 mW cm−2, the Pt/C-Co3O4 + C cell reaches 388 mW cm−2. This is a AEMFC performance that can be regarded as excellent, especially when compared to other reported performance values using Co-based cathode catalysts [15].
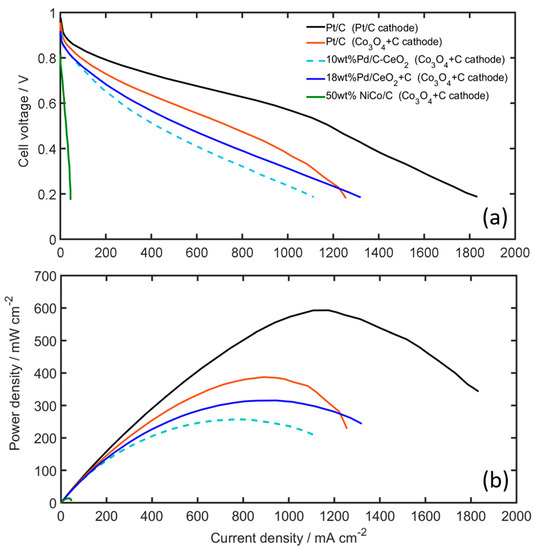
Figure 8.
(a) Polarization, and (b) power density curves of the AEMFC using various anode and cathode catalysts (cathodes are denoted within parenthesis in the legend). Measurements taken at 70 °C, H2 and O2 on anode and cathode, using 1.0 and 0.5 slpm, respectively. Gas dew points are 68 and 73 °C for the anode and cathode, respectively.
For the Pt-free cells using Co3O4 + C cathodes, the difference in performance between FSP Pd/CeO2 + C and 10 wt% Pd/C-CeO2 catalysts is very small (see Figure 8a). At 50 mA cm−2, both Pd-based anodes show a cell voltage of 0.81 V, only 20 mV lower compared to the Pt/C anode. This is more clearly seen in Figure S7, which shows essentially identical mass activities above 0.8 V for these two Pt-free cells. This correlates well with the HOR activities measured in RDE (see Figure S6). At higher current densities the Pd-based AEMFCs also show excellent performance. At 0.5 A cm−2 the Pt/C, FSP Pd/CeO2 + C and 10 wt% Pd/C-CeO2 anodes resulted in cell voltages of 0.59 V, 0.53 V and 0.47 V, and peak power densities of 388, 309, 247 mW cm−2, respectively. It is also noted that the new FSP Pd/CeO2 catalyst synthesized from the one-pot FSP is highly active for HOR in AEMFCs. The performance is comparable or slightly higher than the 10 wt% Pd/C-CeO2, which is considered to be the state-of-the-art Pt-free catalyst for AEMFCs [21]. Figure 8 and Figure S7 also show the performance of the PGM-free AEMFC based on the NiCo/C anode and Co3O4 + C cathode. The totally PGM-free cell achieves a peak power density of 22.1 mWcm−2. Although this is a lower performance compared to the PGM based cells, the performance is in the same order of magnitude compared to other reported values in the literature for similar PGM free cells [23,24]. Comparing our AEMFC result using the NiCo-based anode with the RDE results, it is suggested that the performance of the NiCo AEMFC anode could be limited by mass transfer: While the RDE measurements show the NiCo catalysts having mass activities for the HOR in the same order of magnitude as the PGM-based Pd/CeO2 catalysts, e.g., 0.02 and 0.06 mA mg−1metal at 0.05 V vs RHE, respectively, the mass activity is at least two orders of magnitude lower when the catalyst is used as an AEMFC anode (see Figures S6 and S7). In both cases the NiCo catalyst loading is approximately 10 times the loading of the PGM catalysts, e.g., RDE loadings of 500 µg Ni and 50 µg Pd, and AEMFC anode loadings of 5 mg cm−2 NiCo and 0.5 mg cm−2 Pd. The NiCo is therefore applied in much thicker catalyst layers with longer diffusion distances, which may in turn result in AEMFC anodes more sensitive to electrode flooding in the presence of liquid water [56].
3. Experimental
3.1. Catalyst Synthesis
3.1.1. Synthesis of Co3O4
Synthesis of fine powders of Co3O4 with nanoscale crystallinity was achieved via a modified version of the multi-stage method reported by Zhao-Qing et al. [57]. In the first stage, 90 mL of a 0.1 M (cobalt basis) solution of Cobalt Nitrate hexahydrate (Co(NO3)2·6H2O) and Urea (NH2CONH2) at a molar ratio 1:5 of Co:Urea was placed in a PTFE-lined, 200 mL volume hydrothermal cell. This was reacted at 120 °C for 12 h and cooled to room temperature under ambient room conditions. This yielded a product phase of Co2(CO3)OH2, which was washed with water to remove reaction residues. This powder was then ball-milled using spherical 5 mm zirconia milling media on a roller type mill to break down particle agglomerates. The milled powder was separated from the milling media, dried and decomposed via heat treatment at 250 °C in air to yield a final product phase of Co3O4. The final catalyst was produced at the ink preparation stage via mixing of Co3O4 with Vulcan XC-72 in a 50:50 ratio.
3.1.2. Synthesis of 10 wt% Pd/C-CeO2 by Wet Chemistry
The synthesis and characterization of this state-of-the-art Pd/C-CeO2 has been reported in detail elsewhere [18]. In summary, a composite consisting of C and CeO2 was made by the addition of Vulcan XC-72 to a solution of Ce(NO3)3·6H2O in H2O. The mixture was kept under stirring and sonication, the pH was adjusted to 12 with KOH, and the resulting suspension was stirred for 2 h. The product was separated by filtration and washed with H2O until a neutral pH was obtained. The product was then dried at 65 °C, and subsequently heated under air in a tube furnace at 250 °C for 2 h. Cooling to room temperature was undertaken under a flow of Ar. The C-CeO2 (4 g) composite was then suspended in water (500 mL), stirred vigorously for 30 min and sonicated for 20 min. To this mixture, a solution of K2PdCl4 (1.38 g) in water (60 mL) was slowly added (during ~1 h) under vigorous stirring, followed by addition of an aqueous solution of 2.5 M KOH (8.4 mL). Next, ethanol (50 mL) was added and the resulting mixture was heated at 80 °C for 60 min. The desired product of 10 wt% Pd/C-CeO2 was filtered off, washed several times with distilled water to neutrality, and finally dried under vacuum at 65 °C until constant weight was reached.
3.1.3. Synthesis of FSP Pd/CeO2 + C by Flame Spray Pyrolysis (FSP)
Nanoscale composite powders of Pd/CeO2 were synthesized via single stage flame spray pyrolysis (FSP) of flammable precursor reagents: Appropriate stoichiometric quantities of Palladium Trimethyl Acetate and Cerium (II) 2-ethylhexanoate (49%) in 2-ethylhexanoic acid to produce an 18 wt% Pd/CeO2 mixture were dissolved in xylene at a concentration of 0.13 M (total metals basis). Using a Tethis Nanotech NPS10 FSP unit, this solution was then atomized into a flame under a constant flow of air, which resulted in rapid high temperature combustion and atomization of the metal species. The product phases formed on cooling were collected from the airstream using a PTFE filter with ~0.5 µm pore size. For electrochemical testing the as-synthesized catalyst was mixed with Vulcan XC-72 during ink production. For RDE measurements a 50:50 ratio with XC72 was used, giving a 9.1:50:41.9 ratio of Pd:C:CeO2. For full cell testing a ratio of 55:45 was used, giving a comparable 10:45:45 Pd/C/CeO2 ratio to that of the state-of-the-art (SoA) Pd/C-CeO2 catalyst produced via wet chemistry.
3.1.4. Synthesis of NiCo/C
The synthesis procedure for carbon-supported NiCo nanoparticles was adapted from that reported procedure [58] for the synthesis of monodispersed nickel nanoparticles. Stoichiometric quantities of Nickel (II) acetylacetonate (2.54 mmol), Cobalt (II) acetylacetonate (0.847 mmol) and VXC-72 carbon (200 mg) were mixed in a round-bottomed flask with oleylamine (63.8 mmol) and trioctylphosphine (20.17 mmol), to give a final composition Ni0.75Co0.25 supported on carbon. Under an Ar atmosphere, the mixture was degassed for 30 min at 100 °C, then heated at a rate of 5 °C min−1 to 210 °C and held for 45 min. After cooling to room temperature, the resulting dispersion was washed multiple times with toluene and isopropyl alcohol with centrifugation, with a final wash of toluene and acetone. The resulting fine black powder was dried under vacuum and annealed for 2 h at 500 °C under an atmosphere of 5%H2 in Ar.
3.2. Physical Characterization
3.2.1. XRD
X-ray diffraction was used to evaluate the crystallinity and phase composition of the catalysts and intermediates. Data were collected in transmission capillary mode using a Bruker D8 Advance A25 diffractometer, utilizing a Mo-Kα source, focusing Göbel mirror, and LynxEye XE™ detector. The phases were identified via matching with the ICDD PDF4+ (2017) database, and Whole Powder Pattern Modelling (WPPM) performed with the Bruker DiffracTopas v5 software suite. Crystallite sizes were calculated via the Integral Breadth method within the WPPM. For the carbon-supported NiCo nanoparticle sample, in order to correctly model the contribution of the carbon support, a separate scan was taken of the support, and a structureless model determined. This was included (with scaling) in the fitting of the supported NiCo.
3.2.2. TEM
Catalyst powders were prepared for transmission electron microscopy (TEM) by ultrasonication in isopropanol and dispersion on Cu grids with lacey carbon support film. Imaging was performed using three electron microscopes, a 30 kV, Hitachi S-5500 SEM/STEM, a 200 kV JEOL JEM-2100F and a 200 kV probe/image-corrected JEOL ARM-200F. Spectrum imaging using energy-dispersive X-ray spectroscopy (EDX) was performed on both the ARM-200F and JEM-2100F, and Electron Energy Loss Spectroscopy (EELS) was performed on the ARM-200F.
3.2.3. XPS
The X-ray Photoelectron Spectroscopy (XPS) measurements were recorded on a Kratos Analytical Axis Ultra DLD instrument with a monochromatized Al Kα X-ray source. A pass energy of 160 eV was used for survey scans in the range of 0–1200 eV. Detailed scans were conducted at a pass energy of 20 eV using a step size of 0.1 eV. The measured spectra were analyzed using casa XPS software (version 2.3.19), and a Lorentzian asymmetric (LA) line shape was used for each component. For measurement, the Pd-CeO2 samples were dispersed on a borosilicate glass slide using high purity iso-propanol and were charge-neutralized during measurement using low energy electrons. For the Pd-CeO2 sample binding energies were calibrated to the strong O1s (532.9 eV) line from the silicate substrate, whilst for NiCo adventitious carbon (284.8 eV) was used.
3.3. Rotating Disk Electrode (RDE) Characterization
Electrochemical catalyst characterization was performed using PINE Research RDE equipment. Measurements were performed in a PTFE cell using 0.1 M KOH solutions. A standard single junction Hg/HgO was used as the reference electrode, and a Pt foil was used as the counter electrode. All potentials were corrected to a standard reversible hydrogen electrode (RHE) by experimentally calibrating the Hg/HgO in hydrogen saturated 0.1 M KOH using a Pt electrode. A glassy carbon electrode (5 mm dia., 0.196 cm2 geometrical surface area) embedded in a Teflon tip was used as the working electrode. The electrocatalytic activity of all catalysts was measured using a thin film approach where a catalyst suspension in H2O, isopropyl alcohol and Nafion was drop-cast on the glassy carbon electrode and dried under a flow of Ar gas. For the determination of HOR and ORR activities, 99.999% purity H2, and 99.9999% purity O2 gases were used, respectively. Cycle voltammetry (CV) experiments were recorded using 99.9999% purity Ar. The catalyst inks were prepared by taking an aliquot of 5 mg of the catalyst powder and suspended in a mixture of H2O, isopropyl alcohol (H2O: IPA, 1:1) and 30 µL of a 5.0% w/w lower aliphatic alcohol-water solution of Nafion (EW: 1100, Aldrich). After sonication for 30 min, the suspension (500 μgNi cm−2) was dropped onto the GC electrode and dried at vacuum/nitrogen (N2). Both 10 wt% Pd/C-CeO2, and FSP Pd/CeO2 + C catalyst inks were made in a similar way to NiCo/C, by keeping the loading as 50 μgPd.cm−2. The VXC-72 carbon (50%) was physically mixed with the FSP Pd/CeO2 while making the catalyst ink. For the ORR tests, the working electrode was preconditioned by cyclic sweeps from 0.05 V to 1.03 V vs RHE in an already Ar-purged electrolyte (purged for 30 min) at 100 mV/s for 40 sweeps, and at 10 mV/s for 5 sweeps. The background (capacitance) current was measured at 20 mV/s for 20 sweeps with an electrode rotation of 1600 rpm. EIS measurements between 10 kHz and 1 Hz at 0.5 V vs RHE with an amplitude of 0.01 V were conducted to correct for the iR contribution. Both the background and iR contributions were later subtracted from the raw data. The ORR measurements were carried out 5 times between 1.03 V and 0.05 V vs RHE at 20 mV/s with an electrode rotation of 1600 rpm, and the Pt-ring potential was set to 1.2 V vs RHE. Similarly, for the HOR tests, the working electrodes were preconditioned by cycling the potential between −0.2 and 0.4 V vs RHE for 50 cycles in an Ar-purged electrolyte and kept under an Ar atmosphere at a sweep rate of 20 mV s−1. The Ar atmosphere and the upper potential limit was selected in order to minimize possible effects of surface passivation on the catalysts. After the preconditioning, CVs were collected by sweeping the potential between −0.06 and 0.4V at 1 mVs−1 under similar conditions (argon sparging and atmosphere). The electrolyte was subsequently saturated with H2, and the HOR polarization curves were recorded in the potential range −0.06 through 0.4 V at a scan rate of 1mVs−1 with the electrode rotating at 1600 rpm. The solutions were continuously sparged with H2 during these experiments. In addition, the HOR activity was further assessed by linear sweep voltammetry (LSV) in the hydrogen-saturated electrolyte. For these LSVs the scan rate was 5mVs−1 and the potential range was from −0.06 through 0.4 V. LSVs were recorded at a range of rotation speeds from 400 through 2400 rpm.
3.4. Membrane Electrode Assembly (MEA) Preparation and Evaluation
Gas diffusion layers (GDLs)—GDL340 carbon paper with micro porous layer (MPL) supplied by CeTech Co., Ltd., (Taiwan, China) were selected as GDLs for both anode and cathode sides, similar to those used in our previous study [16]. The GDL properties are summarized in Table 2. The anion exchange membrane (AEM) and ionomer used were AT-1 and aQAPS-S14, respectively (supplied by Hephas Energy Co., (China). The AT-1 membrane with a thickness of 30–40 µm in the dry form has a specific ion conductivity of ca. 0.1 S cm−1 at 60 °C. The main structure of AT-1 membrane and aQAPS-S-14 ionomer contains quaternary ammonium groups, enabling the bonding of polysulfone backbone via CH2 bridges and the attachment of hydrophobic side chains onto the backbone to obtain the ion-aggregating structure [59].
Table 2.
Physical properties of GDL340.
The catalyst ink was prepared by blending the corresponding catalyst powders with 20 wt% aQAPS-S14 ionomer (2 wt% DMF). The catalyst and ionomer were mixed with deionized (DI) water and isopropyl alcohol (IPA) with a volume ratio of 1:1 as dispersant/solvent, according to previous ink compositions and preparation methods [60]. For the FSP Pd/CeO2 and Co3O4 catalysts, 50 wt% carbon supports (Vulcan XC-72) was added during catalyst ink preparation to form Co3O4 + C and Pd/CeO2 + C composites, respectively. As an example, a typical FSP Pd/CeO2 + C catalyst ink preparation was made by mixing 29.6 mg carbon dispersed into 865 mg DI water and sonicated for 30 min. An amount of 36.1 mg of 18 wt% Pd/CeO2 was then added to the carbon dispersion and sonicated for an additional 30 min. Then, 657 mg of ionomer was added to the suspension, followed by adding 865 mg IPA. The mixture was sonicated for 60 min before spray coating it onto a 13 cm2 GDL340 surface on a hot plate pre-heated at 80 °C. For comparative purposes, an MEA prepared with 40% Pt/C (Tanaka) on both anode and cathode was also prepared. The catalyst loadings of each AEMFC are presented in Table 3.
Table 3.
Anode and cathode composition of tested membrane electrode assemblies (MEAs).
In order to ion exchange the membranes into the hydroxide form, the as-received membranes were pre-treated by soaking in 1 M KOH for at least 48 h at 60 °C. The prepared gas diffusion electrodes (GDEs) were also dipped in 1 M KOH solution for 24 h before the assembly of the AEMFC. Finally, the AT-1 AEM was sandwiched with two prepared GDEs with 10.24 cm−2 active area. The obtained MEAs were sandwiched between two graphite plates with triple serpentine flow fields (1 mm channel width and height, 1.5 mm land width) and gold-coated copper current collector plates, 250–300 µm thick Teflon gaskets, and compressed using 1.47 N m of torque to each of the eight screws. A fuel cell testing system (FCED-PD50 test station, Asia Pacific Fuel Cell Technologies, Ltd.) was employed. The polarization curves were recorded while operating the cell under 1.0 and 0.5 slpm of H2 and O2, respectively.
4. Conclusions
This paper presents our research progress in developing Pt-free and PGM-free catalysts used in AEMFCs. Non-noble Co3O4 catalysts with nanoscale crystallinity and an anisotropic platelet morphology have been synthesized via a scalable process. Although less active compared to the PGM-based Pt/C catalyst according to the RRDE experiments, these Co3O4 catalysts show an excellent AEMFC performance, with only a 100 mV decrease at 0.5 A cm−2 measured relative to Pt/C.
The scalable FSP synthesis of an extremely active nano-scaled Pd/CeO2 material is also reported. This material shows no apparent Pd crystallinity and extremely small (~1 nm) Pd nanoparticles. The XPS data of the FSP-synthesized Pd/CeO2 shows no evidence of metallic Pd, and only a weak signal which may be attributed to a PdO-type Pd(II). Although not conclusively proven, the FSP Pd/CeO2 may present Pd4+ bulk oxide and/or some interaction between the catalyst and CeO2 support. Nevertheless, the FSP Pd/CeO2 + C catalyst showed consistently excellent catalytic activity towards the HOR, performing just as well as, or better than, the state-of-the-art 10 wt% Pd/C-CeO2 catalyst in both RDE and AEMFC measurements. AEMFC tests using FSP Pd/CeO2 + C and Co3O4/C as the anode and cathode catalysts, respectively, achieved a peak power density as high as 308 mW cm−2.
Monodispersed NiCo nanoparticles supported on carbon (NiCo/C) are shown to perform in the same order of magnitude as for the Pt and Pd based HOR catalysts in RDE below 0.3 V. However, beyond 0.3 V there is a sharp decline in the NiCo/C current, presumably owing to reactions forming NiOH and Ni(OH)2 at the catalyst surface as previously reported. In the AEMFC, however, the NiCo/C catalysts showed two orders of magnitude lower performance with respect to the PGM-based catalysts. It is likely to be due to uneven reaction rates in the much thicker catalytic layer in the fuel cell causing severe mass transfer effects in the electrode. The use of such PGM-free catalysts in real AEMFCs may require higher catalysts loadings, naturally resulting in thicker catalysts layers, and hence it is important that further development in PGM-free HOR catalysts not only considers catalytic activity, but also electrode composition, morphology, as well as operating AEMFC conditions when evaluating catalysts for this application.
Supplementary Materials
The following are available online at https://www.mdpi.com/1996-1073/13/3/582/s1.
Author Contributions
Conceptualization, V.M.T., J.R.T., J.S. and M.M.; methodology, J.R.T., J.S., and M.M.; validation, V.M.T., J.R.T., J.S. and M.M.; investigation, V.M.T., J.R.T., J.S. and M.M.; resources, H.A.M., H.Y., D.R.D., S.S. and A.O.B.; data curation, A.O.B. and J.R.T.; writing—original draft preparation, A.O.B., J.R.T., M.M. and H.Y.; writing—review & editing, A.O.B. and J.R.T.; supervision, A.O.B., S.S., H.Y. and D.R.D.; project administration, A.O.B.; funding acquisition, A.O.B., S.S.,H.Y. and D.R.D. All authors have read and agreed to the published version of the manuscript.
Funding
Financial support from the Research Council of Norway, NEXTGAME project number 259554. This work was further funded by the Ministry of Science and Technology of Taiwan under the grant of MOST-105-2923-E-005-001-MY3, and supported in part by the Ministry of Education, Taiwan, R.O.C. under the Higher Education Sprout Project. Furthermore, the work was partially funded by the Nancy & Stephan Grand Technion Energy Program (GTEP); by the European Union’s Horizon 2020 research and innovation program (grant No. 721065); by the Ministry of Science, Technology & Space of Israel through the M.Era-NET Transnational Call 2015, NEXTGAME project [grant No. 3-12940] and through grant No. 3-12948; by the Israel Science Foundation (ISF) (grant No. 1481/17); by the Ministry of National Infrastructure, Energy and Water Resources of Israel (grant No. 3-13671), by the Melvyn & Carolyn Miller Fund for Innovation, as well as the support of Planning & Budgeting Committee/ISRAEL Council for Higher Education (CHE) and Fuel Choice Initiative (Prime Minister Office of ISRAEL), within the framework of “Israel National Research Center for Electrochemical Propulsion (INREP).
Acknowledgments
The Norwegian Fuel Cell and Hydrogen Centre and ENERSENSE Norway is greatly acknowledged for the support. Øystein Dahl is acknowledged for assistance in collection and analysis of the XPS data.
Conflicts of Interest
The authors declare no conflicts of interest.
References
- Varcoe, J.R.; Atanassov, P.; Dekel, D.R.; Herring, A.M.; Hickner, M.A.; Kohl, P.A.; Kucernak, A.R.; Mustain, W.E.; Nijmeijer, K.; Scott, K.; et al. Anion-exchange membranes in electrochemical energy systems. Energy Environ. Sci. 2014, 7, 3135–3191. [Google Scholar] [CrossRef]
- Gottesfeld, S.; Dekel, D.R.; Page, M.; Bae, C.; Yan, Y.; Zelenay, P.; Kim, Y.S. Anion exchange membrane fuel cells: Current status and remaining challenges. J. Power Sources 2018, 375, 170–184. [Google Scholar] [CrossRef]
- Burchardt, T.; Gouérec, P.; Sanchez-Cortezon, E.; Karichev, Z.; Miners, J.H. Alkaline fuel cells: Contemporary advancement and limitations. Fuel 2002, 81, 2151–2155. [Google Scholar] [CrossRef]
- Kostowskyj, M.A.; Gilliam, R.J.; Kirk, D.W.; Thorpe, S.J. Silver nanowire catalysts for alkaline fuel cells. Int. J. Hydrogen Energy 2008, 33, 5773–5778. [Google Scholar] [CrossRef]
- Osgood, H.; Devaguptapu, S.V.; Xu, H.; Cho, J.; Wu, G. Transition metal (Fe, Co, Ni, and Mn) oxides for oxygen reduction and evolution bifunctional catalysts in alkaline media. Nano Today 2016, 11, 601–625. [Google Scholar] [CrossRef]
- Xin, L.; Wang, Z.; Qi, J.; Li, W. Carbon supported Ag nanoparticles as high performance cathode catalyst for H2/O2 anion exchange membrane fuel cell. Front. Chem. 2013, 16, 1–5. [Google Scholar] [CrossRef] [PubMed]
- Dekel, D.R. Alkaline Membrane Fuel Cell (AMFC) Materials and System Improvement—State-of-the-Art. ECS Trans. 2013, 50, 2051–2052. [Google Scholar] [CrossRef]
- Erikson, H.; Sarapuu, A.; Tammeveski, K. Oxygen Reduction Reaction on Silver Catalysts in Alkaline Media: A Minireview. ChemElectroChem 2019, 6, 73–86. [Google Scholar] [CrossRef]
- Zhao, S.; Yan, L.; Luo, H.; Mustain, W.; Xu, H. Recent progress and perspectives of bifunctional oxygen reduction/evolution catatalyst development for regenerative anion exchange membrane fuel cells. Nano Energy 2018, 47, 172–198. [Google Scholar] [CrossRef]
- Durst, J.; Siebel, A.; Simon, C.; Hasche, F.; Herranz, J.; Gasteiger, H. New insights into the electrochemical hydrogen oxidation and evolution reaction mechanism. Energy Environ. Sci. 2014, 7, 2255–2260. [Google Scholar] [CrossRef]
- Dekel, D.R. Unraveling mysteries of hydrogen electrooxidation in anion exchange membrane fuel cells. Curr. Opin. Electrochem. 2018, 12, 182–188. [Google Scholar] [CrossRef]
- Xu, J.; Gao, P.; Zhao, T. Non-precious Co3O4 nano-rod electrocatalyst for oxygen reduction reaction in anion-exchange membrane fuel cells. Energy Environ. Sci. 2012, 5, 5333–5339. [Google Scholar] [CrossRef]
- Wang, D.-C.; Huang, N.-B.; Sun, Y.; Zhan, S.; Zhang, J.-J. GO clad Co3O4 (Co3O4@GO) as ORR catalyst of anion exchange membrane fuel cell. Int. J. Hydrogen Energy 2017, 42, 20216–20223. [Google Scholar] [CrossRef]
- Liang, Y.; Li, Y.; Wang, H.; Zhou, J.; Wang, J.; Regier, T.; Dai, H. Co3O4 nanocrystals on graphene as a synergistic catalyst for oxygen reduction reaction. Nat. Mater. 2011, 10, 780. [Google Scholar] [CrossRef] [PubMed]
- Mamlouk, M.; Kumar, S.S.; Gouerec, P.; Scott, K. Electrochemical and fuel cell evaluation of Co based catalyst for oxygen reduction in anion exchange polymer membrane fuel cells. J. Power Sources 2011, 196, 7594–7600. [Google Scholar] [CrossRef]
- Truong, V.M.; Wang, C.-L.; Yang, M.; Yang, H. Effect of tunable hydrophobic level in the gas diffusion substrate and microporous layer on anion exchange membrane fuel cells. J. Power Sources 2018, 402, 301–310. [Google Scholar] [CrossRef]
- Davydova, E.S.; Mukerjee, S.; Jaouen, F.; Dekel, D.R. Electrocatalysts for hydrogen oxidation reaction in alkaline electrolytes. ACS Catal. 2018, 8, 6665–6690. [Google Scholar] [CrossRef]
- Miller, H.A.; Lavacchi, A.; Vizza, F.; Marelli, M.; Di Benedetto, F.; D’Acapito, F.; Paska, Y.; Page, M.; Dekel, D.R. A Pd/C-CeO2 Anode Catalyst for High-Performance Platinum-Free Anion Exchange Membrane Fuel Cells. Angew. Chem. Int. Ed. 2016, 55, 6004–6007. [Google Scholar] [CrossRef]
- Alesker, M.; Page, M.; Shviro, M.; Paska, Y.; Gershinsky, G.; Dekel, D.R.; Zitoun, D. Palladium/nickel bifunctional electrocatalyst for hydrogen oxidation reaction in alkaline membrane fuel cell. J. Power Sources 2016, 304, 332–339. [Google Scholar] [CrossRef]
- Dekel, D.R. Review of cell performance in anion exchange membrane fuel cells. J. Power Sources 2018, 375, 158–169. [Google Scholar] [CrossRef]
- Omasta, T.J.; Peng, X.; Miller, H.A.; Vizza, F.; Wang, L.; Varcoe, J.R.; Dekel, D.R.; Mustain, W.E. Beyond 1.0 W cm−2 performance without platinum: The beginning of a new era in anion exchange membrane fuel cells. J. Electrochem. Soc. 2018, 165, J3039–J3044. [Google Scholar] [CrossRef]
- Davydova, E.; Zaffran, J.; Dhaka, K.; Toroker, M.; Dekel, D. Hydrogen Oxidation on Ni-Based Electrocatalysts: The Effect of Metal Doping. Catalysts 2018, 8, 454. [Google Scholar] [CrossRef]
- Lu, S.; Pan, J.; Huang, A.; Zhuang, L.; Lu, J. Alkaline polymer electrolyte fuel cells completely free from noble metal catalysts. Proc. Natl. Acad. Sci. USA 2008, 105, 20611–20614. [Google Scholar] [CrossRef]
- Hu, Q.; Li, G.; Pan, J.; Tan, L.; Lu, J.; Zhuang, L. Alkaline polymer electrolyte fuel cell with Ni-based anode and Co-based cathode. Int. J. Hydrogen Energy 2013, 38, 16264–16268. [Google Scholar] [CrossRef]
- Kabir, S.; Lemire, K.; Artyushkova, K.; Roy, A.; Odgaard, M.; Schlueter, D.; Oshchepkov, A.; Bonnefont, A.; Savinova, E.; Sabarirajan, D.C. Platinum group metal-free NiMo hydrogen oxidation catalysts: High performance and durability in alkaline exchange membrane fuel cells. J. Mater. Chem. A 2017, 5, 24433–24443. [Google Scholar] [CrossRef]
- Roy, A.; Talarposhti, M.R.; Normile, S.J.; Zenyuk, I.V.; De Andrade, V.; Artyushkova, K.; Serov, A.; Atanassov, P. Nickel–copper supported on a carbon black hydrogen oxidation catalyst integrated into an anion-exchange membrane fuel cell. Sustain. Energy Fuels 2018, 2, 2268–2275. [Google Scholar] [CrossRef]
- Knop, O.; Reid, K.; Sutarno; Nakagawa, Y. Chalkogenides of the transition elements. VI. X-Ray, neutron, and magnetic investigation of the spinels Co3O4, NiCo2O4, Co3S4, and NiCo2S4. Can. J. Chem. 1968, 46, 3463–3476. [Google Scholar] [CrossRef]
- Ivanov, V.K.; Shcherbakov, A.B.; Usatenko, A. Structure-sensitive properties and biomedical applications of nanodispersed cerium dioxide. Russ. Chem. Rev. 2009, 78, 855. [Google Scholar] [CrossRef]
- Paparazzo, E. On the curve-fitting of XPS Ce(3d) spectra of cerium oxides. Mater. Res. Bull. 2011, 46, 323–326. [Google Scholar] [CrossRef]
- Burroughs, P.; Hamnett, A.; Orchard, A.F.; Thornton, G. Satellite structure in the X-ray photoelectron spectra of some binary and mixed oxides of lanthanum and cerium. J. Chem. Soc. Dalton Trans. 1976, 17, 1686–1698. [Google Scholar] [CrossRef]
- Sharma, S.; Mukri, B.D.; Hegde, M. Direct evidence of redox interaction between metal ion and support oxide in Ce0.98Pd0.02O2−δ by a combined electrochemical and XPS study. Dalton Trans. 2011, 40, 11480–11489. [Google Scholar] [CrossRef] [PubMed]
- Brun, M.; Berthet, A.; Bertolini, J. XPS, AES and Auger parameter of Pd and PdO. J. Electron Spectrosc. Relat. Phenom. 1999, 104, 55–60. [Google Scholar] [CrossRef]
- Shafeev, G.; Themlin, J.M.; Bellard, L.; Marine, W.; Cros, A. Enhanced adherence of area-selective electroless metal plating on insulators. J. Vac. Sci. Technol. A Vac. Surf. Film. 1996, 14, 319–326. [Google Scholar] [CrossRef]
- Kim, K.S.; Gossmann, A.; Winograd, N. X-ray photoelectron spectroscopic studies of palladium oxides and the palladium-oxygen electrode. Anal. Chem. 1974, 46, 197–200. [Google Scholar] [CrossRef]
- Li, L.; Zhang, N.; He, H.; Zhang, G.; Song, L.; Qiu, W. Shape-controlled synthesis of Pd nanocrystals with exposed {110} facets and their catalytic applications. Catal. Today 2019, 327, 28–36. [Google Scholar] [CrossRef]
- Priolkar, K.; Bera, P.; Sarode, P.; Hegde, M.; Emura, S.; Kumashiro, R.; Lalla, N. Formation of Ce1−xPdxO2−δ Solid Solution in Combustion-Synthesized Pd/CeO2 Catalyst: XRD, XPS, and EXAFS Investigation. Chem. Mater. 2002, 14, 2120–2128. [Google Scholar] [CrossRef]
- Mason, M.; Gerenser, L.; Lee, S.-T. Electronic structure of catalytic metal clusters studied by X-ray photoemission spectroscopy. Phys. Rev. Lett. 1977, 39, 288. [Google Scholar] [CrossRef]
- Zhou, W.P.; Lewera, A.; Larsen, R.; Masel, R.I.; Bagus, P.S.; Wieckowski, A. Size effects in electronic and catalytic properties of unsupported palladium nanoparticles in electrooxidation of formic acid. J. Phys. Chem. B 2006, 110, 13393–13398. [Google Scholar] [CrossRef]
- Nishizawa, T.; Ishida, K. The Co−Ni (Cobalt-Nickel) system. Bull. Alloy Phase Diagr. 1983, 4, 390–395. [Google Scholar] [CrossRef]
- Houska, C.R.; Averbach, B.L.; Cohen, M. The cobalt transformation. Acta Metall. 1960, 8, 81–87. [Google Scholar] [CrossRef]
- Kitakami, O.; Sato, H.; Shimada, Y.; Sato, F.; Tanaka, M. Size Effect on the Crystal Phase of Cobalt Fine. Phys. Rev. B 1997, 56, 13849. [Google Scholar] [CrossRef]
- Moreau, L.M.; Ha, D.-H.; Bealing, C.R.; Zhang, H.; Hennig, R.G.; Robinson, R.D. Unintended phosphorus doping of nickel nanoparticles during synthesis with TOP: A discovery through structural analysis. Nano Lett. 2012, 12, 4530–4539. [Google Scholar] [CrossRef] [PubMed]
- Grosvenor, A.P.; Biesinger, M.C.; Smart, R.S.C.; McIntyre, N.S. New interpretations of XPS spectra of nickel metal and oxides. Surf. Sci. 2006, 600, 1771–1779. [Google Scholar] [CrossRef]
- Roberts, M.W.; Smart, R.S.C. The defect structure of nickel oxide surfaces as revealed by photoelectron spectroscopy. J. Chem. Soc. Faraday Trans. 1 Phys. Chem. Condens. Phases 1984, 80, 2957–2968. [Google Scholar] [CrossRef]
- Carley, A.; Jackson, S.; O’shea, J.; Roberts, M. The formation and characterisation of Ni3+—an X-ray photoelectron spectroscopic investigation of potassium-doped Ni (110)–O. Surf. Sci. 1999, 440, L868–L874. [Google Scholar] [CrossRef]
- Li-Shing, H.; Williams, R.S. Electronic-structure study of the NiGa and the NiIn intermetallic compounds using X-ray photoemission spectroscopy. J. Phys. Chem. Solids 1994, 55, 305–312. [Google Scholar] [CrossRef]
- McIntyre, N.; Cook, M. X-ray photoelectron studies on some oxides and hydroxides of cobalt, nickel, and copper. Anal. Chem. 1975, 47, 2208–2213. [Google Scholar] [CrossRef]
- Schenck, C.; Dillard, J.; Murray, J. Surface analysis and the adsorption of Co (II) on goethite. J. Colloid Interface Sci. 1983, 95, 398–409. [Google Scholar] [CrossRef]
- Chuang, T.; Brundle, C.; Rice, D. Interpretation of the x-ray photoemission spectra of cobalt oxides and cobalt oxide surfaces. Surf. Sci. 1976, 59, 413–429. [Google Scholar] [CrossRef]
- Chen, R.; Yang, C.; Cai, W.; Wang, H.-Y.; Miao, J.; Zhang, L.; Chen, S.; Liu, B. Use of Platinum as the Counter Electrode to Study the Activity of Nonprecious Metal Catalysts for the Hydrogen Evolution Reaction. ACS Energy Lett. 2017, 2, 1070–1075. [Google Scholar] [CrossRef]
- Chen, J.G.; Jones, C.W.; Linic, S.; Stamenkovic, V.R. Best Practices in Pursuit of Topics in Heterogeneous Electrocatalysis. ACS Catal. 2017, 7, 6392–6393. [Google Scholar] [CrossRef]
- Campos-Roldán, C.; González-Huerta, R.; Alonso-Vante, N. Experimental protocol for HOR and ORR in alkaline electrochemical measurements. J. Electrochem. Soc. 2018, 165, J3001–J3007. [Google Scholar] [CrossRef]
- Davydova, E.S.; Speck, F.D.; Paul, M.T.Y.; Dekel, D.R.; Cherevko, S. Stability Limits of Ni-Based Hydrogen Oxidation Electrocatalysts for Anion Exchange Membrane Fuel Cells. ACS Catal. 2019, 9, 6837–6845. [Google Scholar] [CrossRef]
- Alsabet, M.; Grden, M.; Jerkiewicz, G. Electrochemical growth of surface oxides on nickel. Part 1: Formation of α-Ni(OH)2 in relation to the polarization potential, polarization time, and temperature. Electrocatalysis 2011, 2, 317–330. [Google Scholar] [CrossRef]
- Alsabet, M.; Grdeń, M.; Jerkiewicz, G. Electrochemical growth of surface oxides on nickel. Part 3: Formation of β-NiOOH in relation to the polarization potential, polarization time, and temperature. Electrocatalysis 2015, 6, 60–71. [Google Scholar] [CrossRef]
- Darab, M.; Barnett, A.O.; Lindbergh, G.; Thomassen, M.S.; Sunde, S. The influence of catalyst layer thickness on the performance and degradation of PEM fuel cell cathodes with constant catalyst loading. Electrochim. Acta 2017, 232, 505–516. [Google Scholar] [CrossRef]
- Liu, Z.-Q.; Xu, Q.-Z.; Wang, J.-Y.; Li, N.; Guo, S.-H.; Su, Y.-Z.; Wang, H.-J.; Zhang, J.-H.; Chen, S. Facile hydrothermal synthesis of urchin-like NiCo2O4 spheres as efficient electrocatalysts for oxygen reduction reaction. Int. J. Hydrogen Energy 2013, 38, 6657–6662. [Google Scholar] [CrossRef]
- Carenco, S.; Boissiere, C.; Nicole, L.; Sanchez, C.; Le Floch, P.; Mézailles, N. Controlled design of size-tunable monodisperse nickel nanoparticles. Chem. Mater. 2010, 22, 1340–1349. [Google Scholar] [CrossRef]
- Pan, J.; Chen, C.; Li, Y.; Wang, L.; Tan, L.; Li, G.; Tang, X.; Xiao, L.; Lu, J.; Zhuang, L. Constructing ionic highway in alkaline polymer electrolytes. Energy Environ. Sci. 2014, 7, 354–360. [Google Scholar] [CrossRef]
- Lindström, R.W.; Kortsdottir, K.; Wesselmark, M.; Oyarce, A.; Lagergren, C.; Lindbergh, G. Active Area Determination of Porous Pt Electrodes Used in Polymer Electrolyte Fuel Cells: Temperature and Humidity Effects. J. Electrochem. Soc. 2010, 157, B1795–B1801. [Google Scholar] [CrossRef]


© 2020 by the authors. Licensee MDPI, Basel, Switzerland. This article is an open access article distributed under the terms and conditions of the Creative Commons Attribution (CC BY) license (http://creativecommons.org/licenses/by/4.0/).