1. Introduction
Over the last years, the integration of power electronic-based renewable generation has greatly increased. This penetration of renewables means that control and protection principles currently used in electrical power systems, which are mainly based on the traditional behavior of synchronous generator, have to be checked. This review must aim to maintain the same operation security standards that are accomplished today. One of the aspects to be analyzed is protection relays performance because of the different current contribution to short circuit between renewable generation based on power electronics (PE) and conventional synchronous generation. Additionally, it is expected that the penetration of renewable energies based on PE will be increased during the coming years in a strong commitment of reduce the effects of the climate change. This increase of the renewable energy penetration may reach digits near to 100% by 2050 at least in some zones of the network [
1,
2].
Present protection algorithms implemented in protection relays are mostly based on the high current injection provided by traditional synchronous generators during short circuit conditions. Nevertheless, fault current contribution coming from renewable energies is very different than traditional synchronous generation due to thermal limits of power electronics. This thermal limit is needed for a relay fast limitation of the current, in just two or three cycles, during a short circuit condition to avoid damage in the converters, which causes a very low current contribution in comparison to the synchronous generation [
3,
4,
5]. Since most of the implemented protection functions in transmission and distribution grids consider the current to detect the fault condition (overcurrent, distance, line differential, pilot schemes…), it seems obvious that this fast reduction of the current may cause problems in the fault detection.
Some studies have analyzed the impact that renewable energies based on PE may cause in traditional protection system behavior from a theoretical point of view and using traditional simulation analysis [
6,
7,
8,
9,
10]. Focusing on distance protection in high PE penetration systems, [
11,
12,
13,
14,
15,
16] show different adaptive settings approaches but they are only focused on solving under-reach or over-reach problems associated to renewable generation and does not take into account missed trips due to directional or phase selection errors. Furthermore, [
14,
15,
16] only analyzes current contribution under balanced fault. However, protection relay manufacturers are quite suspicious (as it is completely logical) to reveal how exactly their algorithms are implemented, especially for their more complex algorithms such as distance protection, which includes different types of equations that evaluate the impedance, faulted phase selection, directionality, threshold comparisons, sequence quantities assessment, etc. Due to this reason, a theoretical or traditional simulation analysis could not be enough to discover the potential challenges that protection systems will have to handle in a near-future scenario with increasing penetration of renewable energies and PE.
RTDS (Real-Time Digital Simulator) study with hardware in the loop analysis is presented in this study as a very powerful tool to make a further analysis of present protection relays behavior under a high penetration of renewables. RTDS allows to model in detail renewable generators and electrical networks under study so that the physical protection relays are able to measure currents and voltages as if they were in the real power system. Additionally, it is possible to apply fault studies automatically, gather the results, providing a fast diagnosis of the behavior of the protection algorithms under a high penetration of renewable energies.
This paper shows the process followed to analyze power electronic-based renewable generation on distance protection and propose a new algorithm that solves the malfunctioning of such protections under the analyzed scenario. The first phase of the study conducted an empirical analysis to discover possible problems in present commercial protection relays due to the current contribution to the fault from renewable energy sources and especially from generators connected to the grid through a full converter (i.e., PV generators and type 4 WT). Problems with faulted phase selection and directionality were found in the real-time tests.
In addition, this paper justifies the difference in the behavior of faulted phase selection of the protection relays with synchronous generation and with full converter wind turbines, also called type-4 WT, current contribution not only in a quite numerous protection tests, but also using a theoretical analysis about what is happening to the protection algorithm during current injection to the fault by renewable energy source.
Therefore, in order to perform this theoretical study and compare in detail the behavior of protection algorithms between traditional synchronous and renewable generator current injection, a widely used protection method was used. This selected method was the superimposed quantities theory.
Finally, a proposal for a new algorithm that is able to fix the issues observed is developed. This algorithm, which accounts with the theoretical analysis and real-time digital simulation tests applied to commercial protection relays, is presented as a solution to improve the behavior of distance protection under a scenario of high penetration of renewable energies while its behavior with traditional synchronous generation grid is also suitable.
2. Analysis of Commercial Protection Devices before a 100% Renewable Generation Scenario
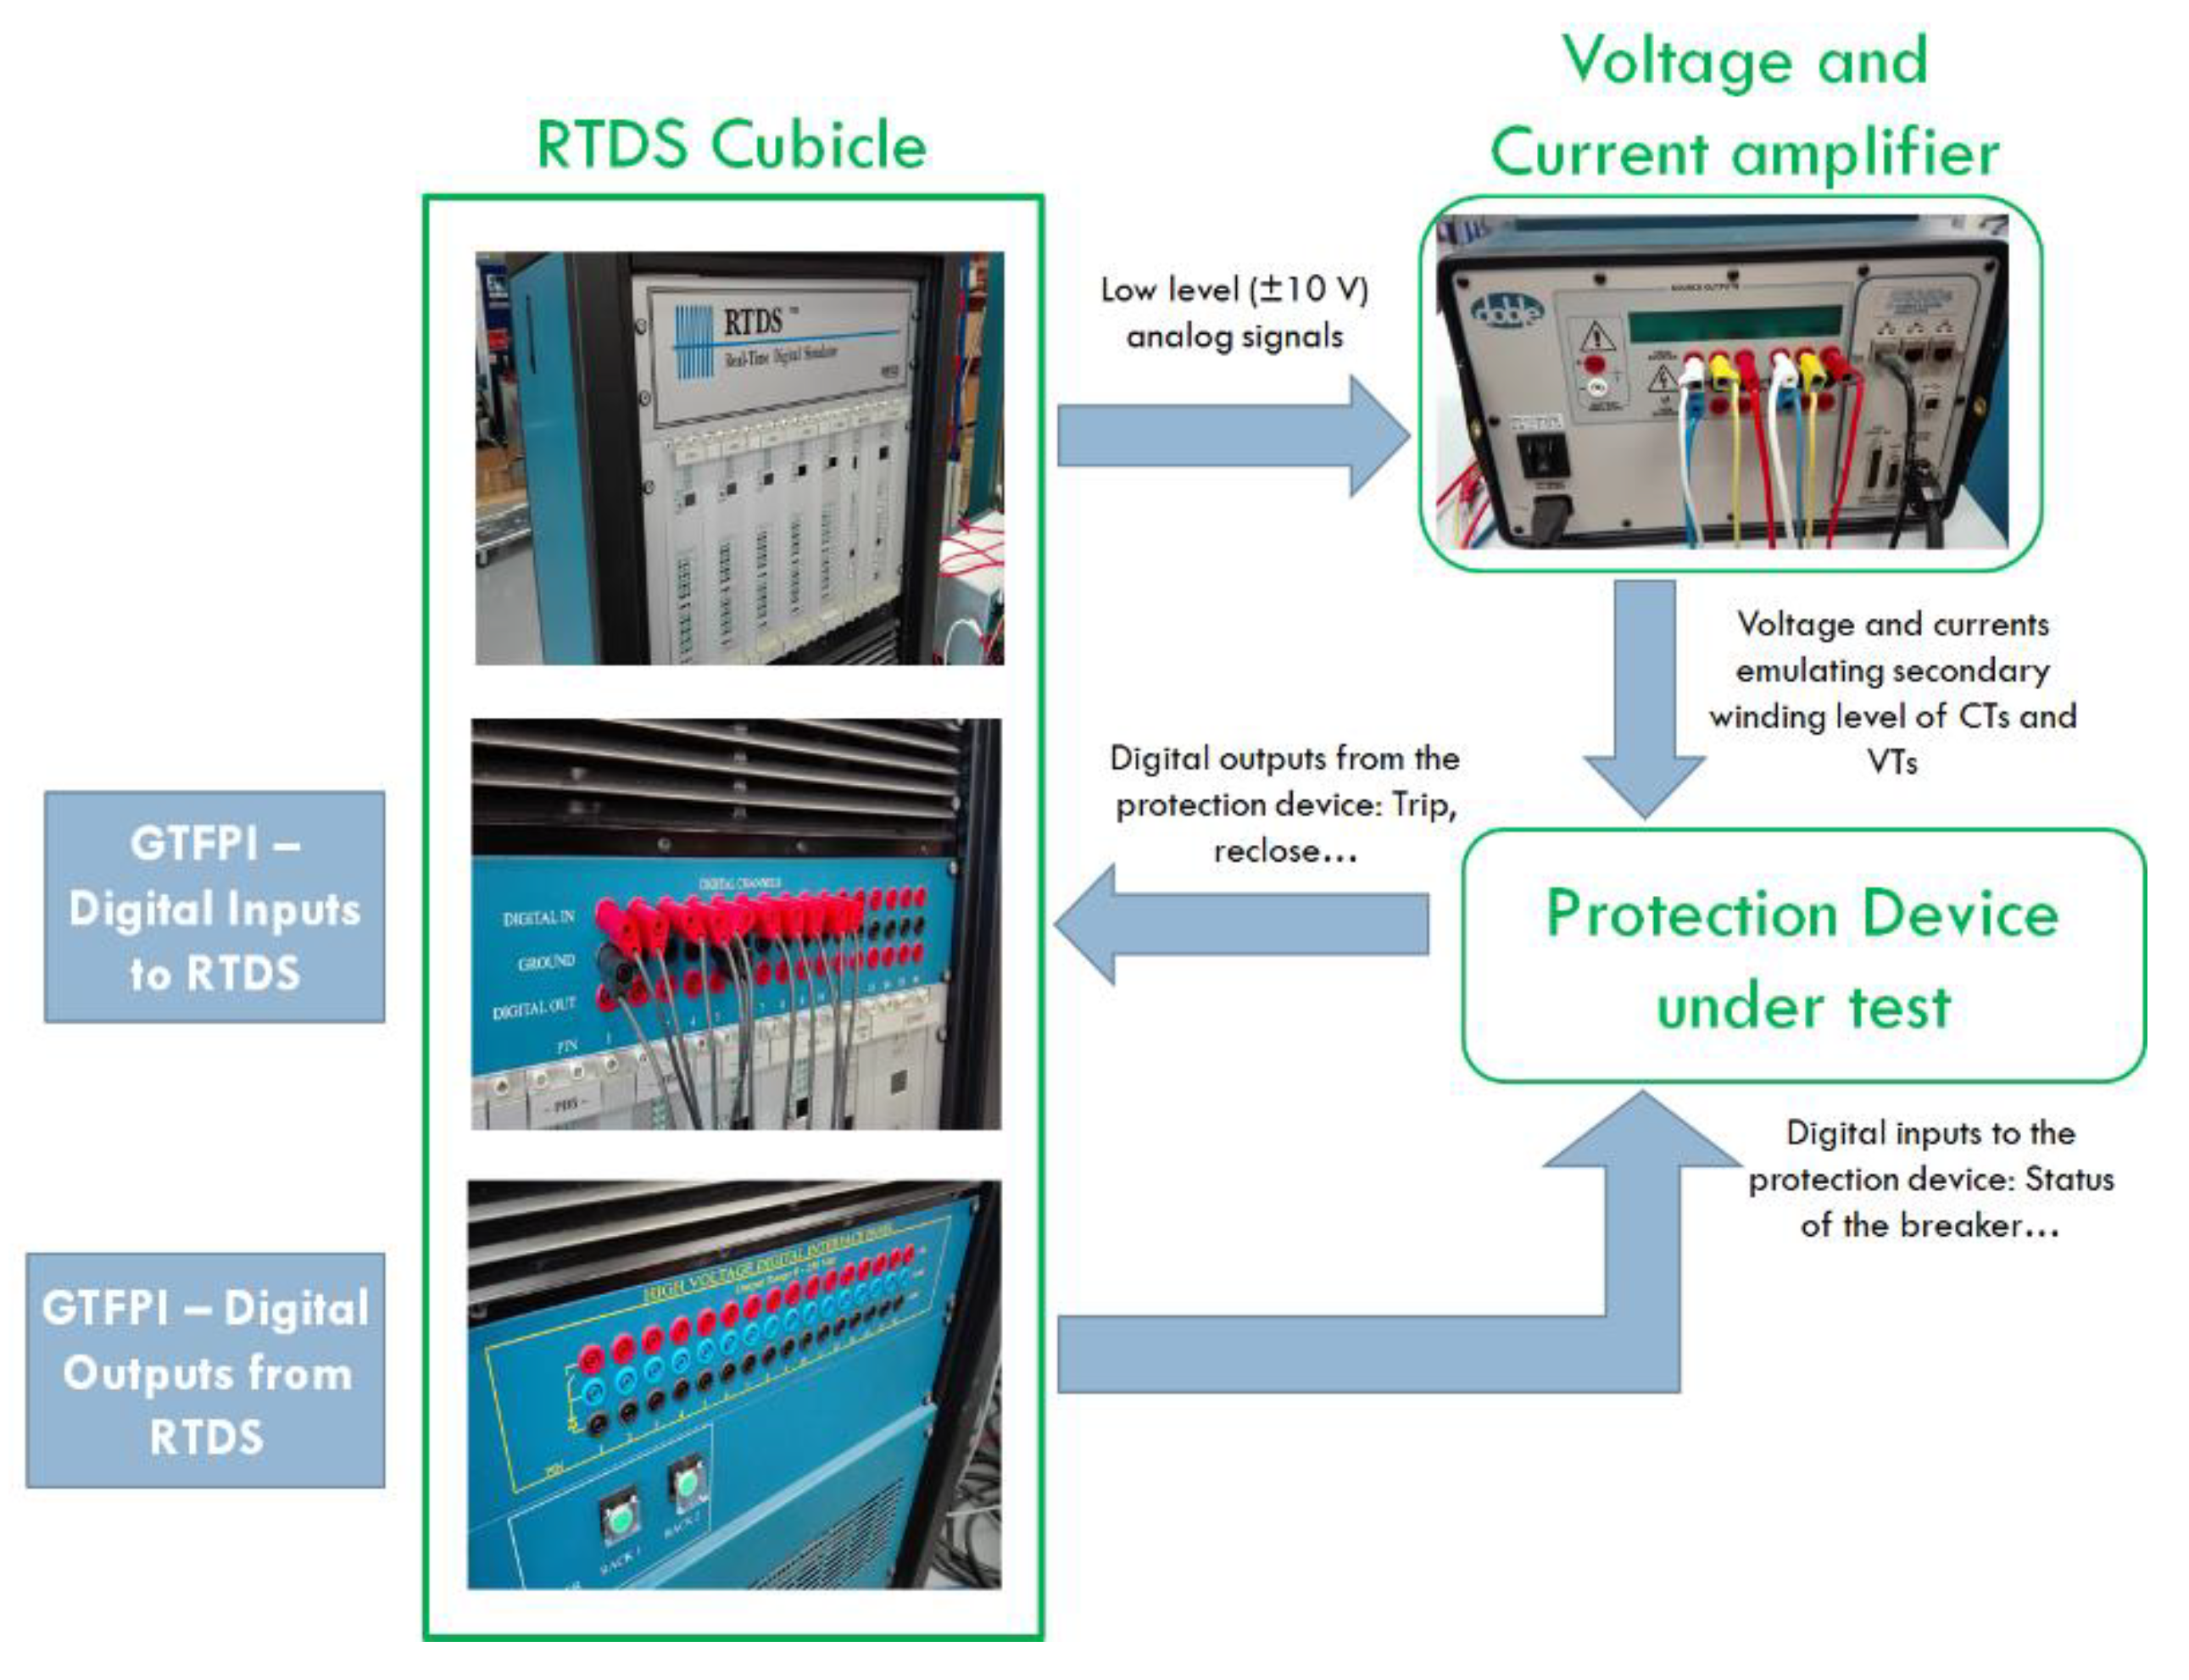
The analysis of commercial protection devices has been performed by using the hardware in the loop connection between RTDS, amplifiers, and protection devices as shown in
Figure 1. RTDS allows to study, in real time, the behavior of a physical protection relay in laboratory as if the relay was connected in a real substation. Power system is entirely modelled in RTDS, which runs the Electromagnetic Transient (EMT) simulation in real time, sending analogic signals to the protection relay (voltage and currents) using amplifiers and receiving the digital signals from the protection (trip, reclose…) so that the dynamic performance of the real protection can be studied in the simulated scenario.
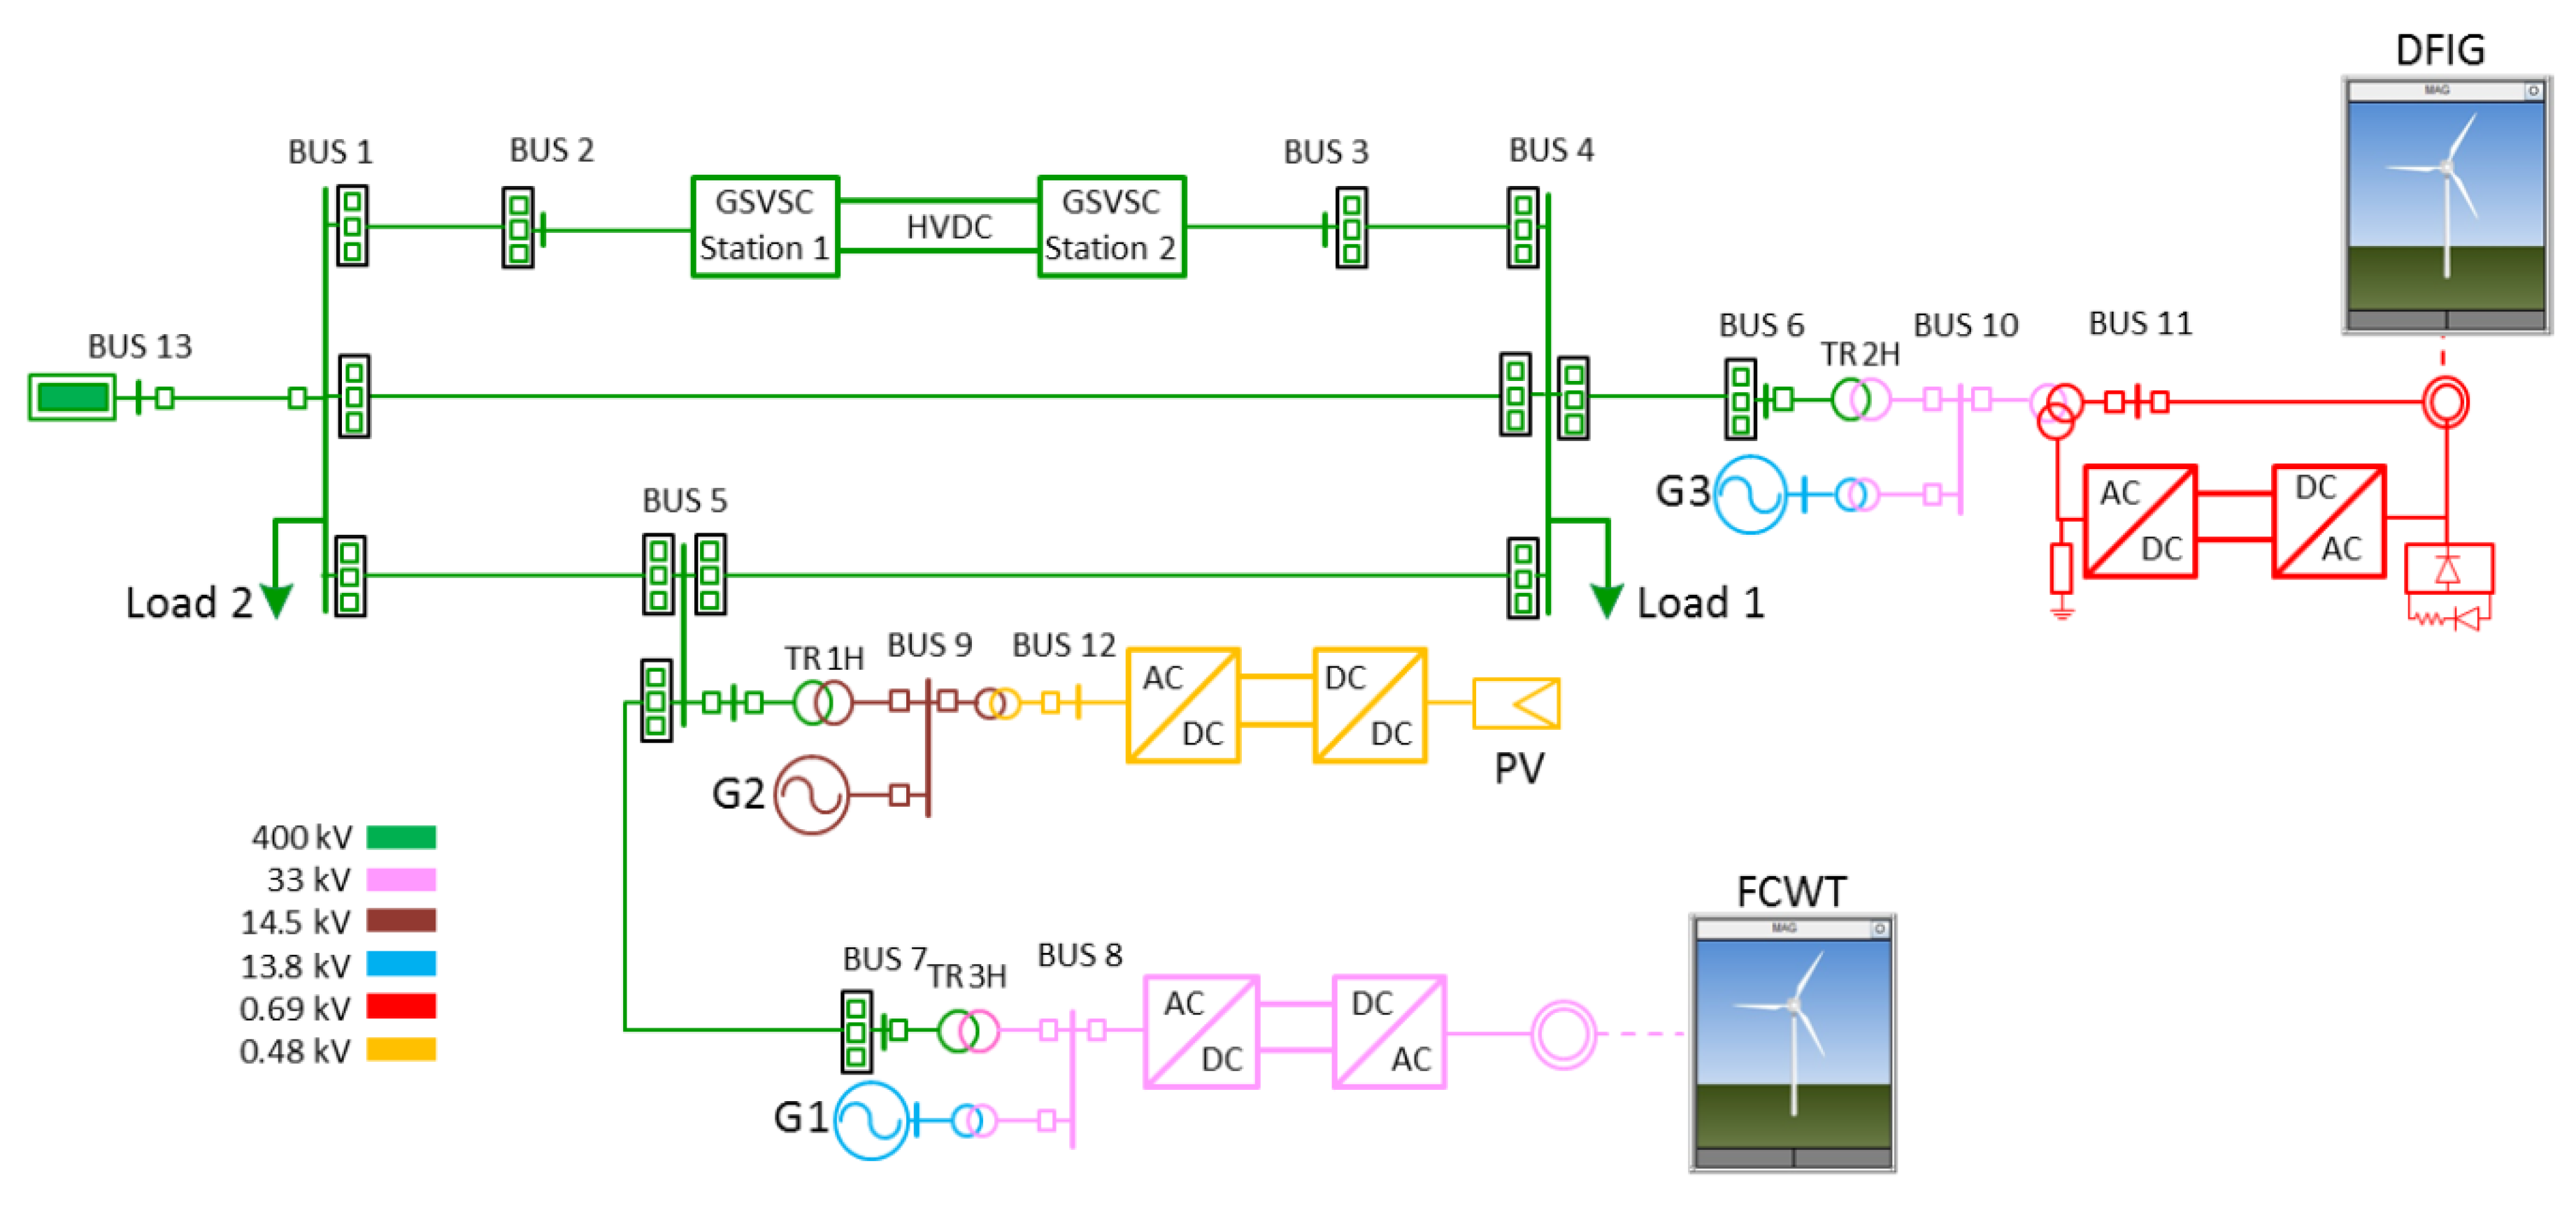
Figure 2 shows the system modelled to carry out the hardware in the loop tests. It is based on an IEEE-PRSC benchmark network and includes different renewable generators and PE devices: a HVDC line between bus 2 and 3, a Type-3 WT connected in bus 10, a Type-4 WT connected to bus 8 and a PV generator at bus 9. G1 and G3 are conventional SGs that will be disconnected to check the 100% renewable generation scenario. These models are represented as aggregated with the option of increasing their generation level.
Bus 13 is the grid equivalent that represents connection of the simulated area to an external grid and it behaves as a slack bus for the simulation. This grid equivalent provides the voltage reference for the renewable generator models (Type 3 and Type 4 WT and PV generator) and HVDC, since these converters are grid-following, and consume the excess of power provided by each renewable generator and not consumed by the loads.
The protection relays operation has been evaluated in two lines selected (line 5–7 and line 4–5) to check the influence of PE on its performance. The current in these lines comes from the renewable generators connected. These are the selected lines:
Line 5–7 tests allow to analyze the behavior of distance protection before Type 4 WT current injection. Protection under study is located at Bus 7 side of the line and measured fault current is supplied only by the Type 4 WT.
Line 4–5 tests allow to analyze the behavior of distance protection before PV generator current injection. During these tests, line 1–5 and Type 4 WT are disconnected, and the current contribution measured by protection located at bus 5 only will come from PV generator.
These tests were made taking into account:
- ○
Four commercial protections have been tested
- ○
Different fault locations, with faults applied within zone 1 and zone 2 of distance protection.
- ○
Different installed power in Type-4 WT: 40 MW and 200 MW.
- ○
Different types of fault: Single line to ground (SLG), line to line (LL), line to line to ground (LLG) and three phase faults (LLL).
- ○
In distance protection tests, solid faults were applied to avoid well-known classical problems associated to overreach/underreach operation of this function with resistive faults.
- ○
Type 4 WT and PV generator current contribution are symmetrical even in the case of asymmetrical faults. No negative sequence current is provided by these generators during the fault [
17,
18,
19,
20,
21].
SGs connected to Bus 8 and Bus 10 were used to validate distance protection relay settings, which were calculated according to present standards of TSO companies. The same tests were repeated in the 100% renewable generation scenario to compare results and check if present protection criteria and principles are still valid under the increasing penetration of renewable energies.
2.1. Percentage of Missed Trips
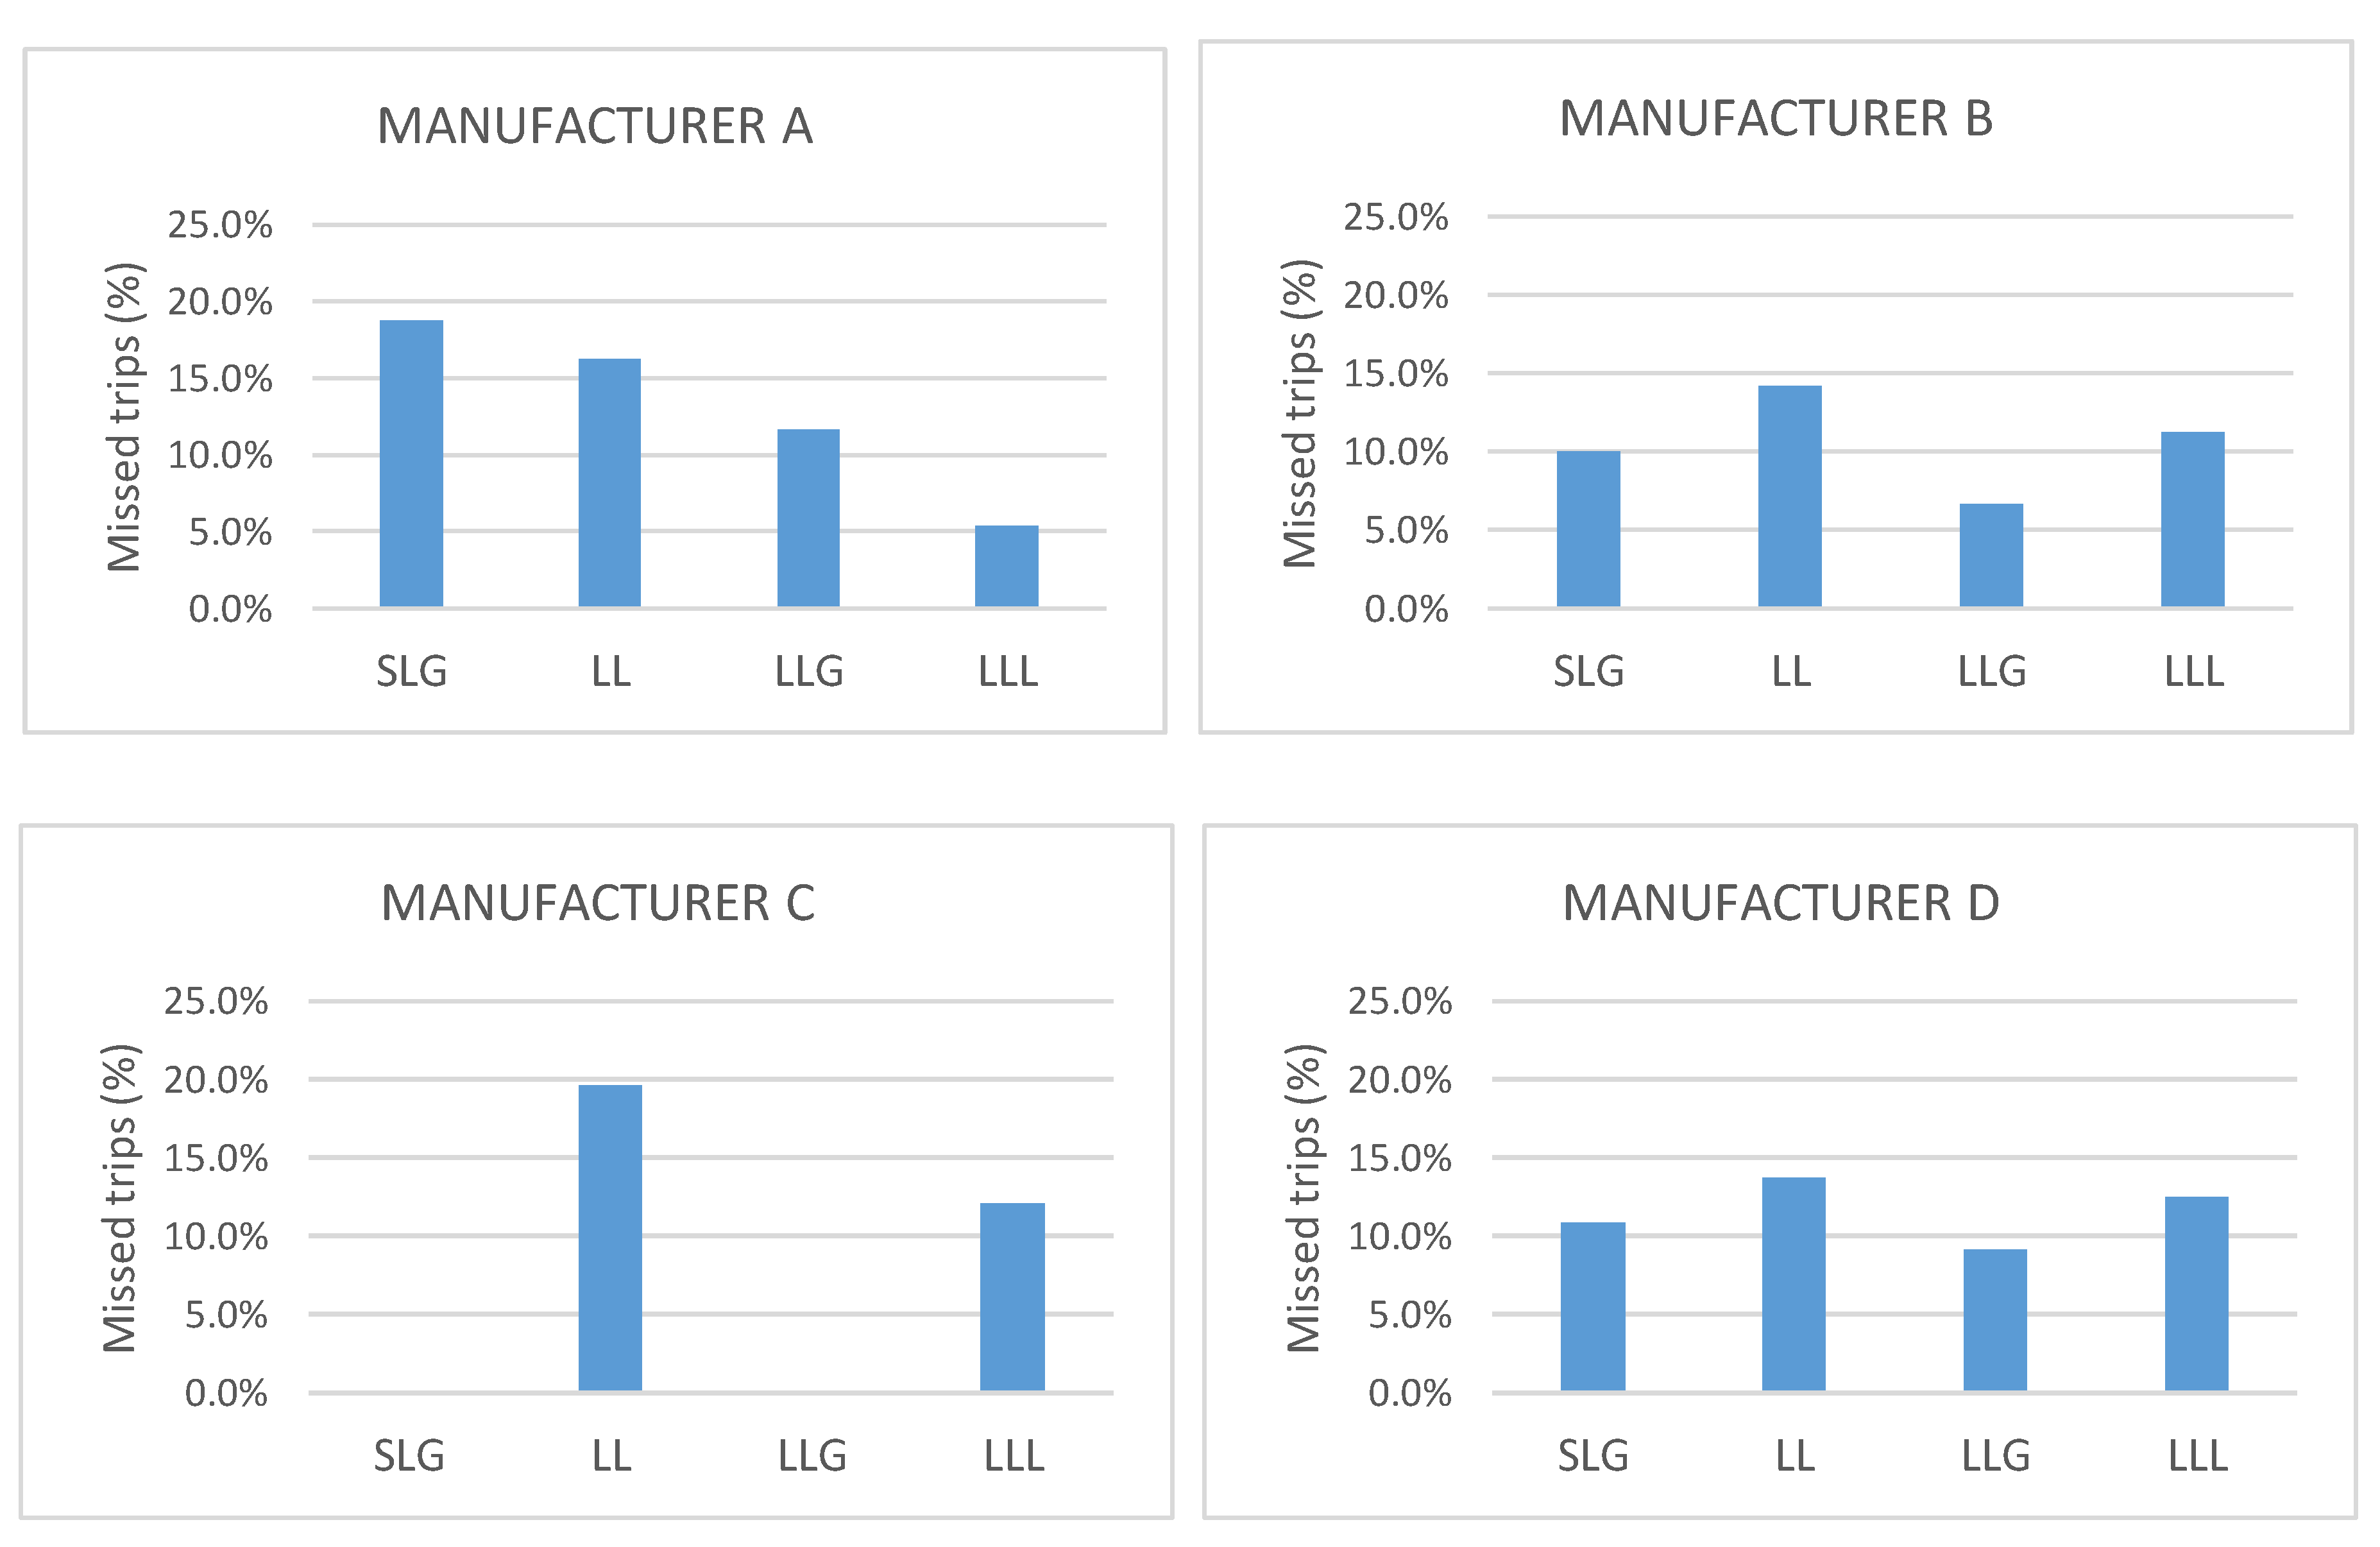
In order to check the performance of distance relay protection, 672 experiments have been performed, 336 tests to check protection behavior before Type 4 WTG current contribution and 336 tests for PV current contribution. This section shows the analysis of missed trips obtained from these experiments, understanding missed trip as no generation of trip signal when a fault that appears in the grid that should be tripped by the protection function under study (in this case, the distance protection).
Figure 3 and
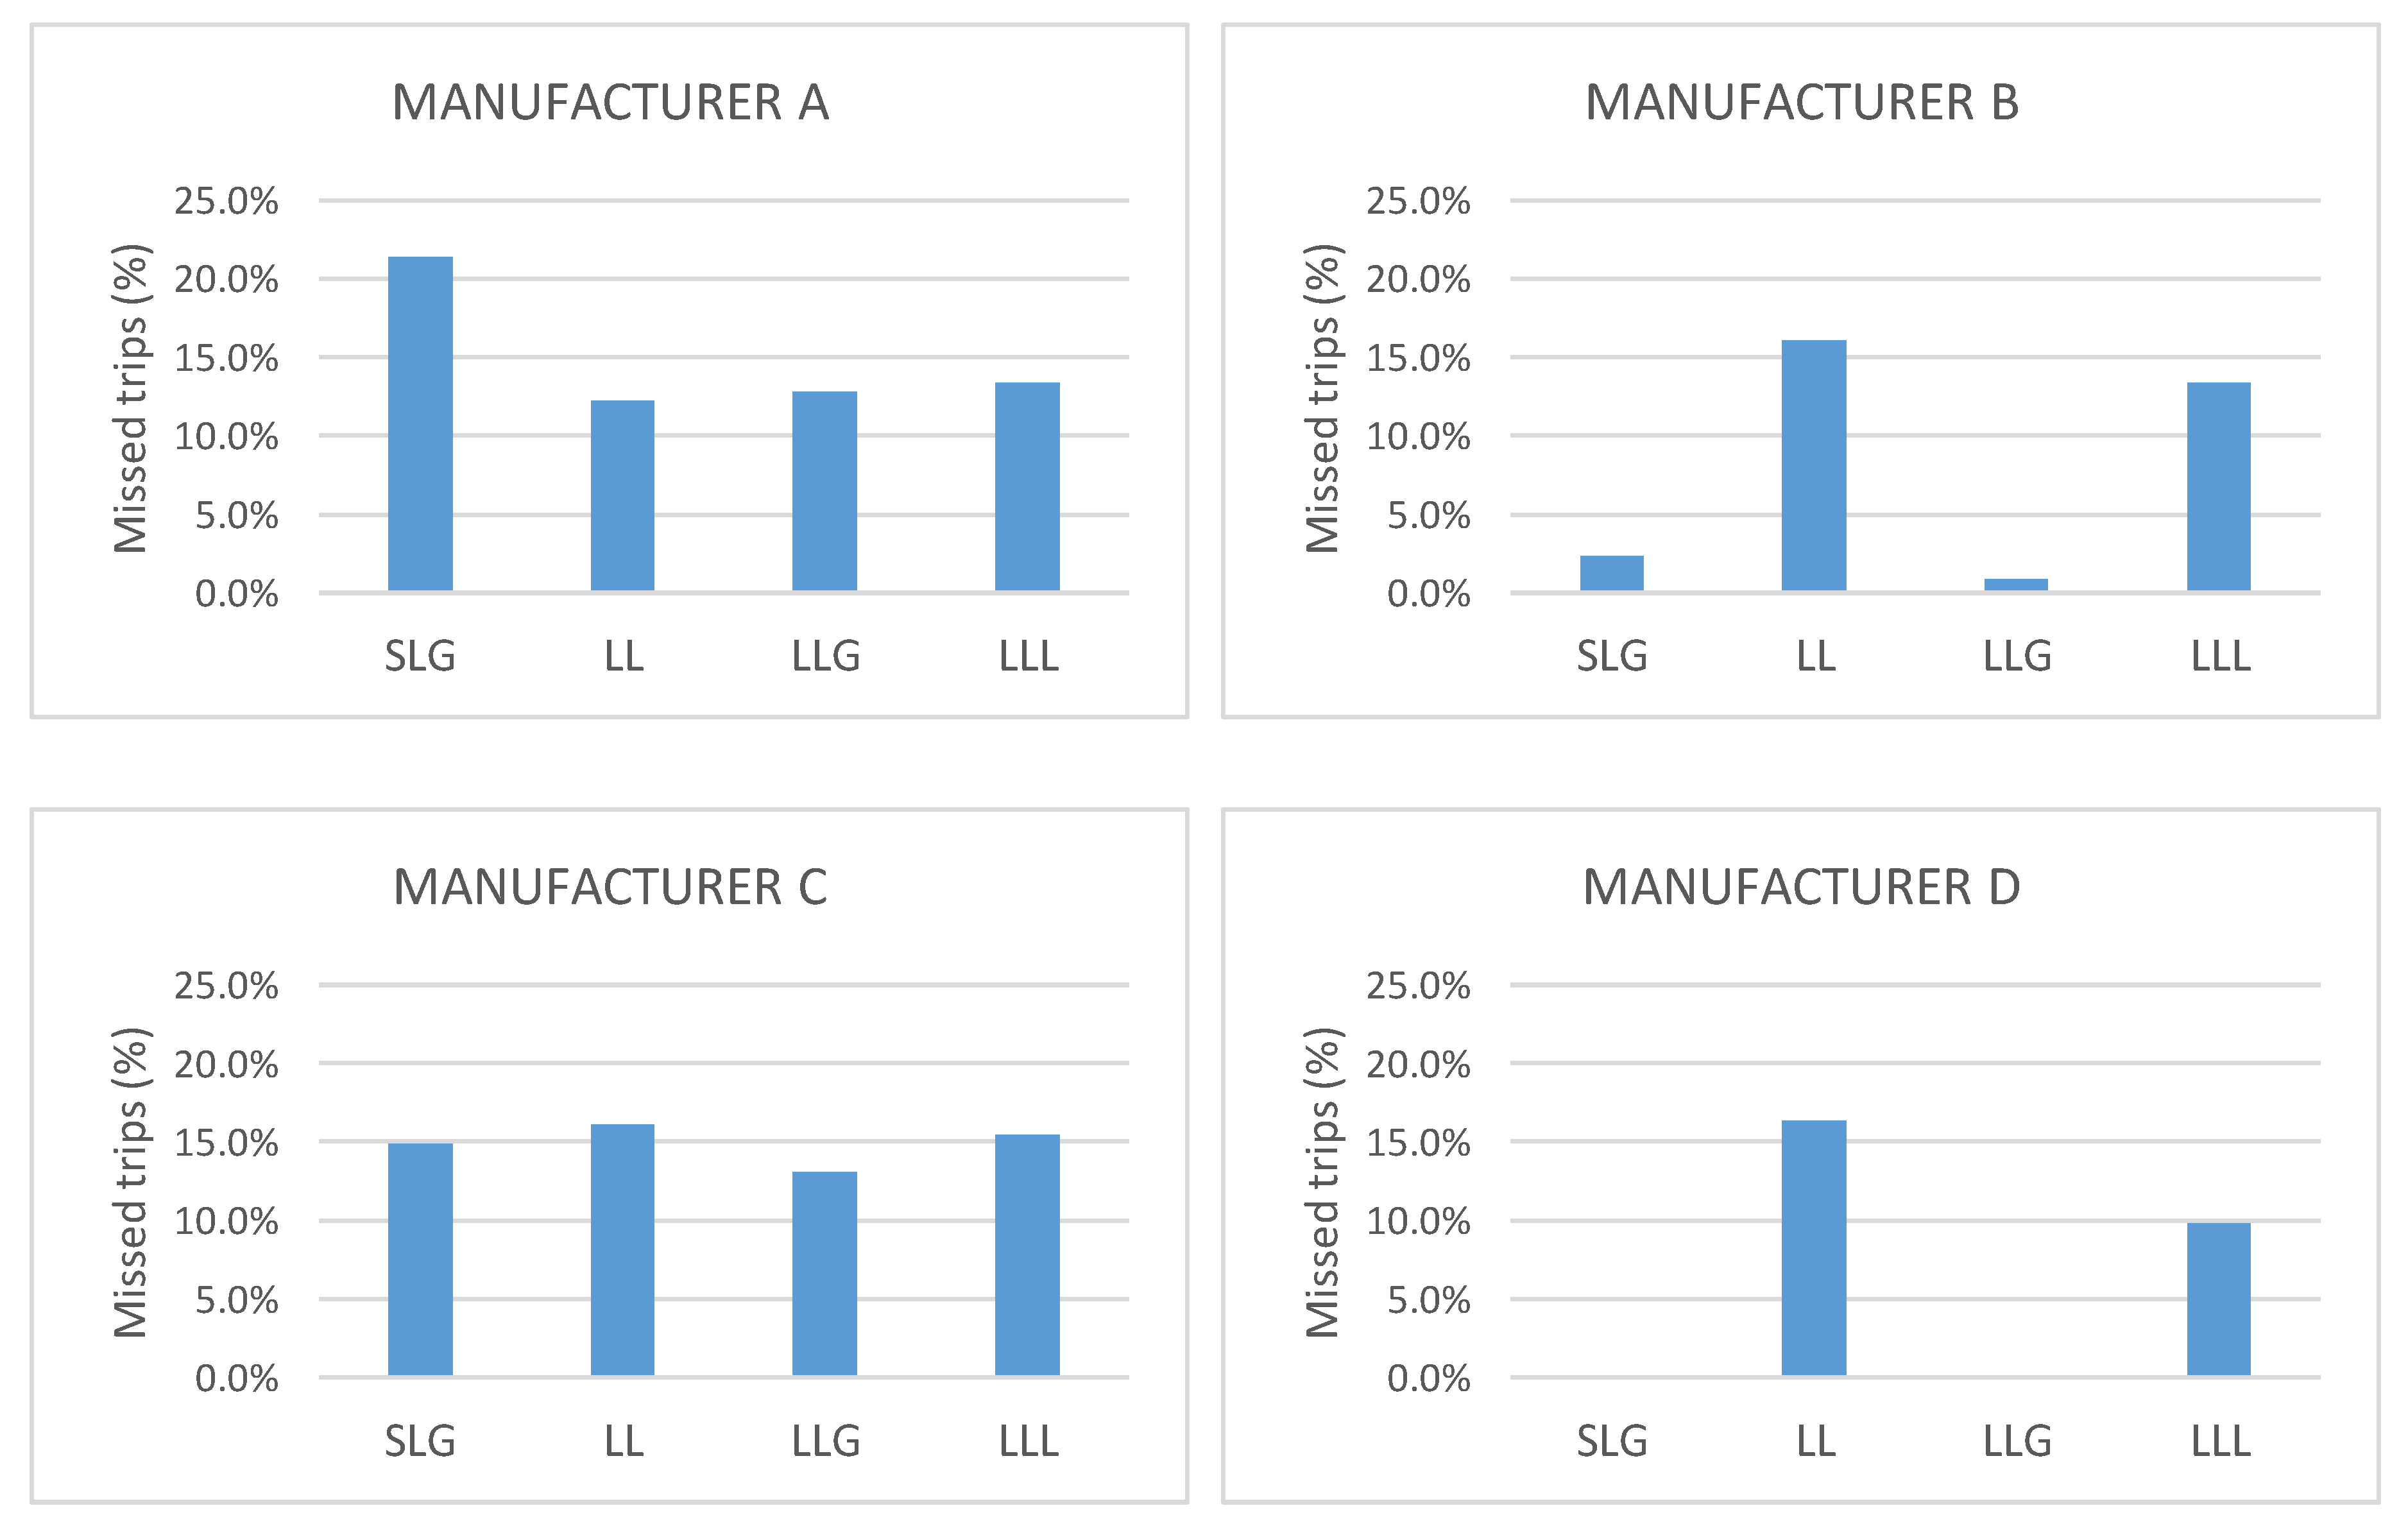
Figure 4 represent the percentage of missed trips of distance protection of each manufacturer installed in line 5–7 and line 4–5 respectively. Each graph represents one of the four commercial protections analyzed, which have been named as Manufacturer A, Manufacturer B, Manufacturer C and Manufacturer D, before different types of fault. One of the first features that draws attention is the difference between the behavior of the same protection against fault currents from PV current contribution or from Type 4 WTG current. The reason for this is that solar generator control acts faster than Type 4 WTG. Comparing behavior of each protection device before different fault type, it is observed that Manufacturer A missed trips increase in SLG and LL faults, Manufacturer B shows more difficulties with LL and LLL faults than for faults that involves the ground element. It is very interesting to see that detecting faults involving ground is not a problem for distance protection algorithm of manufacturer C, showing a clear difference of behavior regarding to the other three vendors. However, this protection relay shows the biggest number of failures in tripping decisions for LL faults and not negligible missed trips for LLL. The distance protection algorithm of manufacturer D presents a similar behavior than protection relay B, with a worse behavior at LL LLL faults and slightly better, but with a non-negligible number of missed trips, for faults involving ground. The statistics of the tests appear in
Figure 3 and
Figure 4 [
22,
23].
2.2. Results from Protection Relay Oscillography
During the tests described above, it was observed that distance protection detection errors were caused due to inaccuracies in faulted phase detection and/or directionality that were due to the negative sequence current suppression associated to the control behavior of Type-4 WT and PV generator during faults [
19,
22,
23,
24,
25,
26,
27,
28].
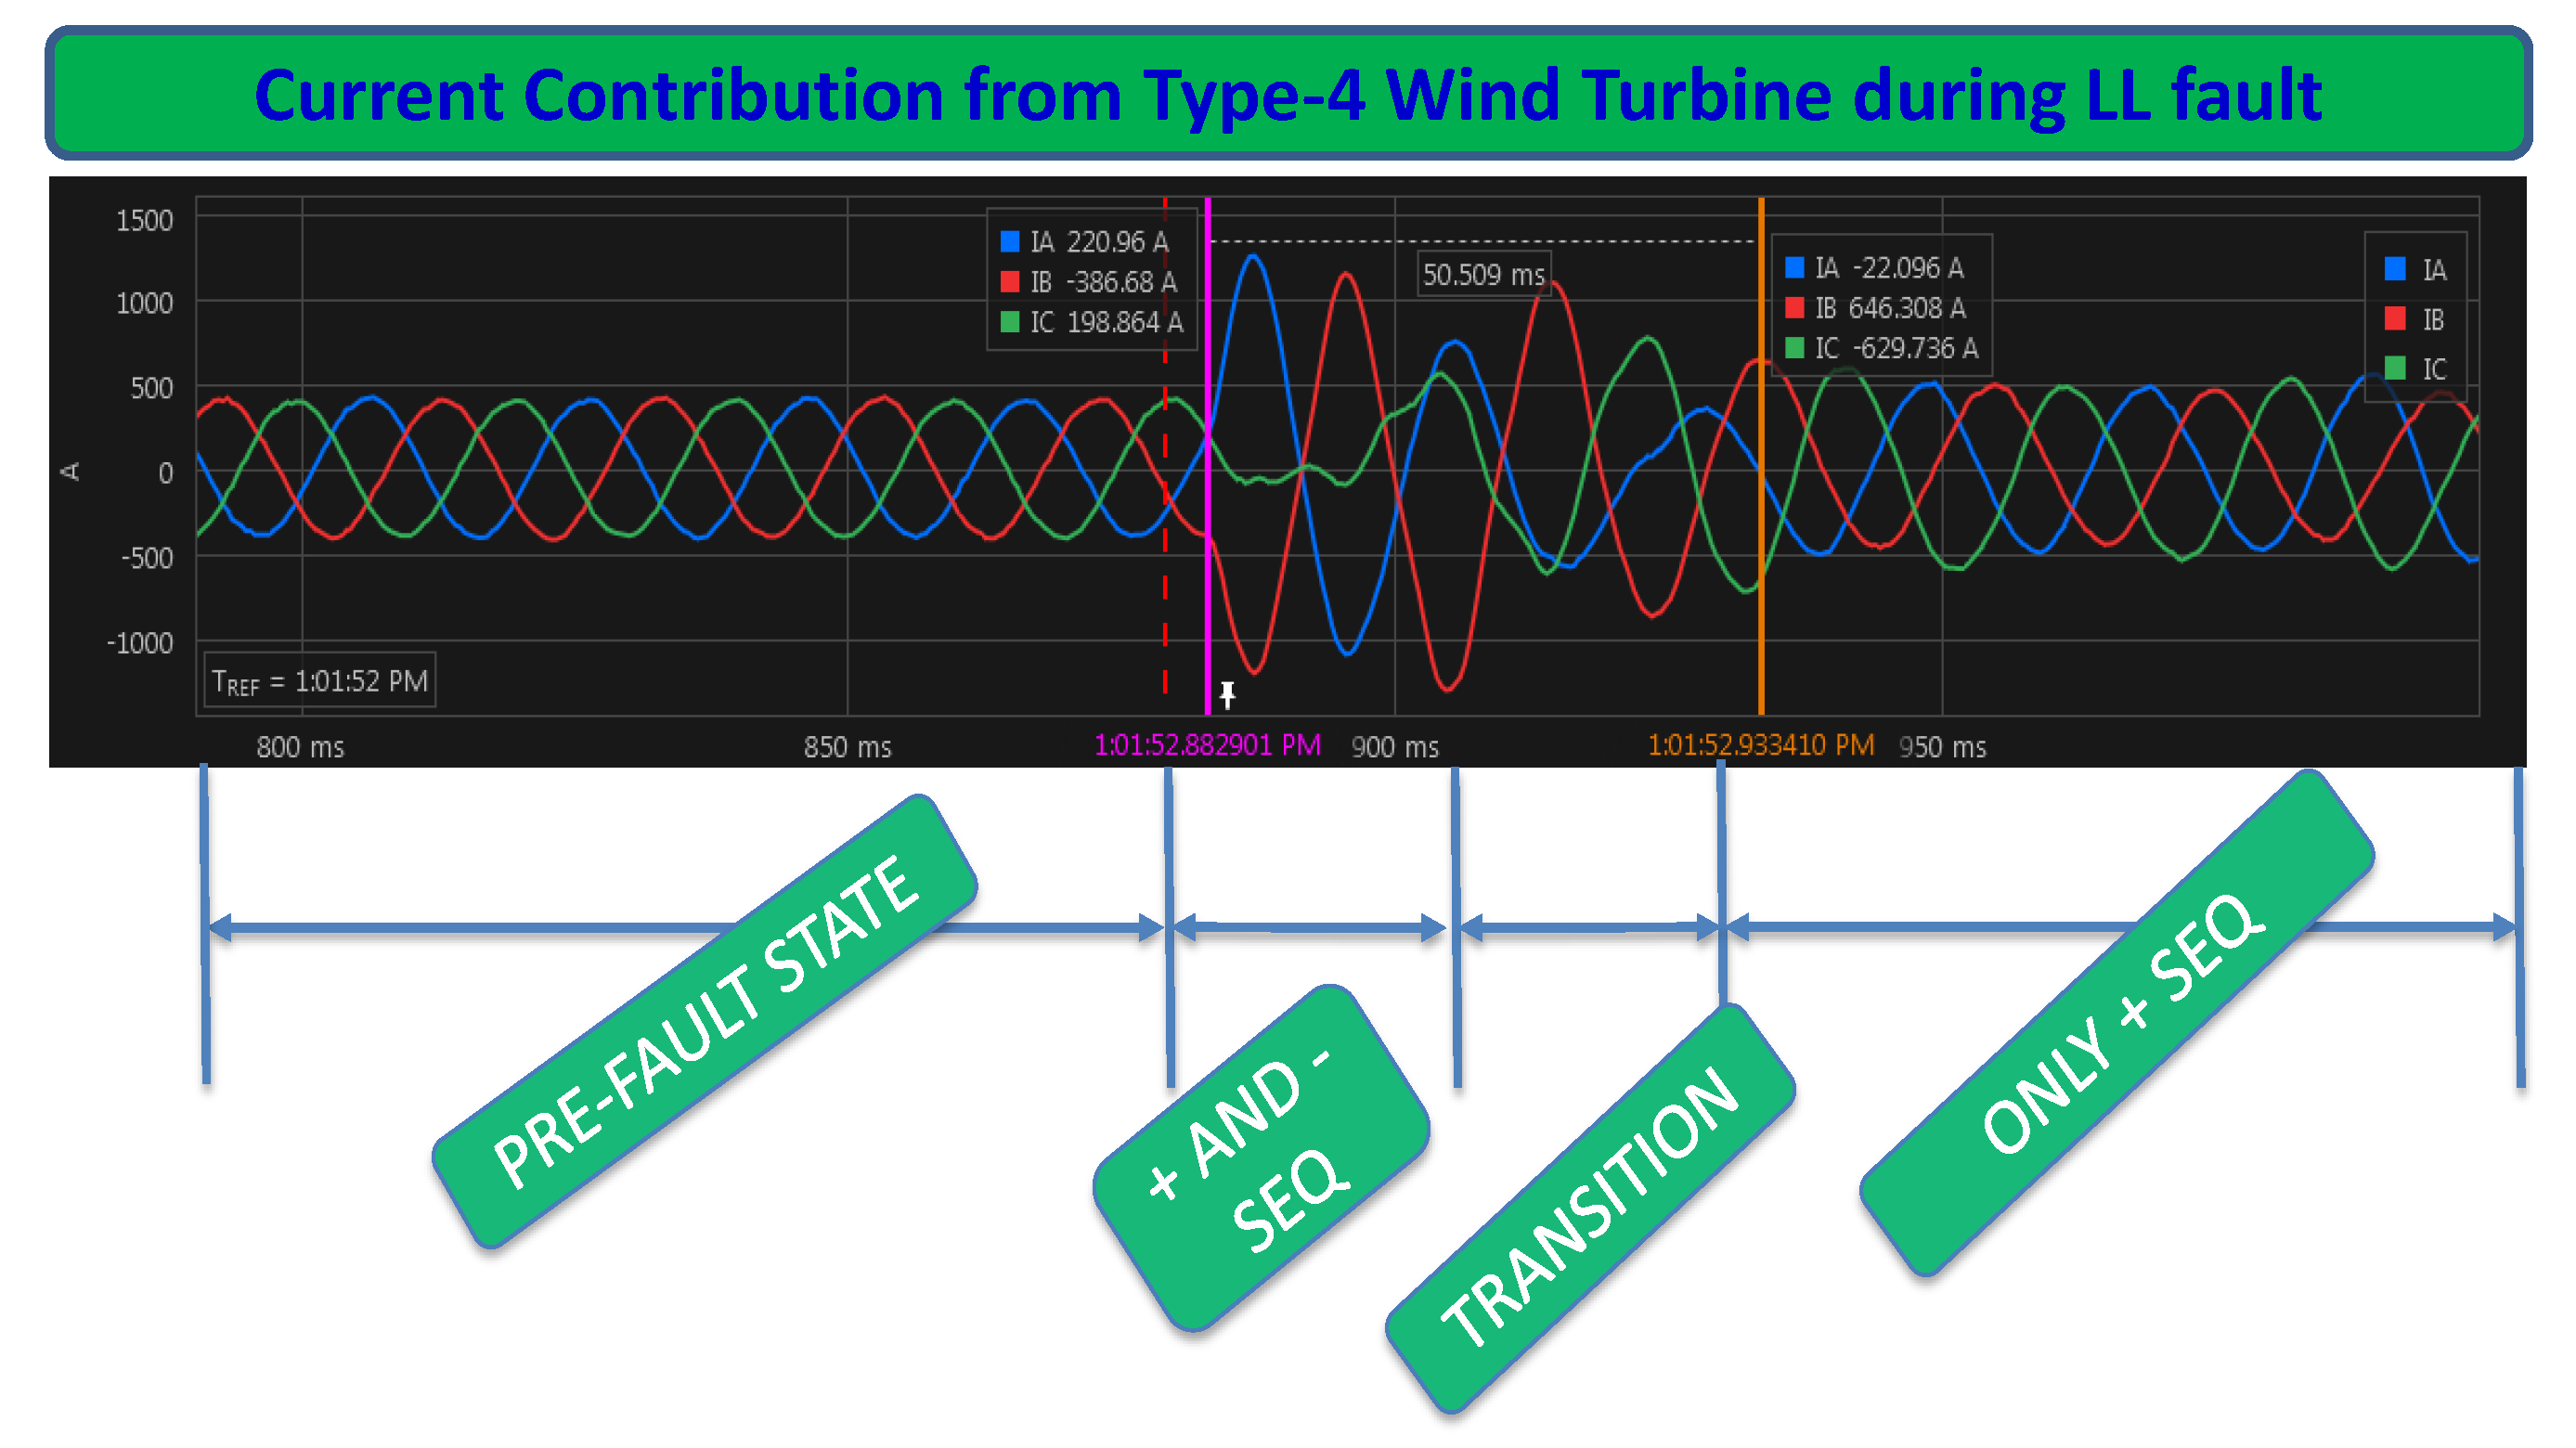
Both analyzed generators, Type 4 WT and PV, are coupled to the grid through a converter, so that, current contribution performance during faults depends on their control. Therefore, the analysis and conclusions from this section can be applied to both of them. As an example,
Figure 5 shows current injection from a Type 4 WT before and after a LL fault. In this figure, different stages have been indicated depending on the behavior of the current before and during the fault. These stages are:
PRE-FAULT STATE: Shows the standard symmetrical current injection in normal operation, before the fault.
+ AND − SEQ: Before WTs control systems respond to the fault state and regulate current injection, the behavior of the Type 4 WT is similar to SGs response, injecting both positive and negative sequence currents. The duration of this initial period depends on the response time of the WTs control systems.
TRANSITION: During this stage, WTs control reduce progressively negative sequence contribution once they react after the detection of the fault condition.
ONLY + SEQ: Once the WTs control systems eliminate negative sequence current, a symmetrical current injection can be observed even in an asymmetrical fault.
3. Comparison of Type 4 WT and SG Current Contribution Based on Superimposed Quantities Theory
As it has been observed in hardware in the loop tests carried out in this study, current contribution from PE based generators, as the observed in
Figure 5, causes wrong actuation of distance protection based on classical faulted phase selectors and/or directionality algorithms. With the aim to apply a theoretical analysis-taking into account that algorithms implemented in commercial manufacturers are not completely available for the user- the theory based on superimposed quantities theory was used. This theory, also called “delta quantities” or “delta currents” in other publications, has been widely used by different manufacturers for high-speed protection functions, faulted phase and directionality selectors [
22,
23]. Thus, the objective of this section is to compare the behavior of PE based generators and synchronous conventional generators to analyze the differences that can cause these detected missed trips.
3.1. Classical Superimposed Quantities Theory Used in Protection Relays
Superimposed quantities theory has been traditionally used for faulted phase selection and directionality declaration as a very useful method in commercial protections to detect really fast the faulted phase [
18,
20,
29,
30].
This is based on the theory and demonstrations from [
29] and define the incremental impedance according to the next expression, where all quantities are phasors:
This expression signifies that the incremental impedance seen from the relay (indicated by subscript “R”) is equivalent to the positive sequence source impedance. This formula can be also represented as:
Which means that during a fault, the magnitude and phase of the incremental voltage waveform (or phasor) are equal to the magnitude and phase of the incremental current waveform (or phasor) multiplied by the negative of the source impedance behind the relay.
Based on this, superimposed quantities theory defines an element called scalar product (
), calculated based on line to line values and defined as:
This expression allows to establish the directionality of the fault with respect the protection device: a negative value of this scalar product indicates that the fault is produced forward the protection while a positive value of this parameter indicates that it has been produced backward.
In Equation (3),
is the value of the impedance, which can be reduced to unity since it is always positive and it does not affect the sign of the scalar product.
represents any phase angle mismatch that could exist in the source phase angle representation. Since
is normally around 0°,
factor is near the unity and does not influence the sign of the result [
29].
must be defined for every combination of phases, taking into account line voltage and current measurements so that in three phase systems, a set of three scalar products are defined:
Depending on the magnitude and sign from each scalar product during the duration of the event, it is possible to classify the type of fault and its directionality. If, among the three values of the scalar products, the maximum peak is positive, the directionality is backward and, if the maximum peak is negative, the directionality is forward.
Table 1 shows the relative values of each scalar product for different types of fault from the literature valid for traditional synchronous generation current contribution.
Some papers allow a certain margin to establish the fault type, for example in [
20] the margins are stablished for AB and ABG faults (
Table 2). It can be notices that SG current behavior shown in the graphs is still inside this margin proposed in that paper so that the faulted phase selection and directionality is correctly indicated. In this paper, both criteria are used.
3.2. Comparison of Type 4 WT and SG Current Contribution Based on Superimposed Quantities Theory
To analyze the validity of the previous classification when fault current contribution comes from PE based generators, a comparison between the results of
,
and
obtained for each type of fault listed in
Table 1 when fault current comes from conventional SGs or from PE based generators has been carried out. This section shows, as an example, the analysis performed for faults AG, AB and ABG for Type 4 WT current contribution. Thus,
Figure 6 shows results from AG faults,
Figure 7 from AB faults and
Figure 8 form ABG faults.
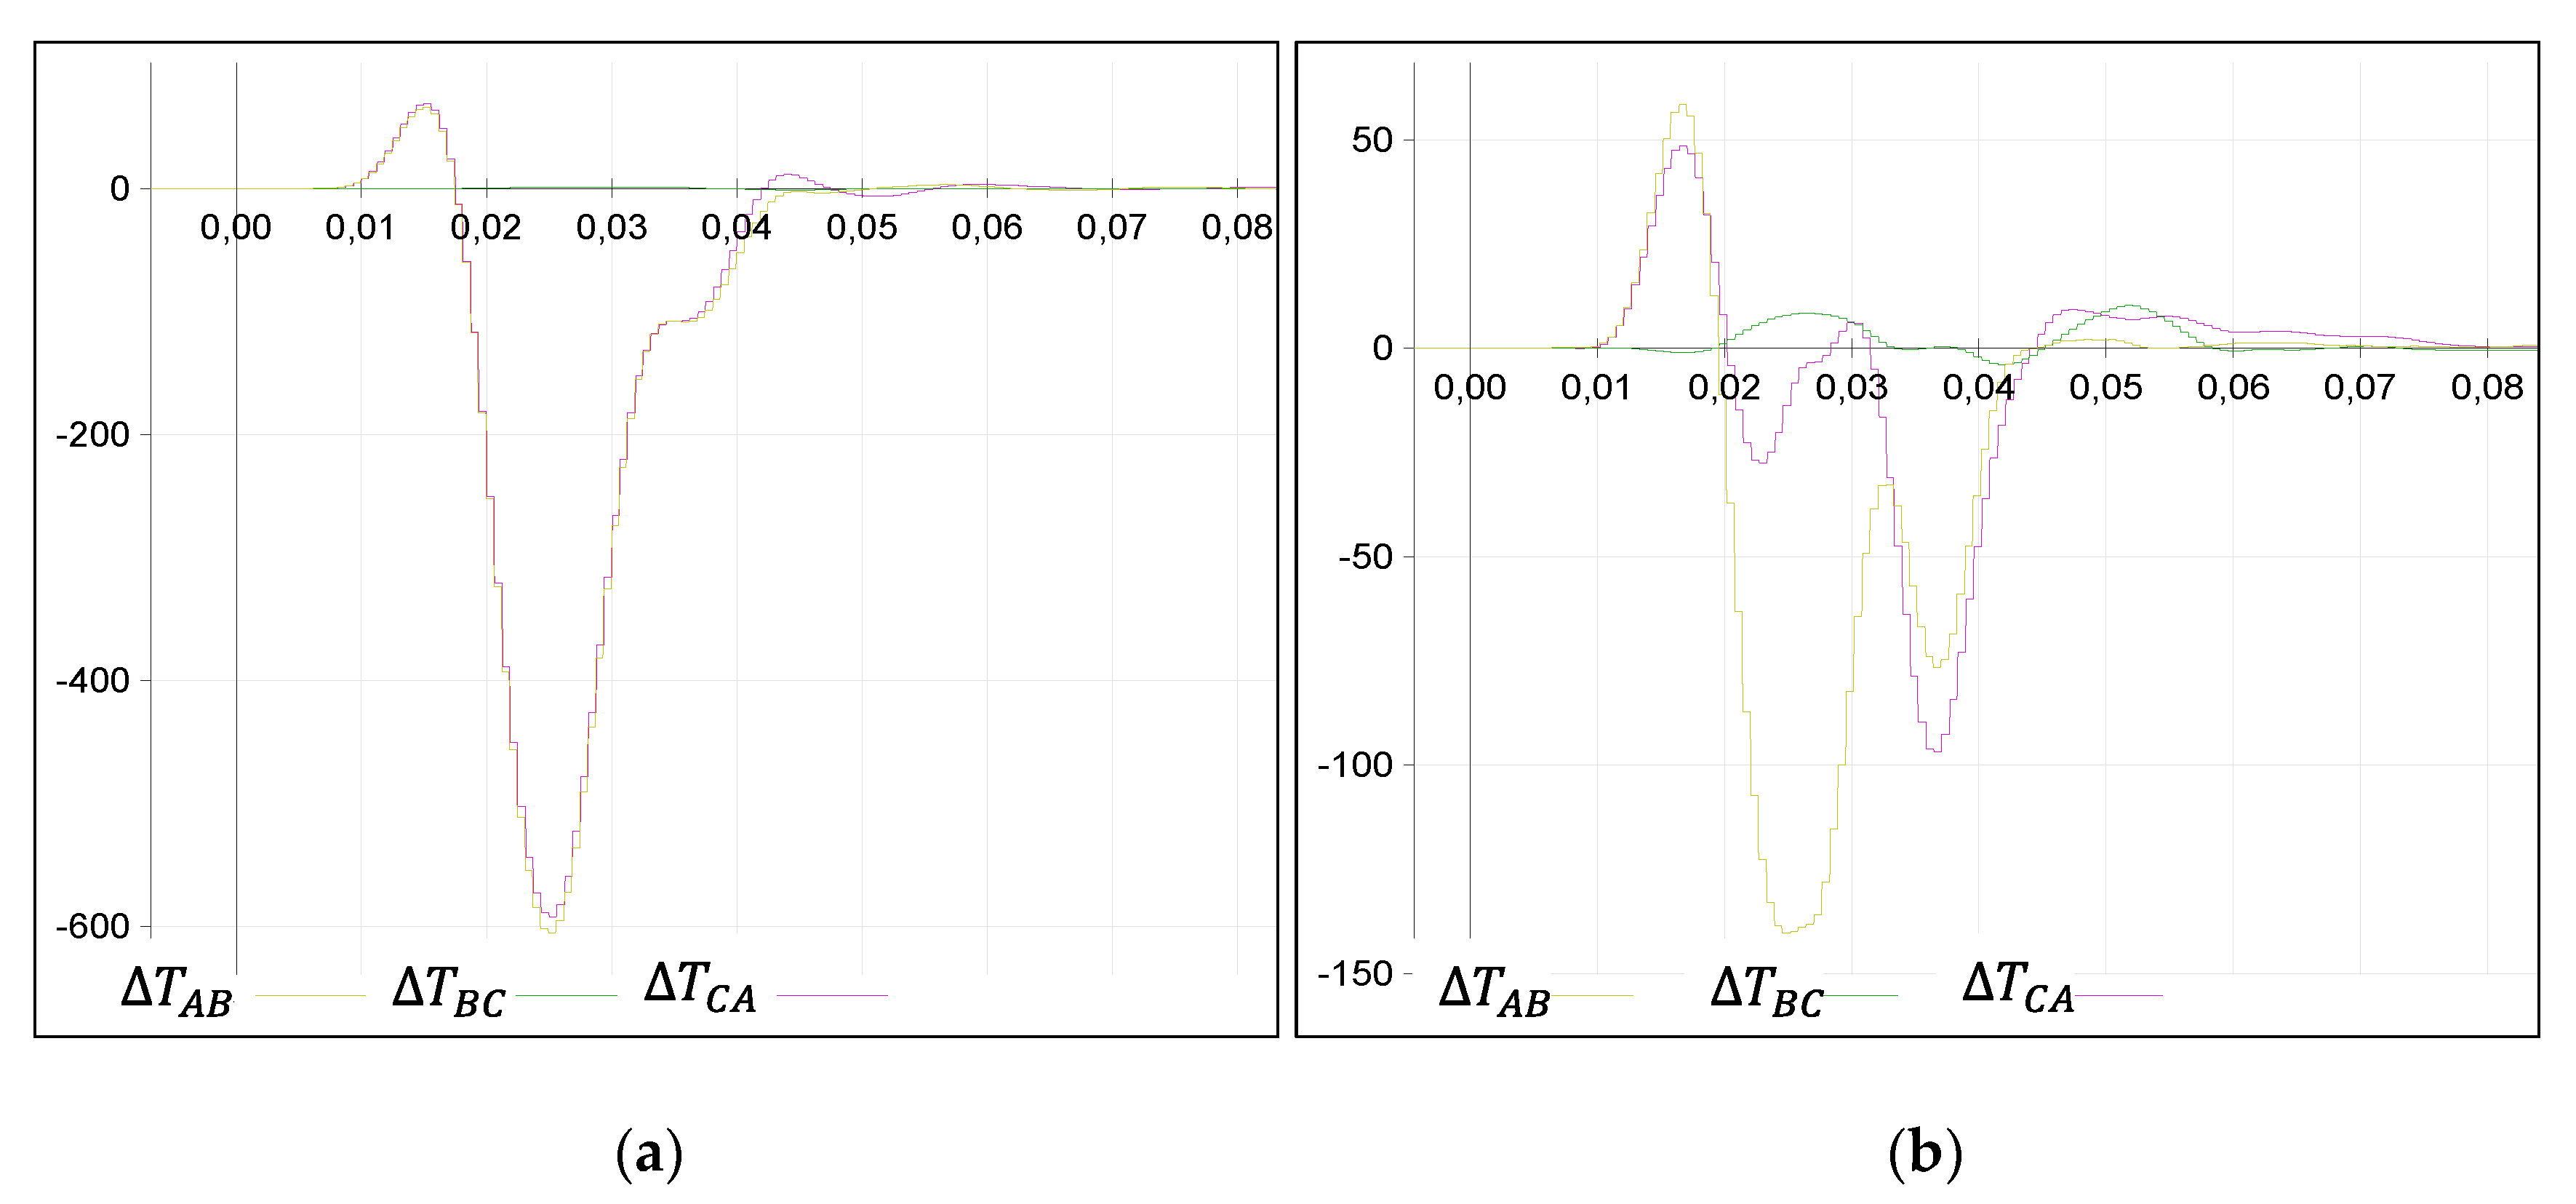
Hence, AG fault results can be observed in
Figure 6.
Figure 6a represent the SG behavior and clearly shows that results from SG fulfill the expected relationship between scalar products from
Table 1:
and
. Regarding directionality, it is clearly forward because, observing the evolution of the curves, the negative peak is one order of magnitude larger than the positive one. Criterion from [
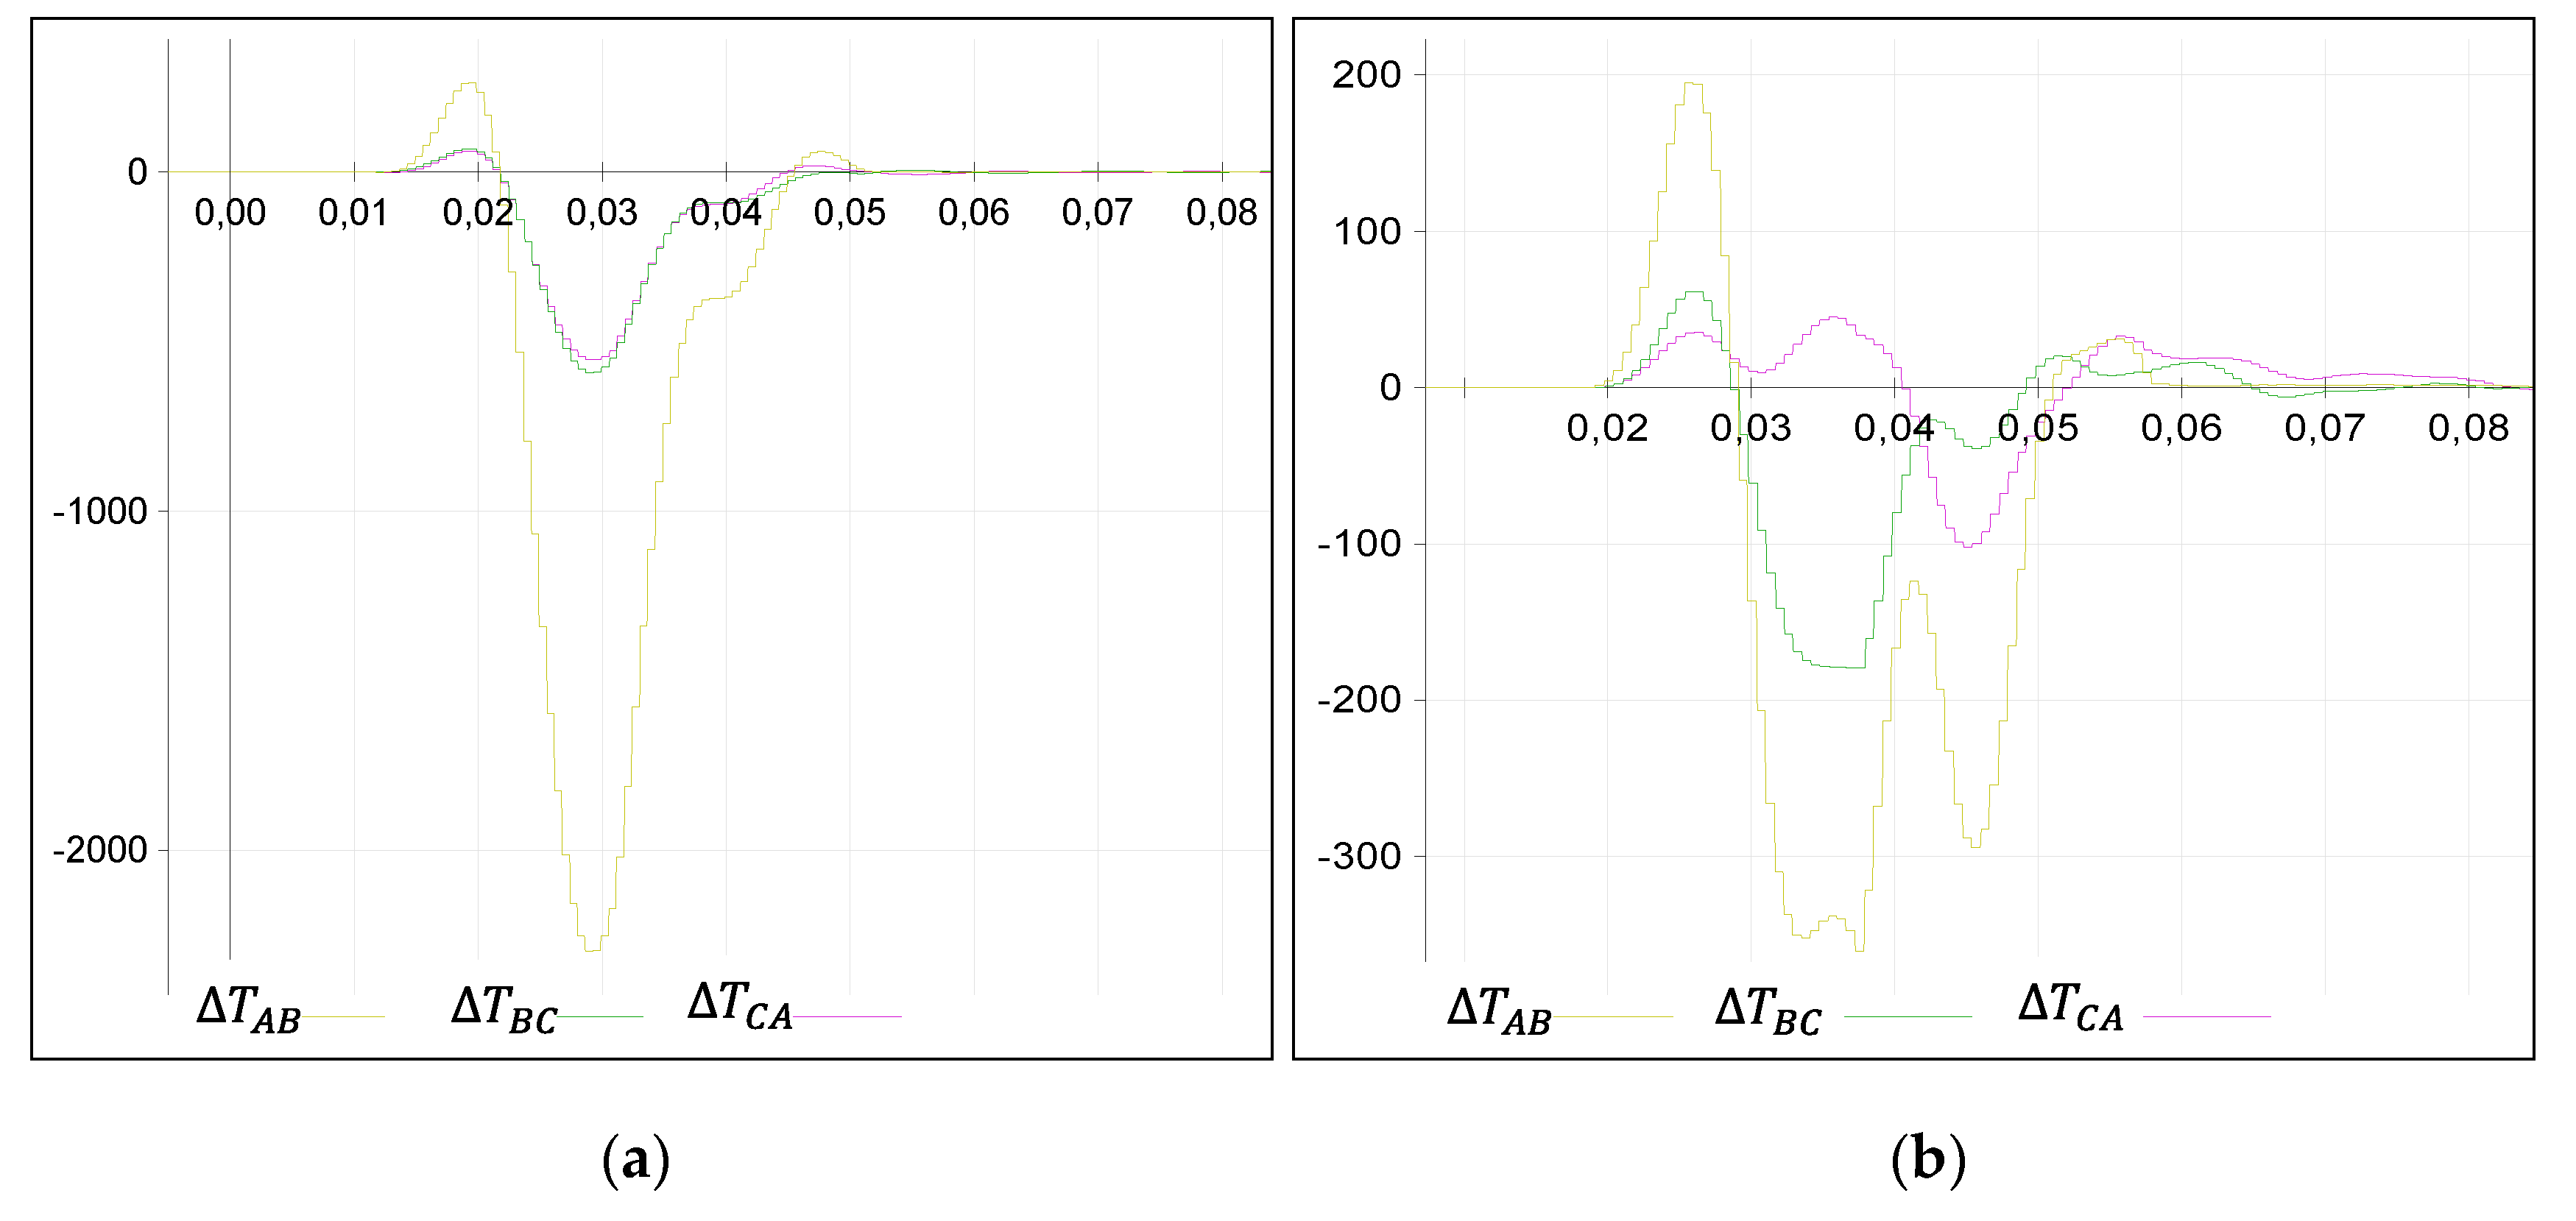
20] is less restrictive and is also fulfilled. Similar analysis can be applied to AB fault, shown in
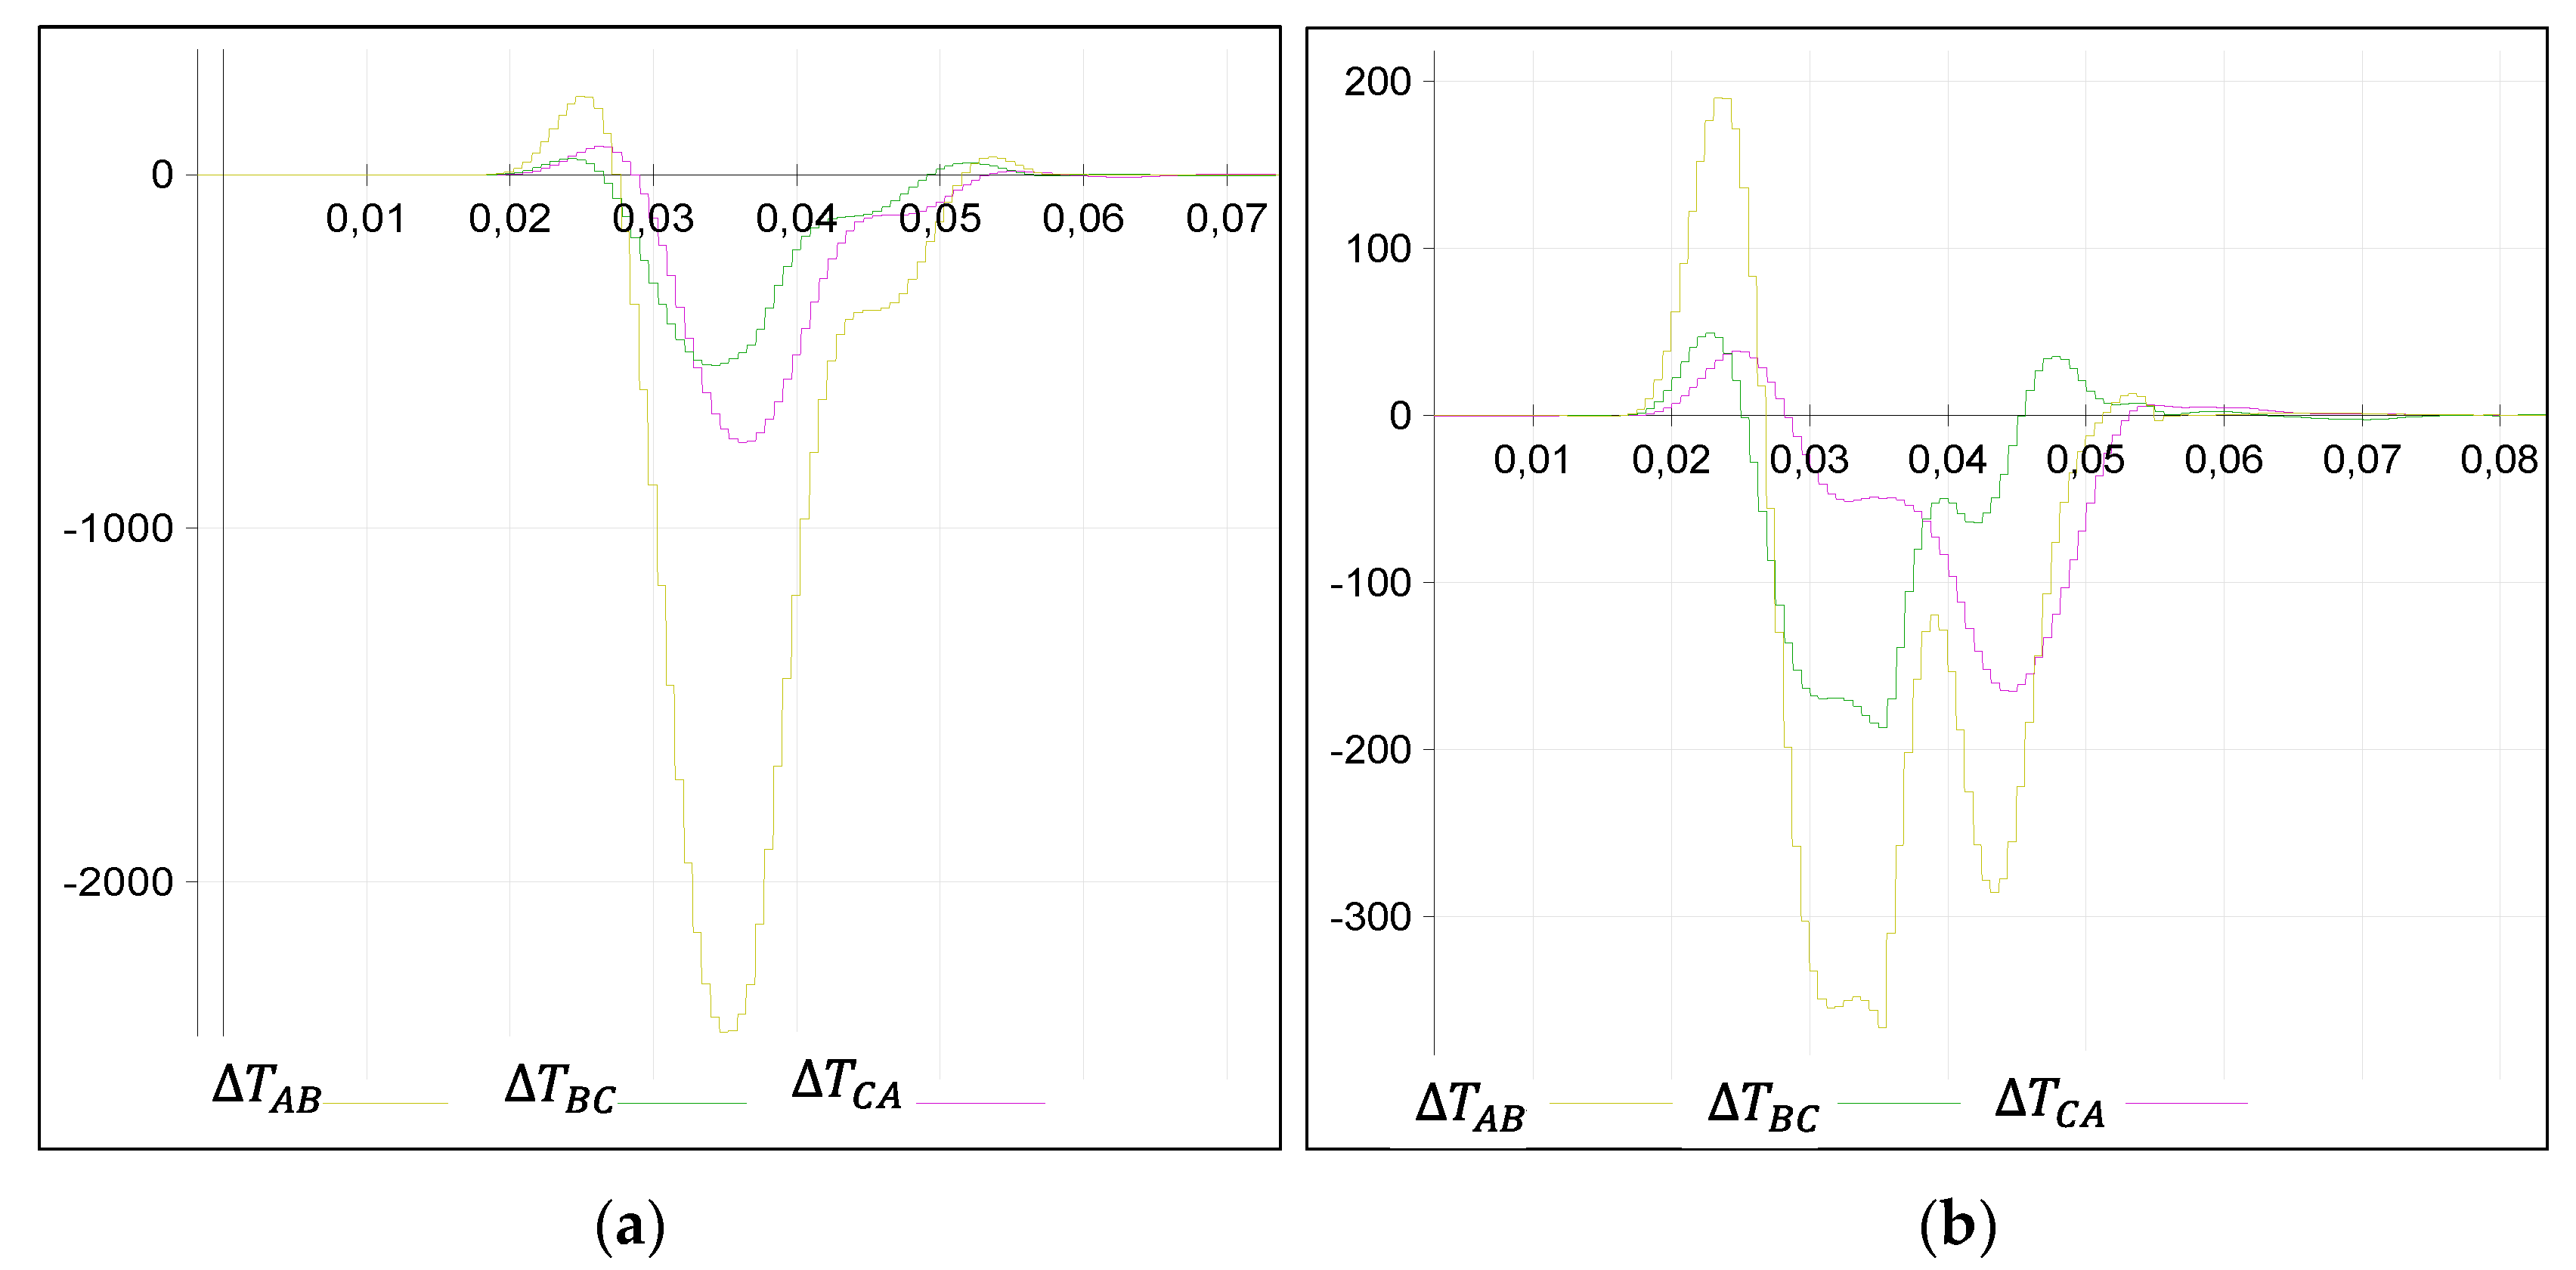
Figure 7a and
Figure 8a.
Figure 7a shows agreement of the results with
Table 1 criterion for AB faults since
and
negative peak value is one order of magnitude higher than positive peak and the three scalar products have the same sign during the test, so there is no doubt about the forward directionality and phase selection. Finally,
Figure 8a scalar products applied to SG current contribution during the fault accomplish the relationship correctly.
However, the response of the algorithm with Type 4 WT current contribution shown in the right side of the figures differ from the result of the synchronous source. First of all, the maximum values obtained in the products are clearly lower in Type 4 WT, as can be seen comparing the vertical axis scales from the figures. Moreover, relationships between scalar products from
Table 1 are not accomplished in any of the cases, as shown in
Figure 6b,
Figure 7b, and
Figure 8b. This fact may cause problems in faulted phase selection by the protection relay for the fault types analyzed in this section. Concerning directionality,
Figure 6b shows an initial positive peak similar in magnitude to the negative peak that could result in wrong directionality declaration in AG faults. In
Figure 7b, negative peak is similar in magnitude to the positive peak and positive and negative values of the scalar products coexist at the same time instant. The combination of these factors may cause a malfunction of the directionality declaration and faulted phase selection in AB faults. Similar analysis can be applied to
Figure 8b.
It can be also observed in
Figure 6,
Figure 7 and
Figure 8 that the behavior of SG and WT is similar during the first instants after the fault inception, as it was noticed during the oscillography analysis done to the relays when the RTDS tests were applied.
These important differences of PE based generators with respect to SGs lead the protections based on superimposed quantities not to work properly in terms of directionality and faulted phase selection. This theoretical analysis in combination with the RTDS study to the four protection relay manufacturers conclude that new methods are needed to be developed to solve this situation.
Summary of the comparison between SG and Type 4 WT based on superimposed quantities theory is shown in
Table 3.
4. Proposed Algorithm
According to the results summarized in
Section 3, renewable generators connected through PE, such as Type 4 WT and PV systems, behaves similarly to SGs during the first instants after the fault inception, but once control system reacts the negative current contribution to the fault is eliminated. Due to this behavior, it was observed that present faulted phase selector and directionality algorithms show a wrong performance. This is the starting point of the proposed algorithm.
Hence, criteria for fault selection used for current contribution provided by synchronous generators can be valid if they are applied only during the first milliseconds after the fault inception, i.e., previously to the transition period (
Figure 5). On this base, an “adaptive window” is introduced in order to enable the identification of faulted phases and directionality in asymmetrical fault avoiding the problems caused by injected currents during transition and final periods after the fault inception by PE based generator.
The developed algorithm is able to identify and set the starting time and the final moment of the adaptive window depending on the different time responses of the renewable control systems. Since each control system may have different control time constants, it is very important for the correct performance of the algorithm that this time window is adaptive.
4.1. Proposed Algorithm Structure
The proposed algorithm starts when unbalanced fault conditions are detected at the protection measurement point. This detection is accomplished by comparing negative and positive sequence currents and zero and positive sequence currents. Initial thresholds used for fault classification are set at 10% (negative vs positive and zero vs positive sequence currents) and they could be adjustable by the user.
Once an unbalance fault conditions has been detected, a first classification of the fault is performed applying the flowchart from
Figure 9. According to which, if zero sequence current appears, the unbalance fault can be SLG or LLG, both faults have negative sequence current, so it is not possible to provide further separation taking into account only negative and zero sequence current. If no zero-sequence current is measured, the fault will be LL or LLL. However, in this case, a negative sequence current appears in LL faults but not in LLL faults, so they can be classified by using this feature.
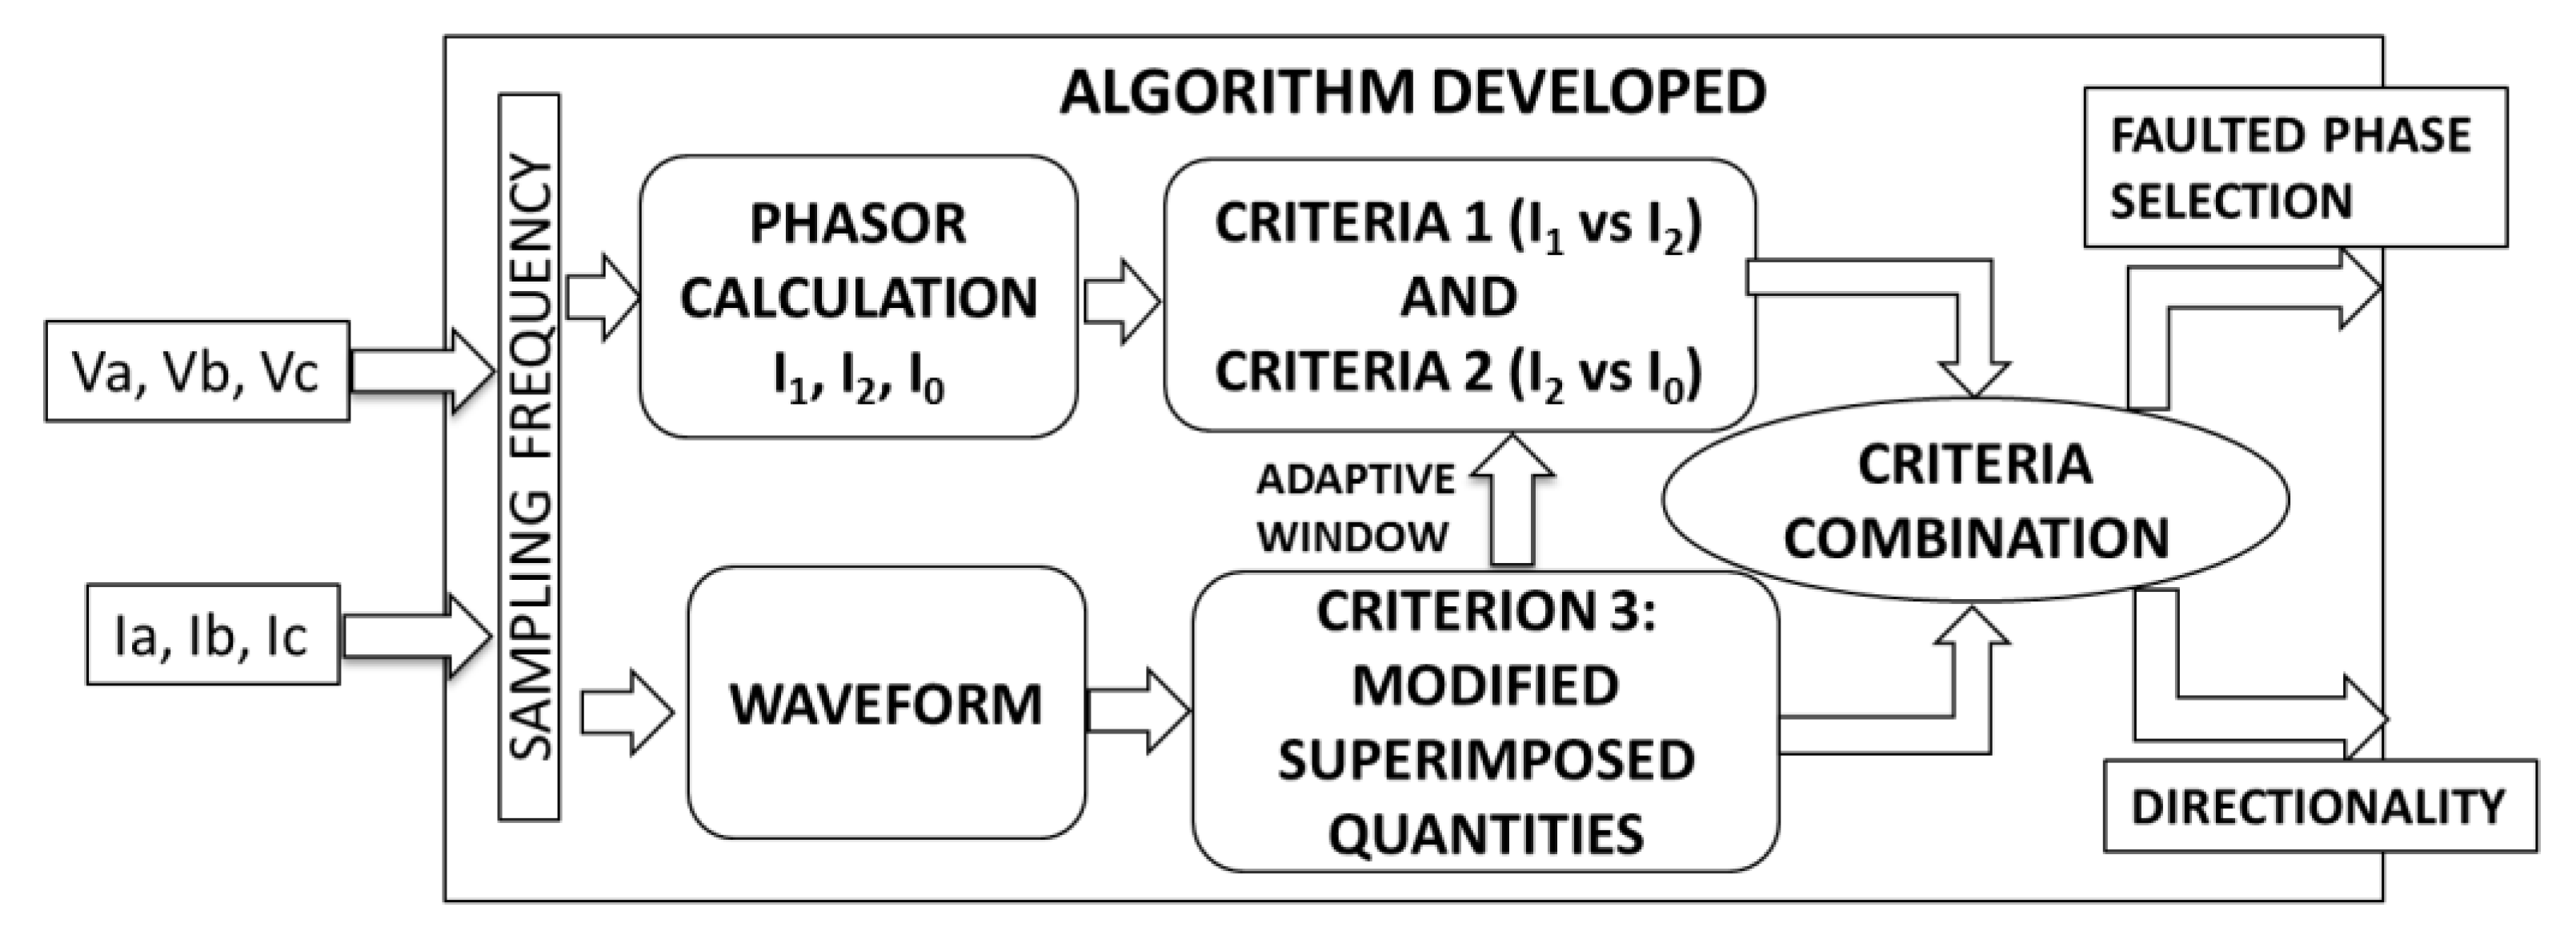
After this step, faulted phase locator stage receives this first classification and applies three criteria simultaneously as shown in
Figure 10. Criteria 1 and 2 are based on phasor angles and criterion 3 is based on a modified superimposed quantity criterion as is described in the following sections.
The use of three criteria based on different protection theories confers robustness to the final decision of the algorithm.
4.2. Criterion 1. Positive vs. Negative Sequence Currents
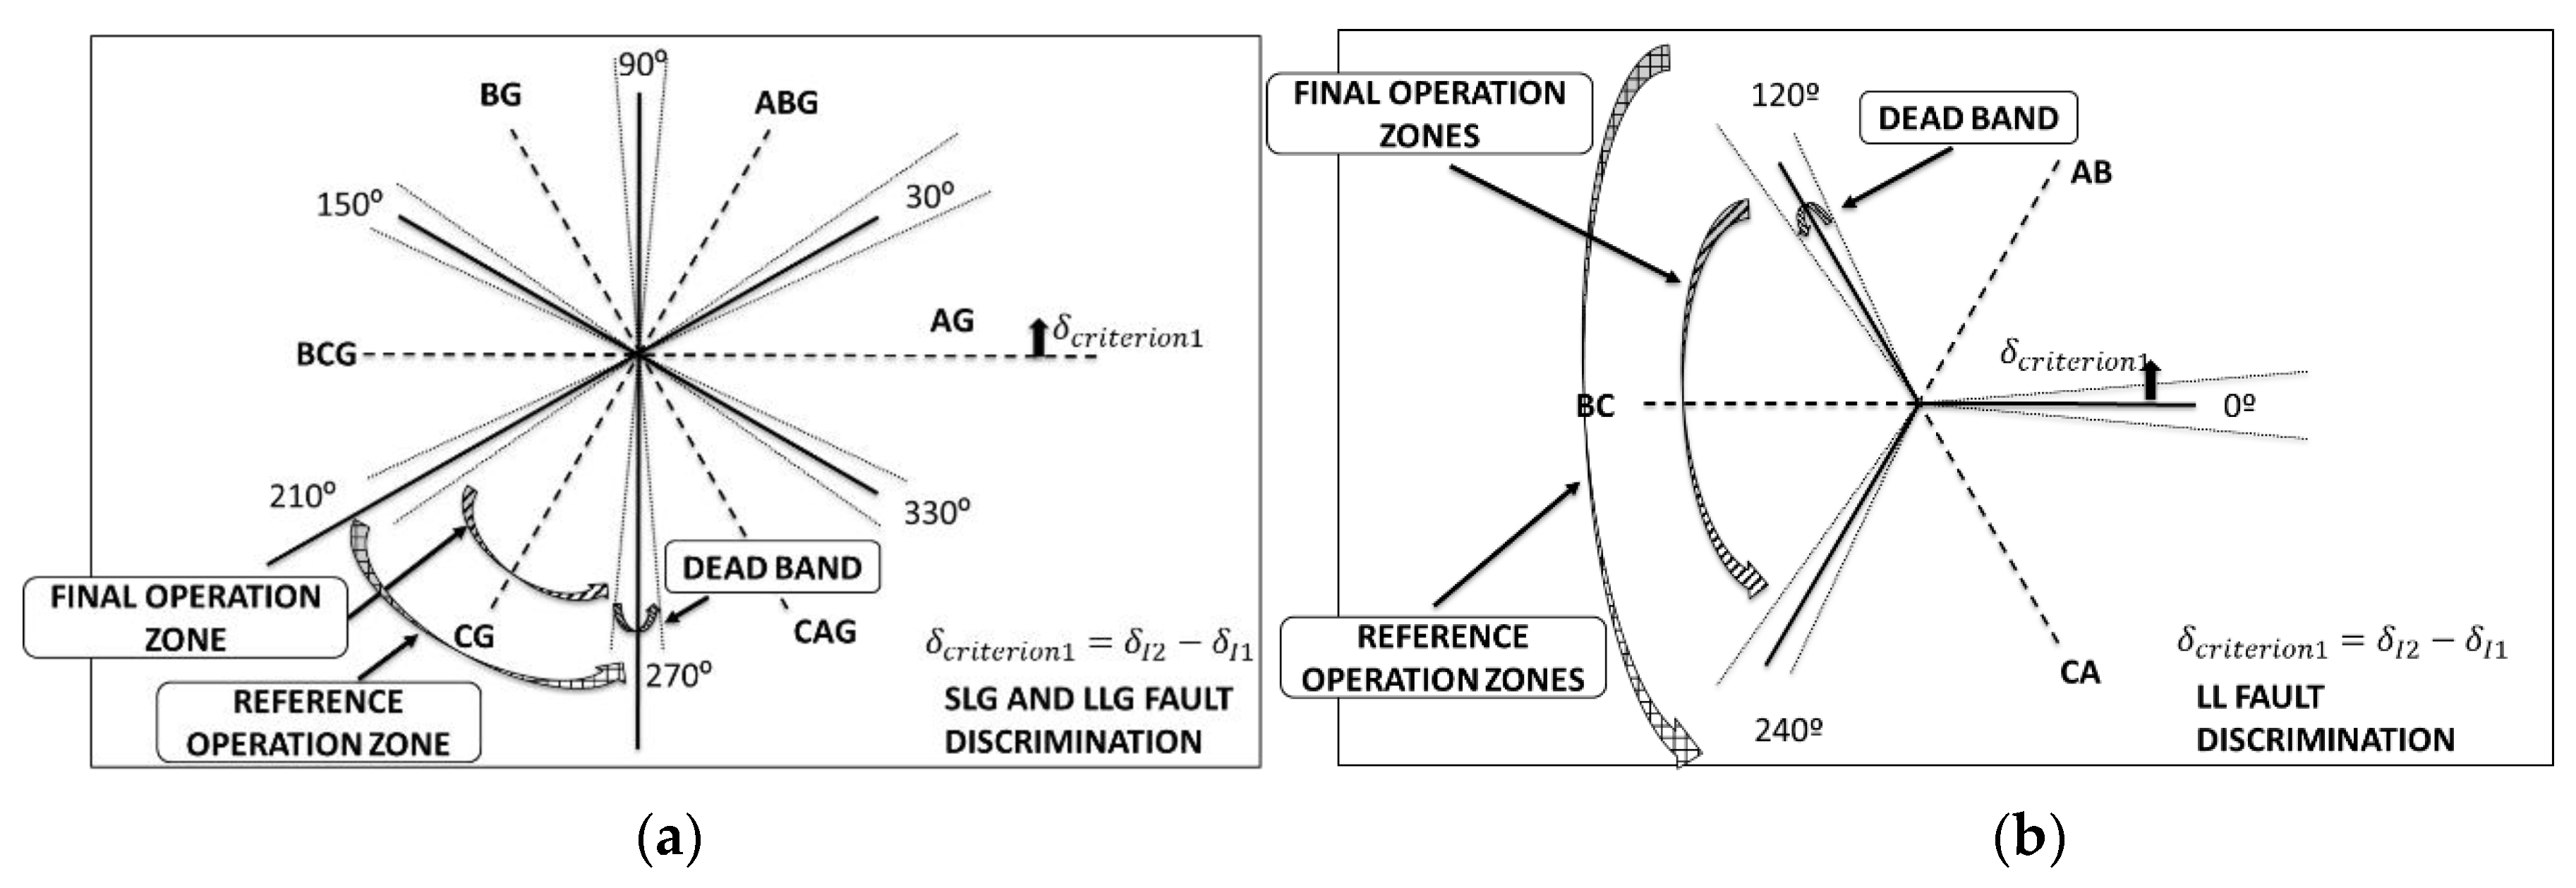
Criterion is based on phasor angles of the positive and negative sequence currents that can be obtained by using the fast Fourier transform (FFT). In this step, the algorithm calculates δ
criterion1 that represent the difference between positive and negative sequence phasor (phase A) and compares it with the angular sectors observed in
Figure 11a,b to obtain the faulted phase selection.
Figure 11a shows sectors corresponding to SLG and LLG events involving any combination of phases and
Figure 11b for LL faults. This protection principle is based on the theory of sequence networks and has been traditionally used by protection relay manufacturers [
31].
If zero sequence current is detected
Figure 11a is used in criterion 1. In this figure, different zones are defined:
- -
Reference zones are defined for each fault type: AG faults reference zone goes from 330° to 30°, ABG sector from 30° to 90°, BG sector from 90° to 150°, BCG sector from 150° to 210° CG sector from 210° to 270° and CAG sector from 270° to 330°.
- -
In every sector, a dead band can be defined in order to delimit the zone between the adjacent zones and to avoid wrong zone activations. These dead bands can be set to zero.
- -
The final operation zone is the area obtained by subtracting the dead band to the reference operation zone and is the area used to apply criterion 1. If dead band is set to zero degrees, the final and the reference operation zones coincide.
In the case that there is not presence of zero sequence current, the criteria 1 applied will be based on
Figure 11b to correctly identify faulted phases. Same sectors are used than in the case of SLG and LLG. AB sector starts in 0° and finishes in 120°, BC sector starts in 120° and finishes 240°, and CA sector starts in 240° and finishes in 360°.
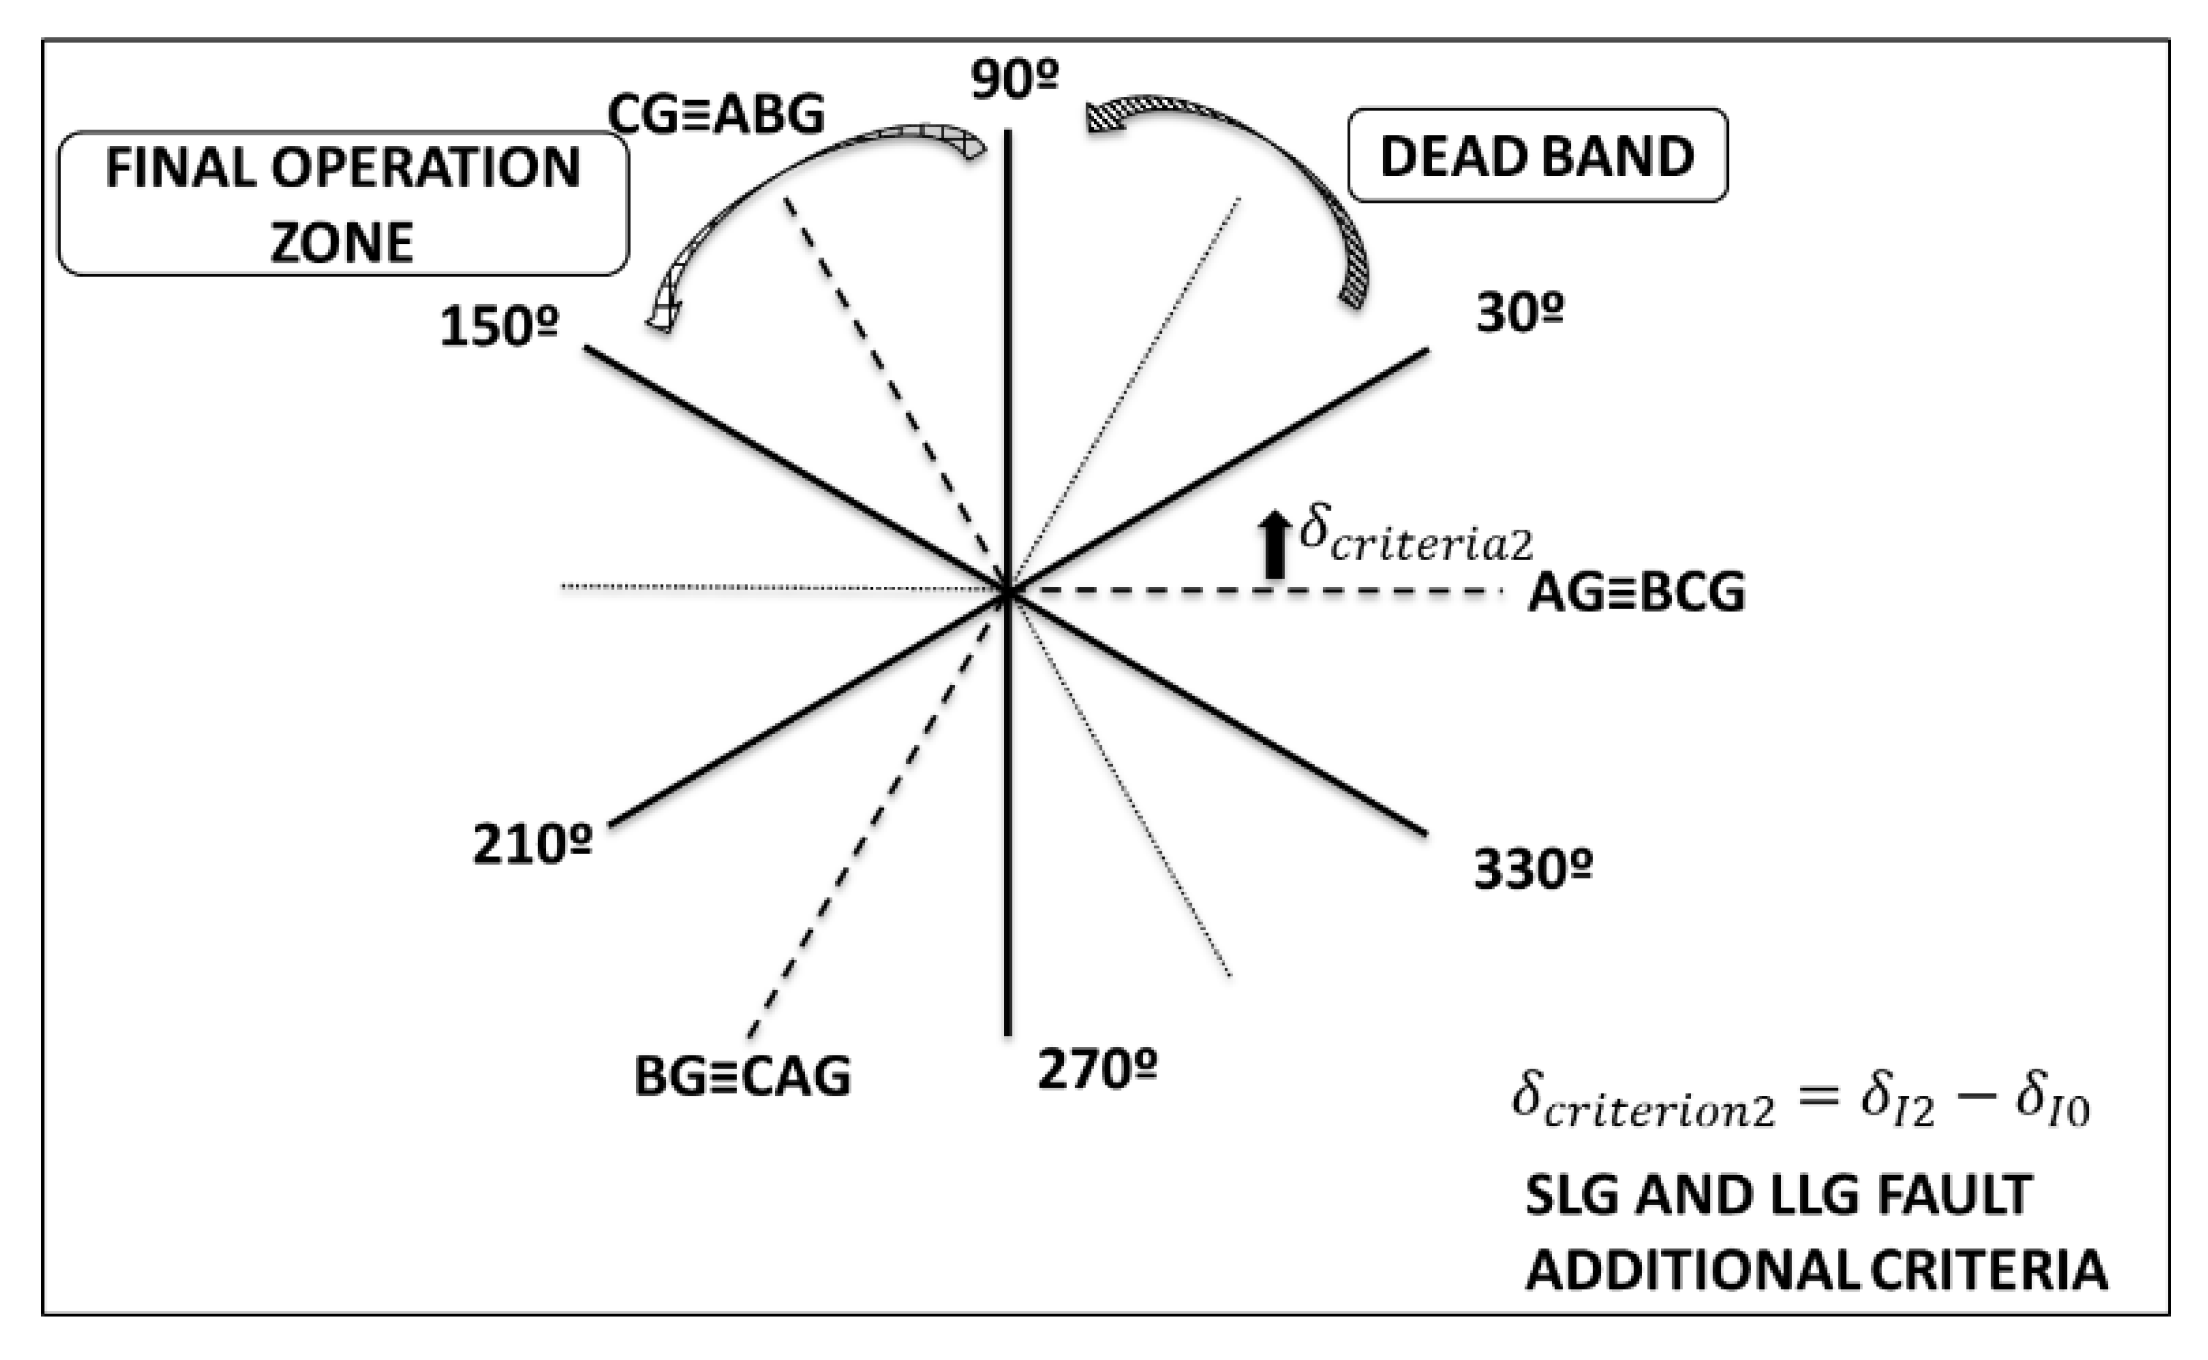
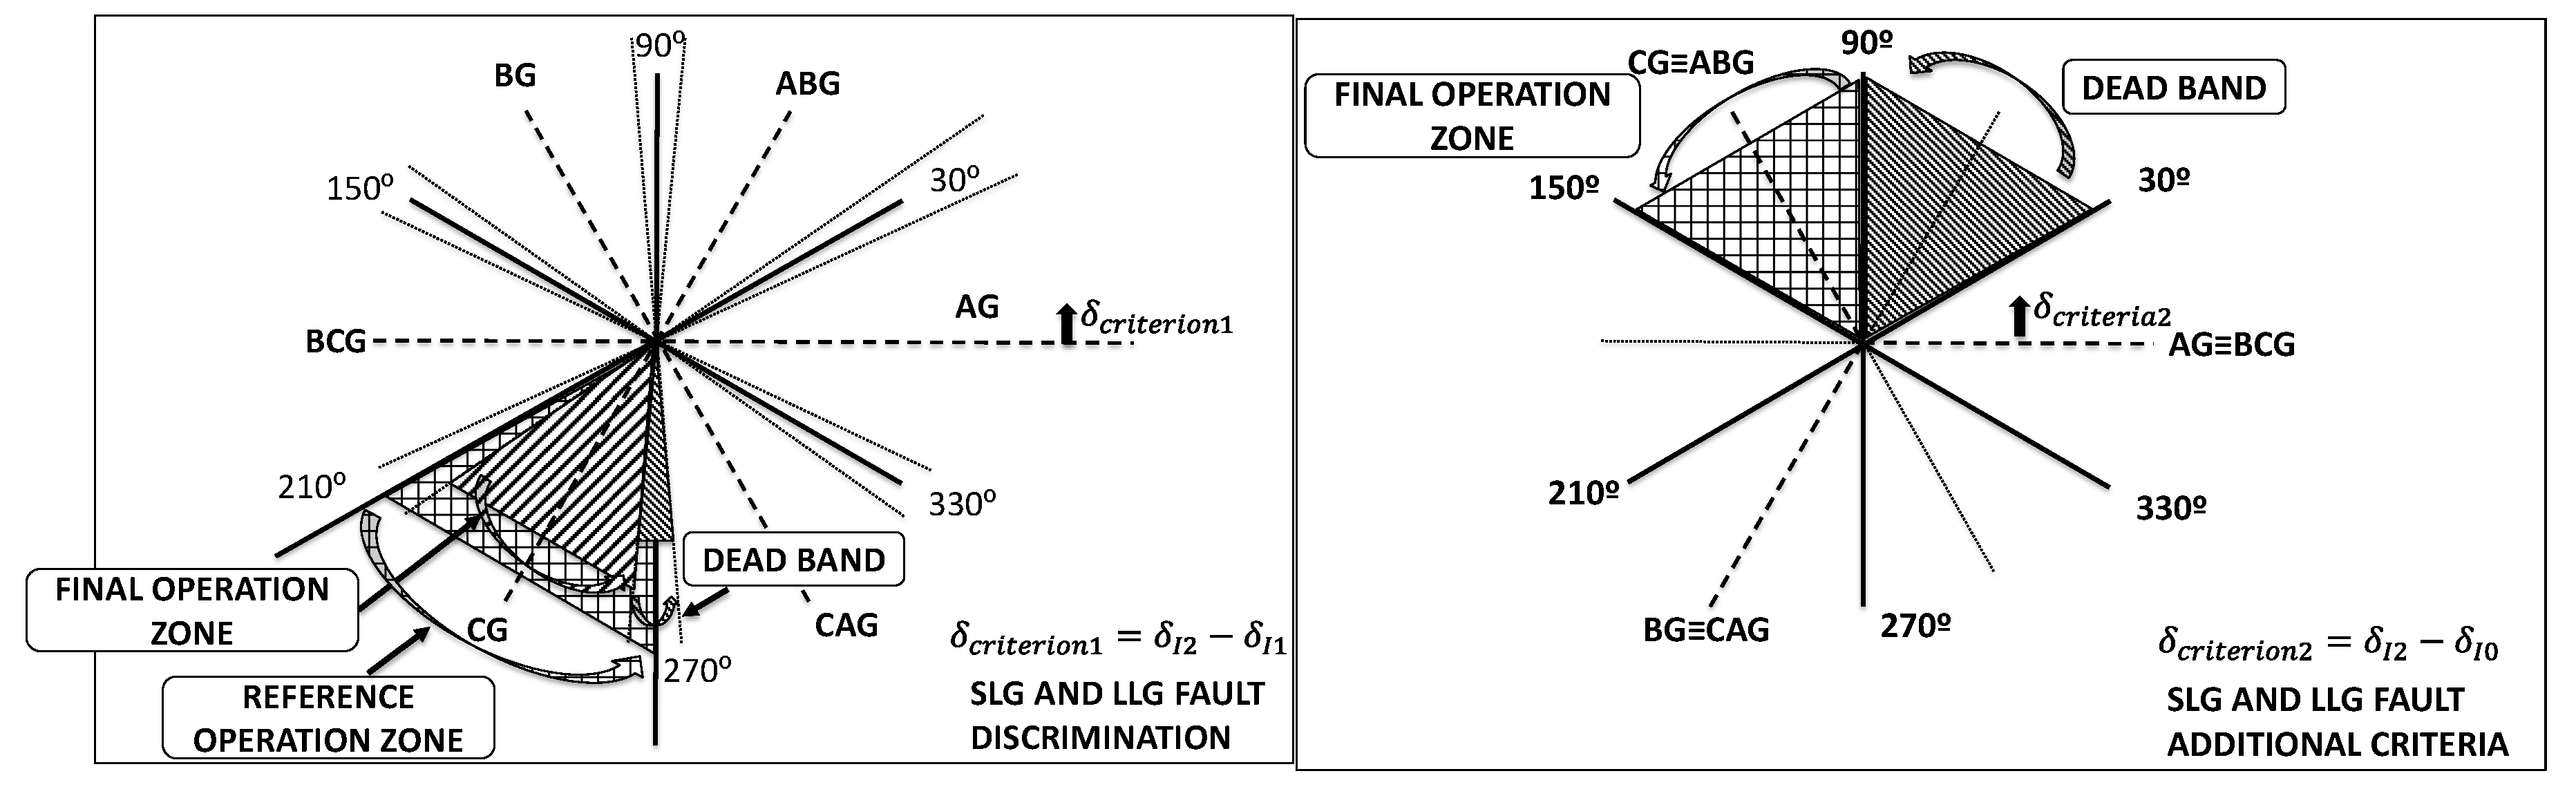
4.3. Criterion 2. Negative vs. Zero Sequence Currents
Criterion 2 is based on the comparison between negative and zero sequence currents [
17]. This criterion, although is only valid for grounded faults, provides the advantage that adjacent sectors in criterion 1 are delayed 120° in criterion 2, avoiding wrong faulted phase detection, providing an additional criterion, and giving more robustness to the decision. For example, form
Figure 11, it can be observed that ABG and CAG are adjacent sectors in criterion 1. On the other hand,
Figure 12 indicates that ABG is 120° leading AG and CAG is 120° lagging AG in criterion 2. Therefore, this criterion allows the algorithm to have a clearer identification of faulted phase for this type of fault, and provides an additional comparison to criterion 1.
As it can be observed in
Figure 12, AG and BCG faults share the sector 330° to 30°, CG and ABG faults share the sector 90° to 150° and finally BG and CAG faults share the sector 210° to 270°. In this case, sectors 30° to 90°, 150° to 210° and 270° to 330° are non-used sectors and considered as dead-band sectors as can be noticed in the picture.
Figure 13 shows an application of this criterion for a CG fault, where δ
criterion2 is between 90° and 150°.
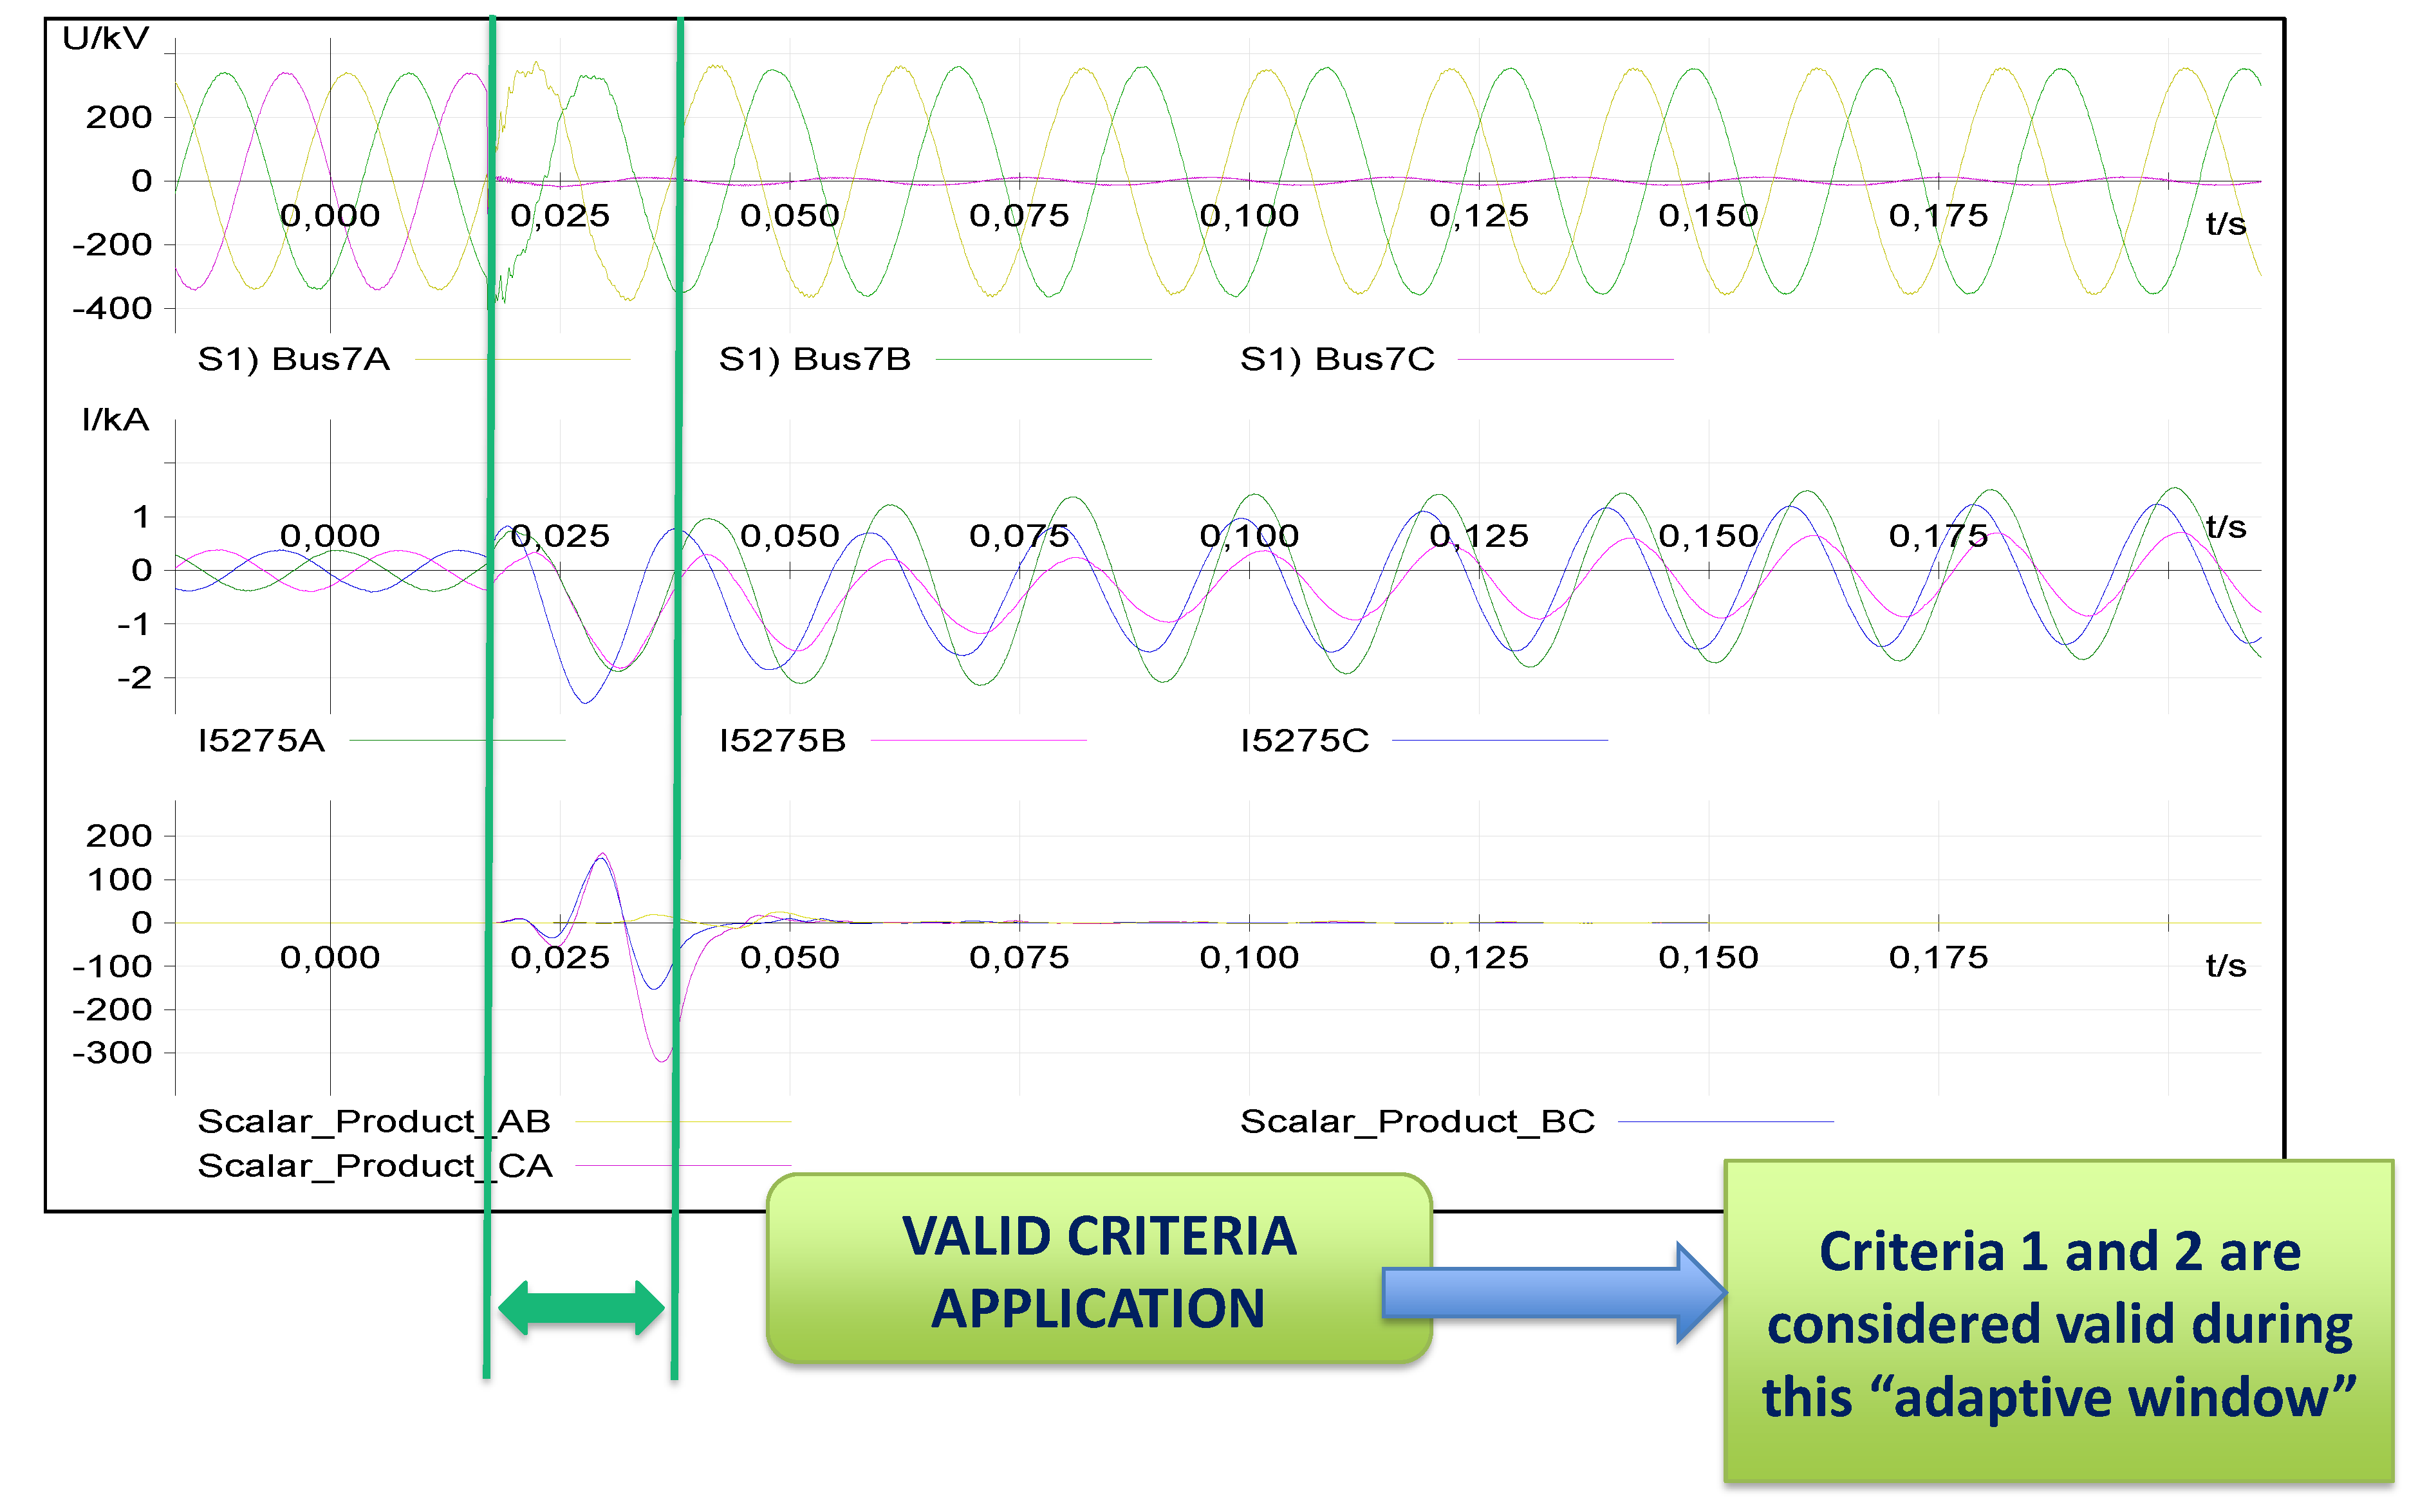
4.4. Adaptive Window Applied to Criteria 1 and 2
Waveforms coming from the output of scalar products definition based on superimposed quantities theory contains the information to define the adaptive window in which the information from criteria 1 and 2 is valid. In this step, maximums and minimums of the waveforms generated by these scalar products are used to define the start and end of the adaptive window.
Figure 13 shows phase to ground voltages, line currents and scalar products
,
and
waveforms in a SLG fault. By means of a maximum and minimum counting of the generated waveforms, the algorithm defines this adaptive window so that only during this lapse of time the criterion 1 and 2 will be considered. The number of maximum and minimums is related to the length of the adaptive window and is an additional setting of the protection relay and can be set as many other parameters in the relay according to the criteria of the company or the manufacturer.
Once the adaptive window is defined, angles of criterion 1 and criterion 2 are calculated and compared with the final operation zone defined in
Figure 11 and
Figure 12. If a dead band is set to zero, In CG faults,
δcriterion1 is between 210° and 270° and
δcriterion2 is between 90° and 150°. This can be appreciated in
Figure 14.
4.5. Criterion 3: Adaptation of the Superimposed Quantities Theory to Deal with Renewable Current Contribution
In addition to criterion 1 and 2 applied during the adaptive window, the algorithm uses the superimposed quantities theory to distinguish between the different types of fault adapting the criteria from
Table 1 to a network with high PE penetration level where this criteria is not valid, as has been stated in
Section 3. The new criteria for dealing with fault current contribution coming from renewables is shown in
Table 4. The settings proposed, as other parameters used in protection relays based on the experience and observability, were obtained on the large number of tests performed to the Type 4 WT and PV generator during hardware in the loop tests carried out in this research.
4.6. Directionality
Directionality declaration is based in the theory of superimposed quantities since directionality of the fault affects in the same way to positive, negative and zero sequence current and, thus criteria 1 and 2 are not able to provide information. Directionality of the fault is obtained taking into account that negative maximum peaks of scalar products indicates forward directionality while positive maximum inform about backward directionality [
20] as has been explained at the beginning of
Section 4.
5. Results
The behavior of the developed algorithm has been checked by replicating the same test cases applied to the four commercial protection relays and adding new test variables such as fault resistance and type of fault including different phases involved with the aim to enrich the study and check the robustness of the new algorithm. Accordingly, the following parameters define the different test carried out in the system shown in
Figure 2:
Two lines has been used to test the faults: Line 5–7 for Type 4 WT current contribution and line 4–5 for PV generator current contribution (see
Figure 2).
Faults has been simulated in four locations of each line under test: 0%, 50%, 70%, 90%, 100% forward of the line from bus 7 for type 4 WT and from bus 5 for PV generator. Additionally, for backward faults test in line 5–7 the fault is applied behind bus 5 (100% of the line from bus 7) with the protection located at bus 5.
Two generation levels have been defined: 40 and 200 MW and 100% of this generation is provided by renewable generators.
Nine types of faults have been tested: AG, BG, CG, AB, BC, CA, ABG, BCG, CAG.
Three fault resistance has been defined: 0, 1 and 10 ohm.
Each fault defined by the combination of these parameters is simulated three times to check the stability of the algorithm behavior. The overall number of combinations rises until 270 faults per line and per value of fault resistance.
Figure 15 shows the oscillography obtained by the developed algorithm in an AG fault at line 5–7 at the 70% of the line length with a fault resistance of 0 Ω and with a total installed generation of 200 MW. As it can be seen in the bottom of the figure, the proposed algorithm is able to obtain the correct faulted phases and directionality.
A summary of results is presented in
Table 5 and
Table 6, showing that the proposed solution helps to correctly detect the different faulted phases in, almost, 100% of the analyzed cases.
6. Conclusions
Faulted phase selection and directionality declaration were found to be affected by the current injection applied by the photovoltaic and Type 4 WT current injection during the hardware in the loop tests performed to four different commercial protection relays. This current injection provided by PV generator and Type 4 WT caused a delayed and lack of trips of distance protection due to the bad behavior of directionality and faulted phase selection algorithms. This malfunction of the faulted phase selection algorithm and directionality was confirmed theoretically using the superimposed quantities theory. Described fails in faulted phase selection and directionality directly affect the performance of distance protection, which is one of the most important and widely used protection function in High Voltage Networks.
Therefore, a new algorithm has been developed for dealing with the problems noticed in distance protection. This algorithm considers three criteria to provide a reliable output for the system and introduces an innovative concept called “adaptive window”, which eliminates the effect of the transition period of the control systems, avoiding wrong behaviors of the distance protection caused by the action of faulted phase selection and directionality algorithms.
Both the empirical analysis with commercial protection relays and the theoretical study performed based on superimposed quantity theory show that, during a short period of time, defined by several milliseconds (depending on the control system implemented) and until the control system reacts to reduce the current contribution to the fault coming from PV generator or Type 4 WT, the behavior of the renewable source can be considered similar to a SG. This fact was observed in the hardware in the loop tests carried out in RTDS with the four different manufacturers since it can be seen in the oscillography how the faulted phase selector and directionality are correctly applied during the first milliseconds after the fault inception, but they are in trouble when the control system moves to the transition period. This behavior observed in real protection relays through empirical analysis was confirmed with the theoretical analysis made using the superimposed quantity theory. During the first milliseconds, a similar behavior can be observed in the waveforms obtained with scalar products when comparing the fault current contribution from synchronous generation and from renewable generation (Type 4 WT). The algorithm developed, using the concept of the adaptive window is able to use this period of time when the behavior of Type 4 WT and PV generator is similar to a SG, enabling traditional faulted phase selection methods (negative sequence current vs positive sequence current angles, criterion 1, and negative sequence current vs zero sequence current angles, called criterion 2) to act. The multi-criteria algorithm includes, additionally, a third criterion that is based on the values obtained from scalar products adapted to Type 4 WT is also used in the algorithm. A combination of these three criteria, taking into account the enabling coming from the adaptive window, achieves a correct and reliable algorithm for faulted phase selection and directionality declaration.
The results from the tables shows the improvement achieved in the faulted phase selection and directionality algorithm. Solving the problem of faulted phase selection and directionality declaration will provide distance protection with improved tools to achieve an improved behavior under a high penetration of renewable energy scenarios.
7. Patents
Patent pending. A patent proposal, that covers the innovation of the adaptive window algorithm to deal with the current injection from renewable energies, was submitted to the European Patent Office of The Hague on April 2019. At the moment of submitting this paper, this patent proposal is waiting for the final exam.
Author Contributions
Investigation, E.M.C.; Methodology, E.M.C., M.T.V.M., S.B.V.; Software, E.M.C., M.T.V.M., S.B.V.; Supervision, S.B.V., M.P.C.M.; Validation, S.B.V.; Writing—original draft, E.M.C., M.P.C.M.; Writing—review & editing, E.M.C., M.P.C.M., M.T.V.M., S.B.V. All authors have read and agreed to the published version of the manuscript.
Funding
This paper and the study has received funding from the European Union’s Horizon 2020 research and innovation program under Grant Agreement No 691800.
Acknowledgments
In the frame of the Work Package 4 of MIGRATE Project, the collaboration and debate with Red Eléctrica de España (REE), Schneider Electric, TU Delft, University of Manchester, RTE and Elering were very fruitful for the development of the study and the proposed algorithm shown in this paper.
Conflicts of Interest
This paper reflects the MIGRATE consortium view and the European Commission is not responsible for any use that may be made of the information it contains.
References
- Salovaara, K.; Honkapuro, S.; Makkonen, M.; Gor, O. 100% renewable energy system—challenges and opportunities for electricity market design. In Proceedings of the 2016 13th International Conference on the European Energy Market (EEM), Porto, Portugal, 6–9 June 2016. [Google Scholar]
- Shaik Honnurvali, M.; Gupta, N.; Goh, K.; Umar, T.; Kabbani, A.; Nazecma, N. Can Future Smart Cities Powered by 100% Renewables and Made Cyber Secured-A Analytical Approach. In Proceedings of the 2019 IEEE 12th International Conference on Global Security, Safety and Sustainability (ICGS3), London, UK, 16–18 January 2019. [Google Scholar]
- Elnaggar, A.K.; Rueda, J.L.; Erlich, I. Comparison of short-circuit current contribution of Doubly-Fed induction generator based wind turbines and synchronous generator. In Proceedings of the IEEE Powertech Grenoble Conference, Grenoble, France, 16–20 June 2013. [Google Scholar]
- Khan, U.; Maqbool, U.A. Fault current analysis for grid-connected and Islanded microgrid modes. In Proceedings of the 2017 13th International Conference on Emerging Technologies (ICET), Islamabad, Pakistan, 27–28 December 2017. [Google Scholar]
- Alvin, T.G.M.; Abidin, I.Z.; Hashim, H. Changes in fault current levels due to renewable embedded generation in a distribution network. In Proceedings of the 2013 IEEE Conference on Clean Energy and Technology (CEAT), Lankgkawi, Malaysia, 18–20 November 2013. [Google Scholar]
- Li-Hsiung, C. Overcurrent protection for distribution feeders with renewable generation. Int. J. Electr. Power Energy Syst. 2017, 84, 202–213. [Google Scholar]
- Meraj Alam, M.; Leite, H.; Liang, J. Effects of VSC based HVDC system on distance protection of transmission lines. Int. J. Electr. Power Energy Syst. 2017, 92, 245–260. [Google Scholar] [CrossRef]
- Shahzad, U.; Sohrab, A. A Comprehensive Review of Protection Schemes for Distributed Generation. Energy Power Eng. 2017, 9, 430–463. [Google Scholar] [CrossRef]
- Telukunta, V.; Pradhan, J.; Agrawal, A.; Singh, M.; Garudachar Srivani, S. Protection Challenges Under Bulk Penetration of Renewable Energy Resources in Power Systems: A Review. Csee J. Power Energy Syst. 2017, 3, 365–379. [Google Scholar] [CrossRef]
- Li, Y.; Jia, K.; Bi, T.; Yan, R.; Li, W.; Liu, B. Analysis of line current differential protection considering inverter-interfaced renewable energy power plants. In Proceedings of the IEEE PES Innovative Smart Grid Technologies Conference Europe (ISGT-Europe), Torino, Italy, 26–29 September 2017. [Google Scholar]
- Dubey, R.; Samantaray, S.R.; Panigrahi, B.K.; Venkoparao, G.V. Adaptive distance relay setting for parallel transmission network connecting wind farms and UPFC. Int. J. Electr. Power Energy Syst. 2015, 65, 113–123. [Google Scholar] [CrossRef]
- Pradhan, A.K.; Joos, G. Adaptive distance relay setting for lines connecting wind farms. IEEE Trans. Energy Convers. 2007, 22, 206–213. [Google Scholar] [CrossRef]
- Sadeghi, H. A novel method for adaptive distance protection of transmission line connected to wind farms. Int. J. Electr. Power Energy Syst. 2012, 43, 1376–1382. [Google Scholar] [CrossRef]
- Wu, Y.K.; Lin, Z.T.; Lee, T.C.; Hsieh, T.Y.; Lin, W.M. Adaptive setting and simulation of distance protection relay in a long transmission system connected to an offshore wind farm. J. Clean Energy Technol. 2016, 4, 401–407. [Google Scholar] [CrossRef]
- Hooshyar, A.; Azzouz, M.A.; El-Saadany, E.F. Distance protection of lines connected to induction generator-based wind farms during balanced faults. IEEE Trans. Sustain. Energy 2014, 5, 1193–1203. [Google Scholar] [CrossRef]
- He, L.; Liu, C.C.; Pitto, A.; Cirio, D. Distance protection of AC grid with HVDC-connected offshore wind generators. IEEE Trans. Power Deliv. 2014, 29, 493–501. [Google Scholar] [CrossRef]
- Costello, D.; Zimmerman, K. Determining the Faulted Phase. In Proceedings of the 36th Annual Western Protective Relay Conference, Spokane, WA, USA, 20–22 October 2009. [Google Scholar]
- Dzienis, C.; Kereit, M.; Blumschein, J. Analysis of High-Speed-Distance Protection. In Proceedings of the International Conference on Advanced Power System Automation and Protection, Beijing, China, 16–20 October 2011. [Google Scholar]
- Erlich, I.; Neumann, T.; Shewarega, F.; Schegner, P.; Meyer, J. Wind turbine negative sequence current control and its effect on power system protection. In Proceedings of the Power and Energy Society General Meeting (IEEE-PES), Vancouver, BC, Canada, 21–25 July 2013. [Google Scholar]
- Benmouyal, G.; Mahseredjian, J. A Combined Directional and Faulted Phase Selector Element Based on Incremental Quantities. IEEE Trans. Power Deliv. 2001, 16, 478–484. [Google Scholar] [CrossRef]
- Horton, P.; Swain, S. Using superimposed principles (delta) in protection techniques in an increasingly challenging power network. In Proceedings of the 2017 70th Annual Conference for Protective Relay Engineers (CPRE), College Station, TX, USA, 3–6 April 2017. [Google Scholar]
- Martinez, E.; Villén, M.T.; Borroy, S.; López, D.; Popov, M.; Grasset, H. Effects of Type-4 Wind Turbine on present protection relaying algorithms. In Proceedings of the PACWORLD—Protection, Automation and Control World Conference, Sofia, Bulgaria, 25–28 June 2018. [Google Scholar]
- Martinez, E.; Villén, M.T.; Borroy, S.; López, D.; Popov, M.; Grasset, H. Empirical analysis of potential improvements for high voltage protective algorithms. In Proceedings of the PACWORLD—Protection, Automation and Control World Conference, Sofia, Bulgaria, 25–28 June 2018. [Google Scholar]
- Walling, R.; Gursoy, E.; English, B. Current contribution from Type 3 and Type 4 wind turbine generators during faults. In Proceedings of the IEEE Power and Energy Society General Meeting, Detroit, MI, USA, 24–28 July 2011. [Google Scholar]
- Wijnhoven, T.; Deconinck, G.; Neumann, T.; Erlich, I. Control aspects of the dynamic negative sequence current injection of type 4 wind turbines. In Proceedings of the PES General Meeting | Conference & Exposition IEEE, National Harbor, MD, USA, 27–31 July 2014. [Google Scholar]
- Janssen, A.J.; van Riet, M.; Au-Yeung, J. Fault current contribution from the state of the art DG’s and its limitation. In Proceedings of the International. Conference Power System Transients, Delft, The Netherlands, 14–17 July 2011. [Google Scholar]
- Neumann, T.; Erlich, I. Short Circuit Current Contribution of a Photovoltaic Power Plant. IFAC Proc. Vol. 2012, 45, 343–348. [Google Scholar] [CrossRef]
- Teodorescu, R.; Liserre, M.; Rodríguez, P. Chapter 10: Control of grid converters under grid faults. In Grid Converters for Photovoltaic and Wind Power Systems, 1st ed.; Wiley and Sons Publications: Chicheter, West Sussex, UK, 2011; Volume 1, pp. 237–289. [Google Scholar]
- Benmouyal, G.; Roberts, J. Superimposed Quantities: Their True Nature and Application in Relays. In Proceedings of the 26th Annual Western Protective Relay Conference, Spokane, WA, USA, 26–28 October 1999. [Google Scholar]
- Blumschein, J.; Dzienis, C.; Kereit, M. Directional Comparison based on High-Speed-Distance Protection using Delta Quantities. In Proceedings of the Western Protective Relay Conference, Spokane, WA, USA, 14–16 October 2014. [Google Scholar]
- Rahmati, A.; Adhami, R. A Fault Detection and Classification Technique Based on Sequential Components. IEEE Trans. Ind. Appl. 2014, 50, 4202–4209. [Google Scholar] [CrossRef]
Figure 1.
Hardware in the loop testing. Laboratory test-bench and signals exchanged.
Figure 1.
Hardware in the loop testing. Laboratory test-bench and signals exchanged.
Figure 2.
Benchmark model.
Figure 2.
Benchmark model.
Figure 3.
Distribution of missed trips between different types of faults for the four different vendors (percentage of missed trips over the total number of faults) for 100% renewables scenario for type 4-WT.
Figure 3.
Distribution of missed trips between different types of faults for the four different vendors (percentage of missed trips over the total number of faults) for 100% renewables scenario for type 4-WT.
Figure 4.
Distribution of missed trips between different types of faults for the four different vendors (percentage of missed trips over the total number of faults) for 100% renewables scenario for PV generator.
Figure 4.
Distribution of missed trips between different types of faults for the four different vendors (percentage of missed trips over the total number of faults) for 100% renewables scenario for PV generator.
Figure 5.
Fault contribution from Type 4 WT with negative sequence current suppression strategy [
22,
23].
Figure 5.
Fault contribution from Type 4 WT with negative sequence current suppression strategy [
22,
23].
Figure 6.
Instantaneous values of scalar products based on superimposed quantities theory for AG fault when current contribution comes from SG (a) or Type 4 WT (b).
Figure 6.
Instantaneous values of scalar products based on superimposed quantities theory for AG fault when current contribution comes from SG (a) or Type 4 WT (b).
Figure 7.
Instantaneous values of scalar products based on superimposed quantities theory for AB fault when current contribution comes from SG (a) or Type 4 WT (b).
Figure 7.
Instantaneous values of scalar products based on superimposed quantities theory for AB fault when current contribution comes from SG (a) or Type 4 WT (b).
Figure 8.
Instantaneous values of scalar products based on superimposed quantities theory for ABG fault when current contribution comes from SG (a) or Type 4 WT (b).
Figure 8.
Instantaneous values of scalar products based on superimposed quantities theory for ABG fault when current contribution comes from SG (a) or Type 4 WT (b).
Figure 9.
Initial fault classification.
Figure 9.
Initial fault classification.
Figure 10.
General diagram of the algorithm using multiple criteria and the adaptive window.
Figure 10.
General diagram of the algorithm using multiple criteria and the adaptive window.
Figure 11.
Criterion 1 for single line to ground and line to line to ground faults (a) and line to line faults (b).
Figure 11.
Criterion 1 for single line to ground and line to line to ground faults (a) and line to line faults (b).
Figure 12.
Criterion 2 for single line to ground and line to line to ground faults Operation principle based on sequence networks [
17].
Figure 12.
Criterion 2 for single line to ground and line to line to ground faults Operation principle based on sequence networks [
17].
Figure 13.
Adaptive window for a SLG fault.
Figure 13.
Adaptive window for a SLG fault.
Figure 14.
Application of Criterion 1 and Criterion 2 to CG faults.
Figure 14.
Application of Criterion 1 and Criterion 2 to CG faults.
Figure 15.
Phase A to ground fault, R = 0 ohm, Generation = 200 MW, Point of the line = 70%.
Figure 15.
Phase A to ground fault, R = 0 ohm, Generation = 200 MW, Point of the line = 70%.
Table 1.
Classical classification of different types of fault according to the values of scalar products for a synchronous grid [
29].
Table 1.
Classical classification of different types of fault according to the values of scalar products for a synchronous grid [
29].
| Fault Type | | | |
|---|
| | | |
| | | |
| | | |
| | | |
| | | |
| | | |
| ABC | | | |
Table 2.
Margin of action for AB and ABG faults [
20].
Table 2.
Margin of action for AB and ABG faults [
20].
| Fault Type | | | |
|---|
| |
|
|
Table 3.
Summary of results obtained in the comparison done between synchronous generator and Type 4 WT with AG, AB and ABG fault using instantaneous scalar products.
Table 3.
Summary of results obtained in the comparison done between synchronous generator and Type 4 WT with AG, AB and ABG fault using instantaneous scalar products.
| Type of Fault | | | |
|---|
Sync.
Generator | Type 4 WT | Sync.
Generator | Type 4 WT | Sync.
Generator | Type 4 WT |
|---|
| AG | | | ≈0 | <0 | | <0.25· |
| AB | | | | ≈ | | <0 |
| ABG | | | ≈ | | ≈ | ≈0 |
Table 4.
New criteria proposed.
Table 4.
New criteria proposed.
| Fault Type | | | |
|---|
| | | NC |
| BG | NC | | |
| | NC | |
| |
| NC |
| NC | |
|
|
| NC | |
Table 5.
Algorithm behaviour. Summary of results obtained for different faults fed by Type-4 WT.
Table 5.
Algorithm behaviour. Summary of results obtained for different faults fed by Type-4 WT.
| | R = 0 ohm | R = 1 ohm | R = 10 ohm | Overall Results | |
|---|
| Type of Fault | Correct Detection | Wrong Detection | Correct Detection | Wrong Detection | Correct Detection | Wrong Detection | Correct Detection | Wrong Detection | Correct (%) |
|---|
| AG | 30 | 0 | 30 | 0 | 30 | 0 | 90 | 0 | 100% |
| BG | 30 | 0 | 30 | 0 | 29 | 1 | 89 | 1 | 99% |
| CG | 28 | 2 | 29 | 1 | 30 | 0 | 87 | 3 | 97% |
| ABG | 30 | 0 | 30 | 0 | 30 | 0 | 90 | 0 | 100% |
| BCG | 27 | 3 | 27 | 3 | 29 | 1 | 83 | 7 | 92% |
| CAG | 30 | 0 | 30 | 0 | 30 | 0 | 90 | 0 | 100% |
| AB | 30 | 0 | 30 | 0 | 30 | 0 | 90 | 0 | 100% |
| BC | 30 | 0 | 30 | 0 | 30 | 0 | 90 | 0 | 100% |
| CA | 30 | 0 | 30 | 0 | 30 | 0 | 90 | 0 | 100% |
| TOTAL | 265 | 5 | 266 | 4 | 268 | 2 | 799 | 11 | 99% |
Table 6.
Algorithm behaviour. Summary of results obtained for different faults fed by PV generator.
Table 6.
Algorithm behaviour. Summary of results obtained for different faults fed by PV generator.
| | R = 0 ohm | R = 1 ohm | R = 10 ohm | Overall Results |
|---|
| Type of Fault | Correct Detection | Wrong Detection | Correct Detection | Wrong Detection | Correct Detection | Wrong Detection | Correct Detection | Wrong Detection | Correct (%) |
|---|
| AG | 30 | 0 | 30 | 0 | 30 | 0 | 90 | 0 | 100% |
| BG | 30 | 0 | 30 | 0 | 30 | 0 | 90 | 0 | 100% |
| CG | 30 | 0 | 30 | 0 | 30 | 0 | 90 | 0 | 100% |
| ABG | 30 | 0 | 30 | 0 | 30 | 0 | 90 | 0 | 100% |
| BCG | 30 | 0 | 30 | 0 | 30 | 0 | 90 | 0 | 100% |
| CAG | 30 | 0 | 30 | 0 | 30 | 0 | 90 | 0 | 100% |
| AB | 30 | 0 | 30 | 0 | 30 | 0 | 90 | 0 | 100% |
| BC | 30 | 0 | 30 | 0 | 30 | 0 | 90 | 0 | 100% |
| CA | 30 | 0 | 30 | 0 | 30 | 0 | 90 | 0 | 100% |
| TOTAL | 270 | 0 | 270 | 0 | 270 | 0 | 810 | 0 | 100% |
© 2020 by the authors. Licensee MDPI, Basel, Switzerland. This article is an open access article distributed under the terms and conditions of the Creative Commons Attribution (CC BY) license (http://creativecommons.org/licenses/by/4.0/).


