Abstract
Aimed at the influence of the vibration environment on the performance degradation of AC contactors, the purpose of this study is to investigate the failure mechanism of AC contactors under vibration conditions. During the closing process of AC contactors, the impact energy of the iron core may change due to the vibration stress, which may have an uncertain effect on the parameters of the dynamic response characteristics of the contact, and affect the working performance and service life of AC contactors. In this paper, a double-E AC contactor is selected as the research object. Based on the calculation of the transient magnetic field of the electromagnetic mechanism, an energy distribution model of the AC contactor is established. Based on this, considering the influence of vibrations and the input electrical energy under different closing phase angles, the energy model of the iron core collision under simple harmonic oscillation is investigated. The steady-state vibration energy at different frequencies and accelerations is calculated, and its influence on the dynamic response parameters of the AC contactor is analyzed. Finally, the simulation model is verified by experimental data. The results show that the energy analysis model can effectively reflect and explain the uncertainty of the dynamic characteristics of AC contactors under vibrations, from the perspective of the mechanism.
1. Introduction
AC contactors are commonly used in the main or large-capacity control circuits for frequent and long-distance operation. The usage amount and application area of AC contactors keep increasing with the development of social production and technology. The service life of AC contactors is closely related to the dynamic characteristics during the operation.
At present, the research on the electromagnetic mechanism of AC contactors is mainly focused on characteristic test devices, simulation calculations, and optimizing designs. The technology and research methods for testing dynamic characteristics of AC contactors are developing rapidly. Researchers achieve a full range of testing and analysis of the dynamic process of the electromagnetic mechanism by designing and improving the dynamic characteristic test device, making the test system performance more stable and reliable while measuring the dynamic parameters more accurately [1,2,3]. This research method of dynamic characteristics based on the test system is disturbed by factors such as test equipment, prototype characteristics and the interference environment. Therefore, virtual prototype technology is widely used to simulate the working process of AC contactors. Based on the calculation method of the electromagnetic field and magnetic circuit [4], a mathematical model for solving the working characteristics of AC contactors is established. In this type of research, it is necessary to consider the coupling relationship of multiple physical fields of electricity, magnetism and mechanics, and the model construction is relatively complicated. The finite element method is gradually applied to calculate the dynamic characteristics of electromagnetic systems. The simulation results of the discrete static magnetic field are substituted into the equations of electromagnetic fields and mechanical movement [5,6] to solve the coupled problem. The magnetic ring component is added to the magnetic field simulation calculation model [7] to achieve a more accurate calculation of electromagnetic force. Maxwell has been widely used in electromagnetic field finite element analysis in various fields. Based on the finite element calculation model of the transient magnetic field of the AC contactor established by Maxwell, the influence of factors such as armature parameters and magnetic rings [8,9] on the dynamic characteristics is analyzed to achieve the optimal design of the electromagnetic mechanism. However, most studies directly calculate and analyze the current signals simulated or contact bounce simulated through the established models, lacking in-depth theoretical analysis on the working principle of AC contactors and the overall control process.
During the closing process, the contact bounce is one of the key factors affecting the contact wear and electrical life [10,11,12]. If the energy of the core collision of the electromagnetic mechanism is too large, it may cause the second bounce from the contact [13]. The second bounce will cause the contact to be ablated and greatly reduce the electrical life of the contactors. During the operation of AC contactors, the coil closing phase angle is closely related to the closing process of the AC contactor [14]. Closing under the optimal phase of the coil voltage can further reduce the core collision, thereby reducing the number of bounces and bounce time, and increasing the service life of contactors [15]. In addition to the closing phase angle, the change of the coil voltage [16,17] is also an important factor affecting the dynamic characteristics of AC contactors. With the input of new power equipment, many electrical products including contactors, are located in a harsh working environment. Vibration stress is a relatively intuitive and ubiquitous environmental influence factor and the long-term vibration working environment will have a direct and important impact on the dynamic characteristics and reliability of AC contactors. By designing the vibration testing scheme, the failure mechanism of mechanical and electrical characteristics of railway relays under vibrations is studied [18]. Taking the contact spring component of the railway signal relay as the research object [19], the contact pressure is used as a parameter reflecting the working characteristics of the contact spring system, and the contact pressure under different vibration frequencies and accelerations is simulated and analyzed. However, most studies on the influence of vibrations are based on the vibration test, and there is a lack of mechanism research of the reasons for the impact of vibration stress on dynamic characteristics.
Therefore, in order to solve the above problems, an energy distribution calculation model is constructed based on the working parameters of AC contactors during the closing process, which are calculated by the 3D transient magnetic field simulation model of the electromagnetic mechanism. From the principle of energy conversion, if the input energy is greater than the energy consumed by the coil and other forms, it is considered that the excess energy will be consumed in the form of bouncing. Based on the calculation of energy distribution, the overall working process and the causes of differences in dynamic characteristics of AC contactors are analyzed. We then consider the vibration energy as an input energy of the electromagnetic mechanism, and analyze the impact of different vibration forms on the dynamic characteristics of AC contactors. The mechanism analysis of the cause of the impact of vibration stress on dynamic characteristics is realized, which can establish the foundation for further research.
2. Energy Calculation Model of Electromagnetic Mechanism
2.1. Transient Magnetic Field Finite Element Calculation
We take an AC contactor with the double E-shaped iron cores as the research object whose rated current is 25 A. ANSYS Maxwell is employed to establish a simulation model that can calculate the working characteristic parameters of the AC contactor during the closing process [20]. The model includes cores, magnetic rings, the coil, the air domain, and the core motion domain. Based on the actual parameters of the experimental prototype, the 3D simulation model of transient magnetic field finite element calculation shown in Figure 1 is established. In Maxwell, the motion of the moving core can be customized by establishing a motion domain. We mesh the components in the model and set the boundary conditions. Because the constructed simulation model is a full 3D model, the system default boundary conditions are adopted, that is, the interface boundary of the components is the natural boundary condition, and the outer boundary is the Neumann boundary condition. An external circuit is constructed through the circuit module to provide power supply for the coil and the transient solver is used to realize the collaborative simulation of the electromagnetic components and the control circuit.
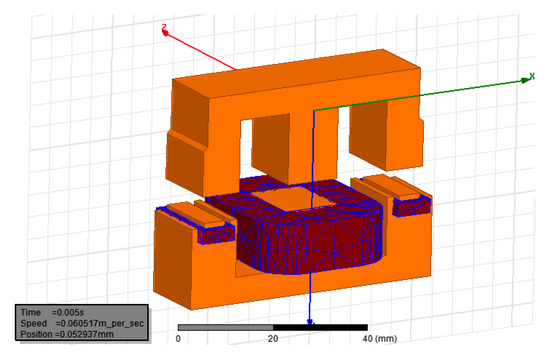
Figure 1.
The 3D simulation model.
In the finite element calculation of the transient magnetic field, it is necessary to solve both the transient electromagnetic process and the transient mechanical motion process. The edge method is used in the transient electromagnetic process. The discrete calculation method is used to solve the displacement x in the transient mechanical motion process, as shown in Equation (1):
The virtual displacement method is used to calculate the magnetic field force, and the average force FAV on the component in the model can be obtained by Equation (2):
During the closing process of the AC contactors, the load force Ff received by the moving core is generated by the reaction force of the main spring and the contact springs. According to the displacement parameter of the moving core, Ff can be divided into two stages for calculation. In the first stage, the contacts have not yet closed. Under the preload of the contact springs, the moving contact bridges move with the moving core. At this stage, Ff is only generated by the main spring. In the second stage, the main contacts are closed. The contact bridges compress contact springs and exert the force on the core to hinder its closing movement.
k1 is the stiffness of the main spring; k2 is the stiffness of the contact springs; x0 is the preload constant of the main spring; xc0 is the preload constant of the contact springs; x is the displacement of the moving core and xc is the contact spacing.
2.2. Calculation of Energy Distribution
When the coil of AC contactor is energized, a magnetic field is generated and the magnetic core is pulled down by the action of the magnetic field. When the coil winding is energized, the alternating magnetic field generated will cause hysteresis loss and eddy current loss, which will cause the core to generate heat. In addition, due to the internal resistance of the coil, a certain amount of power is consumed when the current passes, and this part of the loss is often consumed as thermal energy.
From the perspective of energy analysis, since the closing process of the iron cores is very short, ignoring hysteresis loss and eddy current loss, it can be considered that the input electric energy Wi is converted into coil loss energy WR, magnetic field energy Wm, potential energy of the spring Es, kinetic energy of the core Ek, the loss of energy caused by friction, collision, etc., Ef, which satisfy the law of conservation of energy, as shown in Equation (4):
Wi = WR + Wm + Es + Ek + Ef
2.2.1. Conversion and Calculation among Different Energies
After the coil is powered up, the coil current generates a magnetic field and a suction force is generated between the cores. The induced magnetic field produces an induced current that resists current flow through the coil. According to Ohm’s law:
Ignoring the hysteresis loss and eddy current loss of the ferromagnetic material, the input electric energy is converted into two parts, one part is converted into the magnetic field energy Wm by the energy storage function of coil inductor, and the other part is the coil loss WR generated by the loop resistance and releases the Joule heat. The relationship is expressed by Equation (7):
The coil loss WR is related to the coil resistance R, the coil current i(t), and power on time t. The calculation formula is shown in Equation (8):
Since the core pick-up time during the operation of AC contactors is short, the change of the coil resistance R caused by the coil temperature rise during the process can be ignored. The coil current i(t) and the power on time t can be calculated by the simulation model.
The magnetic field energy Wm is different from the coil loss WR. The magnetic field energy Wm will not be lost. In certain conditions, it can be released and converted into other forms of energy. The magnetic field energy Wm is related to the magnetic field energy density wm.
H is the magnetic field strength and B is the magnetic flux density. Considering the nonlinear permeability of the ferromagnetic material, for any finite element, the total magnetic energy Wm can be obtained by accumulating the energy of each finite element magnetic field, as shown in Equation (10):
where B and H are affected by the value of coil current and the air gap between cores. Therefore, the magnetic field energy Wm is related to the coil current and the core gap. During the closing process of the contactor, Wm increases with the increase of coil current i(t), and at the same time overcomes the reaction force of the spring and drives the moving parts including the iron core. As the value of air gap between cores decreases, some of the magnetic field energy Wm is converted into the potential energy of the spring Es, the kinetic energy of moving part Ek, and the friction loss Ef. The potential energy of the spring Es can be calculated using Equation (11):
where x is the spring compression displacement and F(x) is the spring reaction force calculated. The moving part kinetic energy Ek and the friction loss Ef constitute the mechanical loss energy of the electromagnetic mechanism. When the coil starts to be energized, the movable iron core starts moving under the influence of the magnetic field and simultaneously drives the moving parts, so that the kinetic energy Ek increases. If the energy loss caused by air friction is neglected, there is no obvious change on Ef. When the moving and static cores collide, the kinetic energy Ek is lost due to the collision and Ef stepped increases. Without considering the possibility of iron bouncing, the growth of Ef can be reflected in three stages. In the first stage, some of the kinetic energy loss becomes thermal energy loss and the rest becomes the kinetic energy of the contact bounce and the potential energy of the spring of contact. In the second stage, the contacts collide again under the action of the spring, and the kinetic energy and potential energy continue to be converted into frictional thermal energy loss. There is a continuous small fluctuation, which reflects the process of contact from instable closing state to stable closing state. In the third stage, Ek is 0 when the cores and the contacts are stably closed, and the friction loss tends to be stable. The kinetic energy of the moving parts can be calculated by Equation (12):
Ek = mv2/2
2.2.2. Calculation Model of Energy Distribution during the Closing Process
Based on the finite element simulation model of transient magnetic field, the working parameter curves of AC contactor under 220 V/50 Hz and 0° closing phase angle are simulated. The calculated working parameter curves are shown in Figure 2a. In the figure, the dotted line is the excitation voltage u(t), the solid line is the coil current i(t), the dash-dot line is the force of spring compression f(t), and the dashed line is the core speed v(t).
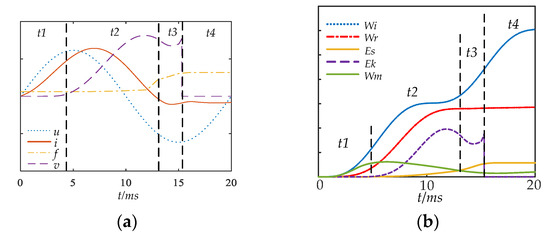
Figure 2.
Energy distribution. (a) Working parameter curves; (b) Energy characteristic curves.
On the basis of the working parameters calculated by simulation, an energy calculation model of the electromagnetic mechanism is established, as shown in Figure 2b. In the figure, the dotted line is the input electric energy Wi, the dash-dot line is the coil loss Wr, the yellow solid line is the potential energy of spring Es, the dashed line is the kinetic energy of moving parts Ek, and the green solid line is the magnetic field energy Wm. In order to enable more intuitive analysis, the magnitude of each energy has been unified.
Through the comparative analysis of the working parameter curves and the energy characteristic curves, the closing process can be divided into four stages. The energy distribution of each stage of the working process of the electromagnetic mechanism is analyzed below.
t1 stage: The coil starts to be energized, but the electromagnetic attraction force has not overcome the reaction force of the spring to drive the core and contacts. With the increase of Wi, the magnetic field energy Wm increases, the current through the coil generates the coil loss Wr, Es and Ek remain unchanged.
t2 stage: Under the action of electromagnetic attraction, the iron core drives the contacts to start moving. There are zero-crossings in the voltage and current waveforms, therefore Wi rises with fluctuation. Because the coil current is relatively large during the closing process, the coil loss Wr increases rapidly. Under the action of the magnetic field, part of the magnetic field energy is converted into the kinetic energy Ek of the iron core and the growth potential energy Es of the spring, and the magnetic field energy Wm decreases.
t3 stage: The contacts are closed and the core continues to move. The distance between the moving and static cores is getting shorter and shorter, and the cores collide at the end of this stage. The kinetic energy of the moving core at this closing moment determines the magnitude of the collision energy.
t4 stage: The iron cores remain in a closed state. The input energy Wi is mainly converted into the coil loss Wr and the magnetic field energy Wm. The kinetic energy Ek of the core is converted into mechanical friction loss in the form of thermal energy, and the energy that is not completely consumed by the friction loss is converted into the secondary bounce caused by collision.
2.2.3. Energy Distribution at Different Closing Phase Angles
When the closing phase angles of the excitation voltages of the coils are different, there is a large difference in the energy distribution of the system that takes place during the closing process. Most of the input energy Wi will be converted into coil loss energy Wr, and the other energy will be converted into magnetic field energy Wm, kinetic energy of moving parts Ek and potential energy of the spring Es. At the end of the movement before the collision, the greater the kinetic energy of the moving parts is, the higher the mechanical loss of energy after the collision will be. High collision energy will cause the occurrence of contact bounce and affect the dynamic characteristics of the AC contactor. Many studies have shown that different closing phase angles will affect the dynamic characteristics of the AC contactor during the closing process, and the dynamic performance of the contacts is poor at 60° [21]. As shown in Figure 3, it is the energy distribution diagram of the same AC contactor at different coil circuit closing phase angles. From the perspective of the simulation data results, at the coil voltage U = 220 V/50 Hz and the closing phase angle 60°, the kinetic energy distribution of the moving parts is lower in the initial stage of the closing process and higher in the final stage of the suction. Compared with the distribution at 0°and 90°phase angles, the converted kinetic energy Ek of the moving parts of the electromagnetic mechanism is concentrated in the final stage of the suction. Furthermore, the mechanical loss energy Ef converted from the kinetic energy Ek by the collision is larger, and the dynamic characteristic of contacts is poor.
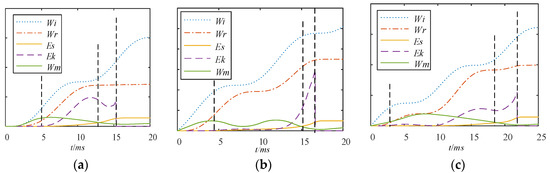
Figure 3.
Energy distribution at different closing phase angles. (a) 0°; (b) 60°; (c) 90°.
Due to the different input energy of the system at different closing phase angles, distributions of the energy converted during the operation of AC contactors are different, and therefore the movement state and dynamic characteristics of AC contactors during the closing process show a certain difference. In subsequent studies, in order to analyze the influence of vibration factors on dynamic characteristics more intuitively, the closing phase angle is fixed at 0°.
3. Energy Distribution Model of Electromagnetic Mechanism under Vibration
The vibration factor that affects the performance of AC contactors is usually caused by the shaking of the installation environment. The AC contactor is abstracted into a single-degree-of-freedom system to analyze the forced vibration caused by the continuous external vibration excitation. In the simulations and experiments we use a vibration table to simulate the vibration environment in engineering problems. Under continuous excitation of harmonic vibration, the response of the single-degree-of-freedom system is a simple harmonic steady-state vibration without considering the transient vibration process in the initial stage. In practical engineering problems, simple harmonic excitation is less than other periodic or non-periodic vibrations; however, some laws and characteristics obtained by studying the various responses of the system caused by simple harmonic excitation are the basis for analyzing and studying more general and more complicated vibration problems.
3.1. Forced Vibration Analysis
Figure 4 is a simplified mechanical model of forced vibration of a single-degree-of-freedom system under supporting motion.
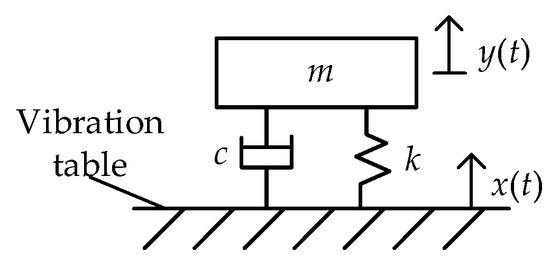
Figure 4.
Vibration model of a single-degree-of-freedom system.
Let x(t) be the displacement of the vibration table and y(t) be the displacement of object m. By Newton’s second law, the differential equation of motion is shown in Equation (13):
my’’ + cy’ + ky = cx’ + kx
It can be seen that the supporting motion is equivalent to two excitation forces acting on the system with different phases. The former is 90° ahead of x(t) in phase, and the latter is in the same phase as x(t) [22]. For the simple harmonic vibration x(t) = A0sinθt, y(t) can be solved in Equation (14):
where ξ is the damping ratio, ω is the natural frequency of the system, and θ is the excitation angular frequency. The first part of the right end of Equation (14) represents the damped free vibration of the system due to the initial conditions whose frequency is ωr; the second part represents the damped free vibration caused by the simple harmonic excitation whose frequency is ωr; the third part represents the purely forced vibration of the system under the action of the simple harmonic excitation, which has the same frequency as the excitation force, and the amplitude is independent of the initial conditions of the motion. During the transition stage, these three parts of vibration coexist. In practice, due to the existence of damping, the free vibration will be attenuated quickly, and soon the system enters the steady-state vibration phase after a short time of transition period and only the steady-state forced vibration exists. y(t) is shown in Equation (15):
where A is the amplitude of the steady-state response and α is the phase of the mass behind the vibration excitation.
y(t) = Asin(θt − α)
A = βA0
β is the dynamic coefficient which is the ratio of the amplitude of the vibration response to the amplitude of the excitation force. The dynamic coefficient is related to the frequency ratio γ and the damping ratio ξ as shown in Equations (18)–(20).
Taking the damping ratio ξ as the parameter, the relationship between the dynamic coefficient β and the frequency ratio γ is the amplitude–frequency characteristic of the system. The relationship between the phase angle α of the response behind excitation force and the frequency ratio γ is the phase–frequency characteristic of the system. When γ→0, which means that the excitation angular frequency θ→0, the excitation force changes very slowly, which is close to the static state, β→1, α→0°. At this time, the AC contactor has almost no motion relative to the vibration table. When γ→1, which means the excitation frequency θ is almost equal to the natural frequency ω of the contactor, then β = 1/(2ξ), α→90°. At this time, if the damping ratio ξ is small, the dynamic coefficient β will be a large amount and the system generates resonance. When γ = , regardless of the value of ξ, then β = 1. When γ→∞, β→0, then α→180°, the excitation force changes too fast and the contactor has no time to respond.
3.2. Energy Model under Steady-State Forced Vibration
Due to the existence of damping, the mechanical energy of vibration generated by the environment is continuously dissipated into thermal energy and radiant energy. Only when the outside environment continuously supplies energy to the system, can the contactor maintain steady-state forced vibration.
When the system reaches steady-state equal-amplitude forced vibration, the speed of the system under vibration stress can be calculated by Equation (21):
y’ = Aθcos(θt − α)
Ev is the extra kinetic energy of the steady-state forced vibration of the system under the simple harmonic excitation which is shown as Equation (22):
From the perspective of the overall input and output energy of the electromagnetic mechanism system, the input energy can be divided into the input electric energy Wi and the vibration energy Wv of the vibration table. The final output response of the system is the pick-up operation of AC contactors under steady-state forced vibration. When the hysteresis and eddy current losses are ignored, the input energy is converted into the coil loss energy WR, the magnetic field energy Wm, the spring potential energy Es, the core kinetic energy Ek, and the friction loss Ef. Under the action of the vibration energy, AC contactors finally form a steady-state forced vibration. Part of the input vibration energy provides additional kinetic energy Ev for the fixed component of AC contactor which is fixed on the vibration table, and the rest is dissipated as heat and radiation energy Eother and the calculation relationship is shown in Equation (23):
Wi + Wv = WR + Wm + Es + Ek + Ef + Ev + Eother
According to the analysis in the previous section, the energy during the collision of the cores will affect the dynamic characteristics of the contacts. In Equation (23), Ek is the kinetic energy of the moving iron core generated by the electromagnetic system, and Ev is the additional kinetic energy of the static iron core obtained by the forced vibration of the vibration table. Ek and Ev affect the core collision energy of the AC contactor and the dynamic characteristics of the contact. Under the same closing phase angle, if the influence of grid fluctuations is not considered, the input electric energy Wi of the system can be considered to be consistent. The energy distribution model of the electromagnetic mechanism is affected by different forms of vibration, and the dynamic characteristics of the electromagnetic mechanism will also be affected.
3.3. Energy Distribution under Different Forms of Vibrations
Simple harmonic vibration is commonly described by four parameters: acceleration, velocity, displacement, and frequency. It is assumed that the acceleration is a, the velocity is v, the displacement is D, the frequency is f. Under the International System Standards, the conversion relationship is:
a = θv = 2πfv
Combined with Equations (24) and (25), the relationship between the amplitude A0, the acceleration a and frequency f under sinusoidal vibration is shown in Equation (26):
Under the excitation of simple harmonic vibration x(t) = A0sinθt, different accelerations and frequencies will affect the form of steady-state forced vibration of the contactor, which will cause the AC contactor to generate different additional kinetic energy Ev. Because the frequency of the excitation force f and the natural frequency ω of the system have a direct influence on the forced vibration response of the system caused by the continuous vibration excitation of the supporting motion, it is necessary to analyze the different responses of the contactor at different frequencies and accelerations. Through testing, the natural frequency of the prototype of the AC contactor is 170 Hz. We calculate the response amplitude and response speed of the AC contactor under steady-state forced vibration when the acceleration a is from 1 g to 3 g and the vibration frequency f is from 10 Hz to 200 Hz, as shown in Figure 5.
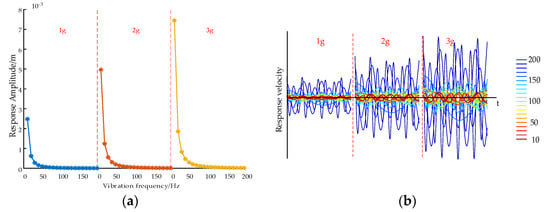
Figure 5.
The response amplitude and response speed of the AC contactor. (a) The response amplitude under different forms of vibration. (b) The response speed under different forms of vibration.
Under the influence of the vibration stress caused by the vibration table, the fixed component of the electromagnetic mechanism generates additional response motion, which affects the movement and collision energy of the iron cores during the closing process, thereby changing the dynamic characteristics of the AC contactor. Because the closing moment may be at any moment of the vibration process, vibration stress will affect the closing process of the AC contactor in an uncertain manner. Therefore, under the influence of steady-state forced vibration with different accelerations and frequencies, the dynamic response of the AC contactor is uncertain, but the dynamic response distribution has a certain trend.
As shown in Figure 5a, in the simulation of the dynamic characteristics of the AC contactor under simple harmonic vibration, the amplitude response of the AC contactor is relatively larger under the influence of lower frequency vibration, and the response amplitude increases with the acceleration of the vibration stress. Under the action of the vibration table, the fixed component of the AC contactor generates additional response displacement relative to the moving part, which will have an uncertain effect on the closing movement distance. And under the lower frequency vibration, the uncertainty of this displacement response is greater, which will lead to the greater dispersion degree of the distribution of the closing time.
As shown in Figure 5b, under the same vibration acceleration of external vibration environment, with the increase of the vibration frequency, the dispersion degrees of the response speed of the fixed component are higher. Under the same vibration frequency, the increase of external vibration acceleration also leads to a higher dispersion degree of the response speed. According to the energy distribution analysis of the electromagnetic mechanism in the closing process in the previous section, if the input energy is greater than the energy consumed by the coil and other forms, the extra energy will be consumed in the form of bouncing. Under the vibration stress, the static iron core of the AC contactor generates additional response motion. At this time, the collision energy is composed of the kinetic energy of the moving iron core and the additional kinetic energy of the static iron core. Because the dispersion degree of the speed of the response motion generated under high frequency vibration is higher, the collision energy under high frequency vibration is affected to a higher degree, and the influence is further enlarged with the increase of the vibration acceleration.
4. Experimental Results
In order to verify the accuracy of the calculation and analysis of the simulation model, we have carried out the practical test of the dynamic characteristics of AC contactor of the same specification. In order to avoid the influence caused by the different closing phase angles and focus on the effect of vibration stress on the dynamic characteristics of AC contactors, the closing phase angle is fixed at 0° during the experiments. The physical signals directly measured by the test system include: coil voltage signals, coil current signals, contact voltage signals, contact pressure signals, and vibration signals of the vibration table. Based on these original signal data, a series of dynamic characteristic parameters of AC contactors can be calculated [23], including pick-up time, contact time, bounce time, number of contact forces, number of contact bounce, and etc.
The AC contactor dynamic characteristic test system under vibrations used in the study is mainly composed of the main control unit, the phase selection and closing control unit, the sensors, and the vibration table. The main control unit concludes Advantech’s 610H IPC, multifunction data acquisition card PCI-1712 and its supporting terminal board ADAM-3968. For complete acquisition of the action signals of AC contactors, we set the single channel sampling frequency to 100 kHz and the single acquisition time to 100 ms. The phase selection and closing control unit takes STM32F103RCT6 as the core, and controls the closing phase angle of the coil voltage to a fixed value. CHV-25P closed-loop Hall voltage sensor and CHB-50SF closed-loop Hall current sensor are used to detect voltage and current signals. The PVDF piezoelectric film sensor is used to measure the dynamic contact pressure signals, which are used to calculate the relevant parameters of the contact bounce. The LC0613 acceleration sensor is selected to monitor the vibration signal of the vibration table in real time during the contactor’s operation. DC-300-3 type electric shaking table of Suzhou Sushi Test Instrument is used. Its frequency range is 0.5–600 Hz and the upper limit of acceleration is 20 g, which meets the experimental requirements.
With the purpose being to study the influence of different vibration frequencies and vibration accelerations on the dynamic characteristics of AC contactors, the working parameters of the electromagnetic mechanism have been tested under different vibration environments with different frequencies and accelerations. In the experiments, the frequency and acceleration can be controlled at the same time. We set the range of vibration acceleration from 1 g to 3 g and the range of the vibration frequency from 10 Hz to 200 Hz with the interval size of 10 Hz. Experimental tests have been performed 25 times at each fixed frequency and acceleration, and the dynamic characteristics calculated based on the measured working parameters are shown in Figure 6. Figure 6a shows the average pick-up time under different vibration forms, and Figure 6b shows the average number of contact secondary bounces under different vibration forms.
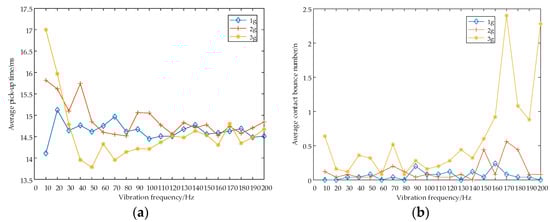
Figure 6.
Dynamic characteristics of the AC contactor under different vibration forms. (a) The average pick-up time curves; (b) The average contact secondary bounce number curves.
4.1. Analysis of Core Movement under Different Vibration Forms
It can be seen from the experimental data that the dispersion degrees of the dynamic characteristics of AC contactors under different vibration forms show obvious differences. In order to show the differences of the dynamic characteristics under different vibration conditions during the closing process more clearly, the test data is displayed in the form of scatter plots at different vibrations of accelerations and frequencies, and compared with the response amplitude under different vibration forms, which is shown in Figure 7. The test results show that the pick-up time is more affected by low-frequency vibration, and the influence will further increase with the increase of acceleration.
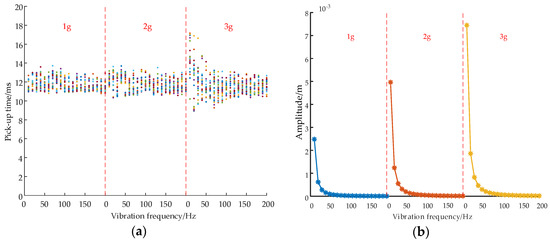
Figure 7.
Comparison of the pick-up time and the response amplitude under different vibration forms. (a) Scatter plot of pick-up time; (b) Response amplitude curves.
In the simulation of the dynamic characteristics of AC contactors under simple harmonic vibration, as shown in Figure 7b, the response amplitude of the moving part is relatively larger under low-frequency vibration and the response amplitude increases further as the acceleration of the vibration stress increases. Combining with the characteristics of pick-up time obtained in the test experiments shown in Figure 7a, we find that the pick-up time of the electromagnetic mechanism is more affected by vibration in the low-frequency stage, and the influence will further increase with the increase of vibration acceleration. That is, under the same vibration acceleration, the higher the frequency of the vibration is, the smaller the degree of influence on the pick-up time of the cores is; when the frequency is lower, the response of the test sample is more uncertain, and the stability of the pick-up time is relatively poor. As the vibration acceleration of the vibration table increases, the dynamic response of the test sample shows more obvious dispersion.
4.2. Analysis of the Contact Bounce under Different Vibration Forms
In order to show the impact of different vibration conditions on the contact bounce more clearly, the records of the second bounce in the test data are displayed in the form of scatter plots at each acceleration and vibration frequency. The comparisons with the extra vibration energy calculated by simulation under different vibration forms are shown in Figure 8. The test results show that the contact bounce characteristics are affected more by high-frequency vibration, and that this will further increase with the increase of acceleration.
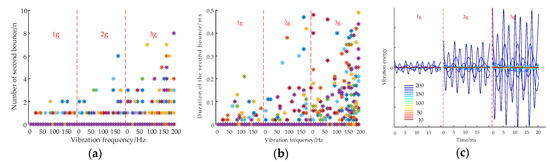
Figure 8.
Comparison of contact bounce characteristics and extra vibration energy curves under different vibration forms. (a) Scatter plot of second bounce number; (b) Scatter plot of second bounce duration; (c) Vibration energy curves.
By analyzing the vibration energy curves obtained from the simulation calculation, it can be seen in Figure 8c that, under the same vibration acceleration, the higher the vibration frequency, the greater the influence of the extra kinetic energy exerted by the vibration table on the fixed component. In simulation analysis, the extra energy is considered to be consumed in the form of contact bounce, and the collision energy of the core during the closing process will directly affect the nature of the contacts. The number of the second bounce and the duration of the second bounce from the AC contactor under different vibration forms have been measured through actual tests. The results are shown in Figure 8a,b. There are uncertainties in dynamic response characteristics of AC contactors under the influence of steady-state forced vibration at different accelerations and frequencies. Since the dispersion degree of the energy under high-frequency vibration is much higher than that under low-frequency vibration, under the same acceleration, with the higher vibration frequency, the possibility of contact bounce will be greater and the duration of contact bounce will be longer. And with the increase of the vibration acceleration, the dispersion degree of the extra kinetic energy applied to the fixed component by the vibration table further increases and has a more significant impact on the characteristic of the contact bounce of the AC contactors.
4.3. Analysis of Uncertainty
The discrete distribution of data is caused by the uncertainty in the dynamic response of AC contactors during the closing process. The reasons for the uncertainty of the dynamic characteristics in the experimental analysis are mainly due to the following aspects.
One reason is the complexity of the electromagnetic system. The electromagnetic system is the core mechanism of AC contactors. The working process of the electromagnetic system is a complex process of electrical, magnetic and mechanical movement, which presents non-linearity, complexity and uncertainty. Another reason is the randomness of vibration stress at the moment of core collision. At the closing time in actual operation, the additional force generated by the vibration of the same form is random, so the core collision energy is also uncertain. And, as a result, the pick-up time and the contact bounces under vibrations are uncertain.
Due to the complexity of the electromagnetic mechanism and the randomness of the vibration stress, the dynamic response uncertainty in the dynamic response process of the AC contactor is inevitable. Measuring the uncertainty of the dynamic response of AC contactors is closely related to dispersion of the response parameter distribution. The methods used to measure the dispersion of data distribution, such as coefficient of variation, range, and non-zero counting, are used to analyze and compare the dispersion of dynamic response parameters at different vibration frequencies and accelerations, as shown in Figure 9 and Figure 10.
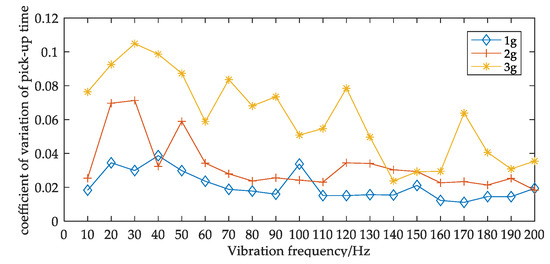
Figure 9.
The coefficient of variation of pick-up time under different vibration forms.
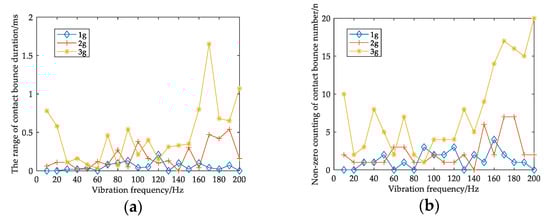
Figure 10.
The dispersion of contact bounce under different vibration forms. (a) The range of contact bounce duration; (b) Non-zero counting of contact bounce number.
It can be seen in Figure 9 that the differences of variation coefficient values under different vibration forms are obvious. As the vibration acceleration increases, the value of the coefficient of variation of the pick-up time becomes significantly larger. This shows that under the affection of higher acceleration vibration, the dispersion of the pick-up time is higher. With the increase of vibration frequency, the coefficient of variation shows a downward trend.
Figure 10a shows the range of contact bounce duration, and the data in (b) shows the occurrence of contacts bounce. The results show that the contact bounce is significantly affected under high acceleration. With the increase of the vibration frequency, the vibration influence on the contact characteristics increases, and it is severely affected near the natural frequency of contactors. Therefore, designers should avoid the situation where the natural frequency is close to that of the working environment when designing AC contactors. In addition, we find that the stability of the dynamic characteristics of the AC contactor is better under the low vibration acceleration. Designers could further strengthen the stability of AC contactors in response to severe vibration problems.
5. Conclusions
In this paper, a 3D simulation model of the electromagnetic mechanism of the AC contactor is established based on the calculation of the transient magnetic field. Based on the calculated working parameters, the energy distribution of the electromagnetic mechanism under normal conditions is constructed. Taking the external vibration stress as an input energy, we proposed a formula for calculating the extra kinetic energy exerted by the vibration table on the fixed component of the AC contactor. The dynamic test experiments under different vibration forms verify the correctness of the calculation of the mathematical model. Based on the experimental data, the uncertainty of the dynamic response of AC contactors under vibrations is further analyzed. The results show that, under the vibration with low acceleration vibration, the dispersion of the dynamic characteristics of the AC contactor is lower and the electromagnetic mechanism is less affected by the vibration stress. For different vibration frequencies, under lower frequency vibration, the pick-up time is more affected, and under higher frequency vibration, the contact characteristics are more affected. This research provides theoretical guidance for designers to design the overall control process of AC contactors, which are suitable for vibration environments, and provides a mechanism reference for the analysis of the impact of vibration factors on the dynamic characteristics of AC contactors.
Author Contributions
Conceptualization, S.S. and T.D.; data curation, S.S.; formal analysis, J.C.; funding acquisition, S.S. and T.D.; methodology, J.C.; project administration, S.S. and T.D.; software, J.C.; supervision, T.D.; validation, J.C.; writing—original draft, J.C.; writing—review and editing, S.S. All authors have read and agreed to the published version of the manuscript.
Funding
This research was supported by Foundation of Hebei Province Department of Education, grant number ZD2016108.
Conflicts of Interest
The authors declare no conflict of interest.
References
- Tarczyński, W.; Hejman, T.; Smugała, D. Computer-controlled testing system for investigating the dynamic characteristics of contactors with A.C. electromagnet drives. Measurement 2003, 33, 313–323. [Google Scholar] [CrossRef]
- Gong, B.; Bao, G. Test method for dynamic characteristics of contactor based on image processing. Electr. Energy Manag. Technol. 2017, 5, 10–14. [Google Scholar]
- Chen, D.-W.; Zhang, P.-M. Spatial testing of dynamic process and analysis technique of intelligent AC contactors based on the monocular vision technology. Proc. Chin. Soc. Electr. Eng. 2014, 34, 1931–1937. [Google Scholar]
- Morera, X.A.; Espinosa, A.G. Modeling of contact bounce of AC contactor. In Proceedings of the IEEE Fifth International Conference on Electrical Machines and System, Shenyang, China, 18–20 August 2001. [Google Scholar]
- Li, X.; Ma, Z. Virtual prototyping technology of AC contactor. Trans. China Electr. Soc. 2016, 31, 148–155. [Google Scholar]
- Lin, S.; Xu, Z. Simulations and numerical analysis on 3D dynamic process of alternating current contactors. Proc. Chin. Soc. Electr. Eng. 2014, 34, 2967–2975. [Google Scholar]
- Xu, C.; Liang, Y.; Cai, S. Research on suction properties of AC electromagnet based on Ansoft. In Proceedings of the 2011 International Conference on Electric Information and Control Engineering, Wuhan, China, 15–17 April 2011. [Google Scholar]
- Xing, X.; Yang, Z.; Qin, Y. Analysis of AC contactor’s dynamic characteristics based on Maxwell. Electr. Energy Manag. Technol. 2017, 22, 17–21. [Google Scholar]
- Li, R.; Xu, Z. 3D simulation design of AC electromagnetic mechanism based on Maxwell. Electr. Energy Manag. Technol. 2016, 8, 1–7, 15. [Google Scholar]
- Xiong, J.; He, J.; Zang, C. Dynamic analysis of contact bounce of aerospace relay based on finite difference method. Chin. J. Aeronaut. 2009, 22, 262–267. [Google Scholar] [CrossRef]
- Ramirez-Laboreo, E.; Sagues, C.; Llorente, S. A new runto-run approach for reducing contact bounce in electromagnetic switches. IEEE Trans. Ind. Electron. 2017, 64, 535–543. [Google Scholar] [CrossRef]
- Xu, Z.-H.; Zhang, P.-M. Research on dynamic closing course of intelligent AC contactor. Proc. Chin. Soc. Electr. Eng. 2007, 18, 108–113. [Google Scholar]
- Xu, Z.; Lin, S. Energy analysis of the closing process of an AC contactor. In Proceedings of the IEEE 60th Holm Conference on Electrical Contacts, New Orleans, LA, USA, 12–15 October 2014. [Google Scholar]
- Li, X.-W.; Chen, D.-G.; Sun, Z.Q.; Li, Z.-P.; Niu, C.-P. Numerial analysis and experimental investigation of dynamic behavior and contact bounce of AC contactor. Proc. Chin. Soc. Electr. Eng. 2004, 9, 233–237. [Google Scholar]
- Chieh-Tsung, C. Applying closing phase-angle control technique in bounce reduction of ac permanent magnet contactor. Act. Passiv. Electr. Compon. 2009, 3. [Google Scholar] [CrossRef]
- Lin, S.; Xu, Z. Performance characteristics of AC contactor during voltage sag. Proc. Chin. Soc. Electr. Eng. 2011, 24, 131–137. [Google Scholar]
- Tang, L.; Xu, Z. Design of a new intelligent anti-voltage sag control module for AC contactors. Proc. Chin. Soc. Electr. Eng. 2012, 27, 95–103. [Google Scholar]
- Hai, W.; Wei, G.; Tu, Z. Design and analysis of temperature accelerated life test scheme for railway relay. J. Railw. Sci. Eng. 2018, 4, 1023–1029. [Google Scholar]
- Zhang, H.; Wu, Y.; Song, W. Vibration characteristic simulation study of contact spring system for railway signal relay. Electr. Energy Manag. Technol. 2015, 6, 15–19. [Google Scholar]
- Du, T.; Cui, J.; Sun, S. Study on dynamic characteristics of AC contactor based on hybrid simulation model. J. Electron. Meas. Instrum. 2019, 10, 187–194. [Google Scholar]
- Xie, Y.; Chen, D.; Huang, Y. Dynamic process analysis of CJ20-100 AC contactor based on labview. Electr. Switchg. 2012, 1, 37–39. [Google Scholar]
- Xu, J.; Li, Q.; Chen, Y. Vibration problems and application of vibration reduction system in engineering. In Proceedings of the 3rd International Conference on Mechanical, Control and Computer Engineering (ICMCCE), Huhhot, China, 14–16 September 2018. [Google Scholar]
- Li, J.; Zheng, X.; Su, X. AC contactor dynamic characteristics testing system with contacts contact pressure dynamic test function. In Proceedings of the International Conference on Mechatronic Sciences, Electric Engineering and Computer (MEC), Shengyang, China, 20–22 December 2013. [Google Scholar]


© 2020 by the authors. Licensee MDPI, Basel, Switzerland. This article is an open access article distributed under the terms and conditions of the Creative Commons Attribution (CC BY) license (http://creativecommons.org/licenses/by/4.0/).