Article

Experimental and Numerical Analysis of Condensation Heat Transfer and Pressure Drop of Refrigerant R22 in Minichannels of a Printed Circuit Heat Exchanger

School of Energy and Power, Jiangsu University of Science and Technology, Zhenjiang 212003, China
*
Author to whom correspondence should be addressed.
Energies 2020, 13(24), 6589; https://doi.org/10.3390/en13246589
Submission received: 19 October 2020 / Revised: 2 December 2020 / Accepted: 9 December 2020 / Published: 14 December 2020
(This article belongs to the Special Issue Multiphase Flows)

Abstract

:
A Printed Circuit Heat Exchanger (PCHE) is a type of highly complete and efficient heat exchanger that consists of numerous mini/micro-channels and has been successfully applied to the Liquefied Natural Gas (LNG) regasification project. During the research presented in this paper, the condensation flow and heat transfer performance of the R22 in PCHE hot side minichannels are analyzed via experiments and numerical simulations, respectively. A liquid nitrogen–R22 experimental loop is established to examine the pressure difference and heat transfer coefficient of R22 in the minichannels of the PCHE hot side. The inlet pressures of the R22 range from 0.5 MPa to 0.65 MPa, the mass flux values are changed from 10.52 kg   m 2 s 1 to 109.42   kg   m 2 s 1 , and the inlet temperatures vary from 273 K to 289 K. The differences between experiments and simulations are analyzed by comparing the experimental values of the Nusselt number (Nu) and the friction pressure gradient with the numerical ones. Furthermore, the influences of pressure and mass flux on the Nu, as well as the friction pressure gradient, are analyzed in depth through condensation flow regimes to explore the underlying mechanism giving the results.

1. Introduction

A Printed Circuit Heat Exchanger (PCHE) is a type of highly integrated plate heat exchanger fabricated in Australia in 1980 and applied to the heat exchange field by Heatric (UK) in 1985 [1]. The fabrication of PCHEs was enabled due to the advancement of photochemical etching and diffusion welding technologies. Compared to traditional heat exchangers, the PCHEs have many prominent advantages [2]. These advantages include: (1) high heat exchange capacity; (2) high temperature and pressure resistance; (3) small size. The volume of a PCHE is one sixth to one quarter of that of a tube-shell heat exchanger under similar power conditions.
Accompanying the development of PCHEs, many researchers have been interested in the internal flow and heat transfer of a PCHE. Baek et al., [3] conducted experimental research for PCHE heat transfer and flow characteristics using nitrogen as the working fluid. According to the experimental data obtained by the authors, it was found that for a low Reynolds number, the heat transfer characteristics of a PCHE were mainly affected by axial heat transfer, and the axial heat loss was reduced by improving the geometric structure of the PCHE. Figley et al., [4] numerically analyzed the laminar to turbulent transition flow characteristics of helium in semicircular and circular channels using the experimental parameters of the high-temperature helium device. Aneesh et al., [5] established a 3D straight channel model of the PCHE and used helium as the fluid in simulations. The effects of thermophysical properties, operating conditions, and three different design modifications on the thermal performance of the PCHE were examined. Lee et al., [6] studied the flow and heat transfer performance of a PCHE with different flow channel cross-section shapes and channel structures. It was found that the semicircular cross-section shape is better. Kim et al., [7] numerically analyzed the thermal hydraulic characteristics of a new airfoil PCHE design, showing that compared to a traditional z-PCHE, its pressure drop was lower, and the heat transfer performance was almost similar. Kim et al., [8] numerically and experimentally studied the influence of the PCHE geometric parameters on heat transfer performance with helium as the fluid. The authors proposed the Fanning factor and Nusselt number (Nu) correlations under different geometries and carried out optimization analysis. Ma et al., [9] numerically studied the thermal-hydraulic performance of a z-type PCHE at a high temperature helium loop and proposed the evaluation of the system performance with dimensionless velocity and temperature. The thermal-hydraulic properties of a PCHE were experimentally and numerically studied with single-phase working fluids such as helium, water, and CO2, but this study did not include the two-phase region.
Existing PCHEs are mini/microchannel heat exchangers, internally composed of numerous mini/microchannels. The two-phase flow and heat transfer characteristics inside the mini/microchannels differ significantly from those inside the macrochannels, which have been extensively researched. Liu et al., [10] experimentally studied the condensing flow characteristics of R32, R152a, and R22 in round and square minichannels and found that R32 and R152a can replace the R22 and have a good heat exchange capacity. Hossain et al., [11] experimentally measured the pressure difference and heat transfer for a new refrigerant, R1234ze, inside the 4.35 mm levelling tube and evaluated the well-known correlations. Kim et al., [12,13] reviewed the comprehensive database covering many working fluids and a wide range of working conditions and developed universal correlations of heat transfer and pressure difference that can be widely used. Ding et al., [14] researched the condensation annular flow of R410a inside a 0.67 mm rectangular microchannel using a theoretical model. The authors validated the significance of turbulence in the meniscus area. Fronk et al., [15,16] studied the condensation heat transfer for ammonia as well as an ammonia/water mixture for microchannels (diameter (D) < 2.16 mm) and developed a new heat exchange prediction model of pure ammonia for mini/microchannels. Park et al., [17] designed new experimental equipment to test the heat transfer performance of refrigerant R1234ze(E) inside upright minichannels (hydraulic diameter (Dh) = 1.45 mm). Del Col et al., [18] used a special experimental device to test the local condensation heat transfer coefficient of R1234yf inside minichannels (D = 0.96 mm). The results indicated that the R1234yf had a poor heat transfer capacity compared to R134a. Del Col et al., [19] compared the condensation heat transfer coefficient for R134a inside a 1.18 mm quadrate minichannel, with that inside a circular minichannel, and found that the heat transfer performance of the quadrate channel increased due to the surface tension at a low mass flux. As a high-efficiency and compact heat exchange apparatus, the PCHE has been successfully applied to the Liquefied Natural Gas (LNG) regasification project and is the core equipment of the Floating Storage and Regasification Unit (FSRU). Regarding the field of regasification of cryogenic fluids, Zhao et al., [20] analyzed the flow and heat transfer performance of supercritical nitrogen in the PCHE straight channels via numerical simulations and discussed the influence of the inlet pressure and mass flow rate for the heat exchange and flow performance. Zhao et al., [21,22] studied the effect of PCHE zigzag channels with different shapes and angles on the heat transfer performance and thermal-hydraulic characteristics of supercritical LNG through numerical simulation. Due to the flammability and explosive nature of LNG, during the experiment liquid nitrogen often is used rather than LNG to test PCHE performance. Zhao et al., [23] conducted experimental and numerical studies on the thermal-hydraulic performance of supercritical nitrogen in an airfoil fin PCHE and established the correlation between the Nusselt number and Fanning friction coefficient to predict the thermal-hydraulic performance. Zhao et al., [24] established a simplified channel model on the hot side of a PCHE and studied the heat transfer and condensation flow performance of the R22 in microchannels under different conditions by numerical simulation.
Here, the flow process of the R22 and the heat transfer process with supercritical nitrogen inside the PCHE minichannels are researched under different superheated, saturated, and two-phase inlet conditions through experiments and numerical simulations, respectively. The research in this paper is a continuation of previous research [20,21,22,23,24]. This research is to provide basics and references for the next step in the study of the flow and heat transfer performance of LNG and propane in PCHEs in practical applications. The main contributions of our work are as follows:
  • A liquid nitrogen—R22 experimental loop is established to examine the pressure drop and condensation heat transfer coefficient of R22 in minichannels for a PCHE hot side under diverse pressures and mass flux.
  • As the experimental study cannot visualize the internal flow information of the minichannels, we selected 46 sets of experimental data to study the internal flow and heat transfer characteristics for the R22 inside the PCHE minichannels via numerical simulations.
  • By comparing the experimental and numerical data, the accuracy of the numerical model is verified. The influence of pressure and mass flux on the Nu and the friction pressure gradient are analyzed in depth through condensation flow regimes to explore the underlying mechanism giving the results.

2. Experimental Setup and Approach

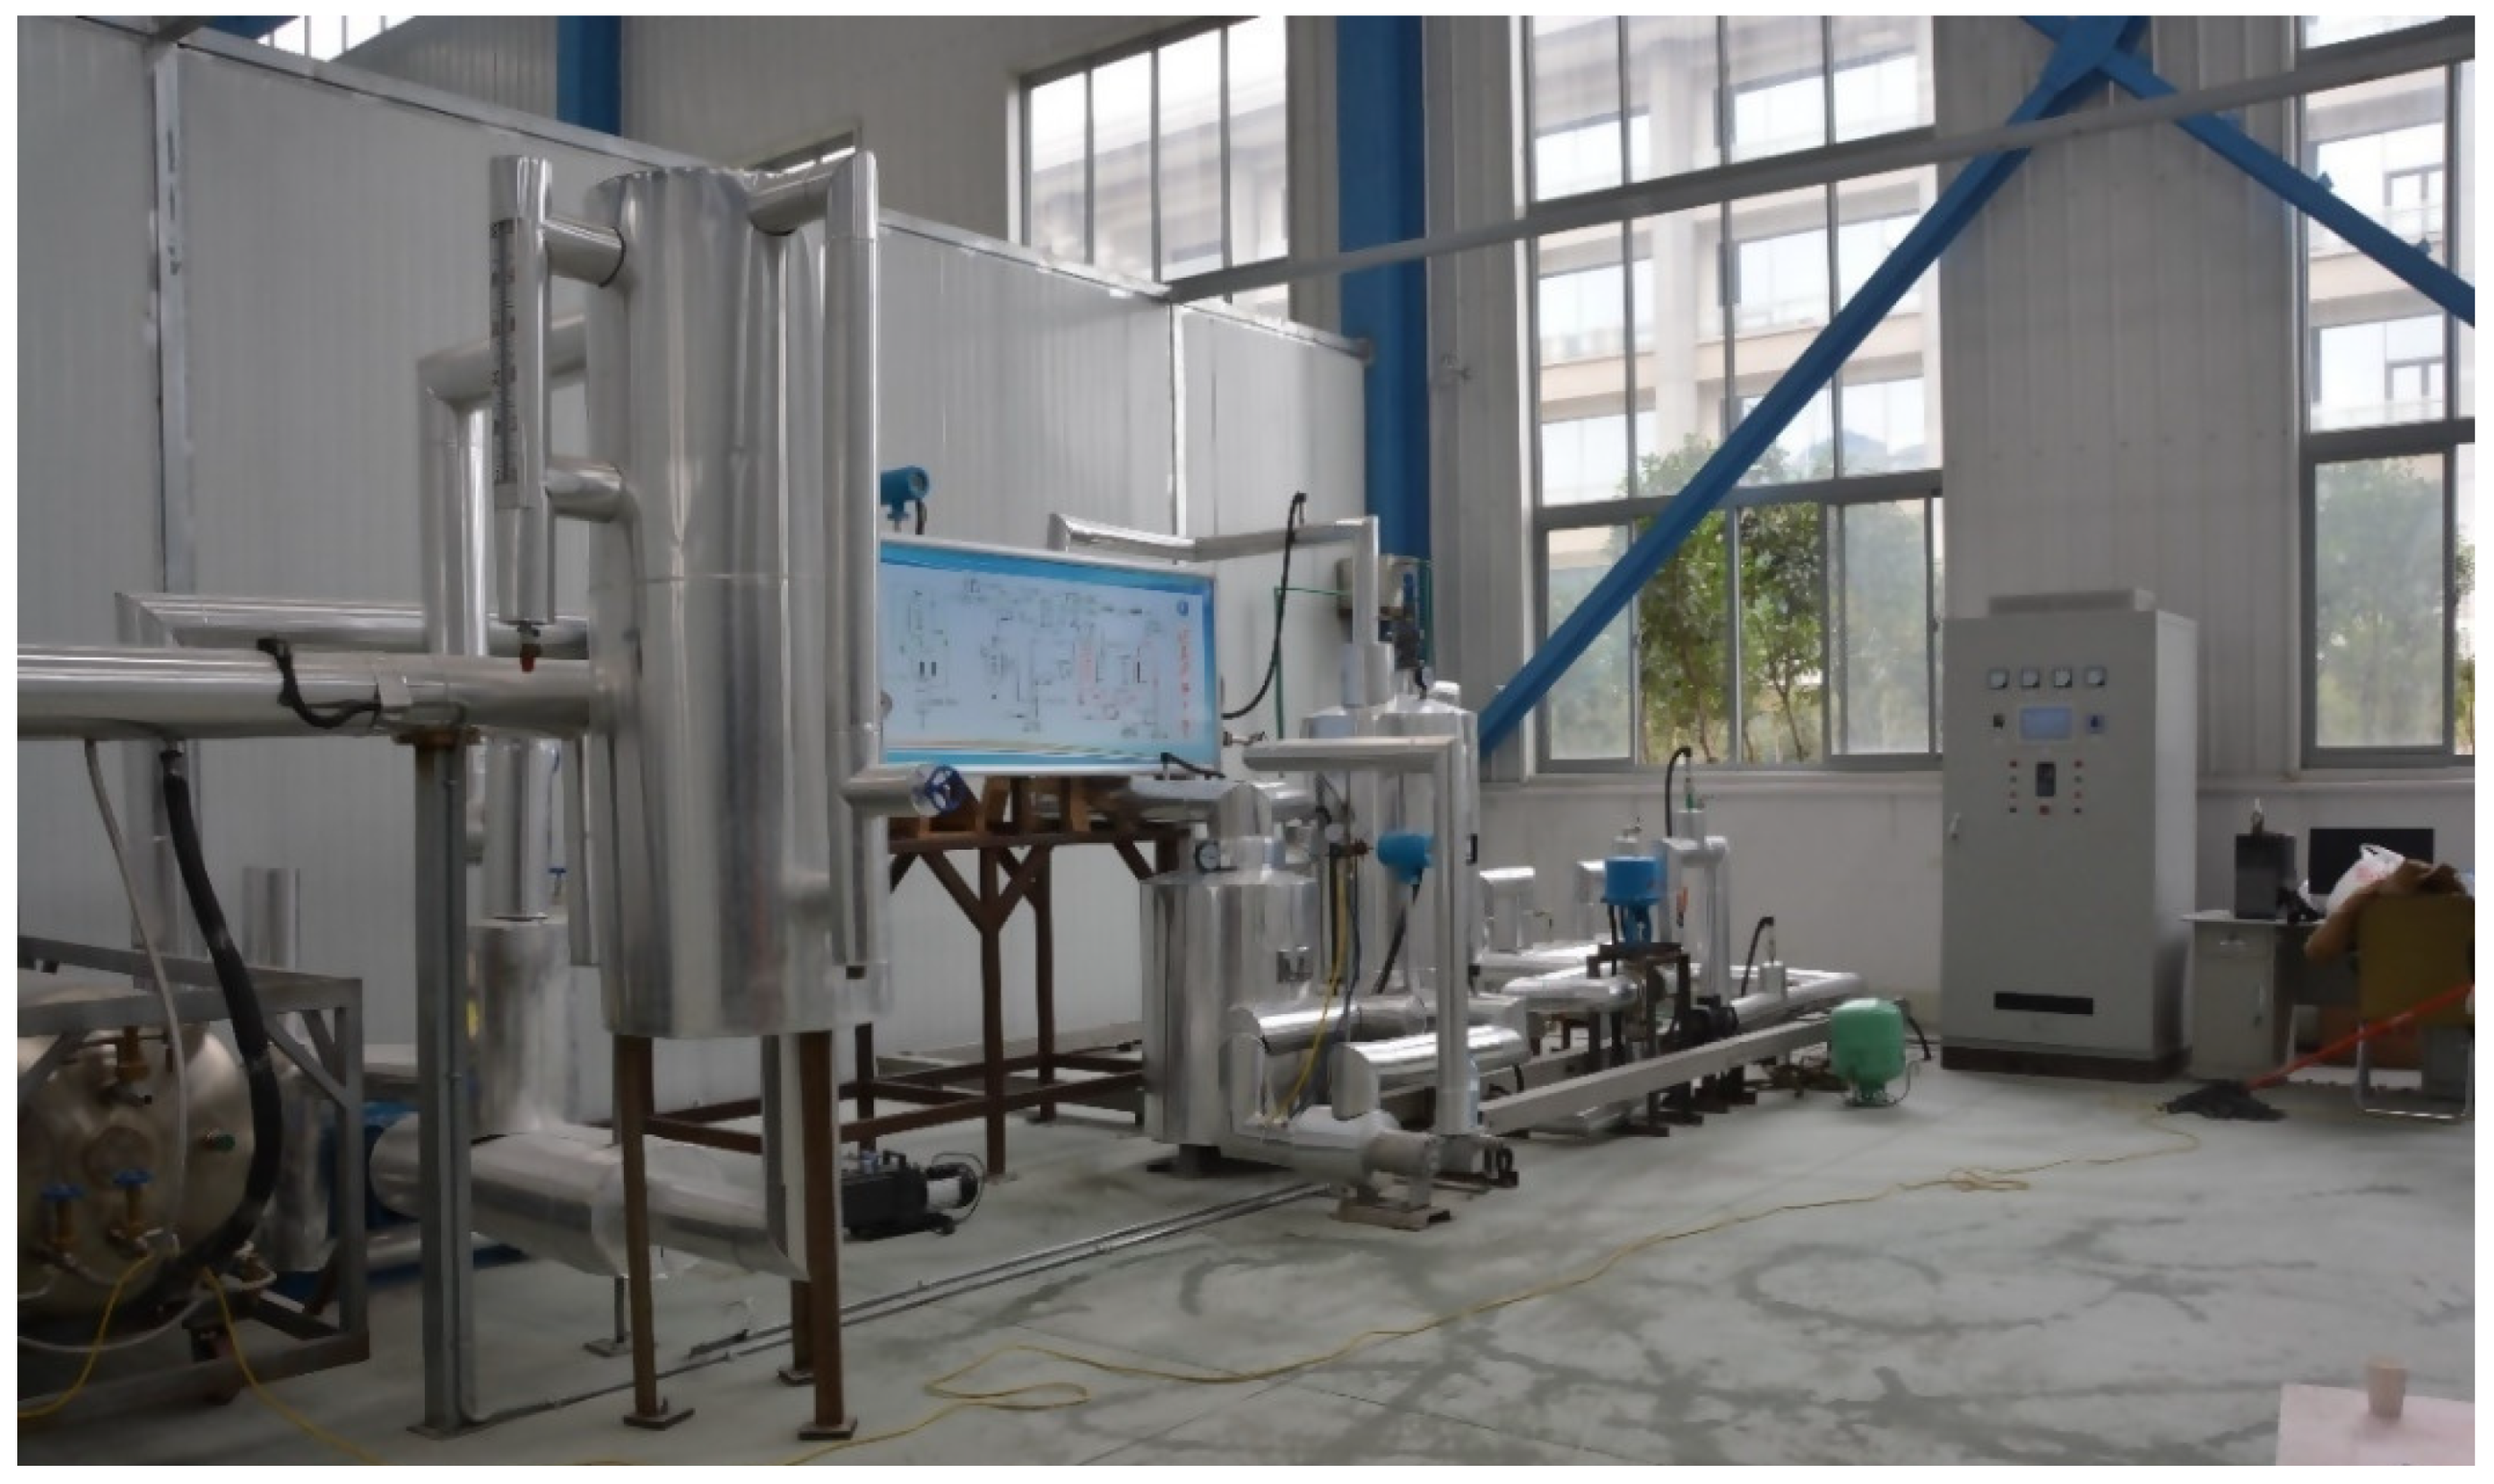
2.1. Experimental System

We set up an experimental system for testing the thermal-hydraulic performance of a Printed Circuit Heat Exchanger (PCHE) in the liquid nitrogen—R22 loop, as shown in Figure 1. The experimental system contained three primary circuits, namely a liquid nitrogen circuit, a refrigerant R22 circuit, and a hot water circuit, where the hot water circuit mainly provided a heat source. The flow diagram of the experimental rig was described in detail in the paper we have published [24].
Liquid nitrogen at low temperature and pressure emanated out of the liquid nitrogen tanks and entered a flash tank, which was mainly used for gas-liquid separation. The liquid nitrogen from the flash tank was pressurized by a cryogenic liquid pump to a supercritical state. After being stabilized in a surge tank, the supercritical nitrogen was passed through the airfoil cold channels of the PCHE to absorb the heat released by the R22. This resulted in gasification of the liquid nitrogen, which was then discharged. Regarding the R22 loop, the liquid R22 in the R22 storage tank was driven by a circulating pump through a three-way regulating valve, a flow meter, and a floating coil heat exchanger successively. The liquid exchanged heat with hot water in the floating coil heat exchanger and then gasified. The gas R22 flowed through the straight hot channels of the PCHE to release heat, resulting in condensation, and then flowed back to the R22 storage tank. The mass flow and pressure of the R22 were controlled by regulating the three-way valve. During the hot water loop, the water was heated by a 50 kW electric heater and then actuated by the circulating pump into a heat exchanger for transferring heat to the R22.
During the experiment, we measured the temperature, pressure, mass flow rate and other parameters. To ensure accuracy of all the measured parameters, we selected appropriate sensors according to the test conditions of each loop. The Pt100 thermal resistance temperature sensor was used for temperature measurement, in which the cold side inlet selected a temperature sensor with a range of −200 –300 and a precision of ± 0.15 , and the cold side outlet selected a temperature sensor with a range of −70 –300 and a precision of ± 0.3   . Both the R22 loop and the hot water loop used temperature sensors with a range of −50   –300   and a precision of 0.3   . Concerning the pressure measurement, pressure sensors with a precision of ± 0.3% between 0 MPa to 15 MPa, a precision of ± 0.25% between 0 MPa to 1 MPa, and a precision of 0.1% between 0 MPa to 0.4 MPa were selected for the liquid nitrogen loop, R22 loop, and hot water loop, respectively. Regarding the mass flow measurement, mass flow meters having precisions of ± 0.5% between 120 kg   h 1 to 1200 kg   h 1 and 70 kg   h 1 to 700 kg   h 1 were selected for the liquid nitrogen loop and R22 loop, respectively. The accuracy of the electromagnetic flow meter installed in the hot water loop was 0.5 and the range was between 0.1 m 3   h 1 to 5   m 3   h 1 .
To reduce heat loss, the entire test system was covered by insulation materials. To prevent possible damage to the equipment and fittings due to a sharp temperature drop, a pre-cooling preparation was carried out before the experiment. The collection of experimental data was begun after a certain duration of stable operation of the system.

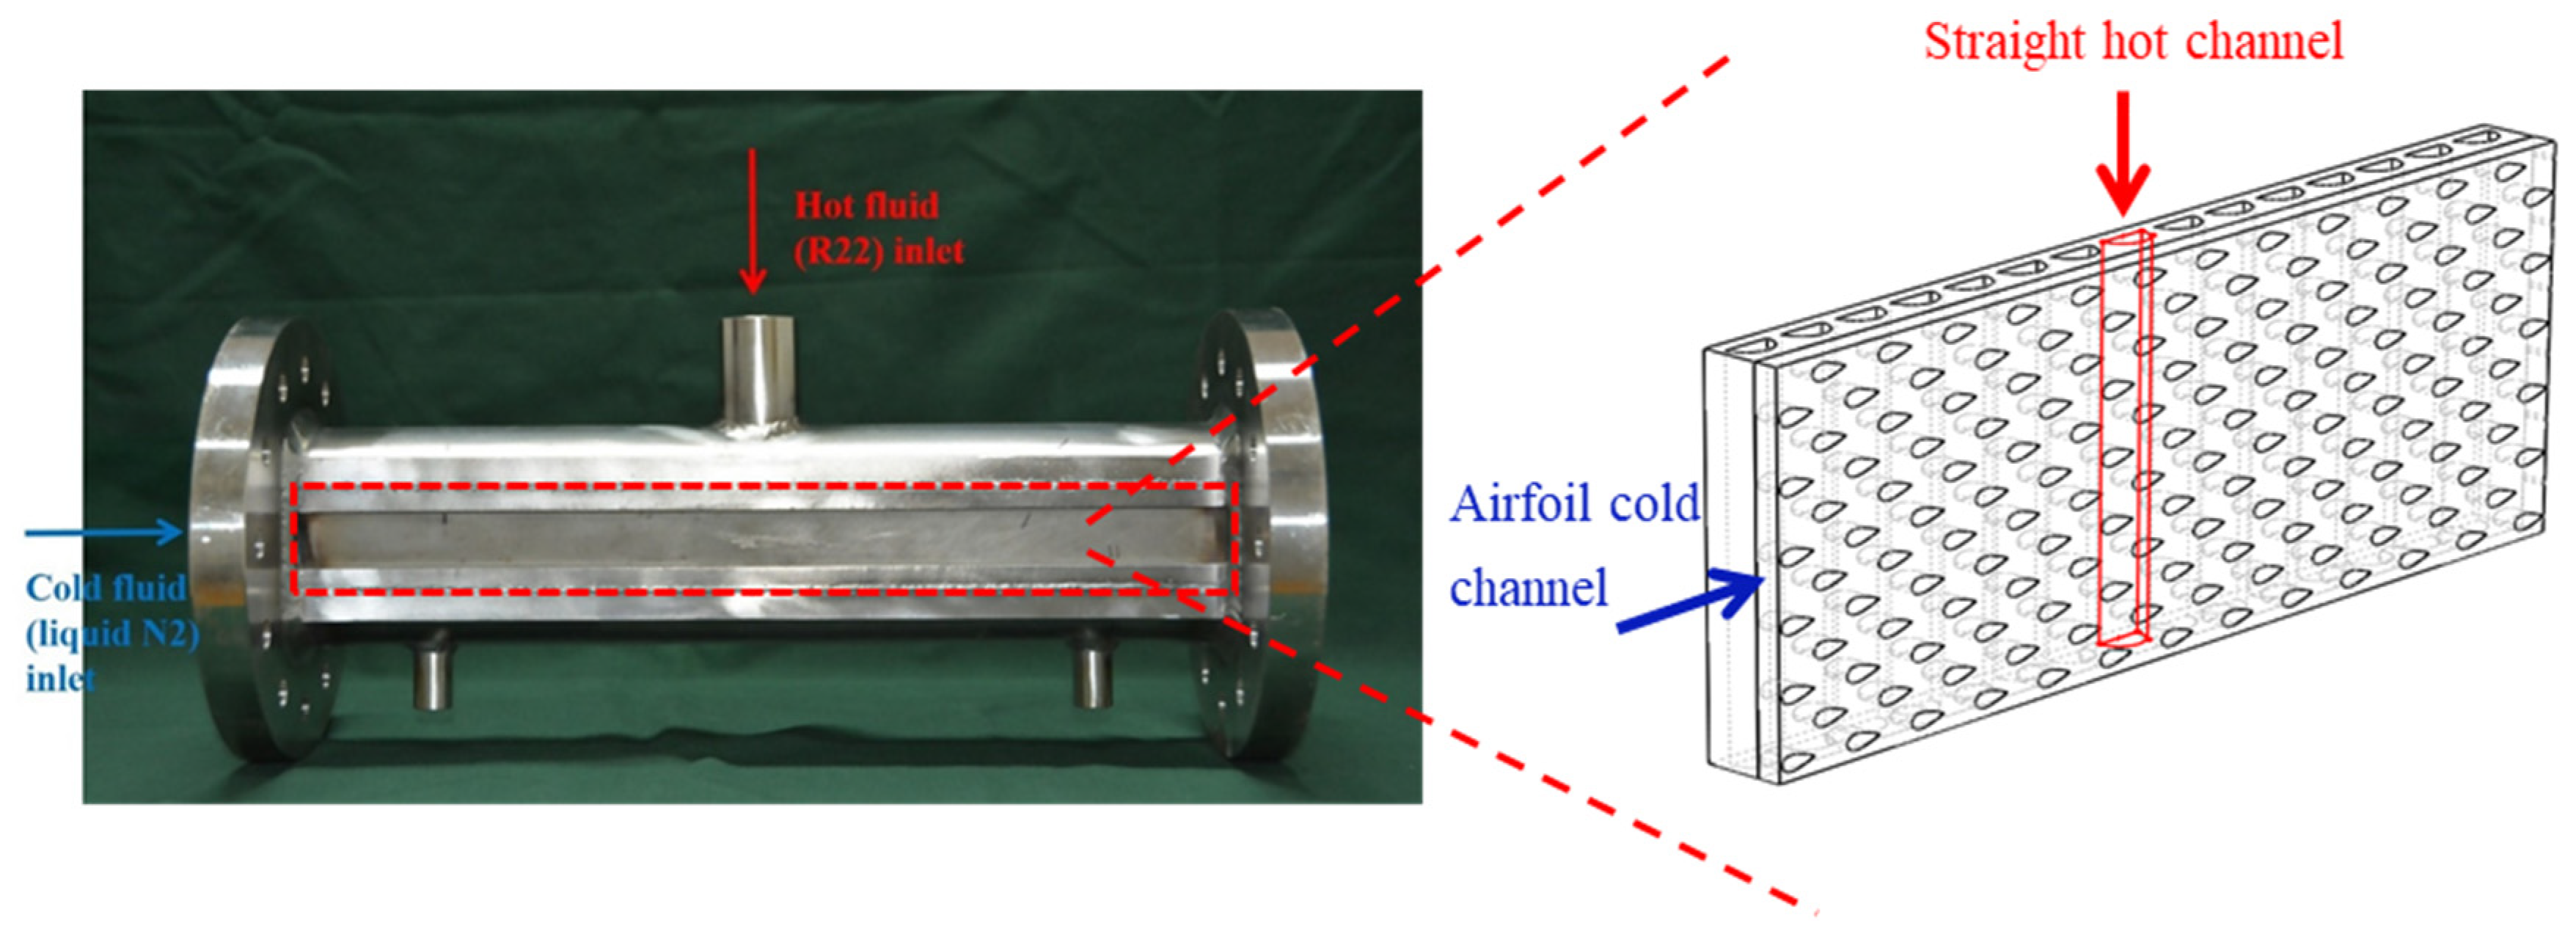
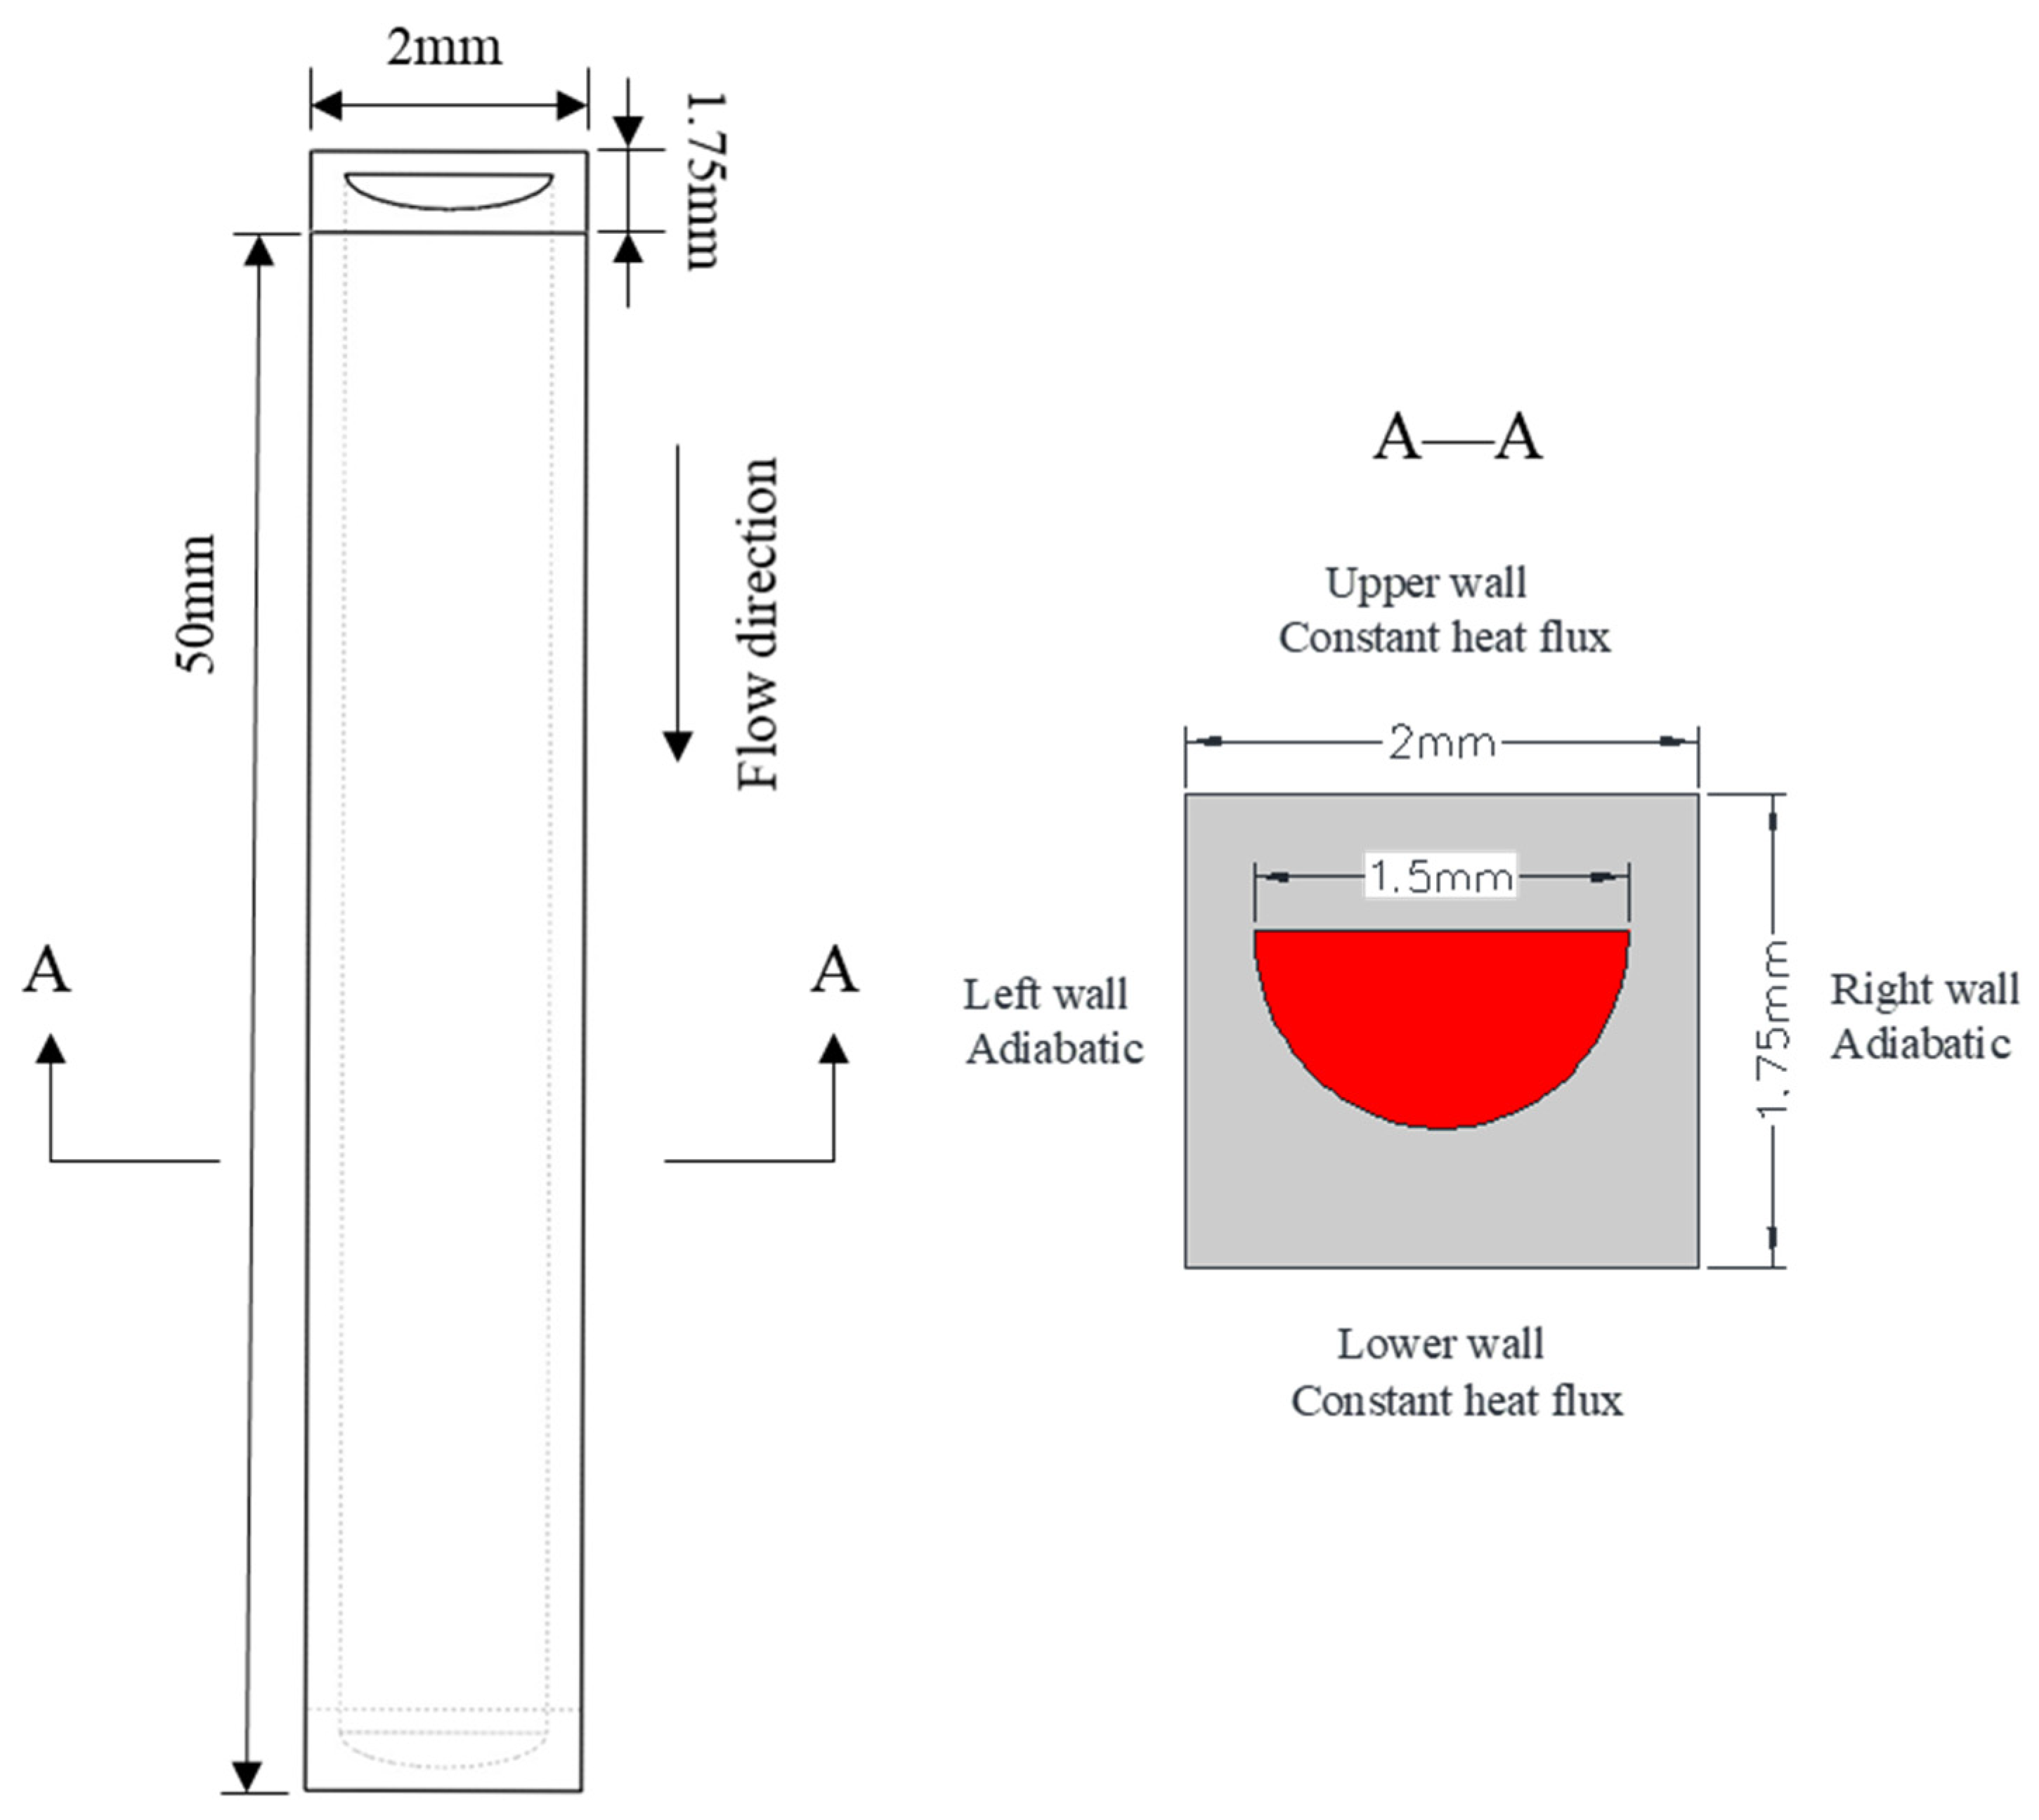
2.2. Printed Circuit Heat Exchanger

The designed Printed Circuit Heat Exchanger (PCHE) was the core equipment of the experimental rig, which was made of stainless steel 316L material by Selected Laser Sintering (SLS) 3D printing, as shown on the left in Figure 2. The cold side had 475 airfoil channels, which featured staggered airfoil fins, and the hot side consisted of 2988 semicircular straight channels with a diameter of 1.5 mm, as shown on the right in Figure 2. We mainly studied the flow and heat transfer characteristics of the R22 in the straight hot channel. The specific channel geometry is given in Table 1.

2.3. Data Reduction

The four parameters of average condensation were the heat transfer coefficient, pressure drop, Nusselt number (Nu), and friction pressure gradient and were used to explore the R22 condensation flow and heat transfer performance inside the minichannels of the Printed Circuit Heat Exchanger (PCHE) hot side. During the testing of the designed PCHE, the temperature, pressure, and mass flow rate of the R22 and liquid nitrogen inlet and outlet were directly measured. The other parameters were calculated using the following equations by the measured parameters.
The condensation heat transfer coefficient of the R22 side was calculated using:
h h = Q h A h ( T h , a v e T w )
where A h is the heat transfer area, Q h is the heat transfer rate, and T w is the average temperature of the wall for the hot side. The fluid average temperature T h , a v e for the hot side is given as follows:
T h , a v e = T h , i n + T h ,   o u t 2
Q h = m h ( H h , o u t H h , i n )
Considering the above equations, m h represents the mass flow rate of the R22, H h , o u t and H h , i n represent the outlet enthalpy and inlet enthalpy of the R22, respectively, which were obtained using the REFPROP software based on the tested temperature and pressure. The wall temperature T w was computed indirectly using the Formulas given as follows:
There are two methods to obtain the total heat transfer coefficient U. A direct method can be used to calculate U using experimental data:
U = Q ¯ φ A h Δ T m
where φ is the correction factor (0.98 for the tested PCHE), Δ T m represents the log-mean temperature difference [25], and Q ¯ represents the average heat transfer rate on the hot side and cold side given as follows:
Q ¯ = Q h + Q c 2
Δ T m = ( T h , i n T c , o u t ) ( T h , o u t T c , i n ) l n [ ( T h , i n T c , o u t ) ( T h , o u t T c , i n ) ]
A second indirect method is represented as:
U = 1 1 h h + R w + 1 h c
where R w is the thermal-conduction resistance of the wall, and h h , h c are the convective heat transfer coefficients of the hot and cold fluid, respectively. Additionally, h h and h c can be replaced by:
h i = Q i A i ( T i , a v e T w )   ( i   =   h   or   c )
The parameter T w can be calculated by combining (4), (7), and (8).
The Nusselt number of the R22 was calculated by the following equation:
N u h = h h D h k h
where D h represents the hydraulic diameter and k h represents the thermal conductivity of the R22.
The total pressure drop of the R22 consisted of inlet and outlet pressure losses, deceleration pressure loss, and friction pressure loss. Since the area of the header was much greater than that of the channel, the inlet and outlet pressure losses could be ignored on account of its small value compared to the pressure loss in the minichannels. Since the channel length was very short and the shear stress on the fluid in the mini/microchannel was larger than that in the macrochannel, the influence of gravity could be ignored [26]. The friction pressure loss was calculated through:
Δ p h , f = Δ p h + Δ p h , d e = Δ p h + ( ρ h , i n u h , i n 2 ρ h , o u t u h , o u t 2 )
where Δ p h is the total pressure drop of the R22 which was directly measured, ρ h , i n and ρ h , o u t are the inlet density and outlet density of the R22, which were obtained from the REFPROP software based on the measured temperature and pressure. u h , in and u h , out are the inlet velocity and outlet velocity, which were calculated by the measured mass flow rate.
The friction pressure gradient was calculated as follows:
d p f d z = Δ p h , f l
where l is the hot channel length.

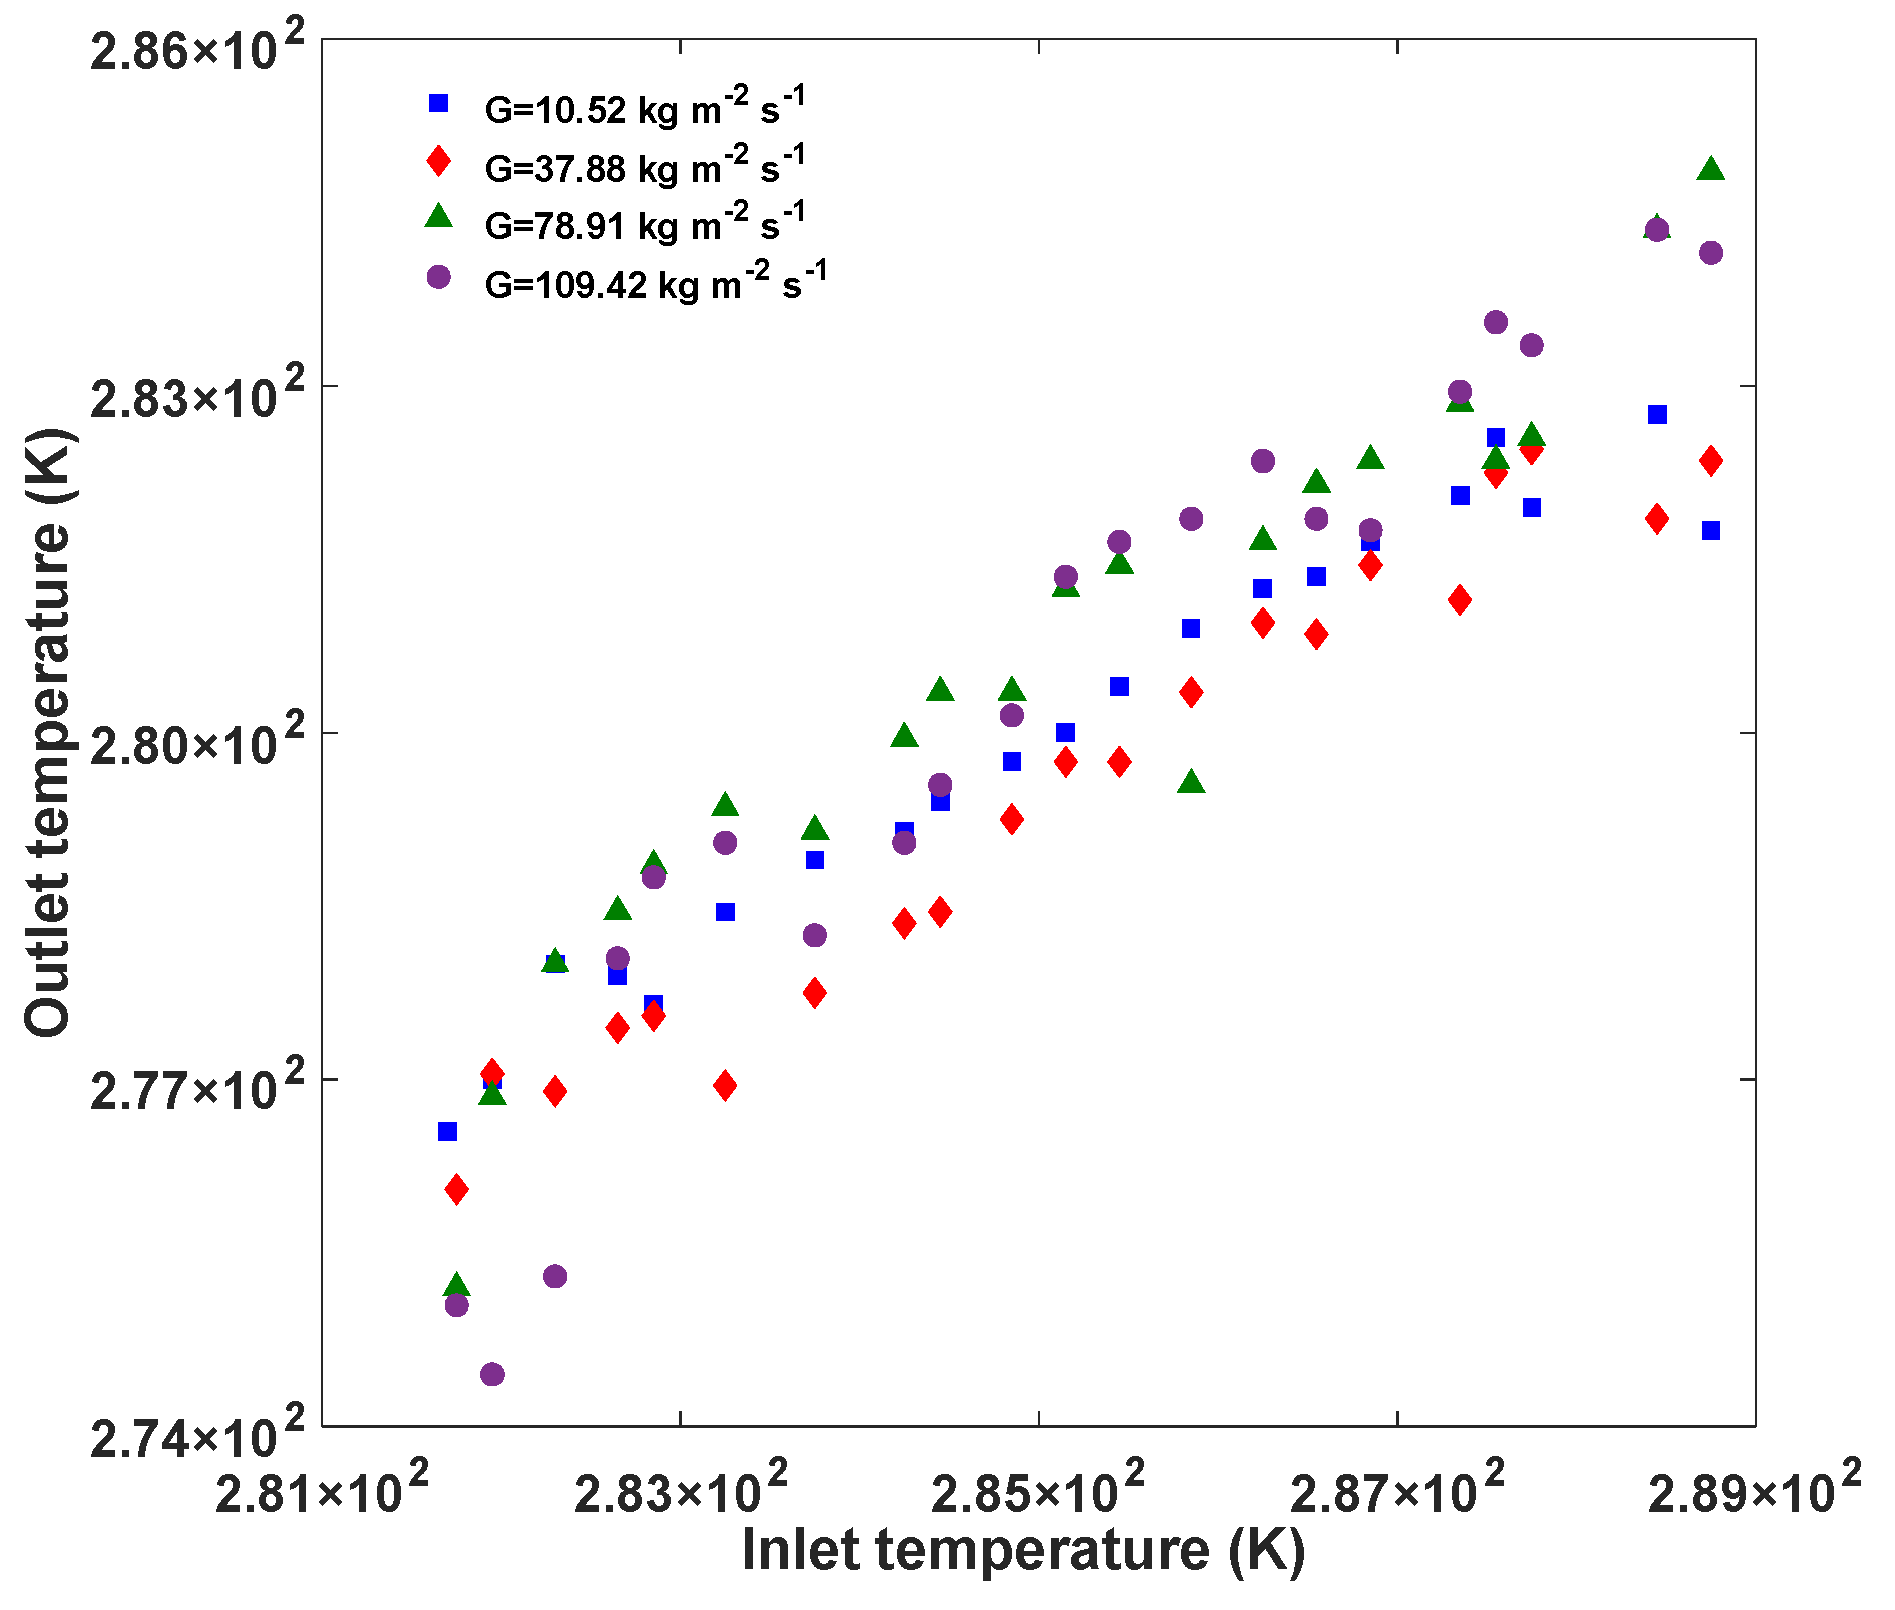
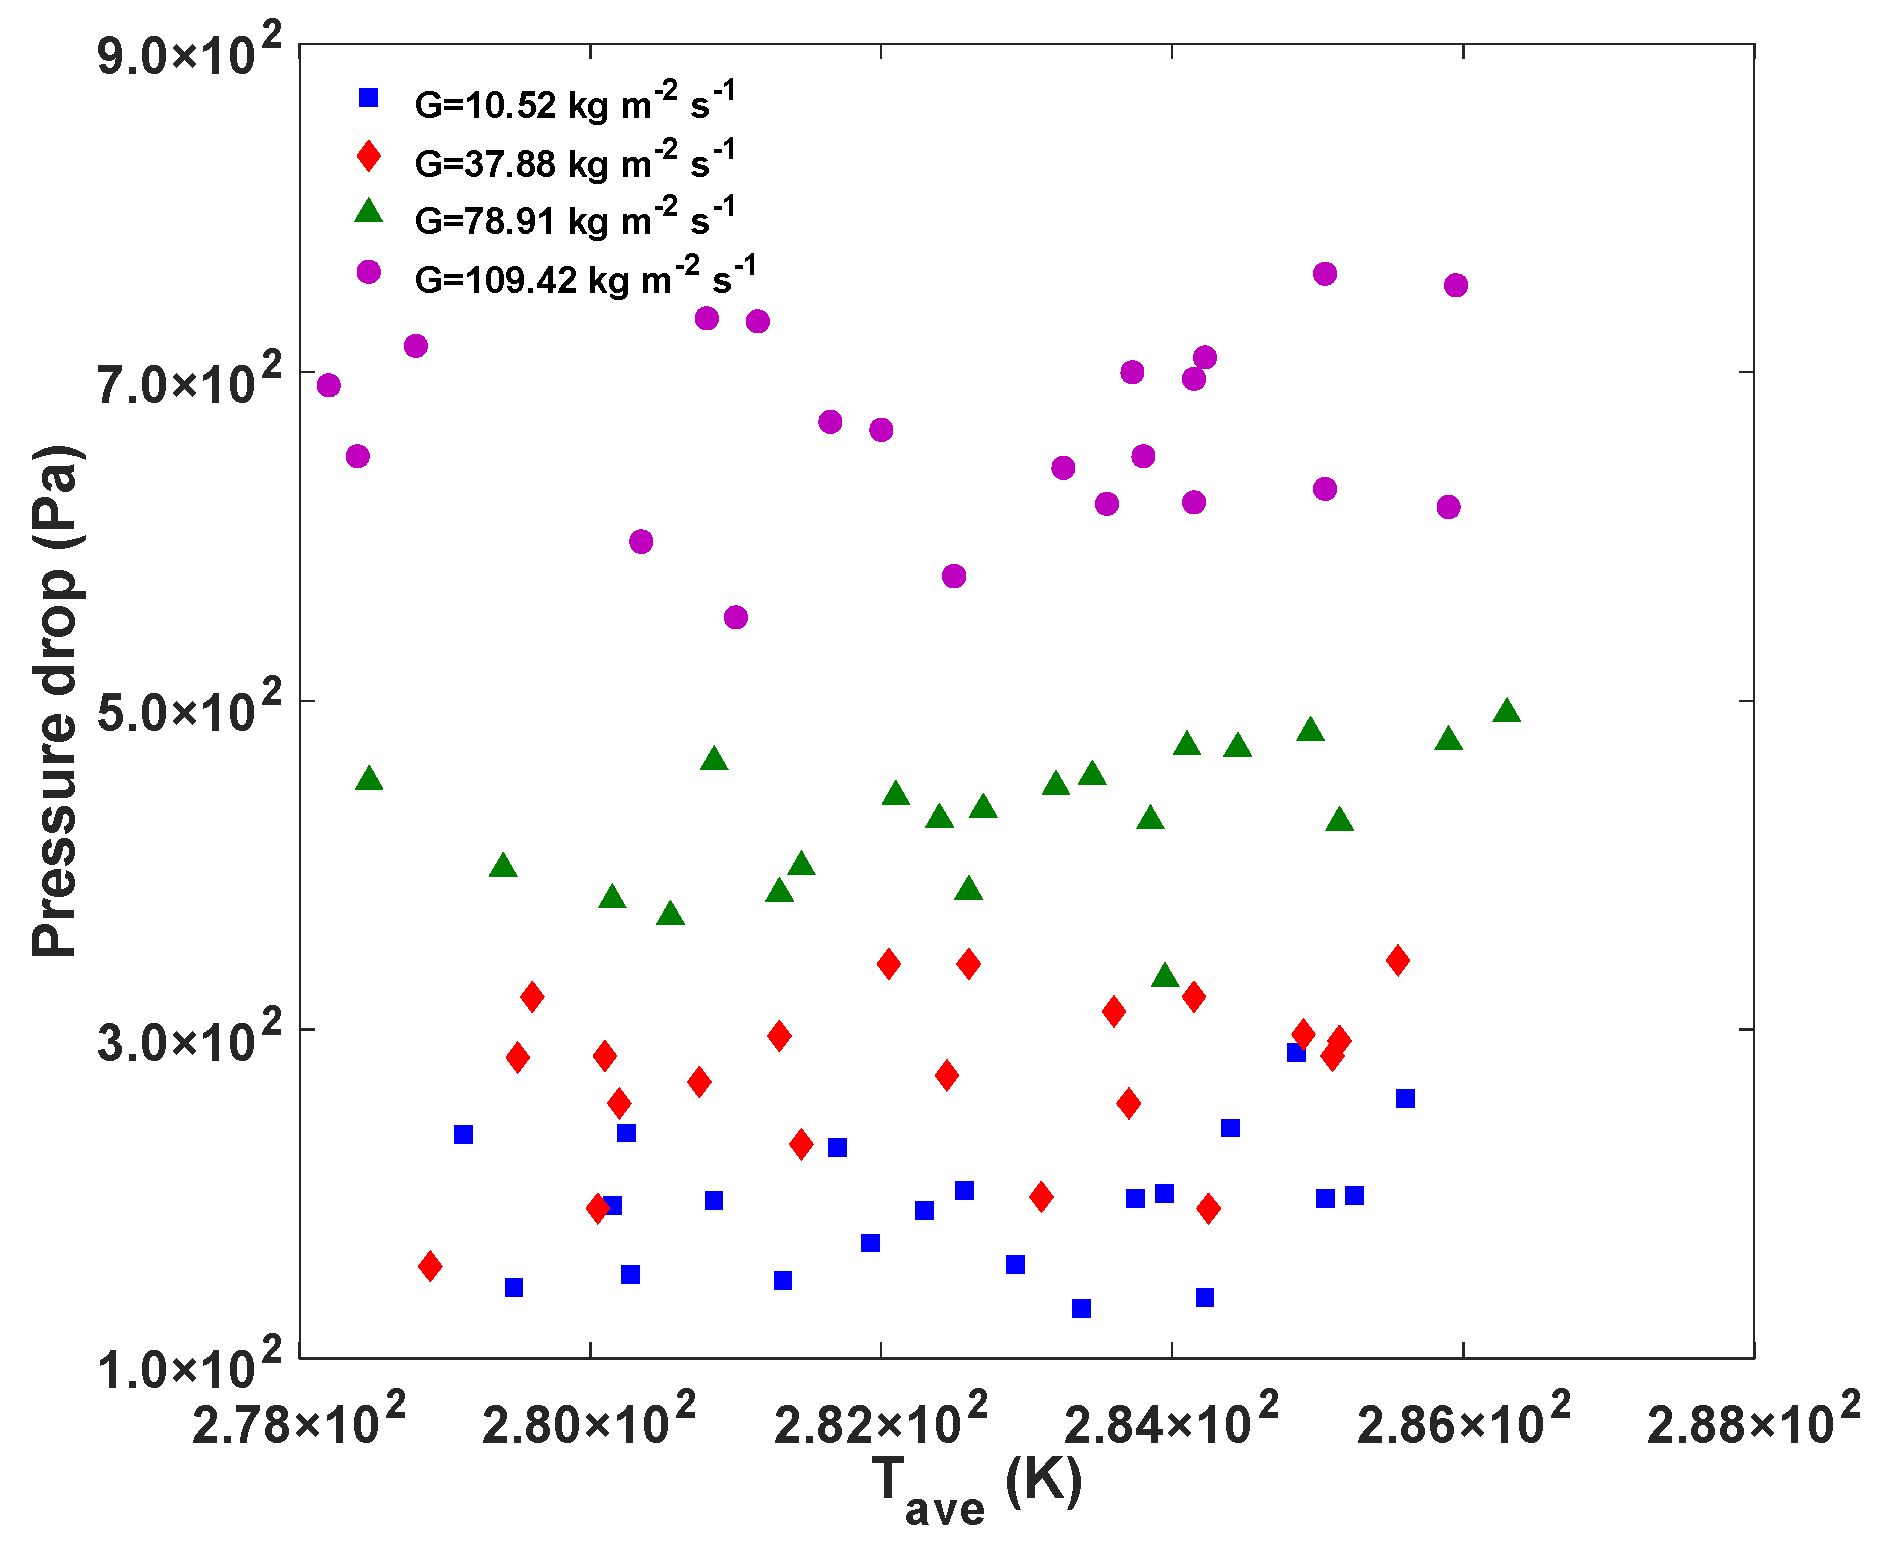
3. Experimental Results and Discussion

A total of 140 sets of the experimental data were selected to explore the condensation flow and heat transfer characteristics of the R22 at the Printed Circuit Heat Exchanger (PCHE) hot side minichannel, including the temperature, pressure drop, and heat transfer coefficient. The inlet pressures of the R22 ranged from 0.5 MPa to 0.65 MPa, and the mass flux were varied from 10.52 kg   m 2 s 1 to 109.42 kg   m 2 s 1 . The inlet temperatures of the R22 were varied from 273 K to 289 K. The thermophysical properties of the R22 under different pressures were obtained using the REFPROP software [27], as shown in Table 2.
Figure 3 displays the outlet temperature of the R22 versus the inlet temperature for different mass flux conditions when the pressure was 0.65 MPa. The general trend was a rise in the outlet temperature with an increase in the inlet temperature, but the outlet temperature changed irregularly at each operating point. This irregular behavior is caused by a varying heat transfer at each experimental condition due to the uncontrollable nature of the experiment.
Figure 4 displays the pressure drop of the R22 versus the temperature under different mass flux values when the pressure was 0.65 MPa. The results show that the pressure drop increased with an increasing mass flux. The reason for this trend is, when the mass flux is higher the increase of the shear stress between the gas and liquid leads to an increasing pressure drop.
The impact of the mass flux on the heat transfer coefficient was analyzed when the mass flux values were 10.52   kg   m 2 s 1 , 37.88   kg   m 2 s 1 , 78.91   kg   m 2 s 1 , and 109.42 kg   m 2 s 1 and the pressure was 0.65 MPa, as shown in Figure 5. The results show that the heat transfer coefficient increased with an increasing mass flux, which can be attributed to a thinning of the liquid film [28,29,30]. The R22 condenses to form a liquid film attached to the inner wall of the channel. The rise in mass flux means an increase in fluid velocity and interfacial shear stress, causing the thinning of the liquid film and a reduction in the thermal resistance, which greatly affects the condensation heat transfer.
Next, the influence of the inlet pressure on the pressure drop and heat transfer coefficient was analyzed experimentally for pressures of 0.5 MPa, 0.55 MPa, 0.6 MPa, and 0.65 MPa, and a mass flux of 10.52 kg   m 2 s 1 . Figure 6 shows the pressure drop was relatively higher at lower pressures. This trend can be explained by the variation of the R22 thermo-physical properties under different pressures (Table 2) [31]. Shown in Table 2, the density of the R22 vapor decreases with the decrease in pressure, while that of the R22 liquid increases. Under the same mass flux, with the decrease in pressure, the velocity of the R22 vapor increased and the velocity of the R22 liquid decreased. This effect leads to an increase in the velocity difference between the R22 vapor and the R22 liquid, and an increase in the interfacial shear stress; therefore, the pressure drop is relatively higher at lower pressures. Additionally, the liquid dynamic viscosity increases as the pressure reduces, further causing an increase in the pressure drop.
Figure 7 demonstrates that the heat transfer coefficient was relatively higher at lower pressures. It can be observed from Table 2 that both the latent heat of the vaporization and the thermal conductivity of the liquid increased with the decrease in pressure, which played a major role in the increase in the heat transfer coefficient. This effect is confirmed by Liu and Xiao [31] and Cavallini et al. [32].

4. Numerical Model and Methodology

The experimental study cannot visualize the internal flow information of the Printed Circuit Heat Exchanger (PCHE) channels, as it is limited by a small channel scale and high operating pressures. Therefore, the internal flow and heat transfer inside the minichannels of the PCHE hot side were numerically studied using FLUENT software [33]. We selected a total of 46 sets of data according to the experimental conditions given in the previous section for simulation. Comparing the experimental and numerical data, the accuracy of the numerical model was verified, and the experimental results were analyzed in depth to explore the underlying mechanisms giving the results.

4.1. Computational Geometry and Boundary Conditions

The experimental Printed Circuit Heat Exchanger (PCHE) is a cross-flow type of heat exchanger; the photo and the core diagram of a PCHE are shown in Figure 2. It can be observed from Table 1 that there are a large number of channels in the PCHE, therefore, it is very complicated to numerically analyze the flow and heat transfer for the whole geometric model. Based on existing research, the numerical model for the PCHE can be simplified using a few assumptions [4,34]. Therefore, the calculation model was simplified to a single straight channel with a complete length of 50 mm for the numerical study, as shown on the left in Figure 8, based on the following assumptions: (1) The PCHE was running in a stable state; (2) The flow and heat transfer of the R22 in each minichannel were stable; (3) The pressure drop of the R22 inside the minichannel was small compared to the system pressure, therefore, the impact of the pressure drop on the R22 thermo-physical properties was ignored.
The inlet boundary was a mass flow inlet, and the outlet was set as an outflow boundary. The heat transferred from the R22 to the liquid nitrogen side was imposed on the top and bottom walls of the R22 channel in the form of heat flux. The left and right walls were insulated. This structure can be seen on the right of Figure 8.

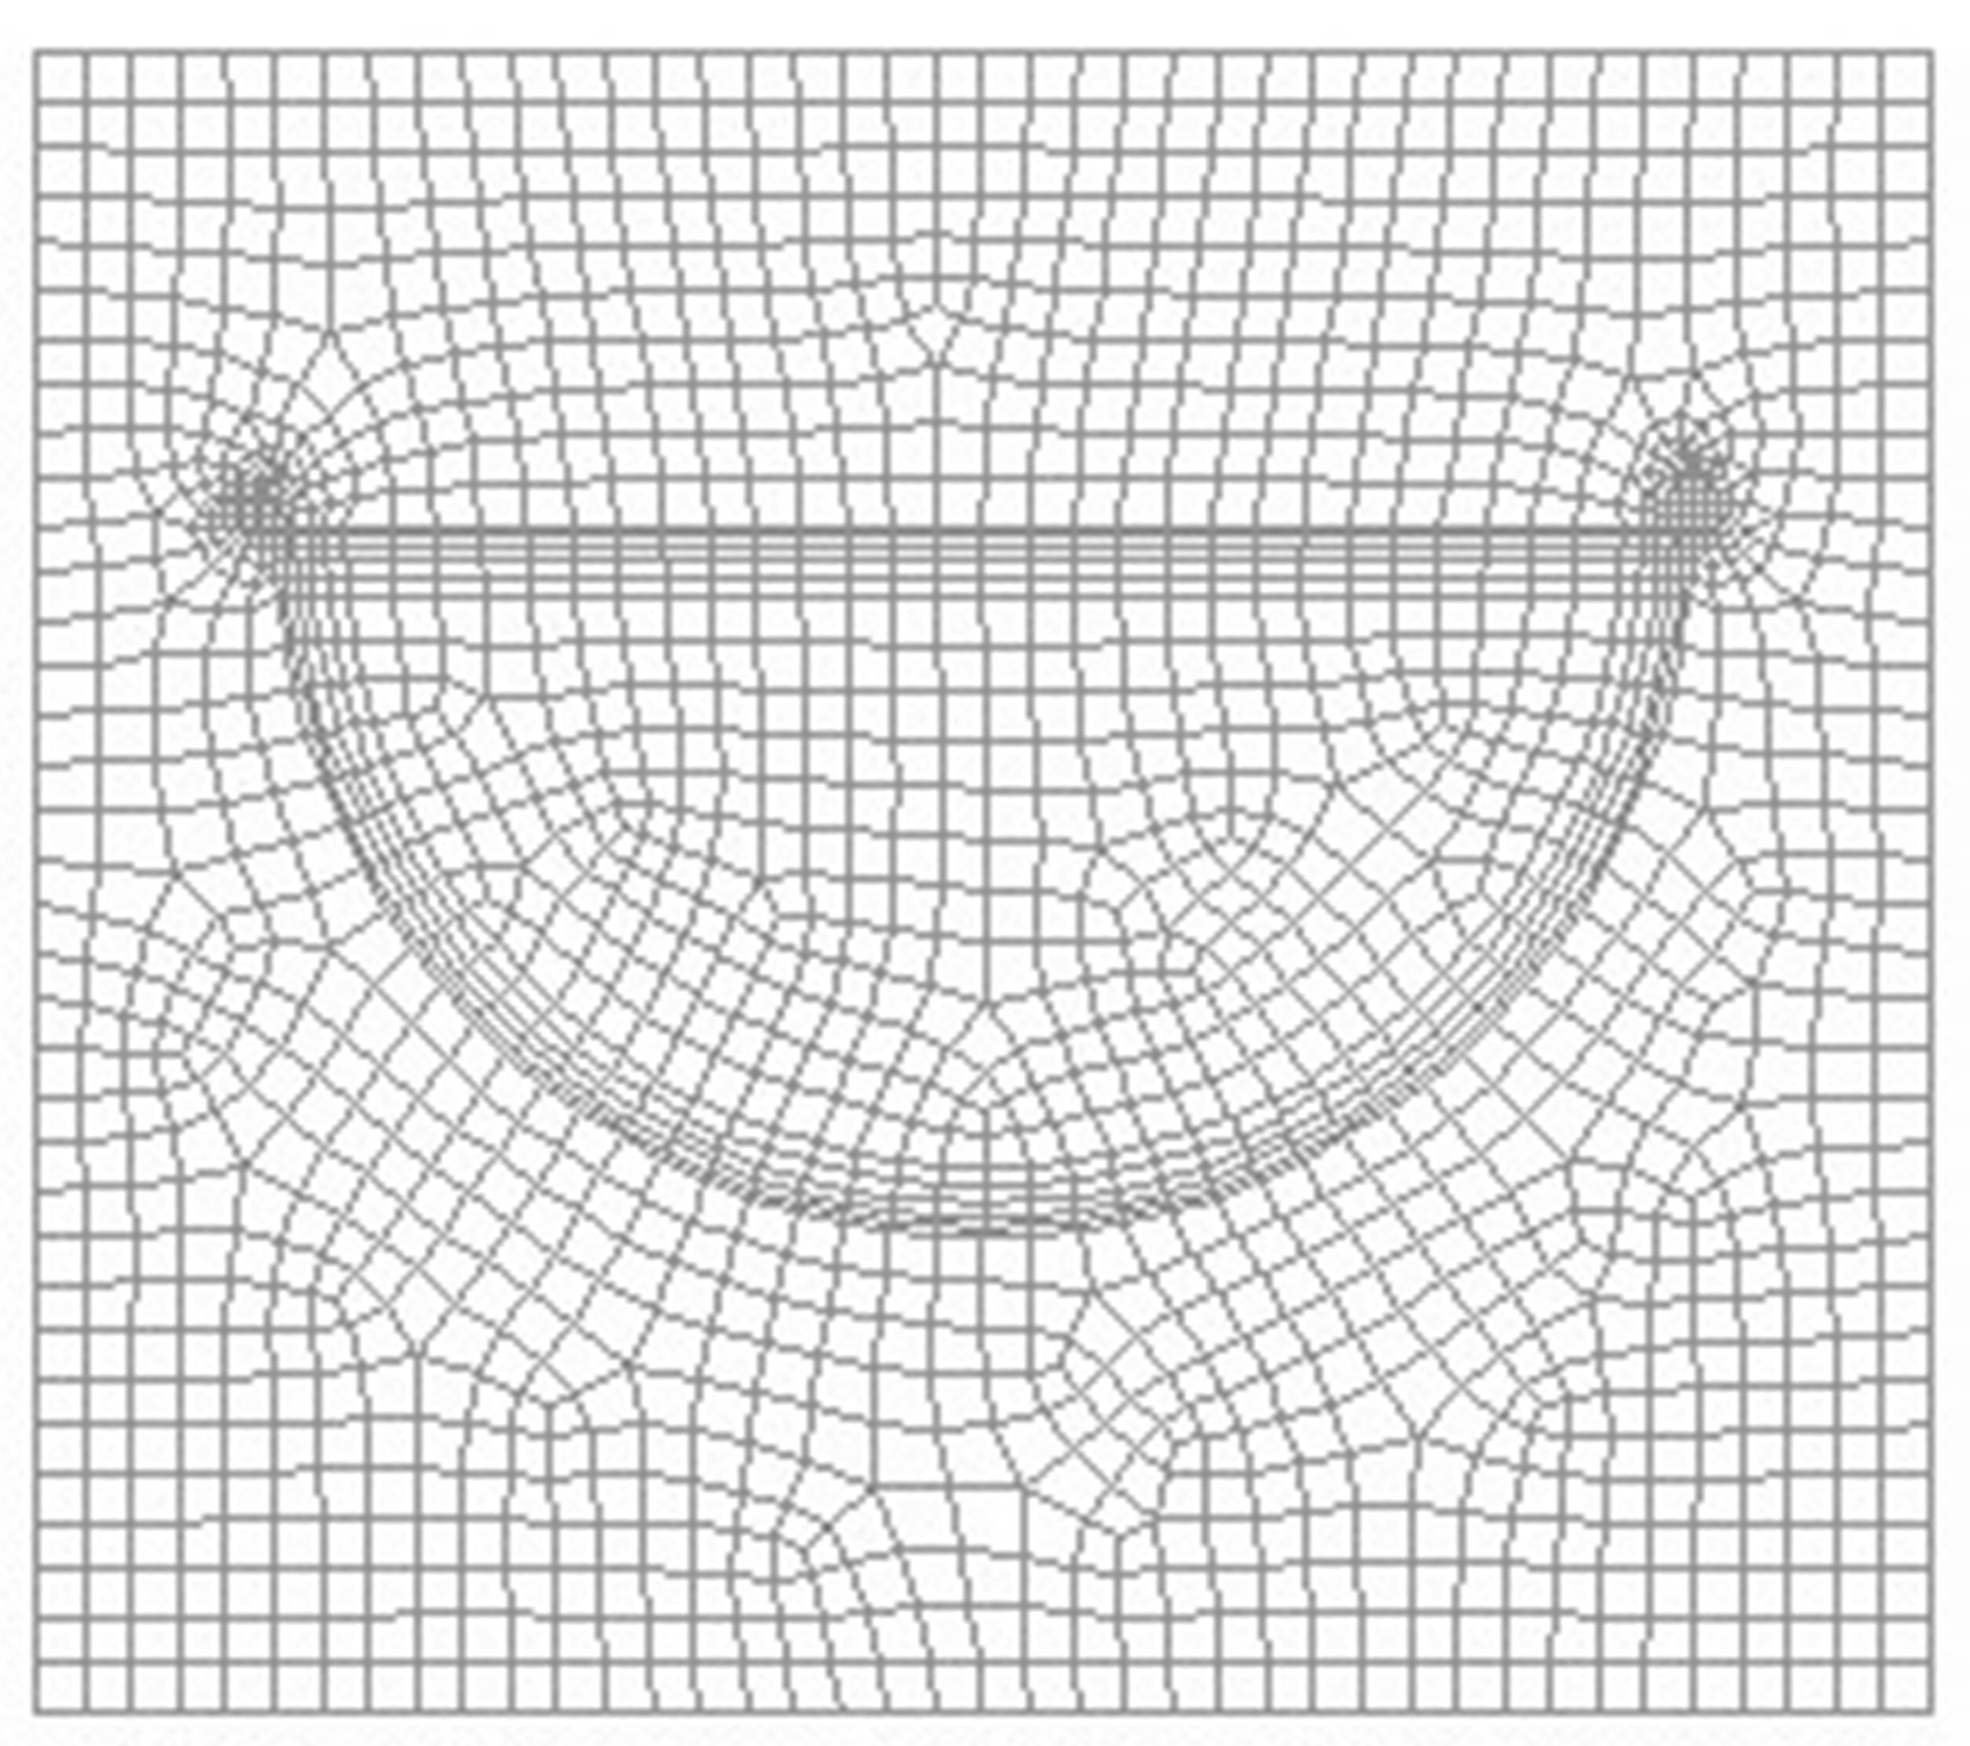
4.2. Grid and Solution Methods

The grid of the computational model was created with hexahedron and wedge cells by Gambit (Figure 9). The grid near the wall was densified to ensure y + < 1 so as to calculate accurately. We generated six groups of differing numbers of grids and selected the grid of 2,071,000 cells for further simulation through grid independence validation. The content of the grid partition and grid independence verification were discussed in detail in our previous research [24].
The Volume of Fluid (VOF) model was selected as the two-phase flow model, which is beneficial for obtaining the change of vapor-liquid interface position and shape. Due to the small size of the channel, the flow was in the turbulent zone, and a realizable k-ε model was used as the turbulence model [35]. Additionally, the transfer of mass and energy between the vapor and liquid phases in the condensation process was defined by loading a User Defined Function (UDF). The specific governing equations based on the VOF model, and the transport equations of the realizable k-ε model were described in detail in our previous work [24]. The momentum equation was spatially discretized by the power law scheme and the other equations were spatially discretized by the second-order upwind scheme. The pressure-velocity was coupled by the Pressure-Implicit with Splitting of Operators (PISO) solution scheme.

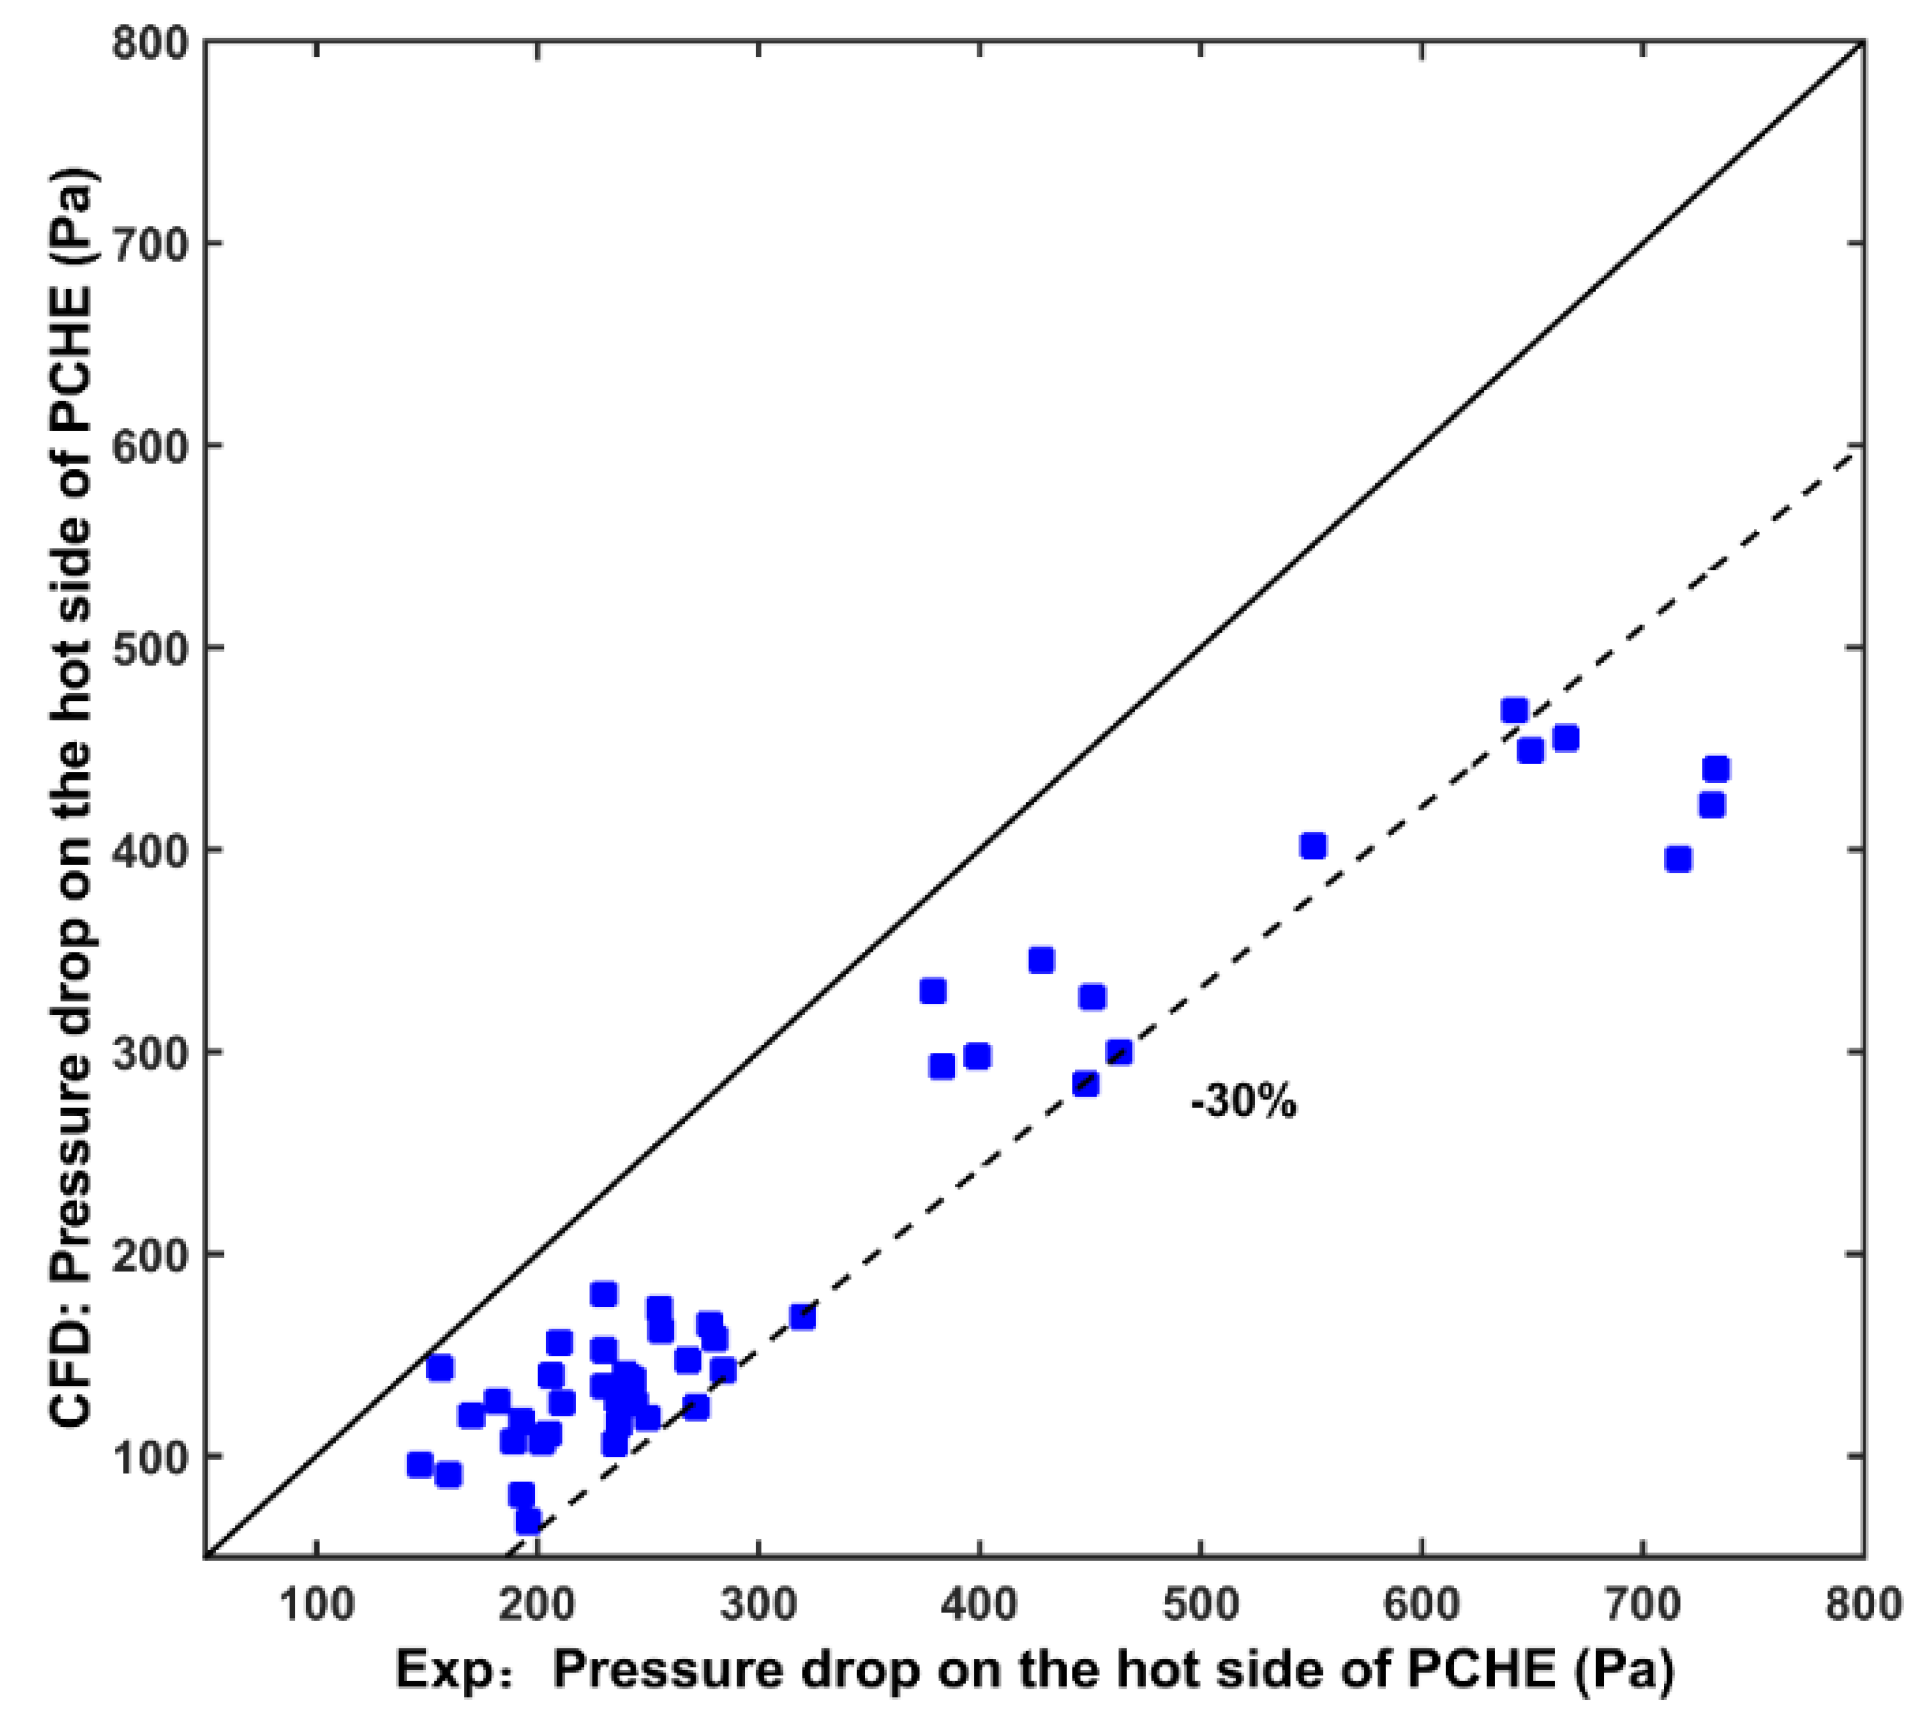
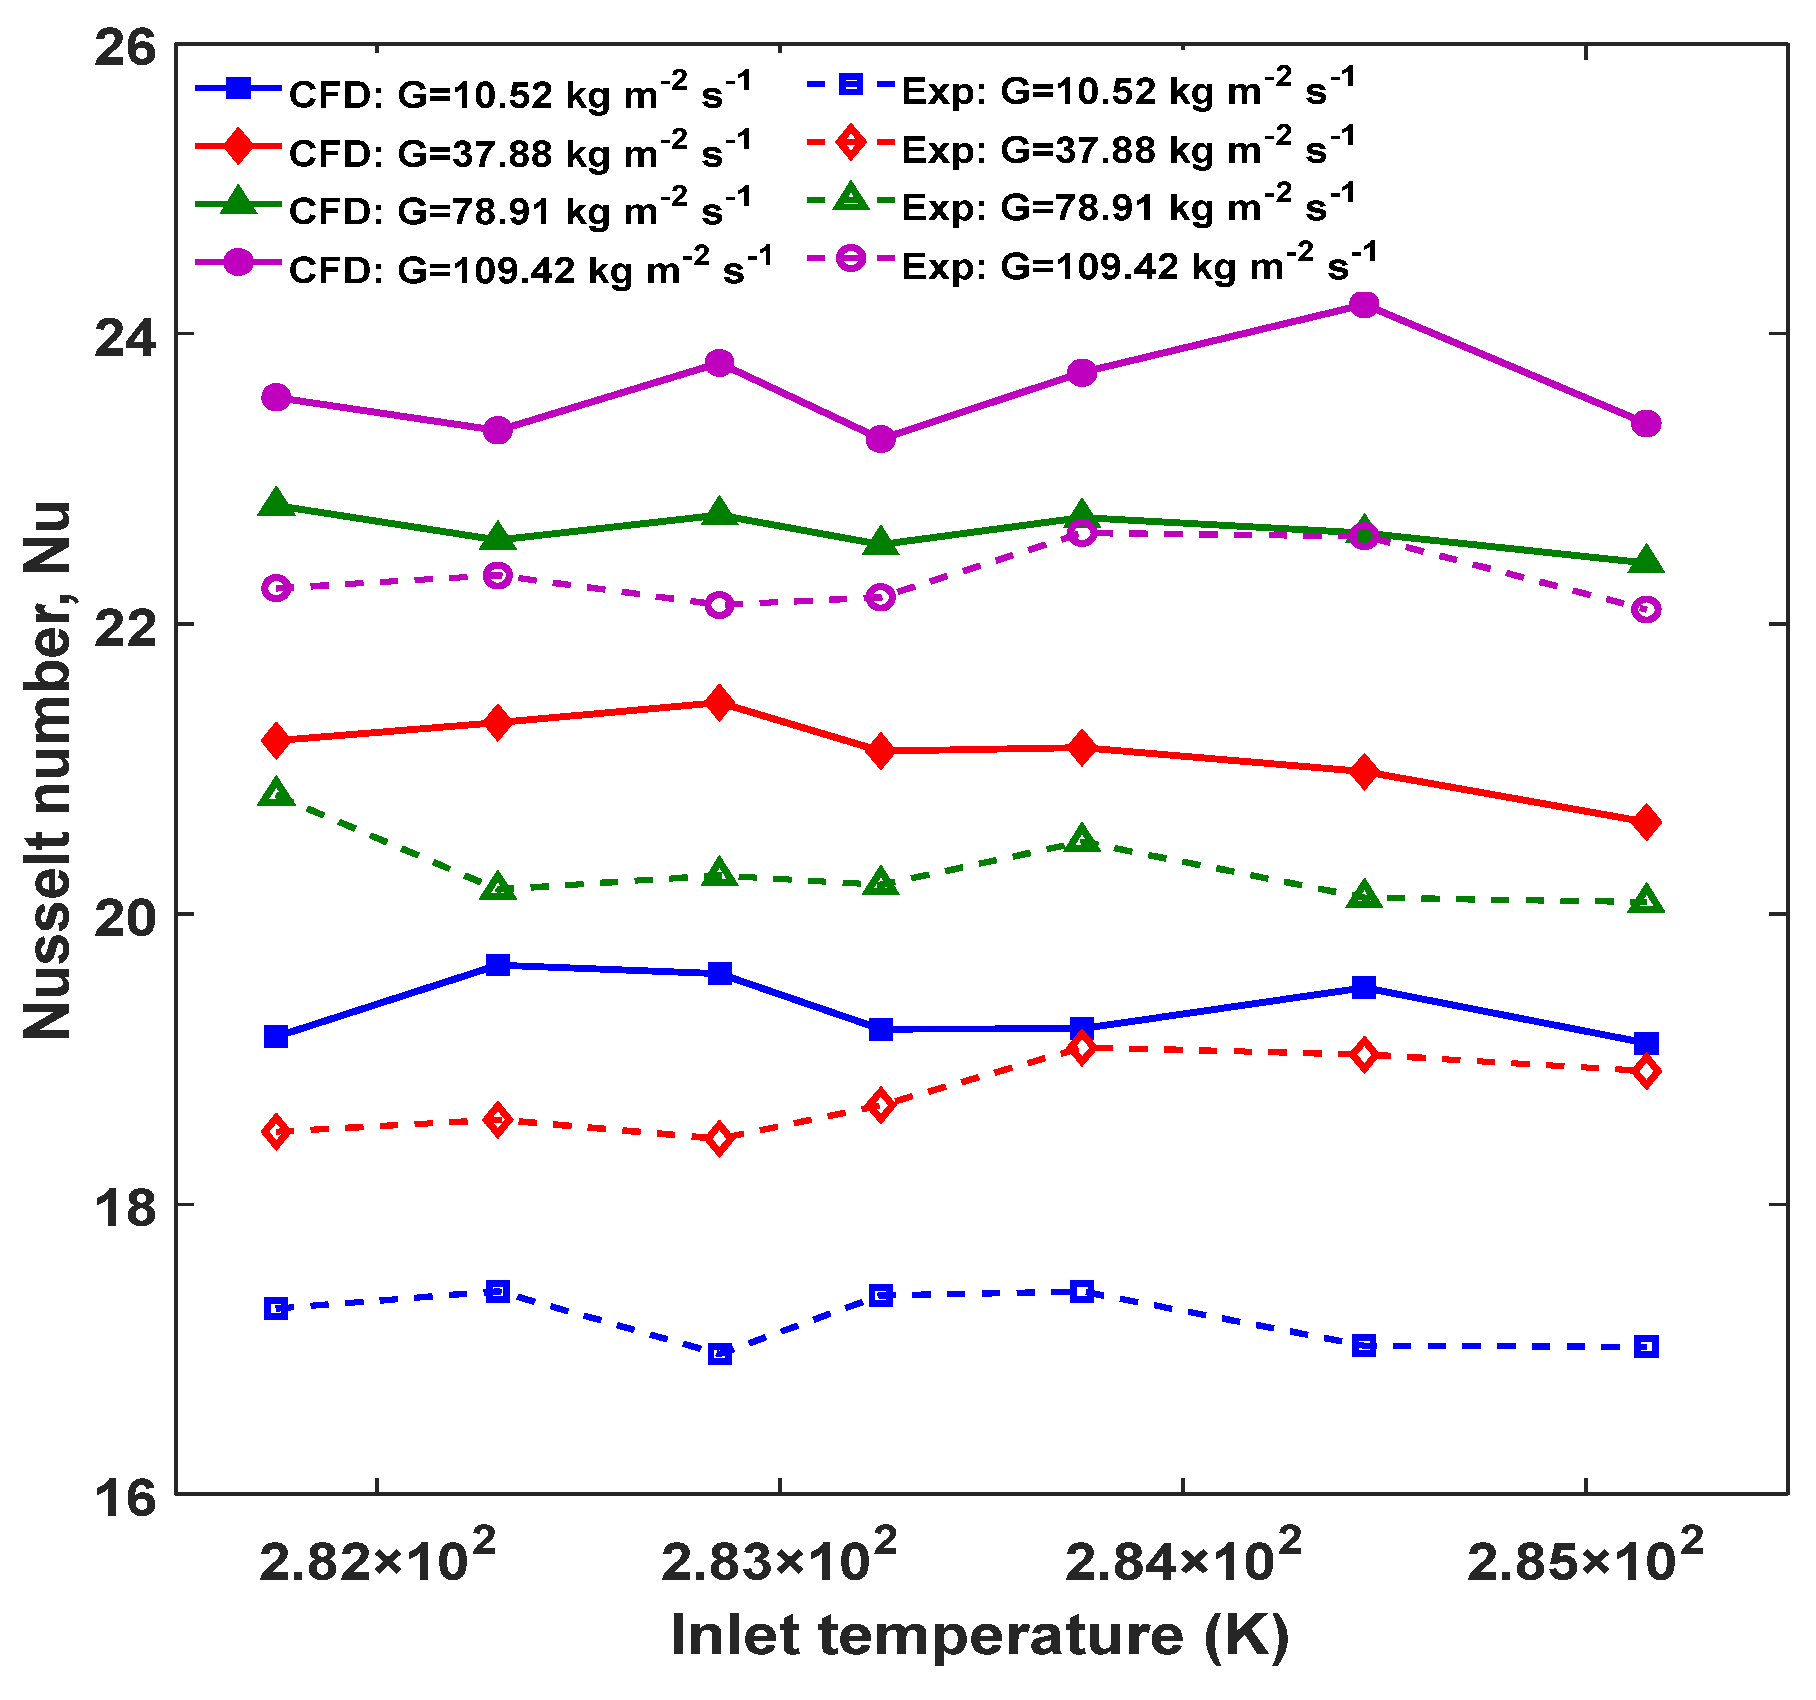
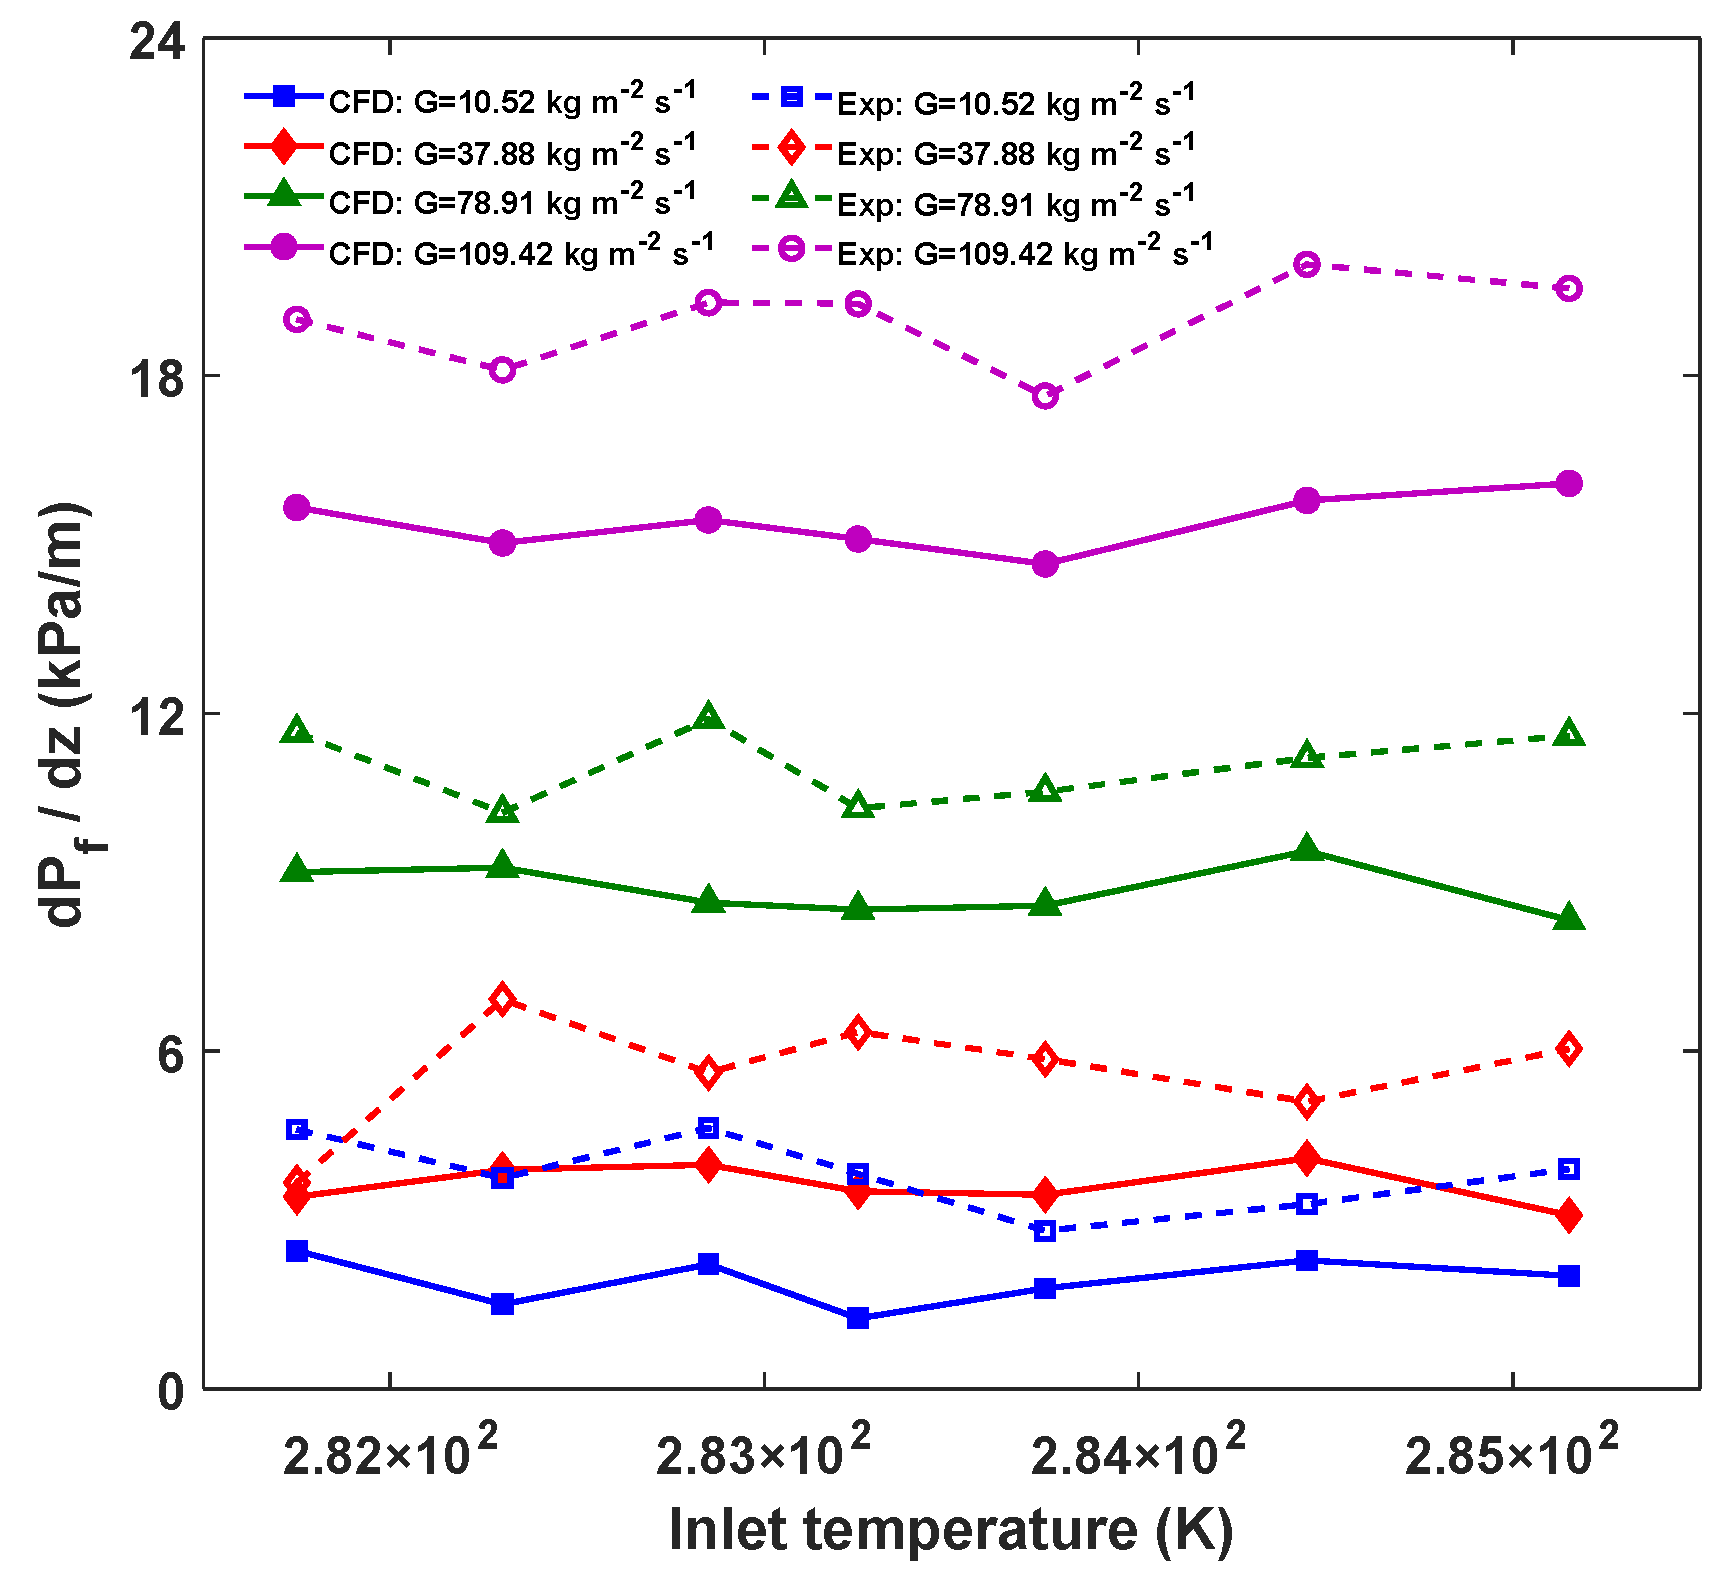
4.3. Model Validation

The numerical model was verified first against the selected 46 sets of tested data. The outlet temperature and pressure drop from the simulations were compared with those from the experiments, as shown in Figure 10 and Figure 11. The former figure shows that the numerical outlet temperature values matched closely with the experimental values and the maximum mismatch between them was 2%. It can be seen in Figure 2 that almost all the experimental pressure drop values were higher than the simulated values, and the difference between them was mostly within a range of 30%. Since the numerical model was just an ideal model for the core of the Printed Circuit Heat Exchanger (PCHE) with smooth channel walls, and the experimental values included both the dispersing liquid chamber and collecting liquid chamber pressure drops, the simulated pressure drop values were lower than the experimental values. It can be concluded that the numerical model is acceptable to predict the flow and heat transfer performance of the R22 in the minichannel.

5. Numerical Results and Discussion

Here, the Nusselt number (Nu) and the friction pressure gradient under different mass flux values and different pressures were used to analyze the numerical results.
Figure 12 depicts the contrast of experimental and numerical Nu values versus the inlet temperatures at different mass flux values, with a 0.65 MPa constant pressure. The results show that the values of the numerical Nu were higher than those of the experimental Nu, which can be attributed to an error in calculation based on the experimental data. This error occurred because, at the stage of calculating the heat transfer coefficient, the experimental wall temperature was computed indirectly using formulas (4), (7), (8), while the numerical wall temperature was read directly from FLUENT. The heat conduction resistance between the cold and hot fluids was neglected when calculating the experimental wall temperature, resulting in the high wall temperature and the low heat transfer coefficient. Regarding different mass flux values, the Nu increased as the mass flux value increased. Since the latent heat transfer is more powerful than the sensible heat transfer, the phase-change heat transfer plays a main part in the two-phase flow and heat transfer process. It can be observed from Figure 13 that the condensing speed of the R22 was different for the different mass flux values. Concerning a low mass flux, the R22 was completely liquefied and subcooled before the outlet position, resulting in a rapid decline in the heat transfer capacity, while the R22 was always in the two-phase flow state for a high mass flux. Thus, the Nu values were relatively higher at higher mass flux values.
Figure 14 compares the experimental and numerical friction pressure gradients for different mass flux values and a 0.65 MPa constant pressure. The figure indicates that the values of the experimental friction pressure gradient were higher than those of the numerical friction pressure gradient because the numerical model was an ideal model with glossy channel walls. Additionally, the friction pressure gradient increased with the increasing mass flux, which was due to the increase in vapor-liquid shear stress. This trend also can be seen in the flow pattern shown in Figure 13. Accompanying the increase in mass flux, the flow pattern transformed from intermittent flow to annular flow, and shear stress is the main force in annular flow.
Figure 15 compares the experimental and numerical Nu values versus the inlet temperature at different pressures and a 10.52 kg   m 2 s 1 mass flux, showing that the Nu values were higher at the lower pressure values. As can be observed in Figure 16, at a lower pressure, the position of complete condensation was closer to the channel outlet, and the R22 was in the two-phase flow state for a longer time. Since the phase-change heat exchange is more powerful than the single-phase heat exchange, the values of Nu are higher at the lower pressure. Additionally, the values of the numerical Nu are higher than those of the experimental Nu, the reason for this phenomenon has been explained in the preceding text.
Figure 17 shows a comparison of the experimental friction pressure gradient and numerical friction pressure gradient versus the inlet temperature at different pressures and a mass flux of 10.52 kg   m 2 s 1 . The results show that the values of the experimental friction pressure gradient were higher than the numerical values due to the use of an ideal numerical model. The values of the friction pressure gradient were higher at lower pressures. This effect is caused by an increase in the velocity difference and the interfacial shear stress between vapor and liquid.

6. Conclusions

The pressure drop and heat transfer performance for the R22 condensation flow in the Printed Circuit Heat Exchanger (PCHE) hot side minichannels were analyzed through experiments and numerical simulations, respectively. Comparing the experimental and numerical data, the precision of the numerical model was confirmed, and the tested results were analyzed in depth through simulation to explore the underlying mechanism giving the results. The following conclusions were drawn based on the analysis:
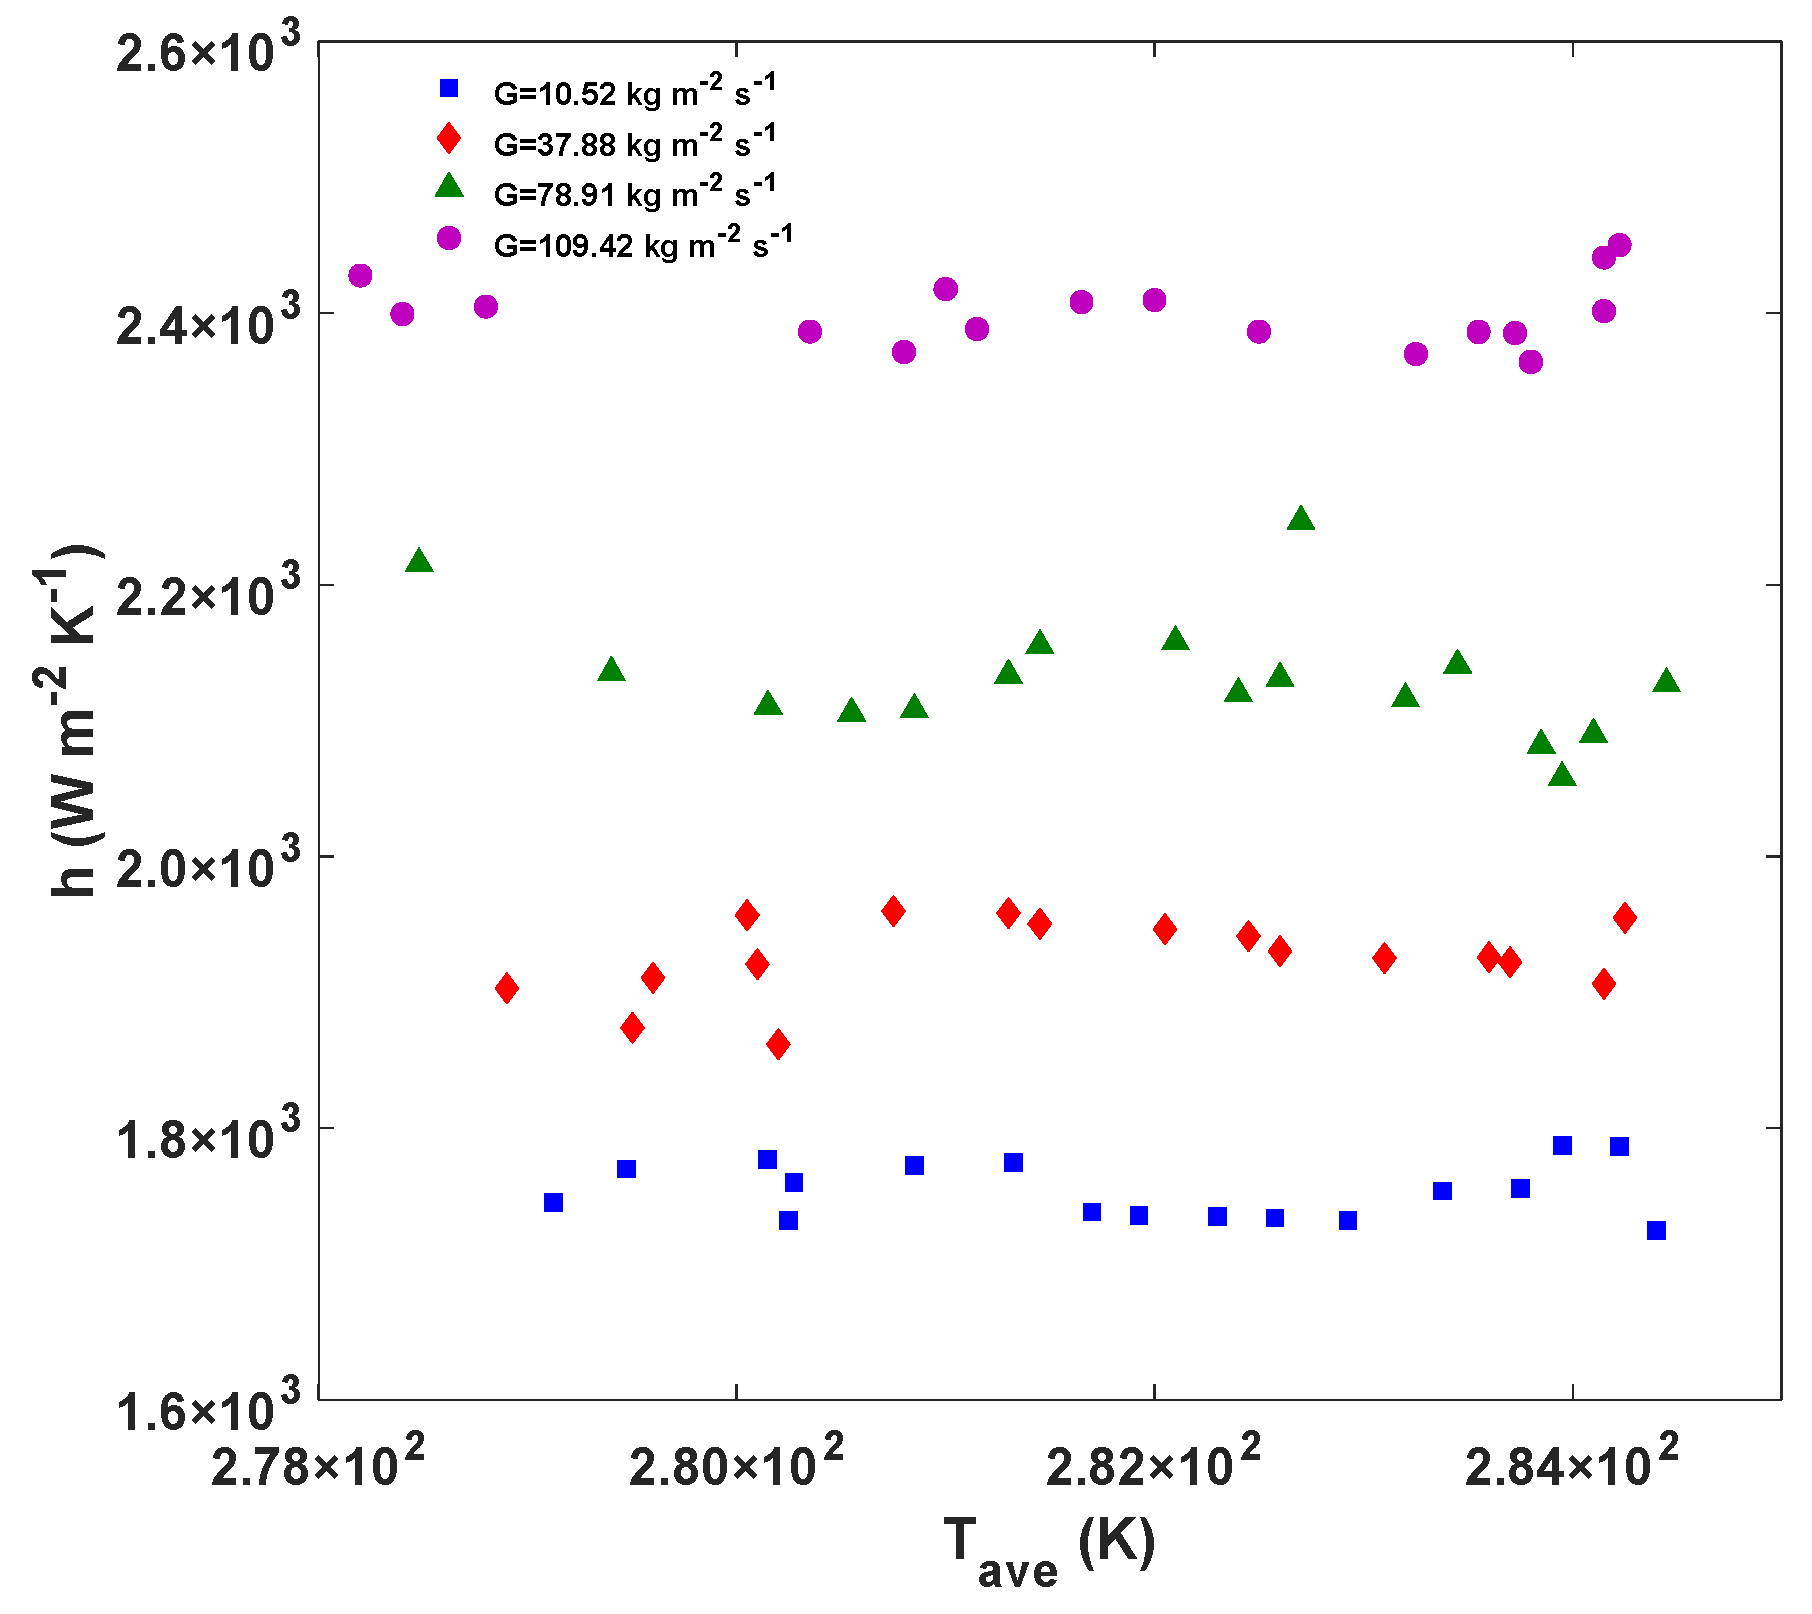
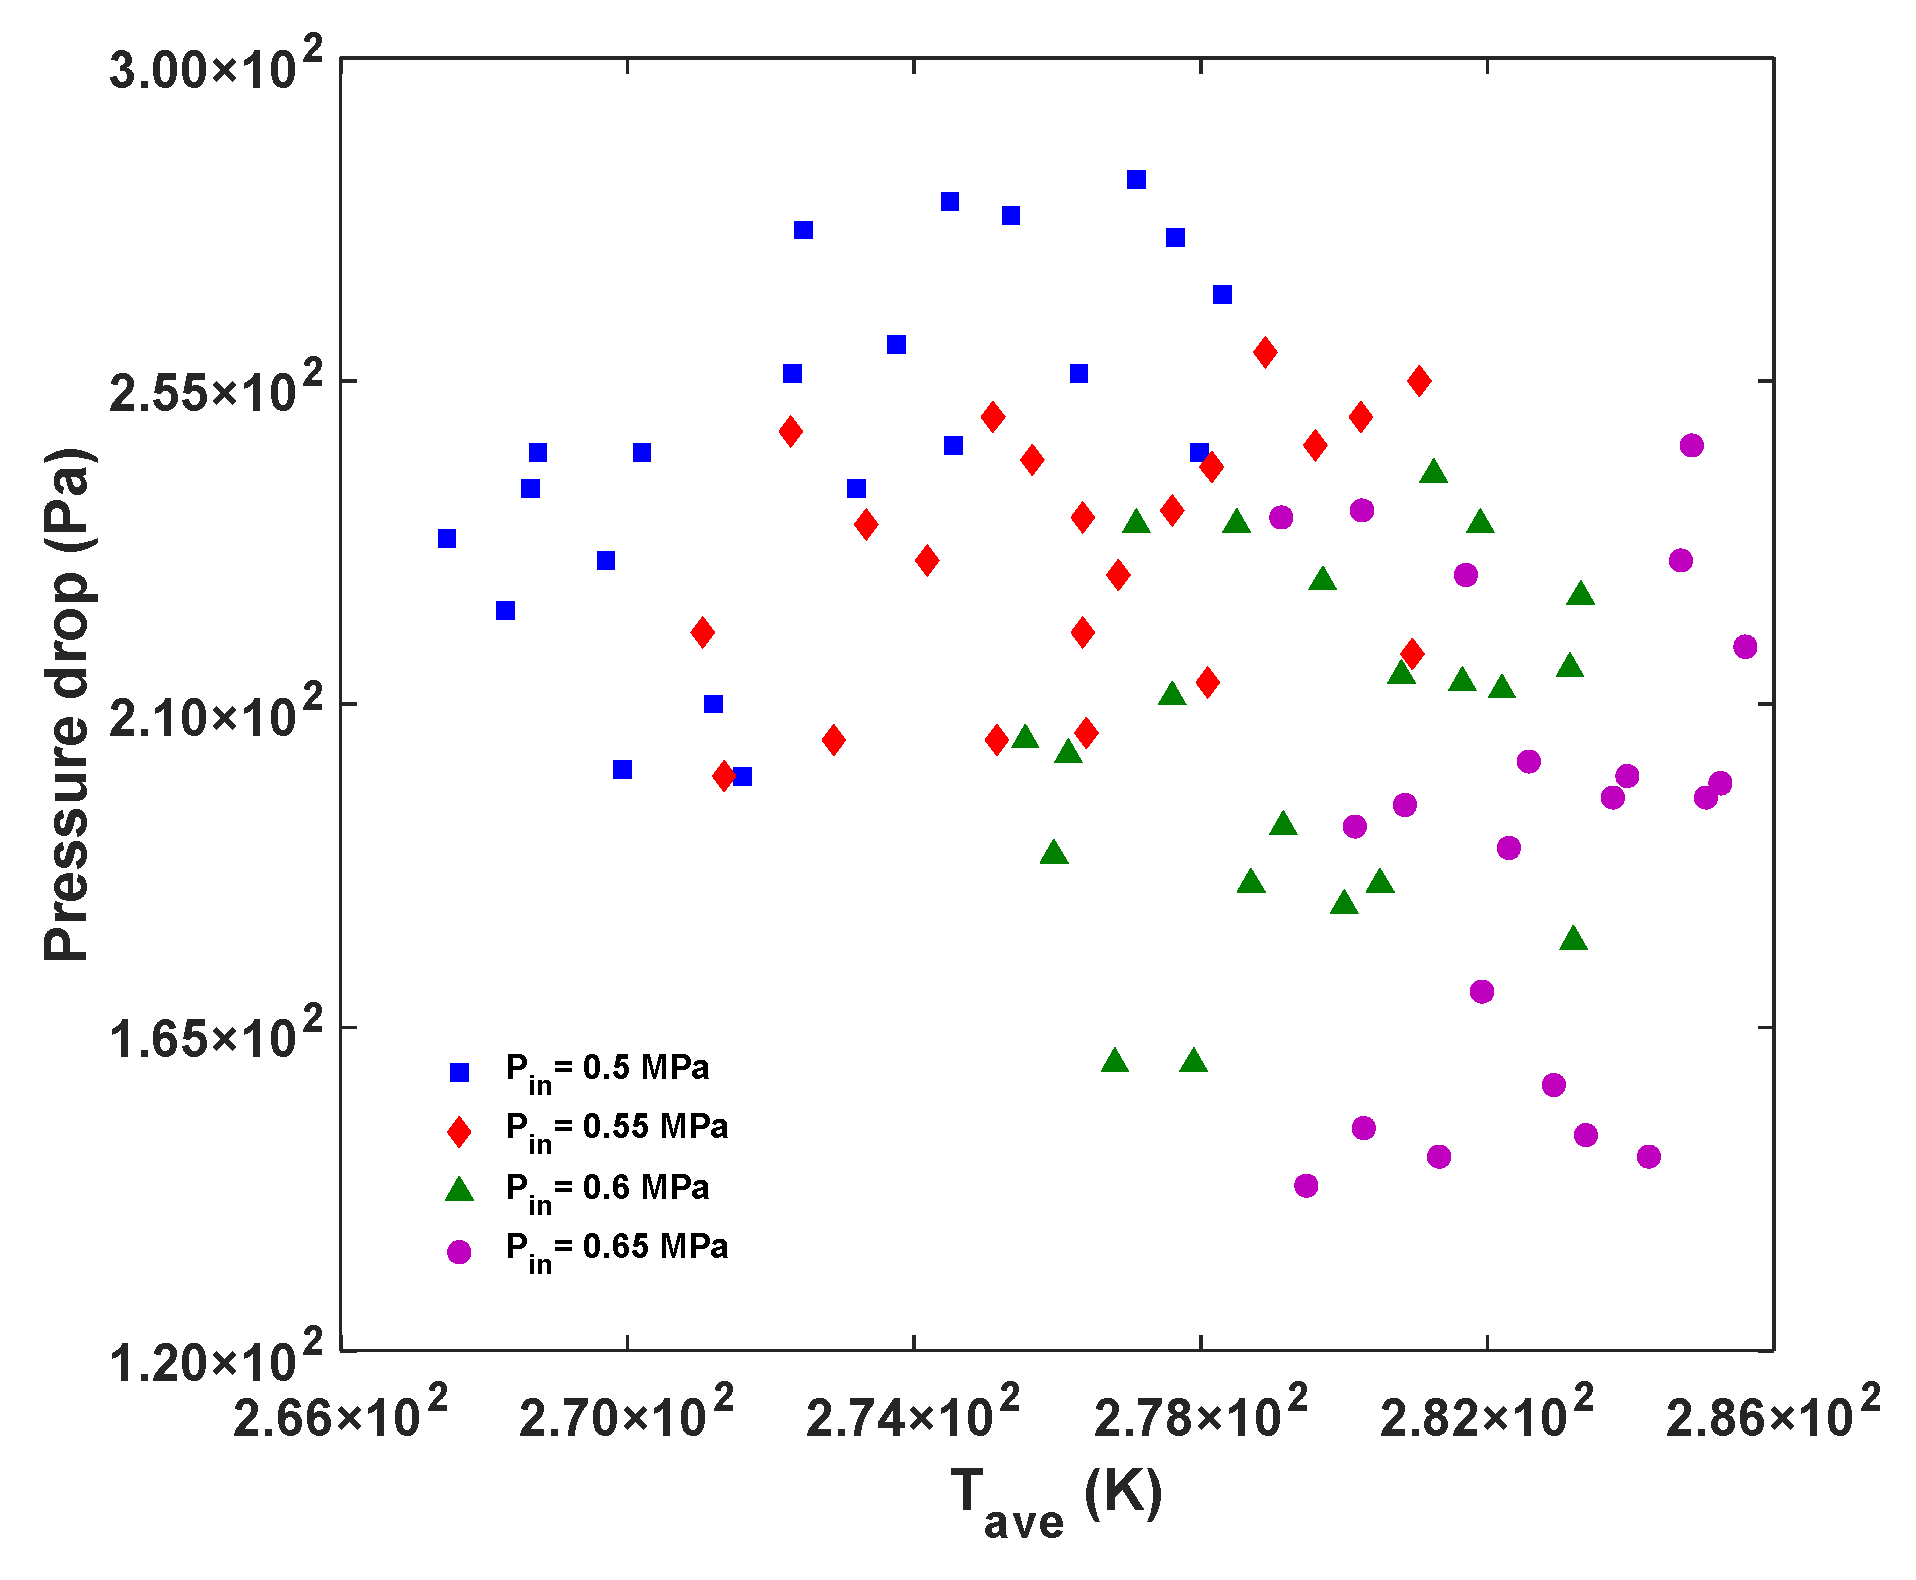
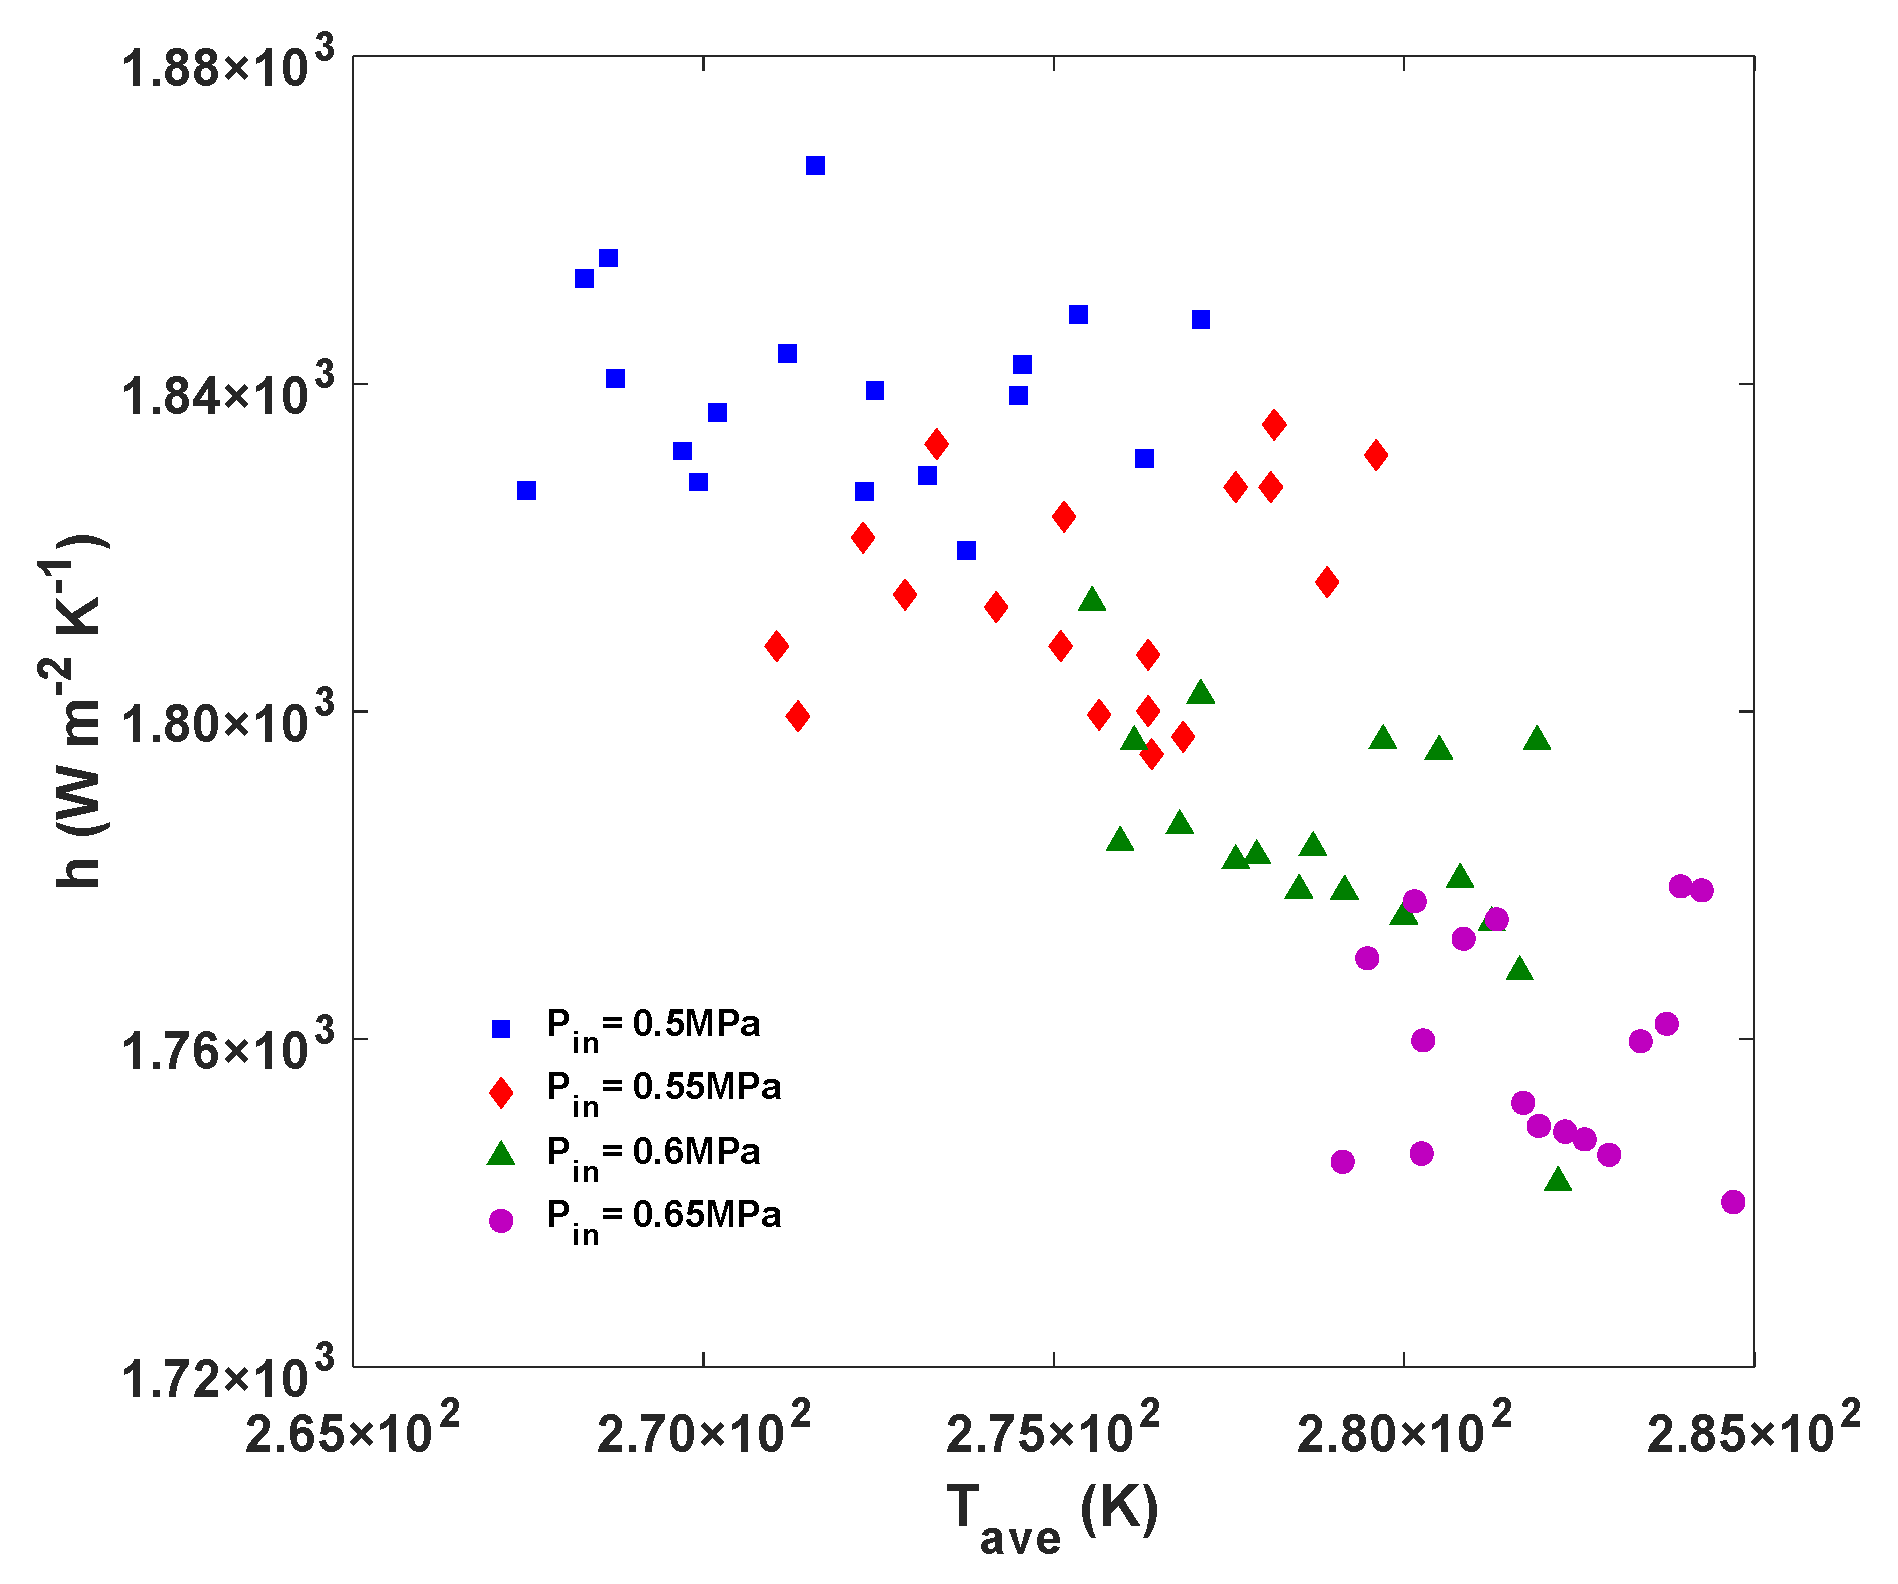
  • The influence of the pressure and mass flux of the R22 on the pressure difference and heat transfer coefficient was analyzed experimentally. Regarding a similar pressure value, the pressure drop and the heat transfer coefficient of the R22 increased with increasing mass flux due to an increase in interfacial shear force. Accompanying a fixed mass flux value, the pressure drop and the heat transfer coefficient were relatively higher at a lower pressure.
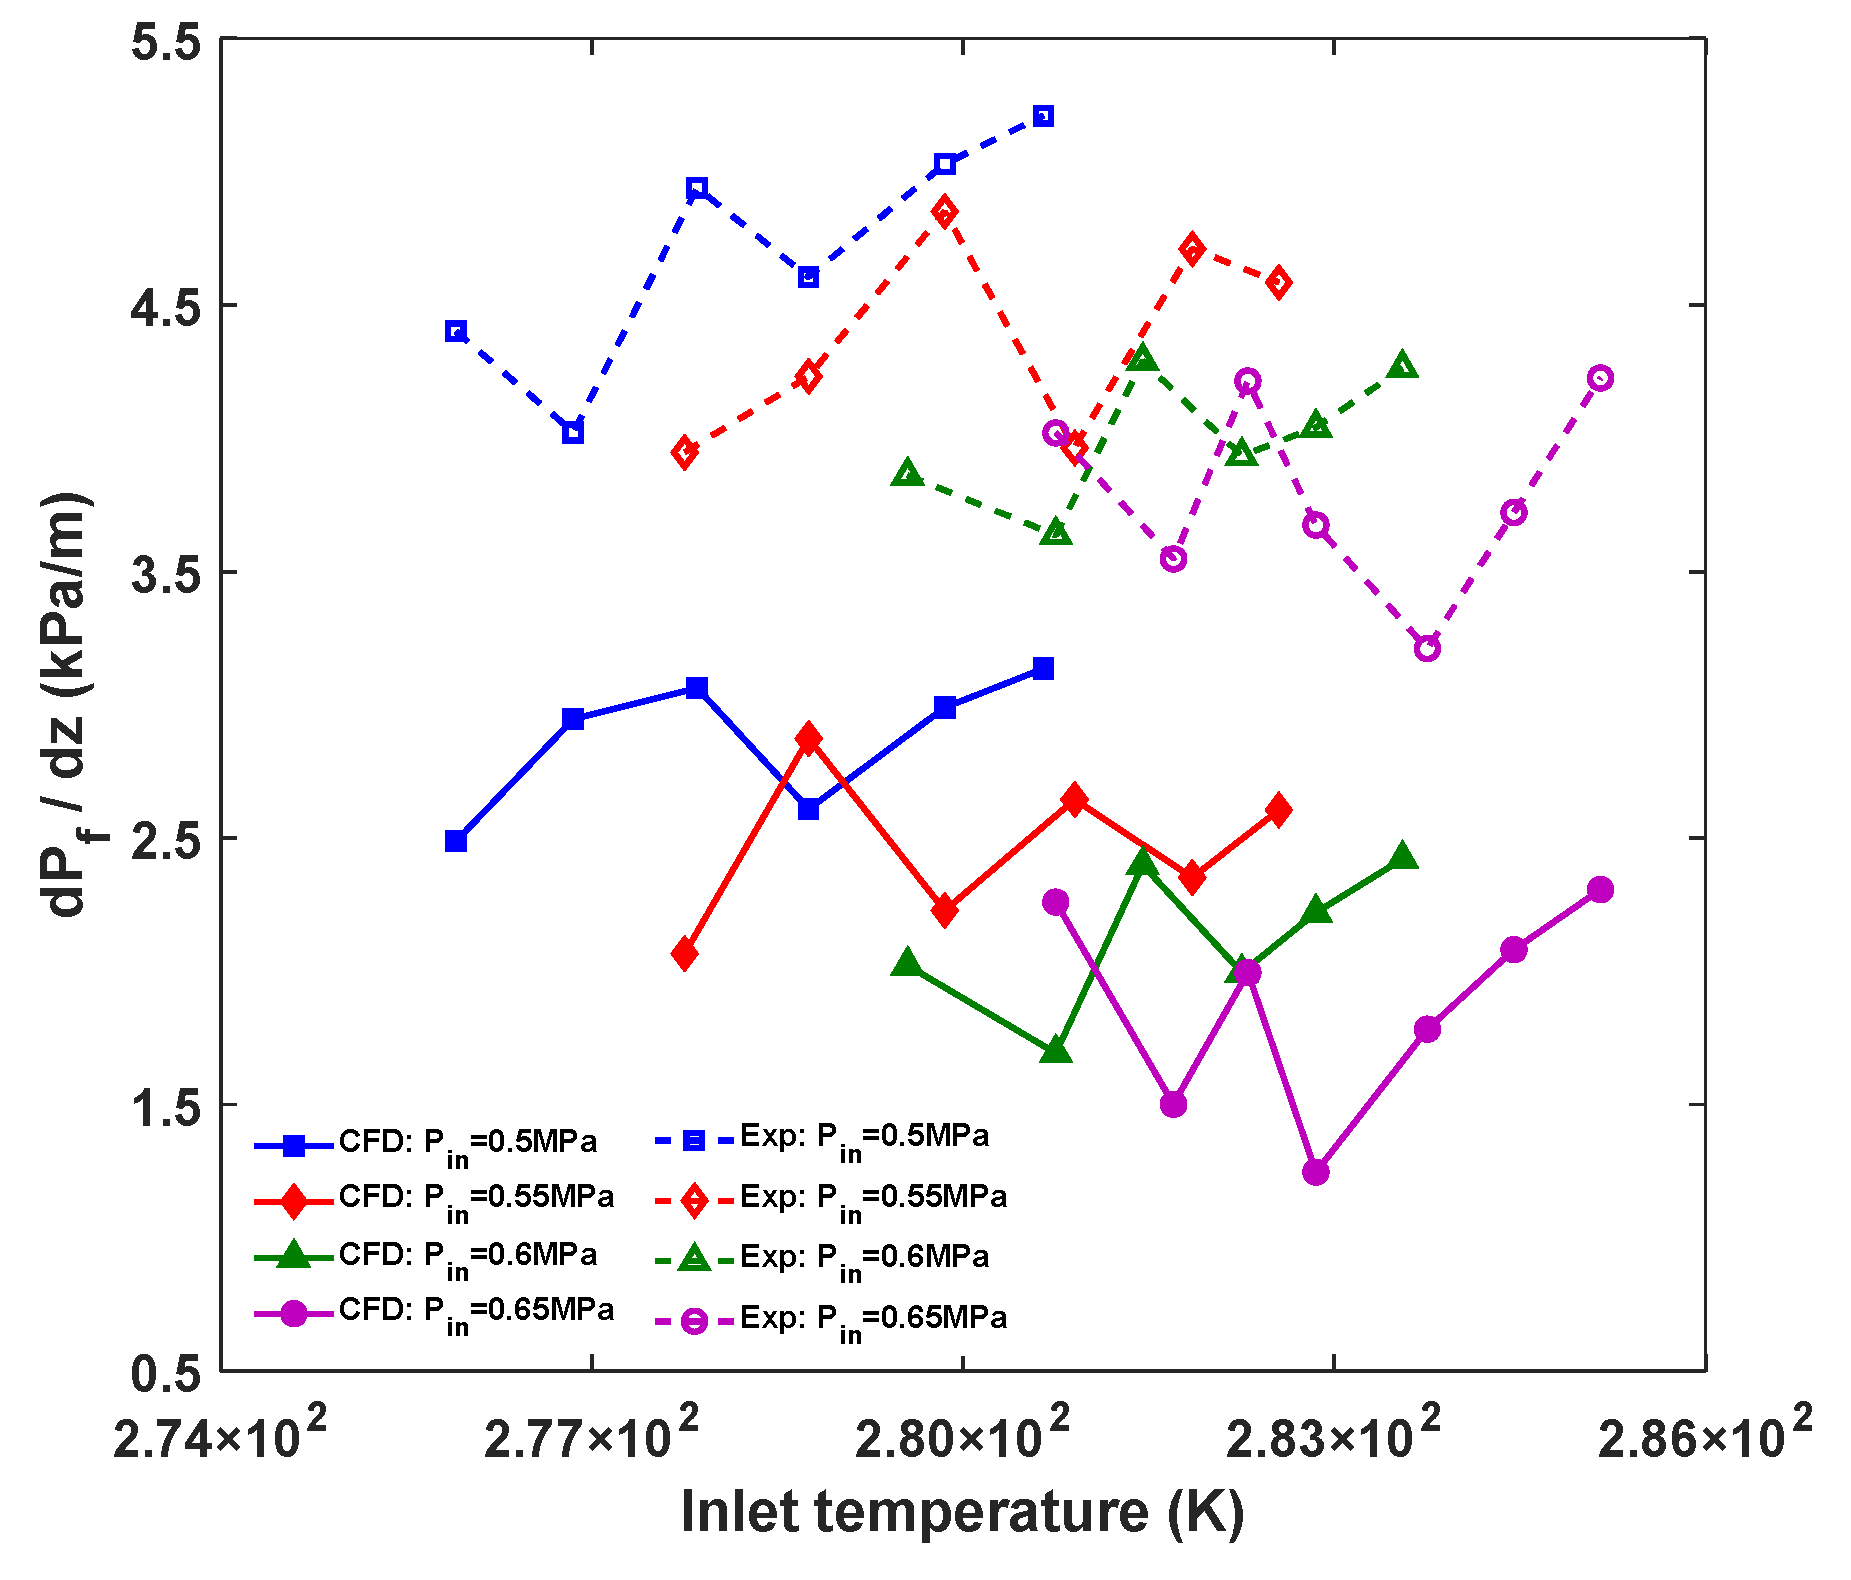
  • The Nusselt number (Nu) and the friction pressure gradient from the experiments and simulations were compared. The values of numerical Nu were higher than those of the experimental Nu, which can be attributed to the error in experimental calculations. The values of the experimental friction pressure gradient were higher than those of the simulation due to the use of an acceptable numerical model.
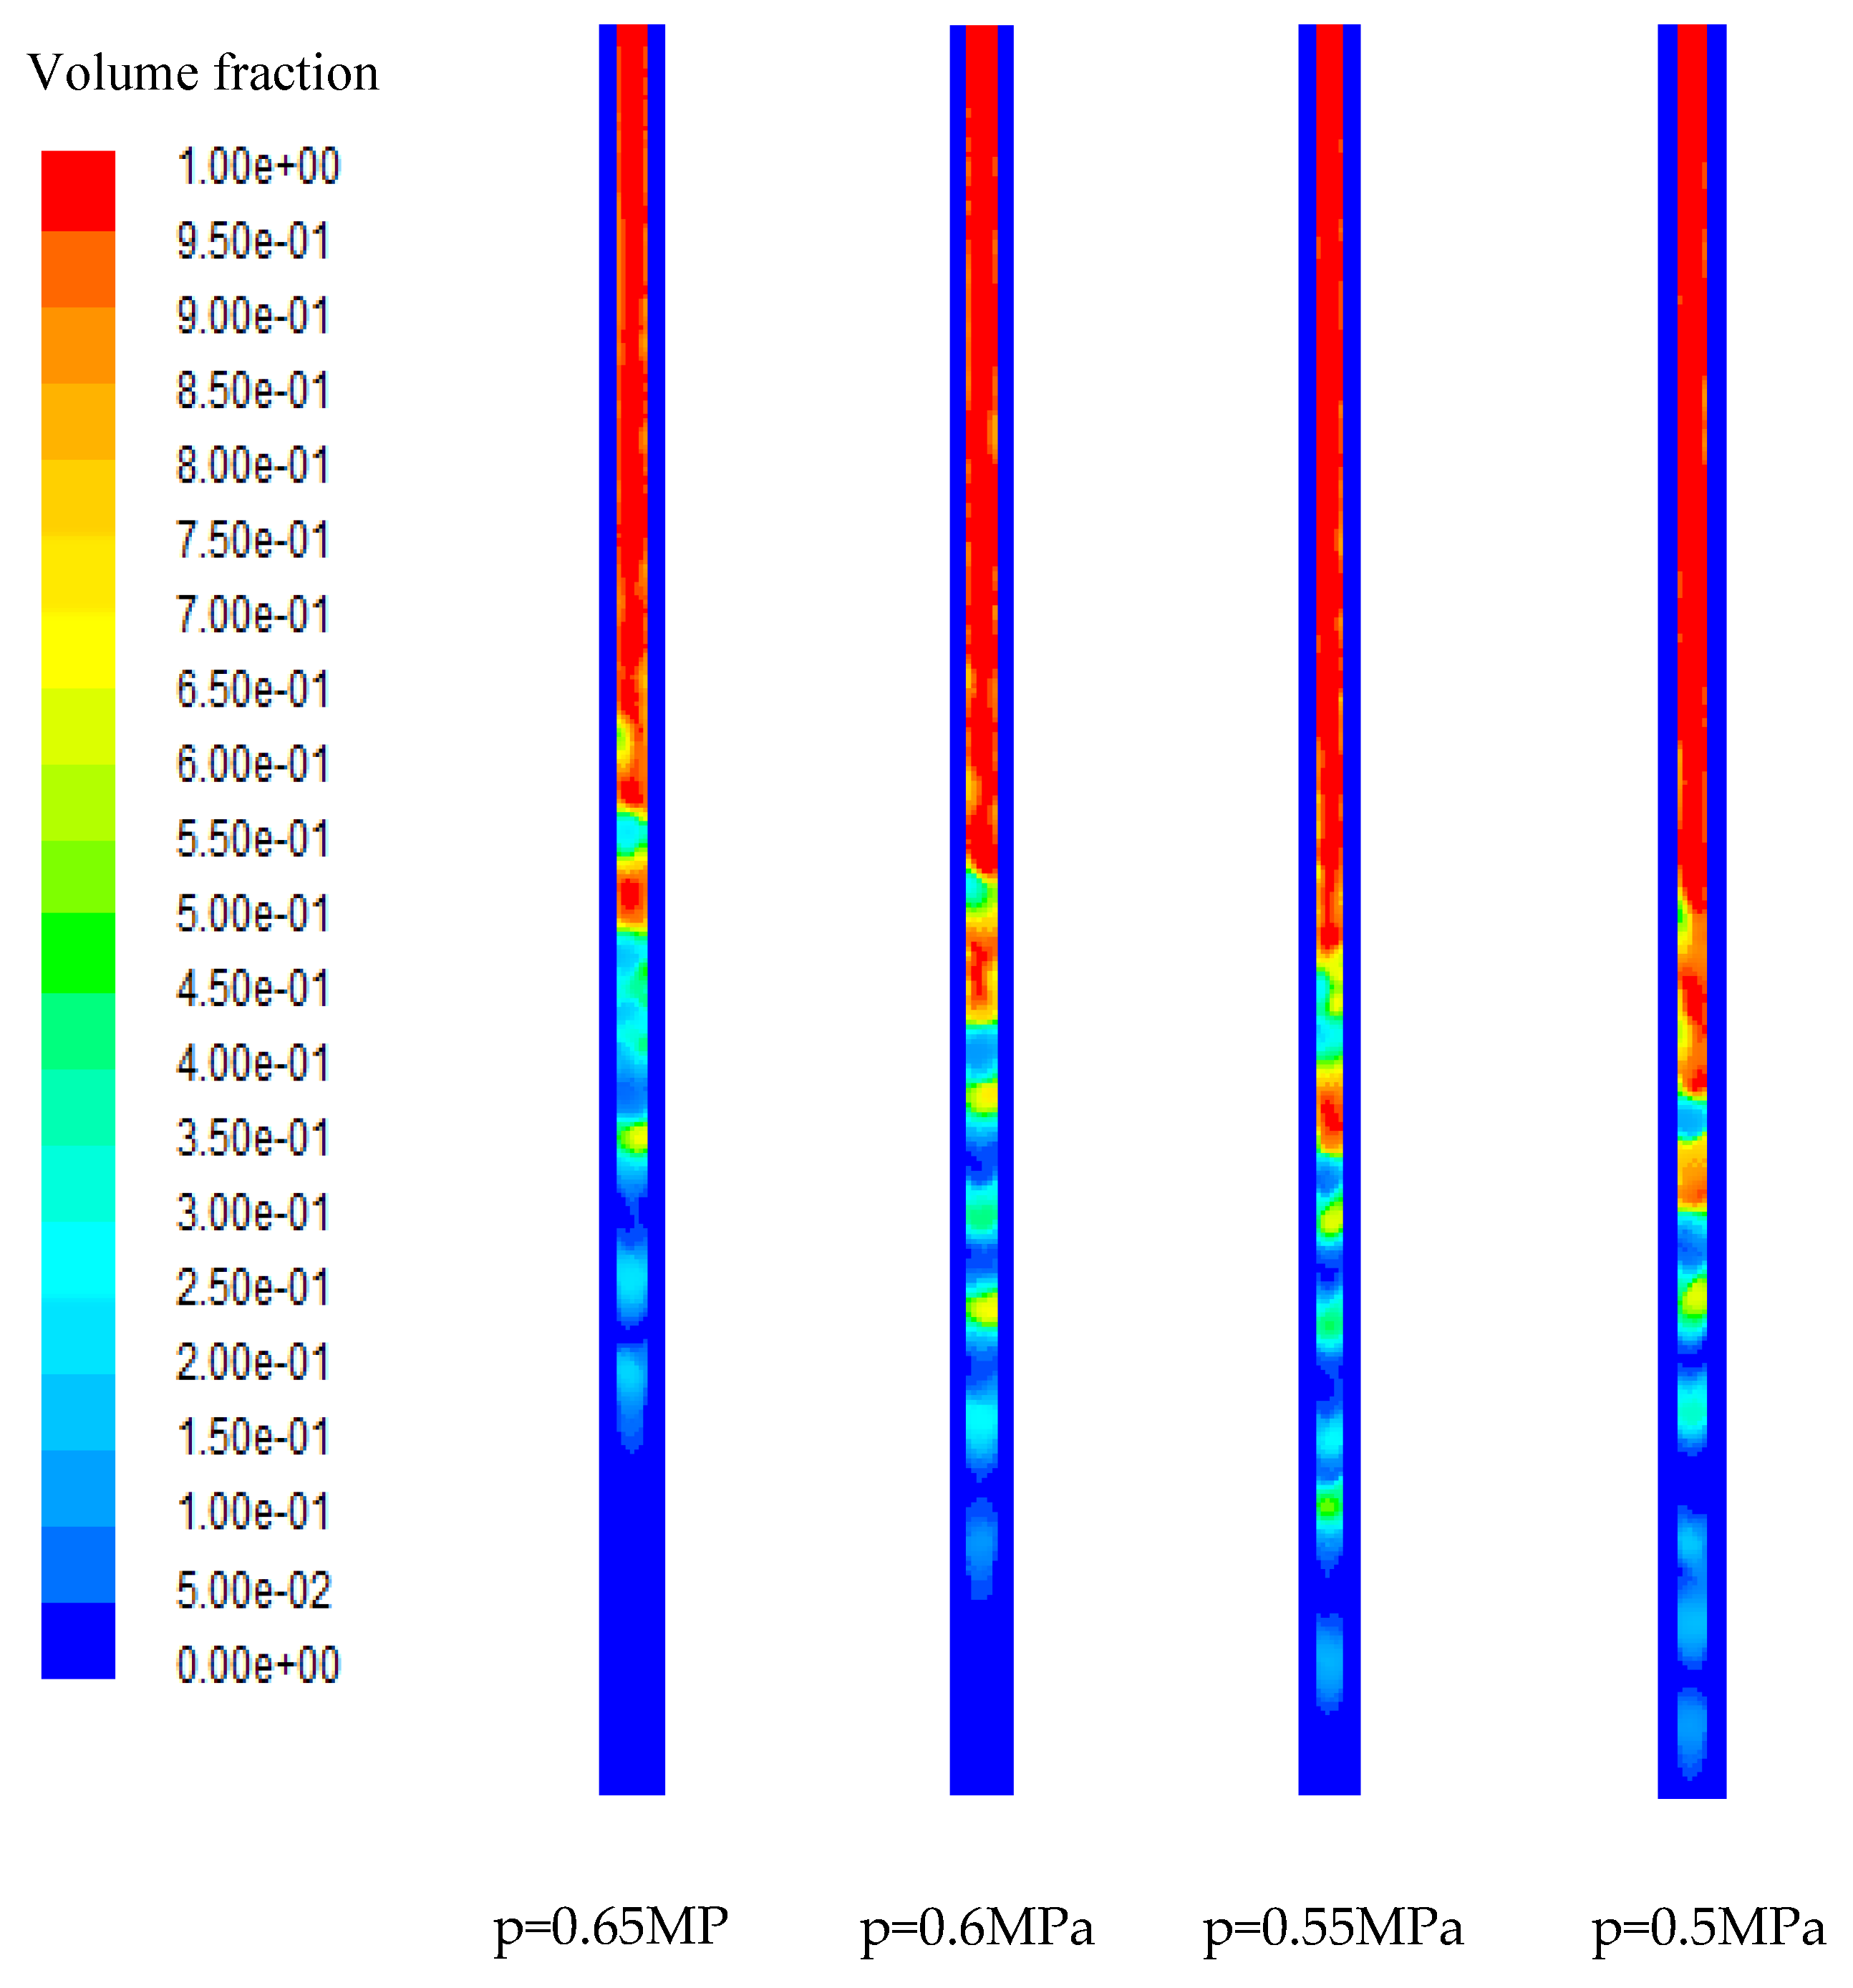
  • The effects of pressure and mass flux on the Nusselt number and the friction pressure gradient were analyzed in depth to explore the underlying mechanism giving the results. Occurring at a lower mass flux, the R22 condensed faster and even subcooled, while at a high mass flux, the R22 was always in the two-phase flow state. As the mass flux increased, the flow regime transformed from intermittent to annular flow. The position of complete condensation was closer to the outlet and the vapor-liquid velocity difference increased with decreasing pressure.

Author Contributions

Formal analysis, data curation and writing-original draft preparation, S.L., Y.Z.; conceptualization, project administration, writing and editing, Z.Z.; methodology and validation, S.L., Y.Z., H.X. and W.Z. All authors have read and agreed to the published version of the manuscript.

Funding

The authors gratefully acknowledge that this work was supported by Jiangsu marine and fishery science and technology innovation and extension project (HY2017-8) and Zhenjiang funds for the key research and development project (GY2016002-1).

Conflicts of Interest

The authors declare no conflict of interest.

Nomenclature

Aheat transfer area ( m 2 )
Dhhydraulic diameter (m)
dpf/dzfriction pressure gradient (kPa m−1)
FSRUthe Floating Storage and Regasification Unit
Gmass flux (kg m−2 s)
Henthalpy (kJ kg−1)
hheat transfer coefficient (W m−2 K−1)
h l v latent heat for liquid-vapor phase change (J kg−1)
kthermal conductivity (W m−1 K−1)
LNGLiquefied Natural Gas
lchannel length (m)
mmass flow rate (kg s−1)
NuNusselt number
PCHEPrinted Circuit Heat Exchanger
PISOPressure-Implicit with Splitting of Operators
ppressure (Pa)
Δ p pressure drop (Pa)
Qheat transfer rate (W)
Rthermal-conduction resistance (m2∙K W−1)
SLSSelected Laser Sintering
Ttemperature (K)
ΔTmlog-mean temperature difference
Uoverall heat transfer coefficient (W m−2 K−1)
UDFUser Defined Function
uvelocity (m s−1)
VOFVolume of Fluid
Greeks
ρ density (kg m−3)
μ dynamic viscosity (kg m−1 s−1)
φ correction factor
σ surface tension (N m−1)
Subscripts
aveaverage
ccold
hhot
lliquid
vvapor
ssaturation
ininlet
outoutlet
wwall
ffrictional
dedeceleration

References

  1. Nikitin, K.; Kato, Y.; Ngo, L. Printed circuit heat exchanger thermal–hydraulic performance in supercritical CO2 experimental loop. Int. J. Refrig. 2006, 29, 807–814. [Google Scholar] [CrossRef]
  2. Chen, M.; Sun, X.; Christensen, R.N.; Shi, S.; Skavdahl, I.; Utgikar, V.; Sabharwall, P. Experimental and numerical study of a printed circuit heat exchanger. Ann. Nucl. Energy 2016, 97, 221–231. [Google Scholar] [CrossRef] [Green Version]
  3. Baek, S.; Kim, J.-H.; Jeong, S.; Jung, J. Development of highly effective cryogenic printed circuit heat exchanger (PCHE) with low axial conduction. Cryogenics 2012, 52, 366–374. [Google Scholar] [CrossRef]
  4. Figley, J.; Sun, X.; Mylavarapu, S.K.; Hajek, B. Numerical study on thermal hydraulic performance of a Printed Circuit Heat Exchanger. Prog. Nucl. Energy 2013, 68, 89–96. [Google Scholar] [CrossRef]
  5. Aneesh, A.; Sharma, A.; Srivastava, A.; Vyas, K.; Chaudhuri, P. Thermal-hydraulic characteristics and performance of 3D straight channel based printed circuit heat exchanger. Appl. Therm. Eng. 2016, 98, 474–482. [Google Scholar] [CrossRef]
  6. Lee, S.-M.; Kim, K.-Y. Comparative study on performance of a zigzag printed circuit heat exchanger with various channel shapes and configurations. Heat Mass Transf. 2013, 49, 1021–1028. [Google Scholar] [CrossRef]
  7. Kim, D.E.; Kim, M.H.; Cha, J.E.; Kim, S.O. Numerical investigation on thermal–hydraulic performance of new printed circuit heat exchanger model. Nucl. Eng. Des. 2008, 238, 3269–3276. [Google Scholar] [CrossRef]
  8. Kim, I.H.; No, H.C. Physical model development and optimal design of PCHE for intermediate heat exchangers in HTGRs. Nucl. Eng. Des. 2012, 243, 243–250. [Google Scholar] [CrossRef]
  9. Ma, T.; Li, L.; Xu, X.-Y.; Chen, Y.-T.; Wang, Q.-W. Study on local thermal–hydraulic performance and optimization of zigzag-type printed circuit heat exchanger at high temperature. Energy Convers. Manag. 2015, 104, 55–66. [Google Scholar] [CrossRef]
  10. Liu, N.; Li, J. Experimental study on condensation heat transfer of R32, R152a and R22 in horizontal minichannels. Appl. Therm. Eng. 2015, 90, 763–773. [Google Scholar] [CrossRef]
  11. Hossain, A.; Onaka, Y.; Miyara, A. Experimental study on condensation heat transfer and pressure drop in horizontal smooth tube for R1234ze(E), R32 and R410A. Int. J. Refrig. 2012, 35, 927–938. [Google Scholar] [CrossRef]
  12. Kim, S.-M.; Mudawar, I. Review of databases and predictive methods for heat transfer in condensing and boiling mini/micro-channel flows. Int. J. Heat Mass Transf. 2014, 77, 627–652. [Google Scholar] [CrossRef]
  13. Kim, S.-M.; Mudawar, I. Review of databases and predictive methods for pressure drop in adiabatic, condensing and boiling mini/micro-channel flows. Int. J. Heat Mass Transf. 2014, 77, 74–97. [Google Scholar] [CrossRef]
  14. Ding, Y.; Jia, L.; Yin, L.; Zhang, Y.; An, Z. Theoretical investigation on convective condensation annular flow of R410a inside rectangular microchannel. Int. J. Heat Mass Transf. 2019, 131, 698–708. [Google Scholar] [CrossRef]
  15. Fronk, B.M.; Garimella, S. Condensation of ammonia and high-temperature-glide ammonia/water zeotropic mixtures in minichannels—Part I: Measurements. Int. J. Heat Mass Transf. 2016, 101, 1343–1356. [Google Scholar] [CrossRef]
  16. Fronk, B.M.; Garimella, S. Condensation of ammonia and high-temperature-glide zeotropic ammonia/water mixtures in minichannels2014 Part II: Heat transfer models. Int. J. Heat Mass Transf. 2016, 101, 1357–1373. [Google Scholar] [CrossRef]
  17. Park, J.; Vakili-Farahani, F.; Consolini, L.; Thome, J. Experimental study on condensation heat transfer in vertical minichannels for new refrigerant R1234ze(E) versus R134a and R236fa. Exp. Therm. Fluid Sci. 2011, 35, 442–454. [Google Scholar] [CrossRef]
  18. Del Col, D.; Torresin, D.; Cavallini, A. Heat transfer and pressure drop during condensation of the low GWP refrigerant R1234yf. Int. J. Refrig. 2010, 33, 1307–1318. [Google Scholar] [CrossRef]
  19. Del Col, D.; Bortolin, S.; Cavallini, A.; Matkovič, M. Effect of cross sectional shape during condensation in a single square minichannel. Int. J. Heat Mass Transf. 2011, 54, 3909–3920. [Google Scholar] [CrossRef]
  20. Zhao, Z.; Zhang, X.; Zhao, K.; Jiang, P.; Chen, Y. Numerical investigation on heat transfer and flow characteristics of supercritical nitrogen in a straight channel of printed circuit heat exchanger. Appl. Therm. Eng. 2017, 126, 717–729. [Google Scholar] [CrossRef]
  21. Zhao, Z.; Zhou, Y.; Ma, X.; Chen, X.; Li, S.; Yang, S. Numerical Study on Thermal Hydraulic Performance of Supercritical LNG in Zigzag-Type Channel PCHEs. Energies 2019, 12, 548. [Google Scholar] [CrossRef] [Green Version]
  22. Zhao, Z.; Zhou, Y.; Ma, X.; Chen, X.; Li, S.; Yang, S. Effect of Different Zigzag Channel Shapes of PCHEs on Heat Transfer Performance of Supercritical LNG. Energies 2019, 12, 2085. [Google Scholar] [CrossRef] [Green Version]
  23. Zhao, Z.; Zhang, Y.; Chen, X.; Ma, X.; Yang, S.; Li, S. Experimental and numerical investigation of thermal-hydraulic performance of supercritical nitrogen in airfoil fin printed circuit heat exchanger. Appl. Therm. Eng. 2020, 168, 114829. [Google Scholar] [CrossRef]
  24. Zhao, Z.; Zhang, Y.; Chen, X.; Ma, X.; Yang, S.; Li, S. A numerical study on condensation flow and heat transfer of refrigerant in minichannels of printed circuit heat exchanger. Int. J. Refrig. 2019, 102, 96–111. [Google Scholar] [CrossRef]
  25. Yoon, S.-J.; Sabharwall, P.; Kim, E.-S. Numerical study on crossflow printed circuit heat exchanger for advanced small modular reactors. Int. J. Heat Mass Transf. 2014, 70, 250–263. [Google Scholar] [CrossRef]
  26. Kim, S.-M.; Mudawar, I. Universal approach to predicting two-phase frictional pressure drop for adiabatic and condensing mini/micro-channel flows. Int. J. Heat Mass Transf. 2012, 55, 3246–3261. [Google Scholar] [CrossRef]
  27. Lemmon, E.W.; Huber, M.L.; Mclinden, M.O. NIST Reference Fluid Properties. NIST NSRDS 2007. [Google Scholar]
  28. Kim, S.-M.; Mudawar, I. Flow condensation in parallel micro-channels? Part 2: Heat transfer results and correlation technique. Int. J. Heat Mass Transf. 2012, 55, 984–994. [Google Scholar] [CrossRef]
  29. Al-Zaidi, A.; Mahmoud, M.M.; Karayiannis, T.G. Condensation flow patterns and heat transfer in horizontal microchannels. Exp. Therm. Fluid Sci. 2018, 90, 153–173. [Google Scholar] [CrossRef]
  30. Al Hajri, E.; Shooshtari, A.; Dessiatoun, S.; Ohadi, M.M. Performance characterization of R134a and R245fa in a high aspect ratio microchannel condenser. Int. J. Refrig. 2013, 36, 588–600. [Google Scholar] [CrossRef]
  31. Liu, N.; Xiao, H.; Li, J. Experimental investigation of condensation heat transfer and pressure drop of propane, R1234ze(E) and R22 in minichannels. Appl. Therm. Eng. 2016, 102, 63–72. [Google Scholar] [CrossRef]
  32. Cavallini, A.; Censi, G.; Del Col, D.; Doretti, L.; Longo, G.; Rossetto, L. Experimental investigation on condensation heat transfer and pressure drop of new HFC refrigerants (R134a, R125, R32, R410A, R236ea) in a horizontal smooth tube. Int. J. Refrig. 2001, 24, 73–87. [Google Scholar] [CrossRef]
  33. ANSYS, Inc. FLUENT 14.0 User’s Guide; ANSYS, Inc.: Canonsburg, PA, USA, 2011. [Google Scholar]
  34. Kim, I.H.; No, H.C. Thermal–hydraulic physical models for a Printed Circuit Heat Exchanger covering He, He–CO2 mixture, and water fluids using experimental data and CFD. Exp. Therm. Fluid Sci. 2013, 48, 213–221. [Google Scholar] [CrossRef]
  35. Huang, M.; Yang, Z.; Duan, Y.-Y.; Lee, D.S. Bubble growth for boiling bubbly flow for R141b in a serpentine tube. J. Taiwan Inst. Chem. Eng. 2011, 42, 727–734. [Google Scholar] [CrossRef]
Figure 1. Photo of the experimental rig.
Energies 13 06589 g001
Figure 2. The tested Printed Circuit Heat Exchanger (PCHE) with diagram of the core structure.
Energies 13 06589 g002
Figure 3. The outlet temperature of the R22 versus the inlet temperature under a diverse mass flux for p = 0.65 MPa.
Energies 13 06589 g003
Figure 4. Pressure drop of the R22 versus the average temperature under different mass flux for p = 0.65 MPa.
Energies 13 06589 g004
Figure 5. Heat transfer coefficient of the R22 versus the average temperature under different mass flux for p = 0.65 MPa.
Energies 13 06589 g005
Figure 6. Pressure drop of the R22 versus the average temperature under different pressures for G = 10.52 kg   m 2 s 1 .
Energies 13 06589 g006
Figure 7. Heat transfer coefficient of the R22 versus the average temperature under different pressures for G = 10.52 kg   m 2 s 1 .
Energies 13 06589 g007
Figure 8. Numerical model and boundary conditions.
Energies 13 06589 g008
Figure 9. Sectional view of the mesh for computational model.
Energies 13 06589 g009
Figure 10. Deviations between the numerical and experimental outlet temperatures.
Energies 13 06589 g010
Figure 11. Deviations between the numerical and experimental pressure drops.
Energies 13 06589 g011
Figure 12. Contrast of the experimental Nusselt number (Nu) and numerical Nu versus the inlet temperature for different mass flux values and p = 0.65 MPa.
Energies 13 06589 g012
Figure 13. Flow patterns for different mass flux values and p = 0.65 MPa.
Energies 13 06589 g013
Figure 14. Comparison of the experimental dp f / dz and numerical dp f / dz versus the inlet temperature for different mass flux values and p = 0.65 MPa.
Energies 13 06589 g014
Figure 15. Comparison of the experimental Nusselt number (Nu) and numerical Nu versus the inlet temperature for different pressures at G = 10.52 kg   m 2 s 1 .
Energies 13 06589 g015
Figure 16. Flow patterns for different pressures and G = 10.52 kg   m 2 s 1 .
Energies 13 06589 g016
Figure 17. Comparison of the experimental dp f / dz and numerical dp f / dz versus the inlet temperature for different pressures and G = 10.52 kg   m 2 s 1 .
Energies 13 06589 g017
Table 1. Printed Circuit Heat Exchanger (PCHE) channel geometry.
Number of ChannelsChannel Geometry (mm)Heat Transfer Area (m2)
Hydraulic DiameterActive Length
Hot side (R22)29880.91500.5761
Cold side (liquid N2)4750.83894000.5725
Table 2. Thermo-physical properties of the R22 under different pressures.
P
(MPa)
T s ( K ) ρ l   ( kg   m 3 ) ρ v   ( k g   m 3 ) k l ( mW m 1 K 1 ) k v ( mW m 1 K 1 ) μ l
( μ P a   s )
μ v
( μ P a   s )
h l v   ( k J   k g 1 ) σ   ( m N   m 1 )
0.5273.271281.121.31294.6879.4158215.6911.369204.9511.679
0.55276.241270.923.37993.3539.6181208.8311.495202.5311.237
0.6279.011261.325.45192.1089.8122202.6311.615200.2310.827
0.65281.611252.227.53090.9389.9997196.9711.73198.0210.444
Publisher’s Note: MDPI stays neutral with regard to jurisdictional claims in published maps and institutional affiliations.

