Article

Algorithm for Reducing Truck Noise on Via Baltica Transport Corridors in Lithuania

by
Kristina Čižiūnienė
1,
Jonas Matijošius
2,
Audrius Čereška
3,* and
Artūras Petraška
1
1
Department of Logistics and Transport Management, Vilnius Gediminas Technical University, Plytinės Str. 27, LT-10105 Vilnius, Lithuania
2
Institute of Mechanical Science, Vilnius Gediminas Technical University, J. Basanavičiaus Str. 28, LT-03224 Vilnius, Lithuania
3
Department of Mechanical and Material Engineering, Vilnius Gediminas Technical University, J. Basanavičiaus Str. 28, LT-03224 Vilnius, Lithuania
*
Author to whom correspondence should be addressed.
Energies 2020, 13(24), 6475; https://doi.org/10.3390/en13246475
Submission received: 20 October 2020 / Revised: 3 December 2020 / Accepted: 4 December 2020 / Published: 8 December 2020

Abstract

:
The section of Via Baltica going through the territory of the Republic of Lithuania is the most traffic intensive land logistics corridor in the country. The annual transportation volume has been increasing on this road; thus, the reduction of pollution caused by vehicles has become important. If gas emissions are regulated, and carriers have to pay pollution taxes, this does not apply to noise levels. The article presents the traffic intensity in this logistics corridor, measurements of the noise level at the characteristic points, its relation to the number of vehicles passing through it and an expert evaluation of proposed methods for noise energy reduction. Environmental noise is an unwanted or harmful sound that propagates in terms of both duration and geographical coverage. Noise is associated with many human activities, but road, rail and air traffic noises have the greatest impact. Due to irrationally arranged transport network, the transit flow of freight transport crosses residential areas of the city, places of rest and recreation of the population, causing high noise levels in adjacent areas. This is the biggest problem for the urban environment. Environmental noise affects many Europeans and is therefore considered by society to be one of the biggest environmental problems. This article presents an assessment of a new traffic noise algorithm. The presented expert survey on noise energy reduction allows choosing the most appropriate method for reducing noise energy in Via Baltica transport logistics corridor. Based on the expert survey, a hierarchical table for noise energy reduction was compiled. It will allow assessing the validity of individual noise energy reduction solutions. It has become relevant for improving infrastructure of other transport corridors and choosing the most appropriate solutions to reduce vehicle noise pollution. A further application of this model can be focused on economic evaluation, forecasting of expected benefits and so on.

1. Introduction

With the development of the economy, freight transportation volumes have been constantly increasing, thus leading to the need to continuously search for methods to reduce their price and to choose the optimal method of transportation in a specific situation [1]. In terms of its geographic location, Lithuania is set out between the European transport logistics corridors both in the west–east and north–south directions. Traffic flow is very intensive in these directions [2]. Figure 1 illustrates passenger and freight transport flows. Thus, fully exploiting these aspects to increase the efficiency of the transportation process is very important [3,4]. The well-developed land road network allows quickly directing the freight flow in the right direction and delivering freight to any part of the country. Compared to other modes of transport, this is the most affordable and well-developed mode of transport with prospects of further development [5,6].
Transport corridors have been developed in Europe not only to improve transport opportunities [7], but also to develop a sustainable approach to the development of the transport sector itself [8]. The latest trends of having traffic flow carrying out the functions of communication [9] and freight transportation comprehensively integrated into the road infrastructure, which would ensure sustainable existence of the road-vehicle system, have been taken into account [10]. Such a symbiotic relationship is possible under several essential conditions: integrated monitoring systems [11], which are rapidly developed nowadays [12], given the expanding technological development of such systems and engineering-technological measures [13] that allow ensuring declarative requirements of European Union (EU) directives on rational use of resources and environmental standards [14]. Such development of transport corridors is essential in pursuit of sustainable interoperability of supply chains, the development of the intermodal transport sector and the implementation of sustainable transport not only globally anywhere in the world, but also at a local level, focusing on regional market development [15], which is in line with the universally accepted “just in time” concept [16]. Not only global transport corridors, which can offer massive flows of freight and passengers, but also local-regional transport corridors [17], the main goal of which is smooth distribution of freight and passenger flows in the region, have become increasingly important [18]. Smooth development of regions is one of the key priorities of the EU’s economic activity, which allows ensuring sustainable economic growth of regions focused on the specifics of the region itself [19]. Via Baltica transport corridor plays this role in Lithuania, and its specifics have been determined by Lithuania’s geographical location [20]. This corridor ensures rapid movement of freight and passengers in the Baltic States (Lithuania, Latvia and Estonia) from south to north, also acting as a connecting link between the EU and Eastern markets from east to west. The location of this corridor gives an impetus for increasing freight and passenger flows [21]. However, the current situation is more focused on road transportation, although it is worth noting that the East–West Transport Corridor II (going from east to west) and the RailBaltica (going from the south to north) rail projects are also developing very rapidly [22]. Thus, Via Baltica transport corridor has become highly promising, given the existing infrastructure, investment and the created prospects for the future [23]. It is a great example of sustainable and growing development and investment in other regions of Europe and the world [24]. Of course, it is important to mention that having identified the existing benefits of such a transport corridor, addressing problems related to its operation, the most important of which is pollution reduction, becomes necessary [25]. The specifics of the transport corridor offers the simplest solutions related to infrastructure changes that determine the level of pollution in the transport corridor itself [26]. The projected development of transport is currently more focused on autonomous non-polluting vehicles [27]. Of course, no traffic will dramatically change fast [28], but trends for the upcoming decades are clear—the number of air-polluting vehicles will decrease [29]. Another type of pollution, namely, acoustic pollution, is becoming very important, and will dominate in the future [30]. Therefore, the development of infrastructure of Via Baltica transport corridor requires choosing measures to ensure the reduction of this type of pollution. Freight transport generates the highest pollution levels in transport logistics corridors [31]. Usually, when talking about pollution, we focus on air pollution—the reduction whereof has received the most attention [32]. New environmentally-friendly vehicles are being developed, continuously making emissions requirements more stringent [33], companies pay pollution taxes, etc., understanding that the level of this pollution is the highest and respective measures for putting it under control are necessary [25,34,35]. Noise pollution in logistics corridors should also receive due attention [36,37]. This type of pollution also has a huge impact on the environment and the quality of life of people living next to it; vibrations caused thereby directly affect the elements of the road infrastructure, including bridges, viaducts, adjacent buildings and others [29,38]. To this end, noise barriers are now being built to protect residents living near the road against noise, but no other alternatives to protection against noise have been considered, disregarding complex solutions to this problem combining various noise reduction measures [39,40].
Several aspects for the selection of noise reduction measures have also been distinguished, including the drafting of documentation which allows successfully implementing the planned measures [41]; compatibility of infrastructure with infrastructure of cities adjacent to the transport corridor [42]; assessment of environmental risk factors [14]; and the impact of infrastructure elements [43] themselves (exits, roundabouts, pedestrian crossings, etc.) on noise levels [44].
For many years, noise has been known to have an adverse effect on human health, also adversely affecting the surrounding environment [45,46,47]. Noise is defined as undesirable or harmful sound from the outside, spreading in terms of both duration and geographic coverage. The volume of noise depends on traffic intensity. With the expansion of transport infrastructure, environmental noise also increases [48,49].
Increased vehicle traffic leads to noise levels exceeding the permissible limits, thus causing harm to people’s health [50]. The latest research states that noise poses a higher risk to human health when it is 65 dBA during the day and 55 dBA at night. Noise can have both physical and psychological effects, disturbing such basic everyday human activities as sleep, rest, education and communication [51]. Noise has an adverse effect on the entire body and hearing in particular [52,53]. The effects of noise on the human body can be divided into specific and non-specific [54]. Specific effects include [55]: 1. Acoustic trauma caused by short-term exposure to high-intensity noise. In such a case, the sound pressure is so high that the eardrum perforates and the sound energy in the inner ear causes severe mechanical damage, including effusion of blood in the inner ear and irreversible damage to hearing nerve receptors; 2. listening fatigue, which is a temporary decrease in hearing sensitivity that develops over a long period of time (hours or days) under intense noise; 3. noise-induced hearing loss, when a person stops hearing high-frequency sounds only, and thus does not feel the hearing loss yet. As noise continues, the disease progresses, and the person also stops hearing medium and low frequency sounds, leading to a hearing impairment and a partial or total hearing loss [56].
Noisy environment is annoying, leading to fatigues, poor attention, exhausted nervous system and serious health disorders, including mental and psychological problems [57,58,59].
National surveys show that residents of the majority of European countries have been increasingly complaining about environmental noise [60]. Environmental noise affects many Europeans, and is therefore considered by the society to be one of the biggest environmental problems [59]. It can harm people both physically and psychologically by interfering with 14 of their main activities, including sleep, rest, learning and communication [61].
According to forecasts, in the upcoming 20–25, traffic intensity will cause noise levels to increase by an average of 0.5–1 dBA per year in the major cities of Central and Eastern Europe. If no noise reduction measures are taken, an increase of traffic flow of 25% will result in 1 dBA noise level increase. This threat is likely to further increase with increasing freight volumes—the more freight is carried by road transport, the greater the noise pollution will be [62].
The use of electric vehicles is one of options for reducing noise levels [63]. The development of electric vehicles has allowed reducing noise levels, but it cannot be eliminated altogether. Noise depends mainly on the average speed of traffic [64], the road surface [65], the driving style and ambient air conditions [66,67]. When using electric buses in Germany at high and low speeds, the difference in noise levels was 14 dB (A) [68]. The most effective measure, according to the example of the city of Gothenburg (Sweden), was choosing low-noise tires and road surfaces to reduce noise. However, it should be noted that these measures have been used on well-developed road infrastructure, and the improvement and development of such infrastructure contributes to noise reduction the most [69].
Obviously, the decision-making process itself becomes very complex and requires a specific algorithm to achieve the best result in assessing the current level of infrastructure development [70]. On the other hand, factors reflecting the economic and political situation of the country [71] and a comprehensive multi-criteria assessment [72] are also becoming important. The latter is only possible when there is a large statistical database which allows properly making cost-effective decisions. However, assessing all the factors together is very difficult [63]; thus, expert evaluation is usually used. This allows making competent decisions using expert knowledge and experience, as they have a deeper understanding of the specifics of use of the existing object. The problem of the article—the adverse impact of transport noise on the environment in Via Baltica logistics transport corridor—and its object, which is a search for ways to reduce freight transport noise levels, were developed in light of a threat to the public and the environment.
The main goal—to identify the most suitable methods for solving noise-related problems in Via Baltica transport logistics corridor in application of the expert survey method—was set to reveal the relevance of the topic of the Article.

2. Materials and Methods

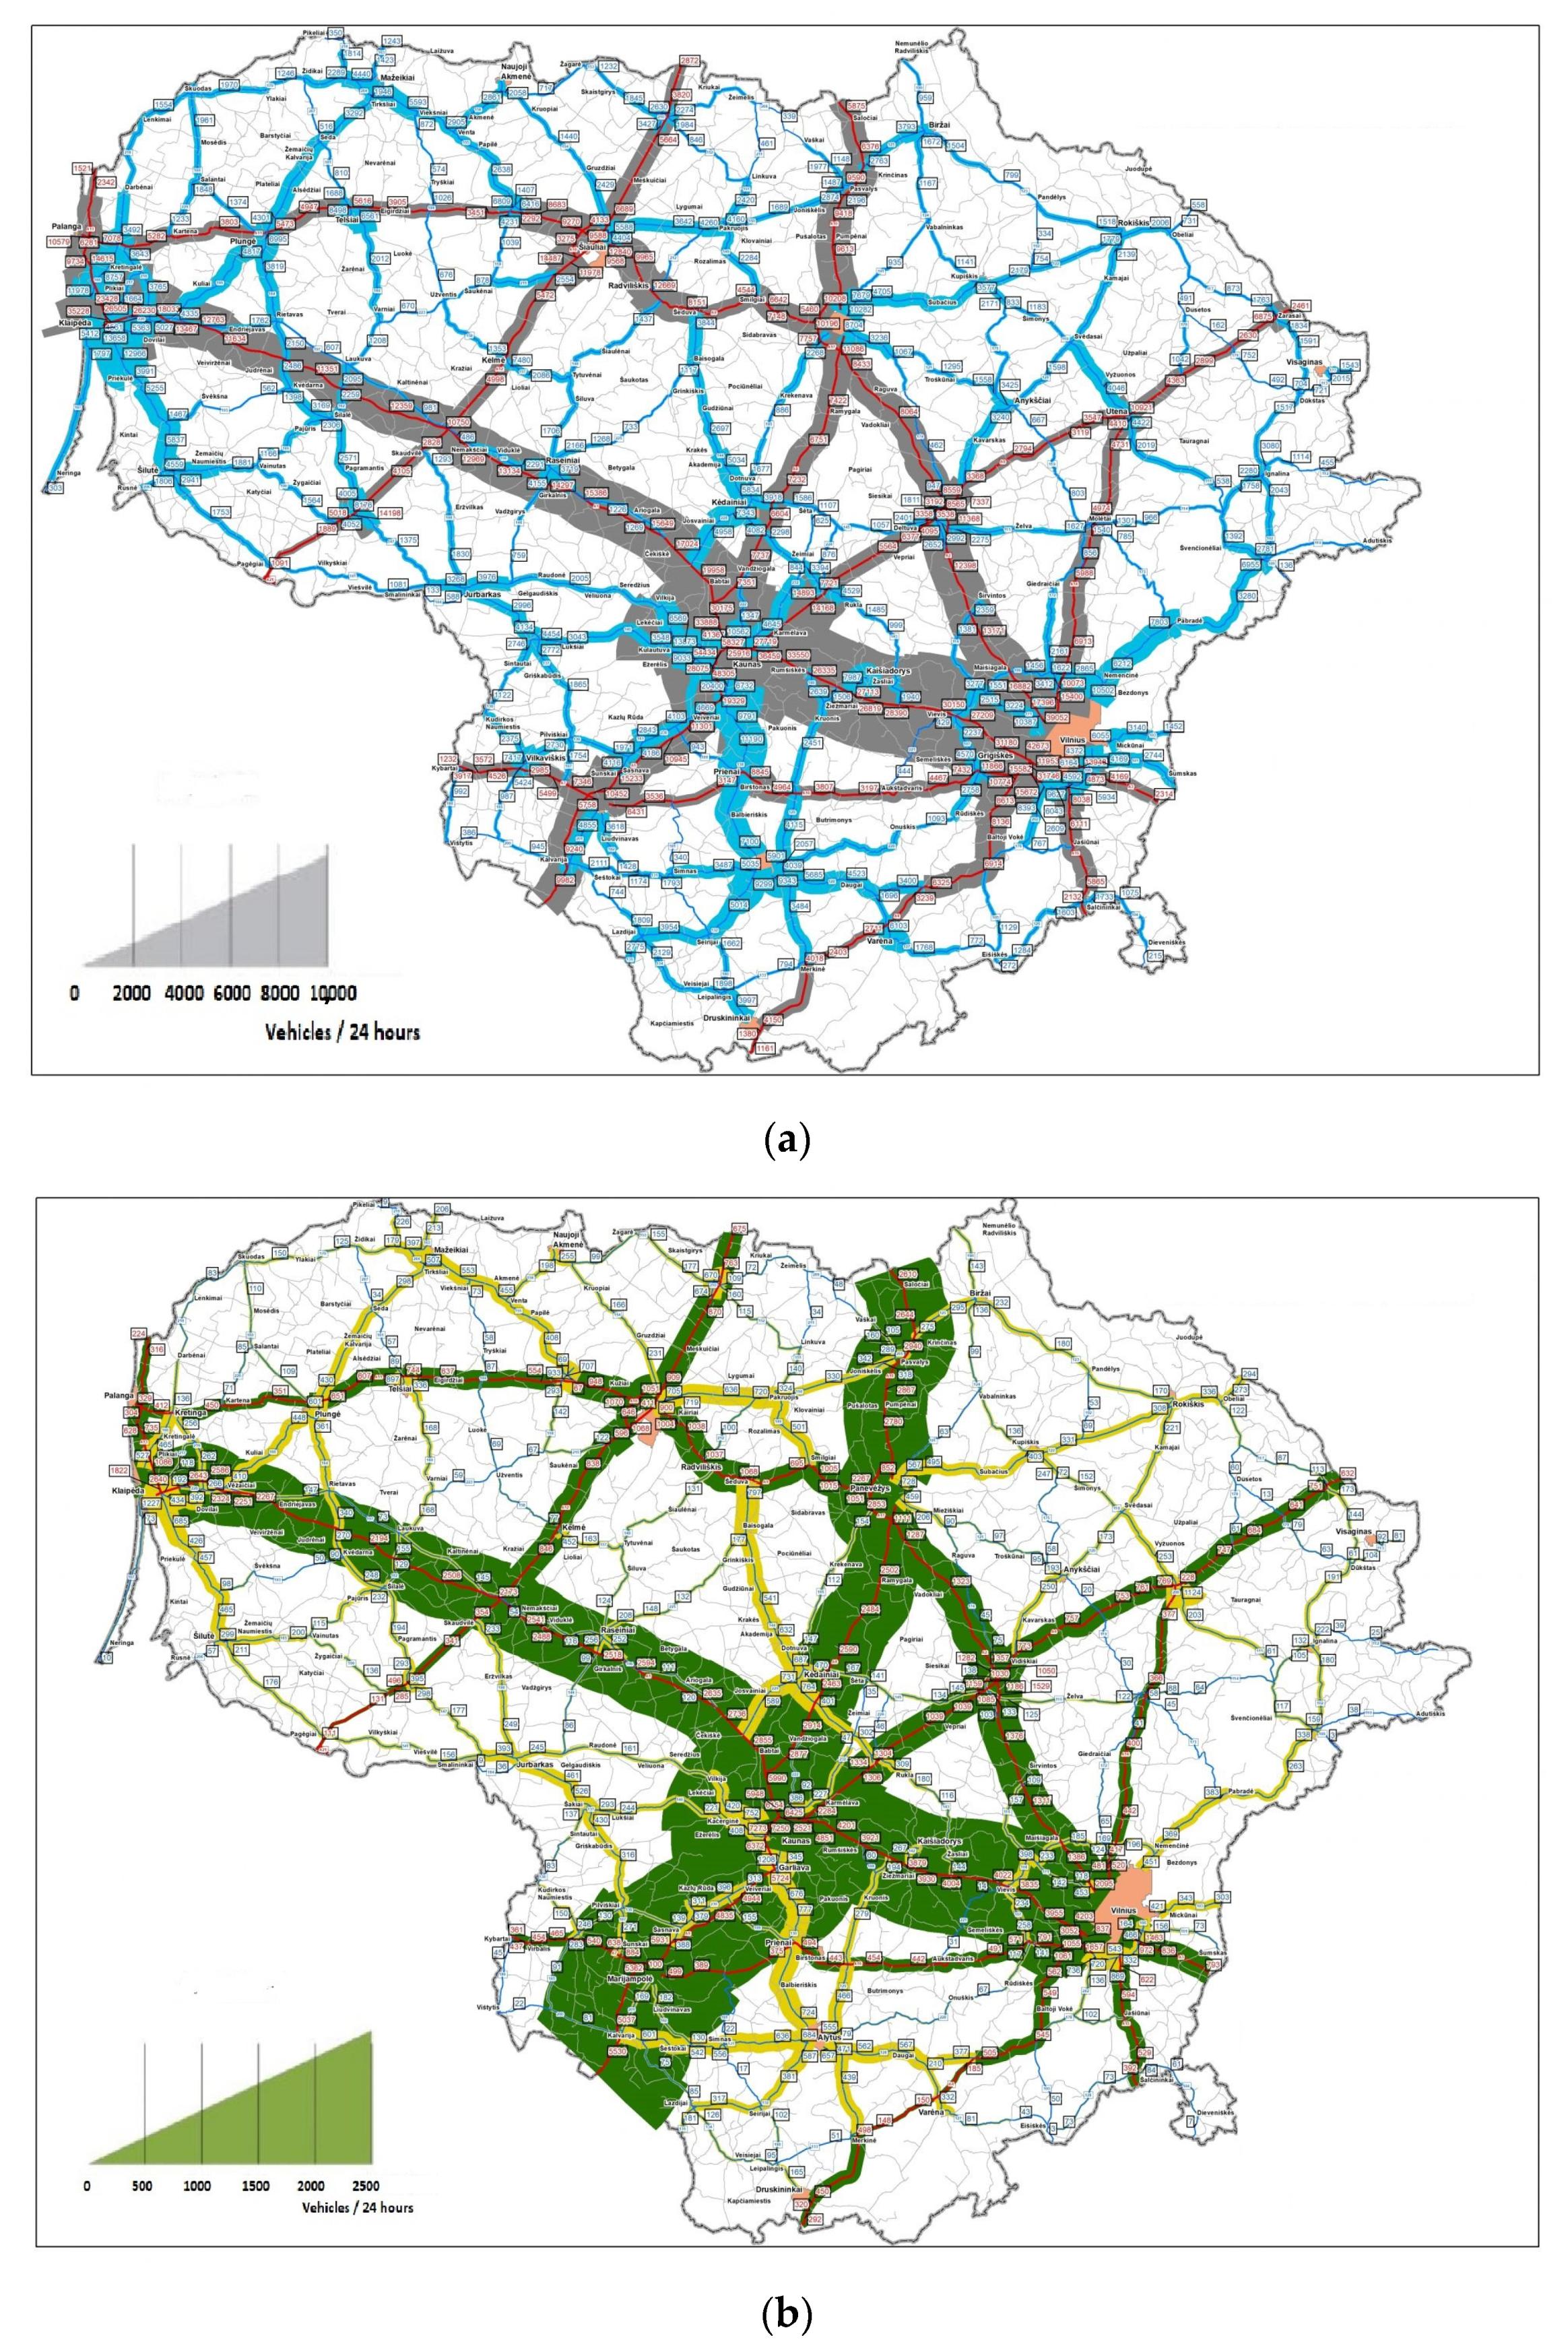
2.1. Substantiation of the Selection of the Transport Logistics Corridor

Road transport noise is an external sound hazardous to humans, which forms in presence of high intensity vehicle traffic. Via Baltica cross-border transport corridor passing through the territory of Lithuania is considered one of the most intensive road sections (Figure 1) which freight vehicles use for transit and local freight carriage (Figure 2). Figure 2 illustrates the scale of heavy transport in Via Baltica corridor (marked in green, emphasizing that the higher the traffic, the wider the marking line), comparing it with the total traffic in the corridor (Figure 1, marked in grey) [73].The presented diagram (Figure 1a) allows stating that the number of vehicles passing through Via Baltica cross-border transport corridor and the percentage share of freight vehicles in the overall traffic flow has been increasing each year; it decreased in 2009 alone due to the economic crisis. Lately, the total number of vehicles increased by 4.5% and the number of freight vehicles grew by 7.3% compared to 2012. The percentage share of freight transport in the total traffic flow reveals that freight vehicles account for more than a half of vehicles going in this transport corridor (Figure 1b and Figure 2) [73].
Thus, this particular cross-border transport logistics corridor was chosen for the research in order to determine if noise disseminated by intensive movement of road vehicles does not exceed the permissible noise level and identify the factors that determine the noise pollution level.

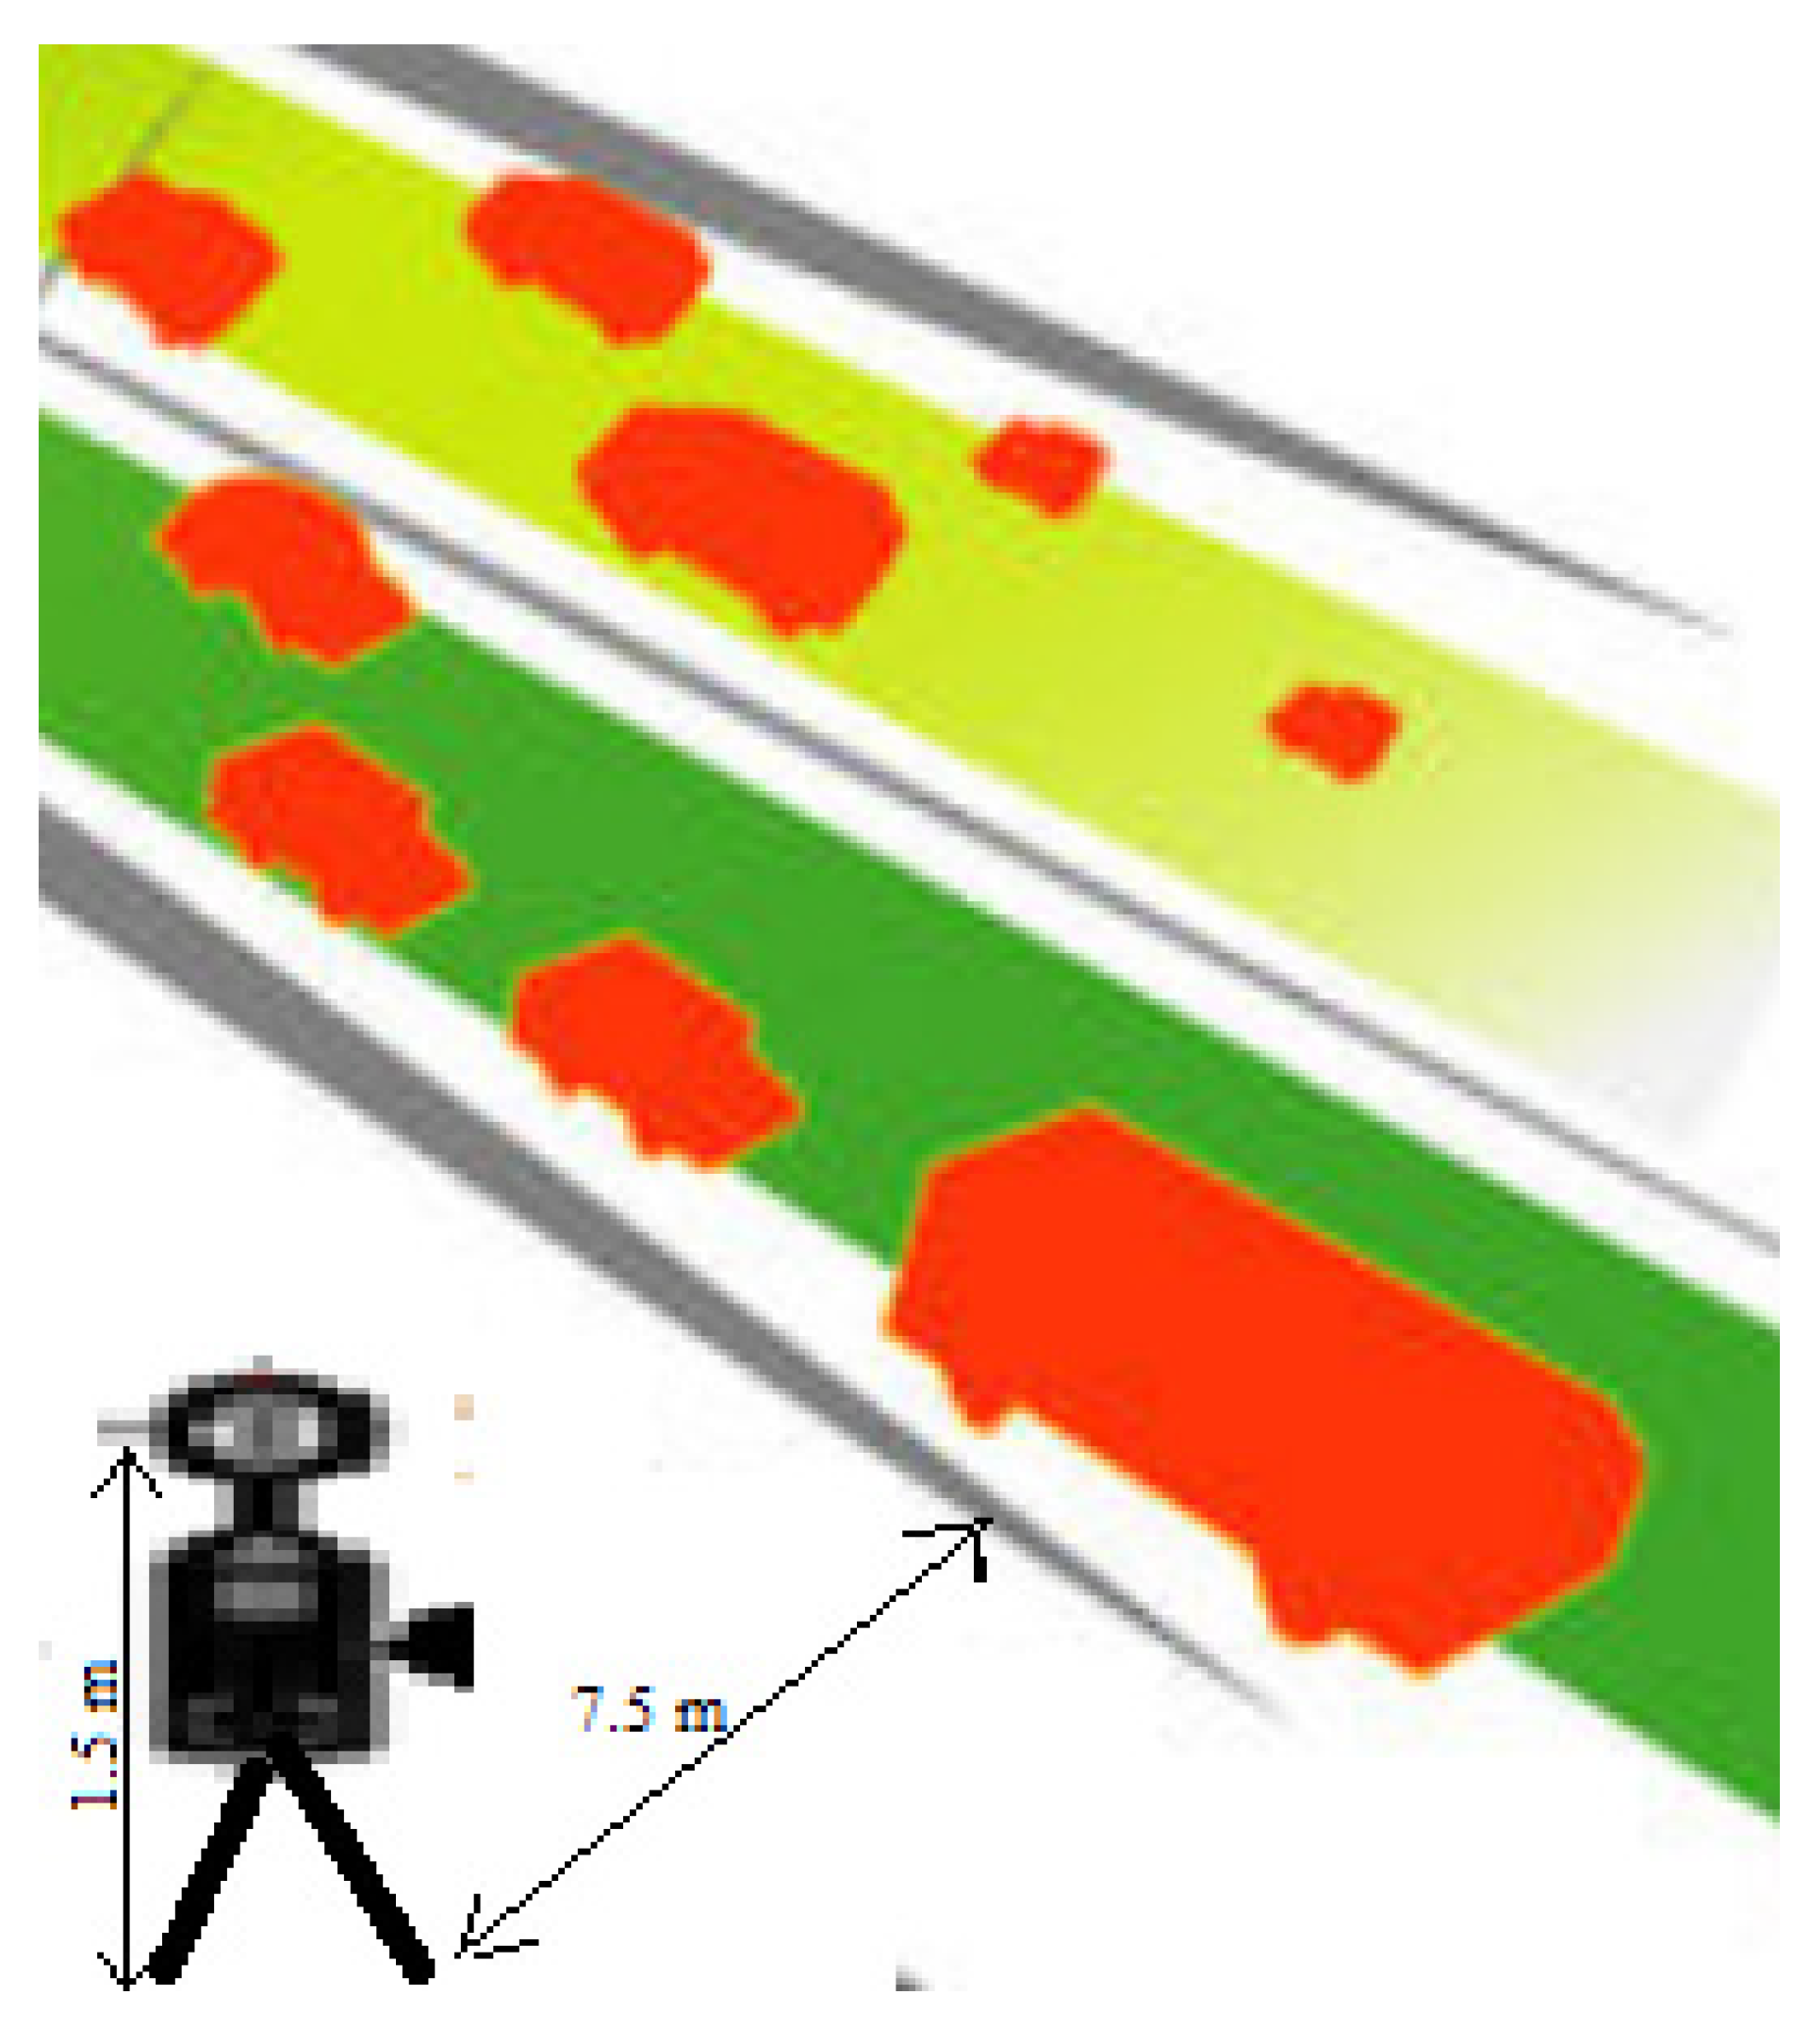
2.2. Research and Expert Evaluation Methodologies
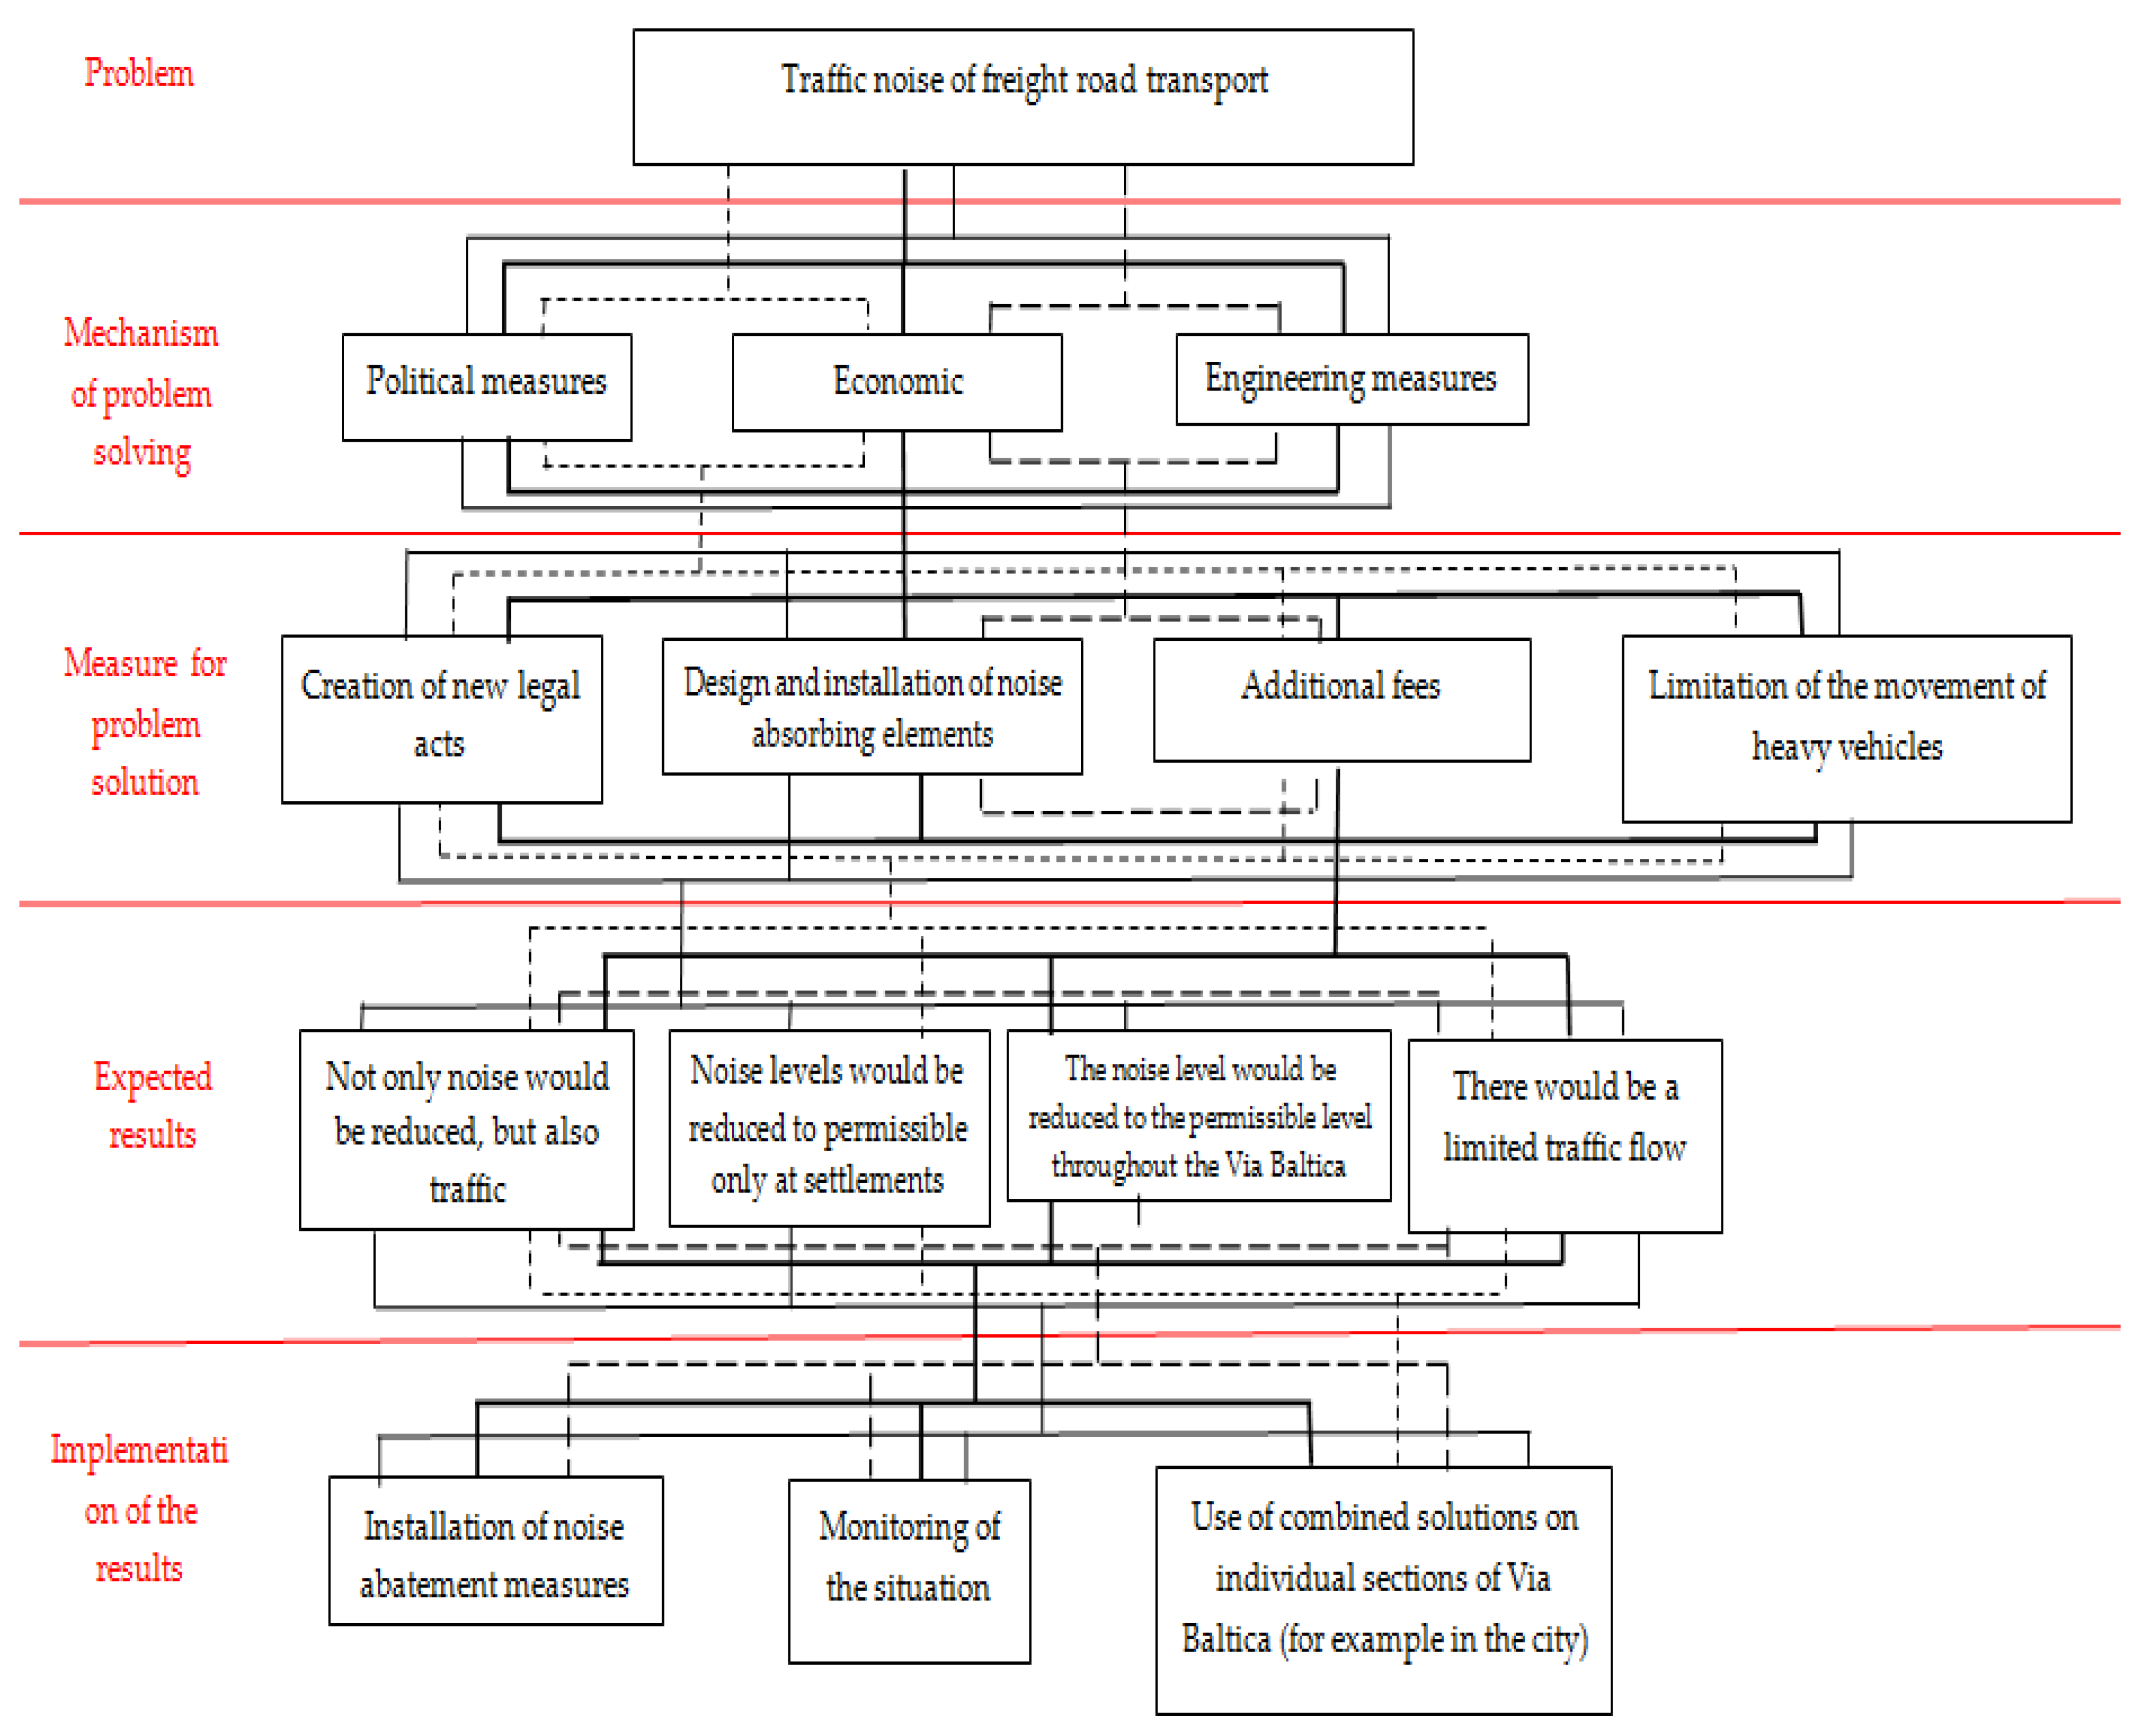
The research consists of two parts: the aim of the first part of the research was to physically evaluate the noise in the selected Via Baltica road sections and to analyze the data obtained by systemizing, while the aim of the second part of the research was to conduct an expert evaluation using the results of the first part and the widely used noise reduction measures in order to assess the reasonability of complex problem solving: 1. Noise measurement points were selected on the most densely populated sections of Via Baltica: (Kaunas—286,754 inhabitants, Ramygala—1733 inhabitants; Pasvalys—7077 inhabitants [74], see Table 1). The measured noise must be as close as possible to the noise the characteristics whereof are to be examined, therefore the measurement conditions and equipment meets the main requirements of the International Standard ISO 1996-2: 2017 [75]. The noise level meter RS-232 was chosen for the measurements, the sound level measurement software of which calculates the average sound level value in the desired location, otherwise known as the equivalent sound pressure level, with the microphone converting the audio signal to an equivalent electrical signal in a quick and normal manner. After estimation filters process the signal, the sound pressure level is displayed on the meter screen in the physical unit of measure—the decibel (dBA). The sound pressure level values are updated every second in the analyzer. Moreover, the latter device is protected from wind, thus while measuring, wind gusts have no impact on noise level results. Considering the requirements, the microphone of the device was kept at a distance of 7.5 ± 0.2 m from the test road reference line and 1.7 ± 0.2 m from the ground. Moreover, the axis of the maximum sensitivity of the micro-phone was horizontal and perpendicular to the vehicle’s driving axis. Figure 3 illustrates the noise level measurement scheme. The aim of the examination of the road transport noise level is to determine and evaluate if the intense movement of road vehicles is harmful to the public, especially local population. Therefore, the equivalent sound pressure level measured in the Via Baltica transport corridor is compared to the noise limit values set in the Hygiene Norm HN 33: 2011 “Noise limit values in residential and public buildings and their environment” [76], also trying to determine the impact of road freight transport on noise levels.
The research was conducted on 6–8 September 2018, when weather conditions were in line with main ISO 1996-2: 2017 standard requirements: it was not raining and the highest temperature ranged from 18 to 22 °C during the day, from 13 to 15 °C in the evening and from 8 to 12 °C at night. Wind speed and direction did not have to be considered during the research, because the noise meter was protected from its effects.
Since the Hygiene Norm HN 33: 2011 sets the limit equivalent noise level values (noise-induced stimulation rate) for the day (6 a.m. to 6 p.m.), evening (6 p.m. to 10 p.m.) and night (10 p.m. to 6 a.m.) time, the research was carried out in these intervals of time—during the day, in the evening and at night. The measurement duration (30 seconds), which does not adversely affect the results, was chosen in light of the fluctuations of road transport flows.
The place of research was chosen on the basis of the following main criteria: the intensity of road freight transport and settlements set out along the driveway. The Via Baltica cross-border transport corridor passing through the territory of Lithuania is considered to be the most intensive road for road freight transport. The transport corridor, which stretches about 267.5 km in the territory of Lithuania, goes through or nearby settlements. When designing the trajectory of this road, the aim was to ensure that the road section was as far away from densely populated areas as possible; however less densely populated areas were disregarded. Therefore, measurement places on Via Baltica road were chosen in settlements or nearby them, where noise level becomes an important factor, especially for the locals. In the course of the research, five highway road sections (see Table 1) were measured, and there were no noise barriers or other noise reduction measures set up along them.
Having measured the noise and evaluated the results of the measurement, the second stage of the research, i.e., the expert evaluation, was carried out.
The essence of the expert evaluation method is the possibility to rationally organize the analysis of a problem with quantitative assessment of opinions conducted by experts and the processing of their results.
The credibility of evaluations of a group of experts depends on the competence, the level of knowledge of each individual expert and the number of members involved. Experts are proficient in their field; thus, the more members in the group, the more reliable are the results. A competence coefficient is used to assess the degree of competence of experts.
In expert evaluation fewer questionnaires are sent, because respondents are more competent, their knowledge of the field is deeper and there are much fewer respondents in the expert evaluation compared to a standard questionnaire survey. The accuracy and objectivity of the answers is also higher. One of the most important characteristics of experts is their competence; therefore, experts were subjected to requirements related to competence and experience in the field of study. Sometimes having a diploma or certificate is enough to certify competence, but the selection of experts was conditional on the expert being a leader in the field of study. In order to retain the accuracy and reliability of expert evaluation, the recommendation is to have at least 5 experts in the expert group. However, sometimes there may be several dozen experts, and the minimum recommended group size is 3 experts. Many researchers believe the optimal group size to be 8 to 10 experts [77,78,79,80]. When compiling a list of experts, the recommendation is to include in the group not only representatives of the field of study being analyzed, but also representatives of related fields of study [81]. The final stage in the expert evaluation is the analysis and registration of the data received, obtaining the results and refining causes and problem areas. The following methodology was chosen to process the survey data.
Having conducted the expert survey, the data received are processed. The processing is necessary in order to receive summarized data and new information in expert evaluation form. A problem solution is formed according to the processing results.
If the correlation between the two expert opinions examined can be quantified by the correlation coefficient. The concordance coefficient shows the degree of concordance of the expert group, if there are more than two experts.
The calculated sum of squares of deviations of all criteria ranks from the average S shows how different the expert evaluation is from total evaluation average. Thus the reliability of the examination may be expressed as the coefficient of concordance of expert opinions W, which shows the degree of proximity of individual opinions [82,83]. The set of the values of the coefficient of concordance is [0,1], i.e., 0 ≤ W ≤ 1. The higher the W, the greater is the correlation of variables. When all the rankings match, W = 1.
In the course of the expert evaluation, experts were asked to assign scores of importance to the objects based on their knowledge, experience and feeling. The obtained criteria were coded in the following procedure: experts E1, E2, …, En, criteria X1, X2, …, Xm. Expert evaluations presented in questionnaires completed by them were entered in a table.
The group of experts n evaluated m objects from the quantitative perspective. The evaluations make up the matrix of n rows and m columns [83]. Any scale of measurements can be adapted for the evaluations, including in indicator units, shares or percent of the unit, in a ten-point system. The ranking of expert indicators can be used to calculate the coefficient of concordance.
Ranking is a procedure when the most important indicator is conferred a rank equal to one, the second indicator gets the second rank and the last indicator—m rank (m—number of comparative indicators). After expert indicators are received, the concordance of their opinions is determined calculating the Kendall’s coefficient of concordance W. Table 2 presents dependencies necessary to make calculations.

3. Results

Given the description of the course of the research methodology, this section will discuss the results obtained in two stages: (1) results of physically assessed noise in the selected sections of Via Baltica (Section 3.1), (2) presentation of results of the conducted expert evaluation based on the results obtained and the commonly used noise reduction measures analyzed in scientific literature, which will be used as a basis for assessing comprehensive validity of the problem solution (Section 3.2).

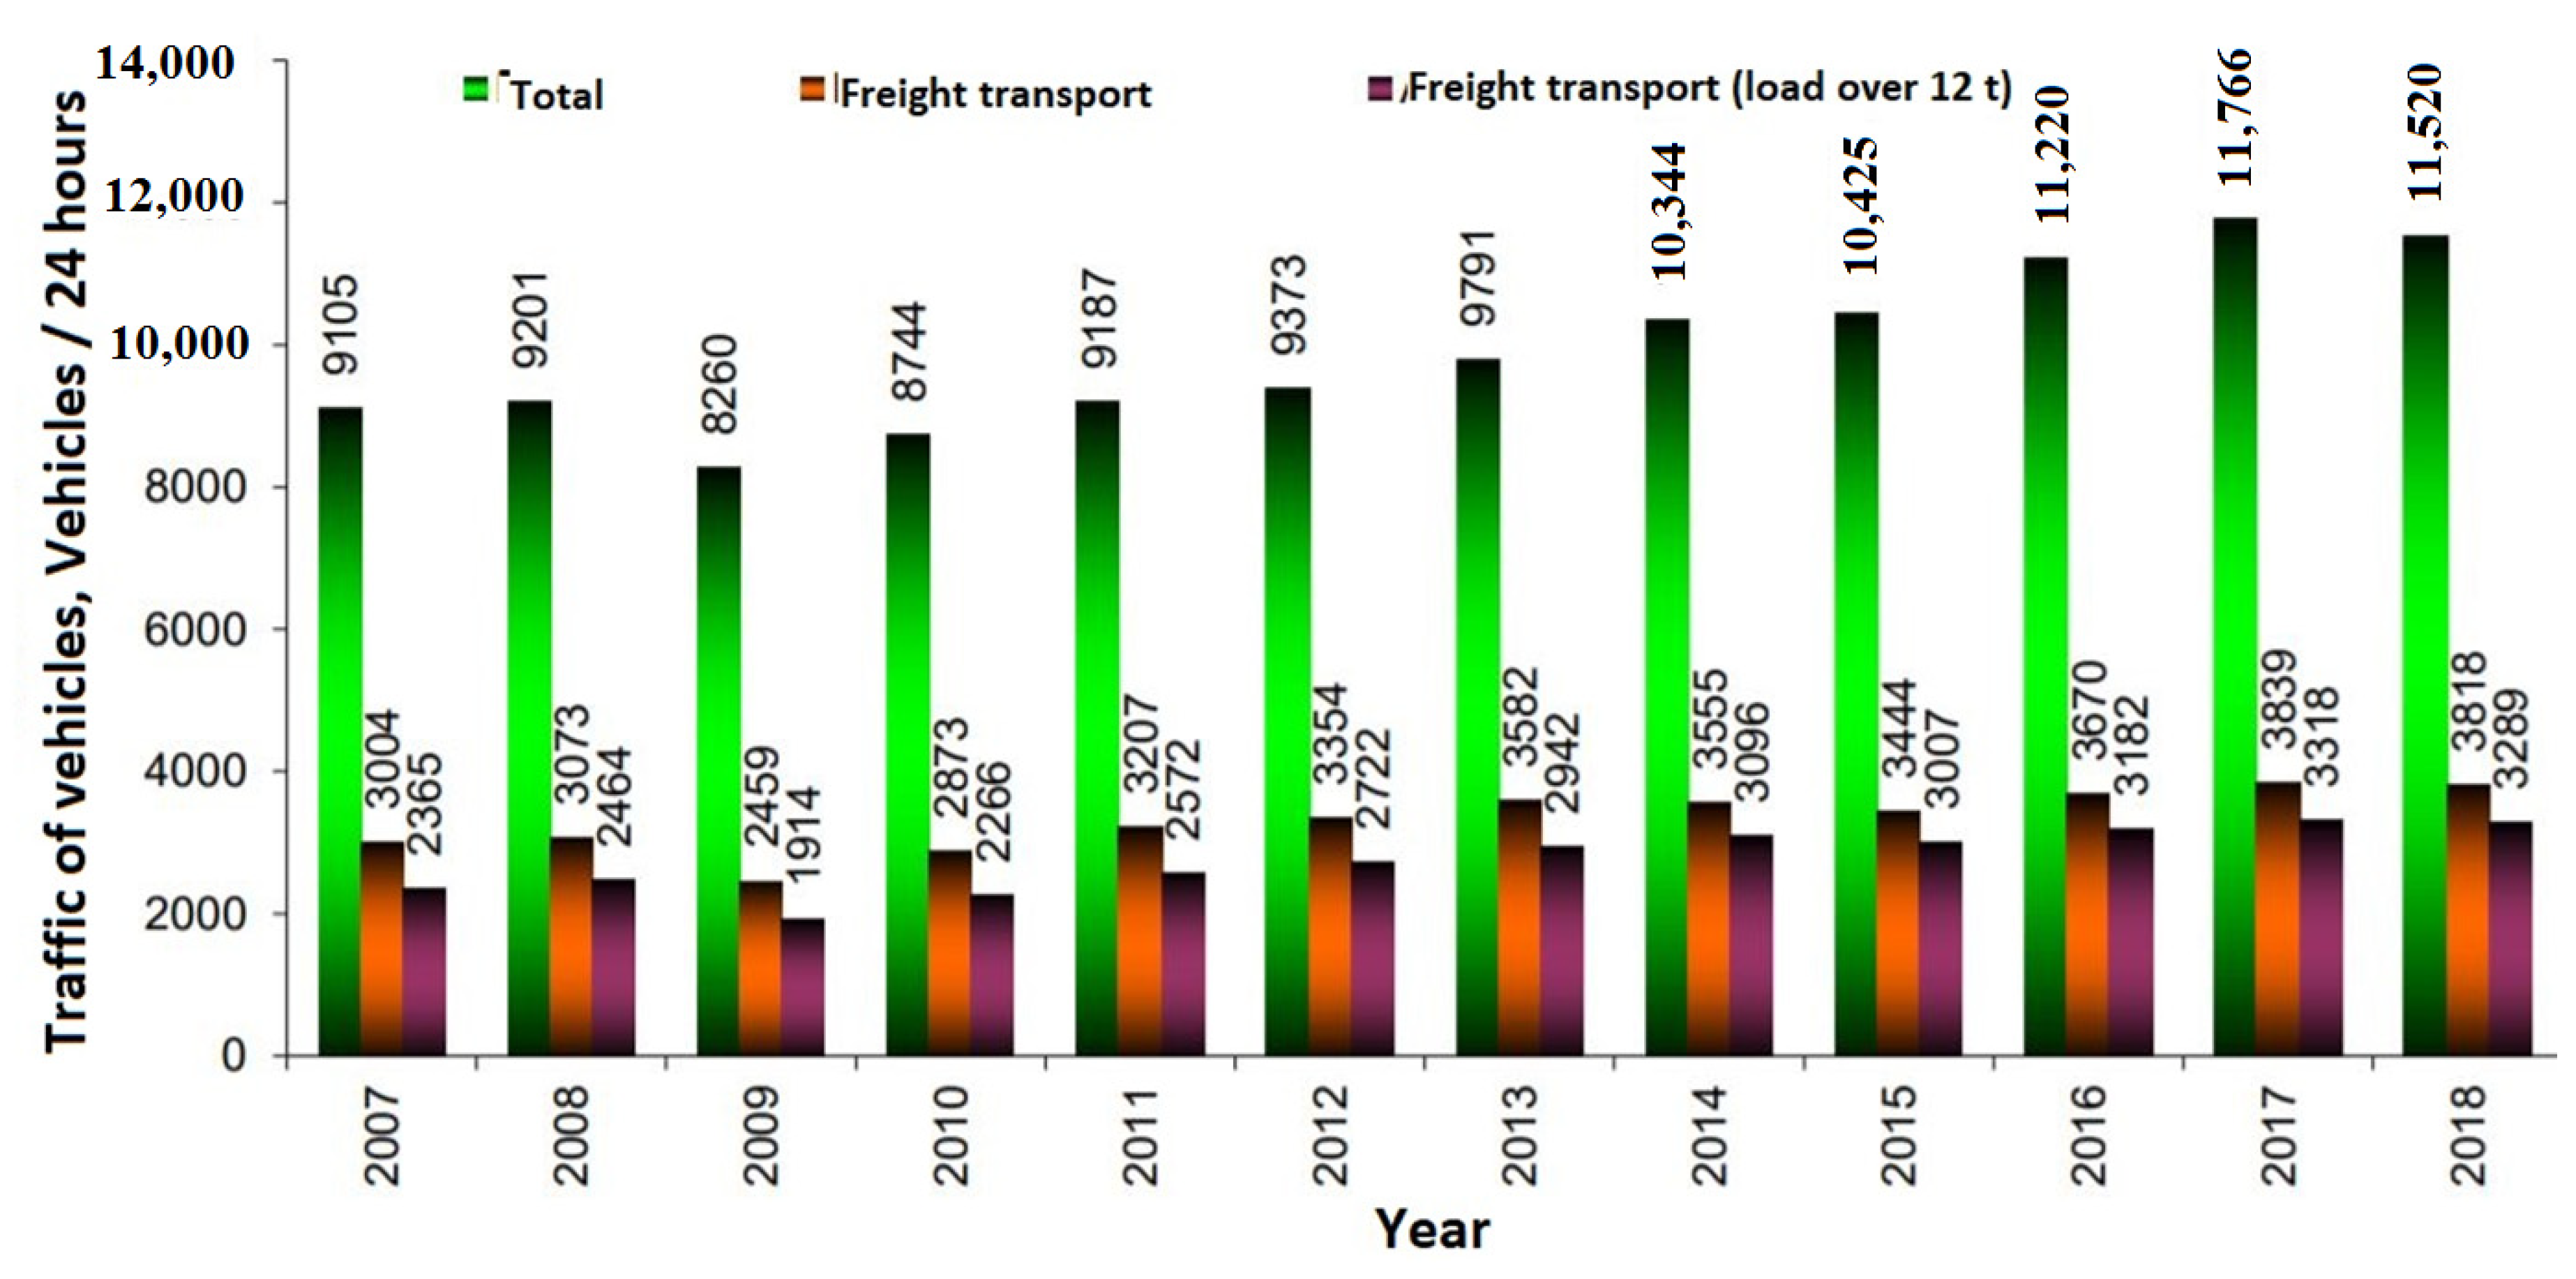
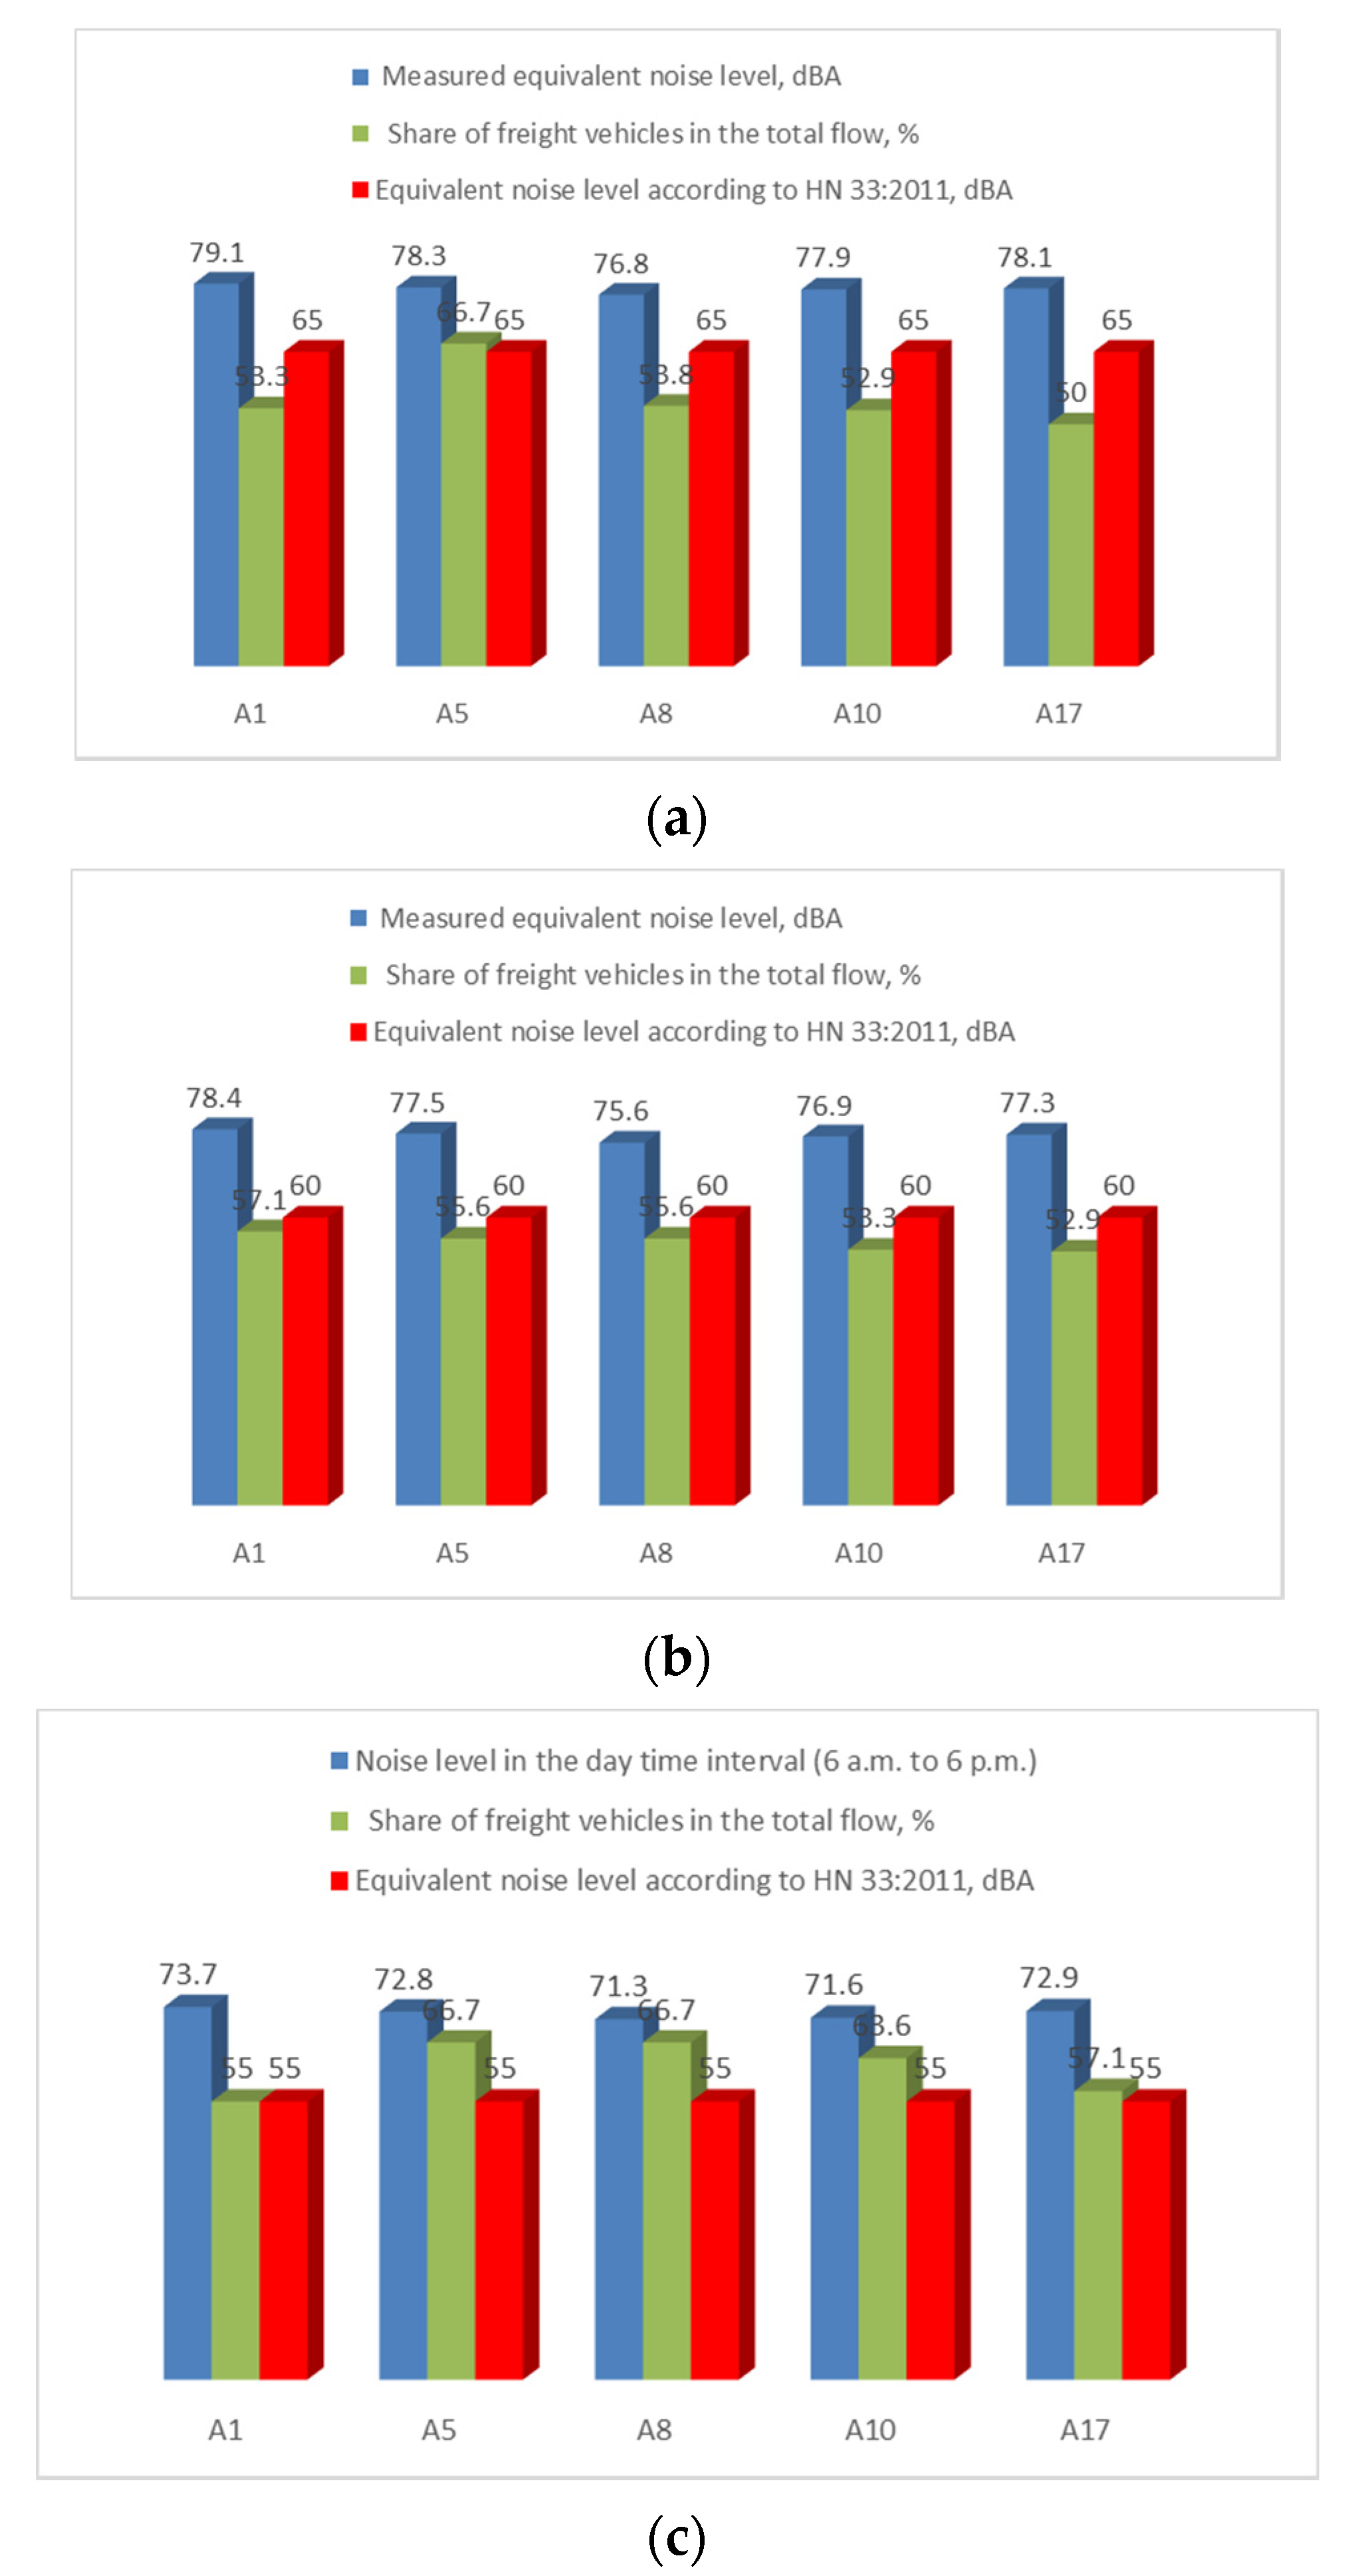
3.1. Noise Research Results

Considering the geographical position of the Via Baltica cross-border transport corridor, it can be stated to be important internationally and locally, so the transportation of freight in this section is inevitable. The five measurement points were in settlements or nearby them, with no noise barriers set up next to the driveway. The settlements were chosen disregarding the population density, because the noise level is relevant regardless of the number of people suffering from its impact on health.
Values of the equivalent noise level were measured during the research, when measurements were made at the set intervals of the day, evening and night time. In addition, the number of vehicles going in both directions was presented, separating the number of cars and freight vehicles calculated during the measurement period, i.e., in 30 seconds. In order to evaluate the deviation of the measured noise values from the maximum permissible values, the limit values of the equivalent noise level in the environment of residential buildings (houses) and public buildings (except for catering and cultural buildings) regulated by the Hygiene Norm HN 33: 2011 affected by transport noise during the day, evening and at night are presented.
The comparison of the equivalent noise level values measured during the research with the limited equivalent noise level values regulated by the Hygiene Norm HN 33: 2011 (Figure 4) allows stating that the permissible level during the day, evening and at night was exceeded in all measurement points. Moreover, the majority of noise is caused by heavy trucks, because the percentage share of these vehicles in the overall traffic flow is greater than that of cars. Thus, residents, who live nearby the main roads of Lithuania with intensive traffic of trucks, are constantly exposed to the noise level, which is harmful to health and unacceptable. Roads have been marked according to markings used by the Road Administration of the Republic of Lithuania, presenting marking details in Table 1.
When examining the road traffic noise, not only the current noise level, but also the factors that have the greatest influence on the noise pollution level, i.e., which vehicles are the noisiest, must be taken into consideration. When carrying out the research, two categories of vehicles were distinguished: passenger cars and heavy freight vehicles the total weight whereof is over 3.5 tons. Based on the assumption that freight vehicles are among the largest sources of noise and their traffic on the Via Baltica cross-border transport corridor is the most intensive, the dependencies of equivalent noise levels on the percentage share of heavy vehicles in the total traffic flow during the day, evening and at night were identified (Figure 4).
The presented diagrams allow stating that the actual (real) noise level, which was measured in five points of Via Baltica cross-border transport corridor exceeds the limit values of equivalent noise level regulated by the Hygiene Norm 33:2011 24 hours a day: by an average of 13 dBA during the day and 17 dBA—in the evening and at night, which means that noise pollution caused by road transport has an adverse effect on the health of people living, studying or working in the surroundings of the logistics corridor. The presented diagrams reveal the trend that in the presence of a higher percentage share of heavy vehicles in the traffic flow, the equivalent noise level is also higher.
Generally speaking, the equivalent noise level values captured using the noise meter in the selected five measurement points of Via Baltica cross-border transport corridor passing through the territory of Lithuania during the day, evening and at night shows that compared to the limit equivalent noise level values regulated in the Hygiene Norm HN 33: 2011, the noise level was exceeded 24 hours a day on the main roads of Lithuania where vehicle traffic is intensive. The data obtained during the research allow stating that freight vehicles have the greatest impact on road transport noise level—the percentage share of these vehicles in the traffic flow in particular determines the noise level. Residents can be assumed to suffer from the noise level harmful to their health not only at the measurement points, but also on all roads with continuous freight vehicle traffic.

3.2. Expert Evaluation Results

Questions related to noise reduction measures in Via Baltica transport logistics corridor were presented for the expert evaluation. Considering the opinion of many researchers that the optimal group size is 8 to 10 experts, 10 experts with 15 years of experience in the field of transport engineering at the least, constantly working in transport-related areas took part in our conducted expert evaluation.
Given the act that one of the most intensive logistics corridors, Via Baltica, was chosen in the case of Lithuania, the aim of the expert evaluation was to examine which noise reduction measures would be the most efficient in Via Baltica logistics corridor (Table 3).
The coefficient of concordance was calculated in the absence of any linked ranks.
W = 12 S n 2 ( m 3 m ) = 12 × 74 10 2 × ( 3 3 3 ) = 0.37
The number of the examined most efficient noise reduction methods in Via Baltica logistics corridor, m > 7. This is when the weight of the coefficient of concordance is calculated according to formula (10) and a random value is obtained.
χ 2 = n ( m 1 ) W = 12 S n m ( m + 1 ) = 12 × 74 10 × 3 ( 3 + 1 ) = 7.4
The calculated value of χ2 was 7.4 and was higher than the critical value χ 2 k r (equal to 5.99147) thus the opinion of respondents is considered concordant, while the average ranks show the general opinion of experts. The lowest value of the coefficient of concordance Wmin calculated according to formula presented in Table 2 allows stating that the opinions of all 10 respondents on the 3 most efficient noise energy reduction measures in Via Baltica logistics corridor still are considered concordant.
W min = χ ν , α 2 n ( m + 1 ) = 5.99147 10 ( 3 1 ) = 0.2996 < 0.3700
The calculations made reveal that the opinions of 10 respondents on the 3 most efficient noise reduction measures in Via Baltica logistics corridor match and the opinion of experts is concordant.
Indicators of importance of the 3 most efficient noise reduction measures in Via Baltica logistics corridor Qj were calculated. Table 4 presents the data received.
Table 4 also illustrates all factors and their arrangement from the most to the least important.
According to the expert evaluation and the conducted calculations, the following is the sequence of the most efficient noise reduction methods in Via Baltica logistics corridor:
  • Design and installation of noise energy absorbing elements;
  • introduction of additional taxes which would be designated for the development of noise energy reduction infrastructure;
  • time restrictions for heavy trucks.
Application of these selected measures would result in a different effect. At least three expected results could be distinguished in each group, but predicting which one of them is the most efficient is difficult; therefore, an expert evaluation was used.
When evaluating the effect of design and installation of noise energy absorbing elements, data of the survey of ten experts were randomly entered in Table 5.
The coefficient of concordance was calculated according to formula presented in Table 2 when there are no associated ranks.
W = 12 S n 2 ( m 3 m ) = 12 × 98 10 2 × ( 3 3 3 ) = 0.49
The number of the examined effects of the results of design and installation of noise absorbing elements, m > 7. This is when the weight of the coefficient of concordance is calculated and a random value is received.
χ 2 = n ( m 1 ) W = 12 S n m ( m + 1 ) = 12 × 98 10 × 3 ( 3 + 1 ) = 9.8
The calculated value of χ2 was 9.8 and was greater than the critical value χ 2 k r (equal to 5.99147); thus, the opinion of respondents is considered concordant, while average ranks show the general opinion of experts. The lowest value of the coefficient of concordance Wmin was calculated according to formula presented in Table 2 stating that opinions of all 10 respondents about the effect of the results of design and installation of 3 noise energy absorbing elements are still considered concordant.
W min = χ ν , α 2 n ( m + 1 ) = 5.99147 10 ( 3 1 ) = 0.2996 < 0.4900
The calculations made reveal that the opinions of 10 respondents on the effect of the results of design and installation of 3 noise energy absorbing elements match and the opinion of experts is concordant.
Indicators of importance Qj of the effect of the results of design and installation of 3 noise-absorbing elements were calculated. Table 6 presents the data received.
Table 6 presents all the factors and their arrangement from the most to the least important.
According to the expert evaluation and the calculations made, the following is the arrangement of the effect of the results of the design and installation of noise energy absorbing elements:
  • The noise level would decrease to the permissible level nearby settlements alone;
  • the noise level would decrease to the permissible level throughout the entire Via Baltic section;
  • such a measure would be inadequate and would not prove suitable.

4. Discussion

In order to reduce noise energy in international corridors, according to the results of research and expert evaluation, it is recommend to use this new algorithm (Figure 5).
The efficiency of measures aimed at reducing noise caused by freight transport, can be summarized as follows:
ζ y ¨ ( a ) = { 0 ,   a < y 1 a y 1 y 2 y 1 ,   y 1 a y 2 a y 3 y 2 y 3 ,   a > y 3 0 ,   a > y 3
where the maximum efficiency can be defined by 1, and the lowest one 0. Here: y1—the application of political measures, y2—application of economic instruments, y3—application of engineering measures, a—the effectiveness of the measures, ζ y ¨ —efficiency indicator.
The boundary conditions for determining the effective solution [84,85]. Political decisions are always positive (politicians strive to please voters), therefore y1 must always be positive. If it is negative, the efficiency is equal to zero. Economic instruments y2 are the cornerstone of noise reduction, because only with adequate funding and reasonable cost-effectiveness of the solution justifies any solution or technology for noise energy reduction. Engineering solution y3 does not have to go beyond the scope of efficiency, since using any engineering technology it needs to be economically viable so that the noise energy reduction process itself succeeds [86,87,88,89].
On the other hand, the rapid development of technological processes leads to the emergence of new technologies, the adaptation of which in this section would be very complicated. Therefore, the excessive orientation still in the unprofit technology reduces the efficiency to zero.
Policy decisions can be defined as the multiplication of many aspects that affect the overall efficiency of noise energy reduction:
y 1 = a | b 1 4 | ,   0 b i < a
where: b1—creation of new legal acts, b2—design and installation of noise energy absorbing elements, b3—additional fees, b4—limitation of the movement of trucks.
It is understood that for the political decision, the multiplication of all listed (b1…4) solutions has a direct influence, which determines the dependence of these decisions on each other b i , i = 1…4. Therefore, overall a good political will is directly influenced by the sum of all the members’ multiplication. It should be emphasized that this process is variable and the importance of its members can vary from the political realities of the country:
lim b ( 1 + 1 b ) b
The economic decision (y2) is predominant and highly dependent on a political decision (y1):
y 2 y 1
According to this, we must follow the absolute value of political decisions, because it is important for us to determine the economic value, and then, after its sign, i.e., the benefit or the loss, which aspects, b1…4, influence the heavyweight noise energy reduction [54,90,91].
Application of engineering measures (y3) is a more recent assessment of the two measures, which defines the possibilities for its application:
y 3 = i = 1 a y i ,   i = 1 2
The measures taken, after considering the aspects, would allow the implementation of the expected results that could be related to dependence:
υ = b 1 b i [ ν ˜ 11 ν ˜ 1 n ν ˜ i 1 ν ˜ i n ]
where ν is the expected result: the noise level would be reduced to permissible only at the settlements; the noise level would be reduced to the permissible level throughout the Via Baltica; such a measure would be inadequate and ineffective [60,68,92,93].
We can express the sensitivity between negative and positive expected results:
ν n + = max i { ν i n } ,   b + = [ b 1 + ,   b n + ] ν n = max i { ν i n } ,   b = [ b 1 ,   b n ] θ ν n + ν n
Implementation of measures to reduce noise energy will directly affect the expected results ( ν ) and can be expressed as dependency:
θ ν n + ν n
where θ is the result of implemented noise energy reduction.
When determining the noise levels caused by transport in the transport logistics corridor, the relation between the number of passing vehicles (both passenger cars and trucks) and the measured noise energy level becomes very important. The results of this correlation allow offering action plans for reducing the noise level for each section of this transport logistics corridor.
Figure 6 illustrates the correlation between the noise level and vehicles, the trends whereof allow deciding on urgent installation of elements or further monitoring of this corridor in order to better identify the reasons for the measured noise levels.
Figure 6 illustrates the correlation between the noise level and vehicles. Its trends allow concluding that vehicle noise reduction measures must be installed immediately or this corridor section should be further monitored in order to more accurately identify the reasons for the formation of this noise energy.
Direct dependency between the measured noise energy level and the number of passing vehicles was not observed in all sections of Via Baltica transport logistics corridor. These values perfectly correlate in sections A1 and A10, and this correlation between the measured noise energy level and the number of vehicles was not observed in sections A5 and A8 (Figure 6a,d) altogether, especially when talking about freight vehicles. Thus, the installation of noise reduction measures in the first three road sections can be stated to be mandatory, while separate monitoring is necessary in the latter two sections for refining noise level dependency on the factors that determine it. The following step of the research would be an expert evaluation of noise reduction opportunities, which would mainly apply to sections A1, A10 and A17, while the remaining sections would be monitored.
According to this research, other countries can use this algorithm for the development of similar transport corridors around the world. The most important is the aspect of adaptability of our recommended methodology. The transport logistics corridor Via Baltica is a specific regional corridor in Europe, serving as a link between east and west and between south and north. Corridors of this type are being developed around the world, they are unique in their purpose, infrastructure development and the like. Therefore, providing for algorithms for infrastructure development in order to justify possible options for reducing noise pollution is important, taking into account many criteria, such as traffic flow and structure, geographic location, etc. The implementation of the algorithm at this stage of decision-making is a criterion that determines the economic and social level of investment. Therefore, the adaptability of implemented solutions is one of the aspects important for the development of infrastructure of other transport corridors.

5. Conclusions

The Via Baltica transport logistics corridor in the territory of the Republic of Lithuania is the most exploited land transport section in the transportation of freight and passengers in the country. Despite the economic crisis year, its load has been steadily increasing, and trucks accounts for the major share of this growth.
The noise level exceeds hygiene norms throughout the entire Via Baltica transport logistics corridor by 13.8–18.7 dBA (HN 33:2011) regardless of the time of day.
Noise level was determined not to correlate with the number of passing vehicles in the entire transport logistics corridor; thus, further proposals were drafted solely for those sections of the corridor where this correlation was present; a decision was made to continue monitoring other sections of the corridor in order to discover the reason for the noise level.
Having conducted expert evaluation of offers for choosing noise energy reduction measures, the following measures were determined to be most efficient in the Via Baltica transport logistics corridor in terms of importance: design and installation of noise absorbing elements; introduction of additional taxes which would be designated for the development of noise reduction infrastructure; time restrictions for trucks.
The purpose of this article was to develop an algorithm/methodology for noise reduction. Therefore, financial aspects have been disregarded, as this may be the object of further research. We have not made comparisons with other countries, because infrastructure of highways in the majority of European countries already have these measures in place, while infrastructure in Lithuania, which is an intersection between east and west and has intensive traffic flows, is not yet developed that well. In addition, calculations of this nature could be the object of further research. Further research could be focused on financial calculations of the implementation of the proposed mechanism/algorithm for specific sections of the corridor and the forecasting of the expected implementation results.

Author Contributions

Conceptualization, K.Č. and J.M.; methodology, A.P. and A.Č.; software, A.P. and A.Č.; formal analysis, J.M.; validation, K.Č. and J.M.; writing—original draft preparation, K.Č., A.P. and J.M.; writing—review and editing, K.Č., J.M. and A.Č.; supervision, A.Č., and A.P.; project administration, J.M and A.Č. All authors have read and agreed to the published version of the manuscript.

Funding

This research received no external funding.

Conflicts of Interest

The authors declare no conflict of interest.

References

  1. Prezelj, J.; Murovec, J. Traffic noise modelling and measurement: Inter-laboratory comparison. Appl. Acoust. 2017, 127, 160–168. [Google Scholar] [CrossRef]
  2. Wallas, A.; Eriksson, C.; Gruzieva, O.; Lind, T.; Pyko, A.; Sjöström, M.; Ögren, M.; Pershagen, G. Road traffic noise and determinants of saliva cortisol levels among adolescents. Int. J. Hyg. Environ. Health 2018, 221, 276–282. [Google Scholar] [CrossRef] [PubMed]
  3. Yu, W.L.; Kang, J. Relationship between traffic noise resistance and village form in China. Landsc. Urban Plan. 2017, 163, 44–55. [Google Scholar] [CrossRef]
  4. Fernandes, P.; Vilaça, M.; Macedo, E.; Sampaio, C.; Bahmankhah, B.; Bandeira, J.M.; Guarnaccia, C.; Rafael, S.; Fernandes, A.P.; Relvas, H.; et al. Integrating road traffic externalities through a sustainability indicator. Sci. Total Environ. 2019, 691, 483–498. [Google Scholar] [CrossRef] [PubMed]
  5. Roswall, N.; Raaschou-Nielsen, O.; Jensen, S.S.; Tjønneland, A.; Sørensen, M. Long-term exposure to residential railway and road traffic noise and risk for diabetes in a Danish cohort. Environ. Res. 2018, 160, 292–297. [Google Scholar] [CrossRef] [PubMed]
  6. Zöldy, M. Improving Heavy Duty Vehicles Fuel Consumption with Density and Friction Modifier. Int. J. Automot. Technol. 2019, 20, 971–978. [Google Scholar] [CrossRef]
  7. Zöldy, M.; Szalay, Z.; Tihanyi, V. Challenges in homologation process of vehicles with artificial intelligence. Transport 2020, 35, 435–446. [Google Scholar] [CrossRef]
  8. Jain, M.; Jehling, M. Analysing transport corridor policies: An integrative approach to spatial and social disparities in India. J. Transp. Geogr. 2020, 86, 102781. [Google Scholar] [CrossRef]
  9. Maghrour Zefreh, M.; Torok, A. Single loop detector data validation and imputation of missing data. Measurement 2018, 116, 193–198. [Google Scholar] [CrossRef]
  10. Proboste, F.; Muñoz, J.C.; Gschwender, A. Comparing social costs of public transport networks structured around an Open and Closed BRT corridor in medium sized cities. Transp. Res. Part Policy Pract. 2020, 138, 187–212. [Google Scholar] [CrossRef]
  11. Buczaj, A.; Krzysiak, Z.; Pecyna, A.; Caban, J.; Brumercik, F. Safety during chemical transport of dangerous goods. PRZEMYSL Chem. 2019, 98, 1276–1280. [Google Scholar] [CrossRef]
  12. Kozak, M.; Lijewski, P.; Fuc, P. Exhaust Emissions from a City Bus Fuelled by Oxygenated Diesel Fuel; SAE International: Warrendale, PA, USA, 2020. [Google Scholar]
  13. Warguła, Ł.; Krawiec, P.; Waluś, K.J.; Kukla, M. Fuel Consumption Test Results for a Self-Adaptive, Maintenance-Free Wood Chipper Drive Control System. Appl. Sci. 2020, 10, 2727. [Google Scholar] [CrossRef] [Green Version]
  14. Nailya, I.; Marina, L.; Aislu, T.; Vyacheslav, K.; Zumrat, S. Post-project assessment of transport and environmental risks of the “Western Europe–Western China” international corridor. Procedia Comput. Sci. 2019, 149, 441–449. [Google Scholar] [CrossRef]
  15. Romanova, A.; Vygnanov, A.; Vygnanova, M.; Sokolova, E.; Eiduks, J. Problems of the formation of a single transport space on sections of international transport corridors. Procedia Comput. Sci. 2019, 149, 537–541. [Google Scholar] [CrossRef]
  16. Öberg, M.; Nilsson, K.L.; Johansson, C.M. Complementary governance for sustainable development in transport: The European TEN-T Core network corridors. Case Stud. Transp. Policy 2018, 6, 674–682. [Google Scholar] [CrossRef]
  17. Kilikevičius, A.; Kilikevičienė, K.; Fursenko, A.; Matijošius, J. The Analysis of Vibration Signals of Critical Points of the Bus Body Frame. Period. Polytech. Transp. Eng. 2020, 48, 296–304. [Google Scholar] [CrossRef] [Green Version]
  18. Wang, T.; Chen, J.; Zhang, C.; Zhan, L.; Guyot, A.; Li, L. An entropy-based analysis method of precipitation isotopes revealing main moisture transport corridors globally. Glob. Planet. Change 2020, 187, 103134. [Google Scholar] [CrossRef]
  19. Batarlienė, N.; Čižiūnienė, K.; Vaičiūtė, K.; Šapalaitė, I.; Jarašūnienė, A. The Impact of Human Resource Management on the Competitiveness of Transport Companies. Procedia Eng. 2017, 187, 110–116. [Google Scholar] [CrossRef]
  20. Matijošius, J.; Vasiliauskas, A.V.; Vasilienė-Vasiliauskienė, V.; Krasodomskis, Ž. The Assessment of Importance of the Factors that Predetermine the Quality of a Service of Transportation by Road Vehicles. Procedia Eng. 2016, 134, 422–429. [Google Scholar] [CrossRef] [Green Version]
  21. Jarašūnienė, A.; Sinkevičius, G.; Čižiūnienė, K.; Čereška, A. Adaptation of the Management Model of Internationalization Processes in the Development of Railway Transport Activities. Sustainability 2020, 12, 6248. [Google Scholar] [CrossRef]
  22. Bureika, G.; Steišūnas, S. Complex Evaluation of Electric Rail Transport Implementation in Vilnius City. Transp. Probl. 2016, 11, 49–60. [Google Scholar] [CrossRef] [Green Version]
  23. Jarašūnienė, A.; Čižiūnienė, K.; Petraška, A. Research on rail and maritime transport interoperability in the area of information systems: The case of lithuania. Transport 2019, 34, 467–475. [Google Scholar] [CrossRef] [Green Version]
  24. Malek, A.; Caban, J.; Wojciechowski, L. Charging electric cars as a way to increase the use of energy produced from RES. Open Eng. 2020, 10, 98–104. [Google Scholar] [CrossRef] [Green Version]
  25. Warguła, Ł.; Kukla, M.; Lijewski, P.; Dobrzyński, M.; Markiewicz, F. Influence of the Use of Liquefied Petroleum Gas (LPG) Systems in Woodchippers Powered by Small Engines on Exhaust Emissions and Operating Costs. Energies 2020, 13, 5773. [Google Scholar] [CrossRef]
  26. Gorbunov, M.; Kravchenko, K.; Bureika, G.; Gerlici, J.; Nozhenko, O.; Vaičiūnas, G.; Bučinskas, V.; Steišūnas, S. Estimation of sand electrification influence on locomotive wheel / rail adhesion processes. Eksploatacja i Niezawodność 2019, 21, 460–467. [Google Scholar] [CrossRef]
  27. Barrachina, D.G.-L.; Boldizsar, A.; Zoldy, M.; Torok, A. Can Neural Network Solve Everything? Case Study Of Contradiction In Logistic Processes With Neural Network Optimisation. In Proceedings of the 2019 Modern Safety Technologies in Transportation (MOSATT), Moscow, Russia, 28–29 November 2019; IEEE: Kosice, Slovakia, 2019; pp. 21–24. [Google Scholar]
  28. Žuraulis, V.; Sokolovskij, E. Vehicle Velocity Relation to Slipping Trajectory Change: An Option for Traffic Accident Reconstruction. PrometTraffic Transp. 2018, 30, 395–406. [Google Scholar] [CrossRef] [Green Version]
  29. Maghrour Zefreh, M.; Torok, A. Theoretical Comparison of the Effects of Different Traffic Conditions on Urban Road Traffic Noise. J. Adv. Transp. 2018, 2018, 7949574. [Google Scholar] [CrossRef] [Green Version]
  30. Bereczky, A. The Past, Present and Future of the Training of Internal Combustion Engines at the Department of Energy Engineering of BME. In Vehicle and Automotive Engineering; Jarmai, K., Bollo, B., Eds.; Springer International Publishing: Cham, Switzerland, 2017; pp. 225–234. [Google Scholar]
  31. Zhao, W.-J.; Liu, E.-X.; Poh, H.J.; Wang, B.; Gao, S.-P.; Png, C.E.; Li, K.W.; Chong, S.H. 3D traffic noise mapping using unstructured surface mesh representation of buildings and roads. Appl. Acoust. 2017, 127, 297–304. [Google Scholar] [CrossRef]
  32. Pravilonis, T.; Sokolovskij, E.; Kilikevičius, A.; Matijošius, J.; Kilikevičienė, K. The Usage of Alternative Materials to Optimize Bus Frame Structure. Symmetry 2020, 12, 1010. [Google Scholar] [CrossRef]
  33. Rövid, A.; Remeli, V.; Paufler, N.; Lengyel, H.; Zöldy, M.; Szalay, Z. Towards Reliable Multisensory Perception and Its Automotive Applications. Period. Polytech. Transp. Eng. 2020, 48, 334–340. [Google Scholar] [CrossRef]
  34. Li, F.; Lin, Y.; Cai, M.; Du, C. Dynamic simulation and characteristics analysis of traffic noise at roundabout and signalized intersections. Appl. Acoust. 2017, 121, 14–24. [Google Scholar] [CrossRef]
  35. Lijewski, P.; Kozak, M.; Fuc, P.; Rymaniak, L.; Ziolkowski, A. Exhaust emissions generated under actual operating conditions from a hybrid vehicle and an electric one fitted with a range extender. Transp. Res. PART Transp. Environ. 2020, 78, 102183. [Google Scholar] [CrossRef]
  36. Ow, L.F.; Ghosh, S. Urban cities and road traffic noise: Reduction through vegetation. Appl. Acoust. 2017, 120, 15–20. [Google Scholar] [CrossRef]
  37. Maghrour Zefreh, M.; Török, Á.; Mészáros, F. Average Vehicles Length in Two-lane Urban Roads: A Case Study in Budapest. Period. Polytech. Transp. Eng. 2017, 45, 218. [Google Scholar] [CrossRef]
  38. Debnath, A.; Singh, P.K. Environmental traffic noise modelling of Dhanbad township area – A mathematical based approach. Appl. Acoust. 2018, 129, 161–172. [Google Scholar] [CrossRef]
  39. Estévez-Mauriz, L.; Forssén, J. Dynamic traffic noise assessment tool: A comparative study between a roundabout and a signalised intersection. Appl. Acoust. 2018, 130, 71–86. [Google Scholar] [CrossRef]
  40. Klompmaker, J.O.; Hoek, G.; Bloemsma, L.D.; Marra, M.; Wijga, A.H.; van den Brink, C.; Brunekreef, B.; Lebret, E.; Gehring, U.; Janssen, N.A.H. Surrounding green, air pollution, traffic noise exposure and non-accidental and cause-specific mortality. Environ. Int. 2020, 134, 105341. [Google Scholar] [CrossRef]
  41. Yamawaki, Y.; Castro Filho, F.M.; Costa, G.E.G. Mega-event transport legacy in a developing country: The case of Rio 2016 Olympic Games and its Transolímpica BRT corridor. J. Transp. Geogr. 2020, 88, 102858. [Google Scholar] [CrossRef]
  42. Stefanović, N.; Milijić, S.; Hristić, N.D. System approach in process of planning and project documentation preparation for highway corridors as an instrument for establishing the Trans-European Transport Network. Transp. Res. Procedia 2020, 45, 491–498. [Google Scholar] [CrossRef]
  43. Kilikevičius, A.; Skeivalas, J.; Kilikevičienė, K.; Matijošius, J. Analysis of Dynamic Parameters of a Railway Bridge. Appl. Sci. 2019, 9, 2545. [Google Scholar] [CrossRef] [Green Version]
  44. Fernandes, P.; Guarnaccia, C.; Teixeira, J.; Sousa, A.; Coelho, M.C. Multi-Criteria Assessment of Crosswalk Location on a Corridor with Roundabouts: Incorporating a Noise Related Criterion. Transp. Res. Procedia 2017, 27, 460–467. [Google Scholar] [CrossRef]
  45. Zeeb, H.; Hegewald, J.; Schubert, M.; Wagner, M.; Dröge, P.; Swart, E.; Seidler, A. Traffic noise and hypertension–results from a large case-control study. Environ. Res. 2017, 157, 110–117. [Google Scholar] [CrossRef] [PubMed]
  46. Nemtanu, F.; Costea, I.M.; Dumitrescu, C. Spectral Analysis of Traffic Functions in Urban Areas. PROMET TrafficTransp. 2015, 27, 477–484. [Google Scholar] [CrossRef] [Green Version]
  47. Schlingensiepen, J.; Naroska, E.; Nemtanu, F.C. Improving Integrated Travel Planning by Enhancing Travel Planning Model with Rail Station Data. In Sustainable Rail Transport; Marinov, M., Ed.; Springer International Publishing: Cham, Switzerland, 2018; pp. 147–168. ISBN 978-3-319-58642-7. [Google Scholar]
  48. Can, A.; Aumond, P. Estimation of road traffic noise emissions: The influence of speed and acceleration. Transp. Res. Part Transp. Environ. 2018, 58, 155–171. [Google Scholar] [CrossRef]
  49. Lu, X.; Kang, J.; Zhu, P.; Cai, J.; Guo, F.; Zhang, Y. Influence of urban road characteristics on traffic noise. Transp. Res. Part Transp. Environ. 2019, 75, 136–155. [Google Scholar] [CrossRef]
  50. Jiang, L.; Kang, J. Effect of traffic noise on perceived visual impact of motorway traffic. Landsc. Urban Plan. 2016, 150, 50–59. [Google Scholar] [CrossRef]
  51. Hamad, K.; Ali Khalil, M.; Shanableh, A. Modeling roadway traffic noise in a hot climate using artificial neural networks. Transp. Res. Part Transp. Environ. 2017, 53, 161–177. [Google Scholar] [CrossRef]
  52. Pedersen, M.; Olsen, S.F.; Halldorsson, T.I.; Zhang, C.; Hjortebjerg, D.; Ketzel, M.; Grandström, C.; Sørensen, M.; Damm, P.; Langhoff-Roos, J.; et al. Gestational diabetes mellitus and exposure to ambient air pollution and road traffic noise: A cohort study. Environ. Int. 2017, 108, 253–260. [Google Scholar] [CrossRef]
  53. Cai, M.; Lan, Z.; Zhang, Z.; Wang, H. Evaluation of road traffic noise exposure based on high-resolution population distribution and grid-level noise data. Build. Environ. 2019, 147, 211–220. [Google Scholar] [CrossRef]
  54. Benocci, R.; Molteni, A.; Cambiaghi, M.; Angelini, F.; Roman, H.E.; Zambon, G. Reliability of Dynamap traffic noise prediction. Appl. Acoust. 2019, 156, 142–150. [Google Scholar] [CrossRef]
  55. Hakzah; Pawelloi, A.I.; Nasir, N.; Hamzah, S. The effect of traffic noise on public health. Enferm. Clínica 2020, 30, 249–253. [Google Scholar] [CrossRef] [PubMed]
  56. Khan, J.; Kakosimos, K.; Jensen, S.S.; Hertel, O.; Sørensen, M.; Gulliver, J.; Ketzel, M. The spatial relationship between traffic-related air pollution and noise in two Danish cities: Implications for health-related studies. Sci. Total Environ. 2020, 726, 138577. [Google Scholar] [CrossRef] [PubMed]
  57. Quintero, G.; Balastegui, A.; Romeu, J. Annual traffic noise levels estimation based on temporal stratification. J. Environ. Manage. 2018, 206, 1–9. [Google Scholar] [CrossRef] [PubMed] [Green Version]
  58. Lewandowska, A.; Branowski, B.; Joachimiak-Lechman, K.; Kurczewski, P.; Selech, J.; Zablocki, M. Sustainable Design: A Case of Environmental and Cost Life Cycle Assessment of a Kitchen Designed for Seniors and Disabled People. Sustainability 2017, 9, 1329. [Google Scholar] [CrossRef] [Green Version]
  59. Enoksson Wallas, A.; Eriksson, C.; Edstedt Bonamy, A.-K.; Gruzieva, O.; Kull, I.; Ögren, M.; Pyko, A.; Sjöström, M.; Pershagen, G. Traffic noise and other determinants of blood pressure in adolescence. Int. J. Hyg. Environ. Health 2019, 222, 824–830. [Google Scholar] [CrossRef]
  60. Brink, M.; Schäffer, B.; Vienneau, D.; Foraster, M.; Pieren, R.; Eze, I.C.; Cajochen, C.; Probst-Hensch, N.; Röösli, M.; Wunderli, J.-M. A survey on exposure-response relationships for road, rail, and aircraft noise annoyance: Differences between continuous and intermittent noise. Environ. Int. 2019, 125, 277–290. [Google Scholar] [CrossRef] [PubMed]
  61. Zaranka, J.; Pečeliūnas, R.; Matijošius, J. Analysis of the influence of fatigue on passenger transport drivers’ performance capacity. Transport 2012, 27, 351–356. [Google Scholar] [CrossRef]
  62. Covaciu, D.; Florea, D.; Timar, J. Estimation of the noise level produced by road traffic in roundabouts. Appl. Acoust. 2015, 98, 43–51. [Google Scholar] [CrossRef]
  63. Kilikevičius, A.; Kilikevičienė, K.; Matijošius, J. Investigation of Drivers’ Comfort Factors Influencing Urban Traffic Safety. In Vision Zero for Sustainable Road Safety in Baltic Sea Region; Varhelyi, A., Žuraulis, V., Prentkovskis, O., Eds.; Lecture Notes in Intelligent Transportation and Infrastructure; Springer International Publishing: Cham, Switzerland, 2020; pp. 159–165. ISBN 978-3-030-22374-8. [Google Scholar]
  64. Rossi, I.A.; Vienneau, D.; Ragettli, M.S.; Flückiger, B.; Röösli, M. Estimating the health benefits associated with a speed limit reduction to thirty kilometres per hour: A health impact assessment of noise and road traffic crashes for the Swiss city of Lausanne. Environ. Int. 2020, 145, 106126. [Google Scholar] [CrossRef]
  65. Vaitkus, A.; Andriejauskas, T.; Vorobjovas, V.; Jagniatinskis, A.; Fiks, B.; Zofka, E. Asphalt wearing course optimization for road traffic noise reduction. Constr. Build. Mater. 2017, 152, 345–356. [Google Scholar] [CrossRef]
  66. Donkers, A.; Yang, D.; Viktorović, M. Influence of driving style, infrastructure, weather and traffic on electric vehicle performance. Transp. Res. Part Transp. Environ. 2020, 88, 102569. [Google Scholar] [CrossRef]
  67. Mikulski, M.; Ambrosewicz-Walacik, M.; Duda, K.; Hunicz, J. Performance and emission characterization of a common-rail compression-ignition engine fuelled with ternary mixtures of rapeseed oil, pyrolytic oil and diesel. Renew. Energy 2020, 148, 739–755. [Google Scholar] [CrossRef]
  68. Laib, F.; Braun, A.; Rid, W. Modelling noise reductions using electric buses in urban traffic. A case study from Stuttgart, Germany. Transp. Res. Procedia 2019, 37, 377–384. [Google Scholar] [CrossRef]
  69. Ögren, M.; Molnár, P.; Barregard, L. Road traffic noise abatement scenarios in Gothenburg 2015–2035. Environ. Res. 2018, 164, 516–521. [Google Scholar] [CrossRef]
  70. Meysam Mousavi, S.; Antuchevičienė, J.; Zavadskas, E.K.; Vahdani, B.; Hashemi, H. A new decision model for cross-docking center location in logistics networks under interval-valued intuitionistic fuzzy uncertainty. Transport 2019, 34, 30–40. [Google Scholar] [CrossRef] [Green Version]
  71. Mahdiraji, H.A.; Beheshti, M.; Razavi Hajiagha, S.H.; Zavadskas, E.K. A fuzzy binary bi objective transportation model: Iranian steel supply network. Transport 2018, 33, 810–820. [Google Scholar] [CrossRef] [Green Version]
  72. Pehlivan, N.Y.; Şahin, A.; Zavadskas, E.K.; Turskis, Z. A comparative study of integrated fmcdm methods for evaluation of organizational strategy development. J. Bus. Econ. Manag. 2018, 19, 360–381. [Google Scholar] [CrossRef] [Green Version]
  73. Lithuanian Road Administration under the Ministry of Transport and Communications. Available online: https://lakd.lrv.lt/en/ (accessed on 8 November 2018).
  74. Inhabitants in Lithuania—Official Portal of Statistics (In Lithuanian)—Gyventojai—Oficialiosios Statistikos Portalas. Available online: https://osp.stat.gov.lt/gyventojai1 (accessed on 25 November 2020).
  75. International Standard ISO 1996-2: 2017. Available online: https://www.iso.org/standard/59766.html (accessed on 21 November 2019).
  76. V-604 Dėl Lietuvos Higienos Normos HN 33:2011 “Triukšmo Ribiniai Dydžiai Gyvenamuosiuose ir Visuomeninė. Available online: https://www.e-tar.lt/portal/lt/legalAct/TAR.8B79388EACD2 (accessed on 8 November 2018).
  77. Remeikiene, R.; Gaspareniene, L.; Schneider, F.G. THE DEFINITION OF DIGITAL SHADOW ECONOMY. Technol. Econ. Dev. Econ. 2017, 24, 696–717. [Google Scholar] [CrossRef] [Green Version]
  78. Fahey, C.J.; Delaney, R.A. Exploring expert variability in defining pseudoparalysis: An international survey. J. Shoulder Elbow Surg. 2020, S1058274620307096. [Google Scholar] [CrossRef]
  79. Howell, T.J.; Bennett, P.C. Preventing predatory behaviour in greyhounds retired from the racing industry: Expert opinions collected using a survey and interviews. Appl. Anim. Behav. Sci. 2020, 226, 104988. [Google Scholar] [CrossRef]
  80. Klok, F.A.; Schreiber, K.; Stach, K.; Ageno, W.; Middeldorp, S.; Eichinger, S.; Delluc, A.; Blondon, M.; Ay, C. Oral contraception and menstrual bleeding during treatment of venous thromboembolism: Expert opinion versus current practice. Thromb. Res. 2017, 153, 101–107. [Google Scholar] [CrossRef] [PubMed]
  81. Sánchez-Torres, J.M.; Miles, I. The role of future-oriented technology analysis in e-Government: A systematic review. Eur. J. Futur. Res. 2017, 5, 15. [Google Scholar] [CrossRef]
  82. Kendall, M.G. Rank Correlation Methods, 4th ed.; Griffin: London, UK, 1970; ISBN 978-0-85264-199-6. [Google Scholar]
  83. Sivilevičius, H. Application of Expert Evaluation Method to Determine the Importance of Operating Asphalt Mixing Plant Quality Criteria and Rank Correlation. Balt. J. Road Bridge Eng. 2011, 6, 48–58. [Google Scholar] [CrossRef]
  84. Yang, W.; Cai, M.; Luo, P. The calculation of road traffic noise spectrum based on the noise spectral characteristics of single vehicles. Appl. Acoust. 2020, 160, 107128. [Google Scholar] [CrossRef]
  85. Begou, P.; Kassomenos, P.; Kelessis, A. Effects of road traffic noise on the prevalence of cardiovascular diseases: The case of Thessaloniki, Greece. Sci. Total Environ. 2020, 703, 134477. [Google Scholar] [CrossRef] [PubMed]
  86. Meyer, R.; Benetto, E.; Mauny, F.; Lavandier, C. Characterization of damages from road traffic noise in life cycle impact assessment: A method based on emission and propagation models. J. Clean. Prod. 2019, 231, 121–131. [Google Scholar] [CrossRef]
  87. Jeon, J.Y.; Jo, H.I. Three-dimensional virtual reality-based subjective evaluation of road traffic noise heard in urban high-rise residential buildings. Build. Environ. 2019, 148, 468–477. [Google Scholar] [CrossRef]
  88. Paiva, K.M.; Cardoso, M.R.A.; Zannin, P.H.T. Exposure to road traffic noise: Annoyance, perception and associated factors among Brazil’s adult population. Sci. Total Environ. 2019, 650, 978–986. [Google Scholar] [CrossRef]
  89. Chen, L.; Tang, B.; Liu, T.; Xiang, H.; Sheng, Q.; Gong, H. Modeling traffic noise in a mountainous city using artificial neural networks and gradient correction. Transp. Res. Part Transp. Environ. 2019, S1361920919305024. [Google Scholar] [CrossRef]
  90. Gloaguen, J.-R.; Can, A.; Lagrange, M.; Petiot, J.-F. Road traffic sound level estimation from realistic urban sound mixtures by Non-negative Matrix Factorization. Appl. Acoust. 2019, 143, 229–238. [Google Scholar] [CrossRef] [Green Version]
  91. Nourani, V.; Gökçekuş, H.; Umar, I.K. Artificial intelligence based ensemble model for prediction of vehicular traffic noise. Environ. Res. 2020, 180, 108852. [Google Scholar] [CrossRef] [PubMed]
  92. Wang, H.; Gao, H.; Cai, M. Simulation of traffic noise both indoors and outdoors based on an integrated geometric acoustics method. Build. Environ. 2019, 160, 106201. [Google Scholar] [CrossRef]
  93. Kuehnel, N.; Moeckel, R. Impact of simulation-based traffic noise on rent prices. Transp. Res. Part Transp. Environ. 2019, S1361920919308430. [Google Scholar] [CrossRef]
Figure 1. Change of the average annual daily traffic intensity in Via Baltica transport corridor: (a) total intensity; (b) trucks intensity.
Energies 13 06475 g001
Figure 2. Change of the average annual daily traffic intensity in Via Baltica transport corridor.
Energies 13 06475 g002
Figure 3. Noise measurement scheme.
Energies 13 06475 g003
Figure 4. Equivalent noise level and the share of freight vehicles in the total traffic flow: (a) during the day (6 a.m. to 6 p.m.); (b) during the evening (6 p.m.–10 p.m.); (c) at night (10 p.m.–6 a.m.).
Energies 13 06475 g004
Figure 5. Mechanism of noise level reduction in international corridors.
Energies 13 06475 g005
Figure 6. Correlation between the measured noise level (A) and vehicles: passenger cars (B) and trucks (C), where: (a) road A1; (b) road A5; (c) road A8; (d) road A10.
Energies 13 06475 g006
Table 1. Noise measurement points in Via Baltica transport logistics corridor.
Transport Corridor SectionMeasurement PointMaximum Permissible Speed, km/h
A1 Vilnius—Kaunas—Klaipėda section from 102 km to 114 kmAt 102.36 km of the section (in Kaunas)80
A5 Kaunas—Marijampolė—Suvalkai section from 0 km to 96 kmAt 15.5 km of the section (Jonučių settlement)80
A8 Panevėžys—Aristava—Sitkūnai section from 8 km to 88 kmAt 25 km of the section (in Ramygala)50
A10 Panevėžys—Pasvalys—Ryga section from 9 km to 66 kmAt 39 km of the section (nearby Pasvalys city)70
Section of A17 Panevėžys Bypass from 0 km to 22 kmAt 9.4 km of the section (Paviešečių settlement)70
Table 2. Dependencies necessary for carrying out an expert evaluation.
Parameter NameFormula
Kendall’s coefficient of concordance R j = n = 1 n R i j
Sums of R squares S (dispersion) S = j = 1 m ( R j R ¯ ) 2
Total average R ¯ = j = 1 m R i j m = i = 1 n j = 1 m R i j m
Sum of n indicator rankings of all n experts i = 1 n R i j = 1 2 n ( m + 1 )
Total average R ¯ = 1 2 n ( m + 1 )
Average rank of each criterion R R j ¯ = i = 1 n R i j n
Coefficient of concordance when there are no associated ranks W = 12 S n 2 m ( m 2 1 ) = 12 S n 2 ( m 3 m )
Sum of squares S of deviations of ranks R of each criterion from the average rank S = j = 1 m ( i = 1 n R i j = 1 2 n ( m + 1 ) ) 2
Sum of squares S in an ideal approved case S max = n 2 m ( m 2 1 ) 12
Pearson’s χ2 criterion χ 2 = n ( m 1 ) W = 12 S n m ( m + 1 )
Lowest value of the coefficient of concordance Wmin W min = χ υ α 2 n ( m 1 )
Reverse value of the criterion q d j = 1 q ¯ j = 1 R ¯ j j = 1 m R j
Criteria importance indicators Q j = d j j = 1 m d j = d j m 1
Importance of criteria of the object being evaluated by experts Q j = ( m + 1 ) R ¯ j j = 1 m R j
Table 3. Table of received evaluation ranks.
Factor Encryption Symbol (m = 3) *
abc
n = 1 n R i j 132423
R j ¯ = i = 1 n R i j n 1.32.42300
i = 1 n R i j = 1 2 n ( m + 1 ) −743
[ i = 1 n R i j = 1 2 n ( m + 1 ) ] 2 49169
* Criteria coding: design and installation of elements absorbing noise (a); time restrictions for heavy trucks (b); introduction of additional taxes which would be designated for the development of noise reduction infrastructure (c).
Table 4. Ranks evaluation table.
Indicator SignFactor Encryption SymbolSum
abc
q ¯ j 0.21670.40000.38331
d j 0.78330.60000.61672
Q j 0.39170.30000.30831
Q j 0.45000.26670.28331
Factor arrangement132
Table 5. Table illustrating the ranks of the received evaluations.
Factor Encryption Symbol (m = 3) *
abc
n = 1 n R i j 201327
R j ¯ = i = 1 n R i j n 21.32.7
i = 1 n R i j = 1 2 n ( m + 1 ) 0−77
[ i = 1 n R i j = 1 2 n ( m + 1 ) ] 2 04949
* Criteria coding: the noise level would decrease to the permissible level throughout the entire Via Baltic section (a); noise level would decrease to the permissible level near settlements alone (b); such a measure would be inadequate and would not prove suitable (c).
Table 6. Table illustrating the evaluation of ranks.
Indicator SignFactor Encryption SymbolSum
abc
q ¯ j 0.33330.21670.45001
d j 0.66670.78330.55002
Q j 0.33330.39170.27501
Q j 0.33330.45000.21671
Factor arrangement213
Publisher’s Note: MDPI stays neutral with regard to jurisdictional claims in published maps and institutional affiliations.

