Article

A Study on the Prediction of the Temperature and Mass of Hydrogen Gas inside a Tank during Fast Filling Process

1
Department of Mechanical Engineering, Graduate School, Hoseo University, Asan 31499, Korea
2
Division of Mechanical and Automotive Engineering, Hoseo University, Asan 31499, Korea
3
Division of Chemical Engineering, Hoseo University, Asan 31499, Korea
*
Author to whom correspondence should be addressed.
Energies 2020, 13(23), 6428; https://doi.org/10.3390/en13236428
Submission received: 9 November 2020 / Revised: 26 November 2020 / Accepted: 27 November 2020 / Published: 4 December 2020

Abstract

:
The hydrogen compression cycle system recycles hydrogen compressed by a compressor at high pressure and stores it in a high-pressure container. Thermal stress is generated due to increase in the pressure and temperature of hydrogen in the hydrogen storage tank during the fast filing process. For the sake of safety, it is of great practical significance to predict and control the temperature change in the tank. The hydrogen charging process in the storage tank of the hydrogen charging station was studied by experimentation and simulation. In this paper, a Computational Fluid Dynamics (CFD) model for non-adiabatic real filling of a 50 MPa hydrogen cylinder was presented. In addition, a shear stress transport (k-ω) model and real gas model were used in order to account for thermo-fluid dynamics during the filling of hydrogen storage tanks (50 MPa, 343 L). Compared to the simulation results with the experimental data carried out under the same conditions, the temperatures calculated from the simulated non-adiabatic condition results were lower (by 5.3%) than those from the theoretical adiabatic condition calculation. The theoretical calculation was based on the experimentally measured pressure value. The calculated simulation mass was 8.23% higher than the theoretical result. The results of this study will be very useful in future hydrogen energy research and hydrogen charging station developments.

1. Introduction

The development of new clean and efficient sources of energy is the only solution for the growing energy shortage, environmental pollution, and ecological deterioration. Hydrogen has become the most promising secondary energy in the 21st century with excellent advantages such as broad source, no polluting product, high combustion efficiency, and reproducible ability. It has important strategic significance in solving the problems of energy shortage and environmental pollution across the globe [1,2,3,4].
There are several ways to store hydrogen: solid material hydrogen storage, low temperature liquid hydrogen storage, high pressure gaseous hydrogen storage, etc. [5,6]. The most popular and highly developed storage method for hydrogen charging stations and fuel cell vehicles is high pressure hydrogen storage due to its technical simplicity, low energy consumption, relatively mature technology, and charging and discharging filling-releasing rate; however, storage of hydrogen for hydrogen energy is a key issue that needs to be resolved [7]. There is a certain degree of risk for high-pressure hydrogen storage in practical applications. Moreover, there are some problems (such as safe and reliable high pressure storage of hydrogen) that need to be studied commercially. In this working model, the filling process is equivalent to the expansion process from a high to low pressure container, during which the gas temperature of the tank increases significantly. The thermodynamics of this process is different from that of other gases (such as natural gas). The temperature rise of natural gas is significantly lower than that of hydrogen because hydrogen gas compression and the Joule-Thomson coefficient of hydrogen during the isenthalpic expansion process is negative [8]. The main difference with natural gas is the final pressure in the bottles: in CH4 bottles in vehicles, the pressure is in the order of 200–250 bar, while for H2, it is 700 bar.
The literature shows that numerous works have been conducted to study and analyze the temperature rise of hydrogen gas during the fast filling process; the temperature change is very significant. For the sake of safety, GTR-HFCV [9], SAE J2579 [10], ISO15869 [11], ANSI HGV 2 [12] and other standards all stipulate that during the hydrogen fast filling process, the temperature of hydrogen gas should be controlled at −40 °C–85 °C. On the other hand, Tomioka et al. [13], through a large number of experiments, found that temperature changes had a direct effect on the fatigue life of gas cylinders. Therefore, they studied the temperature changes during the hydrogen cycle to find out the law of temperature changes. Based on this, it was necessary to develop a test plan that met the requirements of the standard. Koshimizu et al. [14] simulated fast filling and used numerical analysis methods to study the temperature rise, and found that keeping the tank wall temperature constant was an effective way to reduce the hydrogen temperature. Hirotain et al. [15] carried out fast filling tests of 34 L and 74 L type III tanks with a working pressure of 35 MPa, 65 L type IV tanks, and 41 L type III tanks and 31 L type IV tanks with a working pressure of 70 MPa. The results showed that pressure mode (constant speed, first fast and then slow, first slow and then fast, stepped pressure increase) has no obvious effect on the temperature rise of type III tanks, but had a significant effect on type IV tanks. Modnde et al. [16,17,18] studied the change of convective heat transfer coefficient through the fast filling test, and conducted a three-stage fast filling test, indicating that three-stage filling was one of the effective ways to solve the excessive temperature rise. Monde et al. [19] established a thermodynamic model to study the effect of convective heat transfer coefficient on temperature rise, and showed that it was feasible to calculate temperature rise with a suitable constant heat transfer coefficient. Galassi [20,21,22,23], Heitsch [24] Acosta [25], and Melideo [26] from the Energy Research Institute of the EU Joint Research Center published a series of articles introducing a high-pressure gas fast filling test bed (GASTEF) developed by the institute, which conducted 70 MPa fast filling tests of 40 L type III tanks, 19 L, and 29 L type IV tanks, established a three-dimensional numerical simulation model, and studied the effects of filling conditions and pre-cooling temperature on the temperature rise of fast filling. Dicken et al. [27,28] conducted fast filling experiments on 35 MPa, 74 L type III gas cylinders with different initial pressures and different pressure rise rates. Since 63 thermocouples were installed in the test cylinder, a detailed distribution of the temperature in the cylinder was obtained. Hosseini et al. [29] studied the effect of initial conditions on temperature rise based on energy analysis, and found that a higher initial pressure resulted in smaller final temperature rise. Liu Yanlei [30] and Zhao Lei [31] conducted fast filling tests and two-dimensional numerical simulations on 35 MPa and 150 L type III gas cylinders, respectively, and revealed the influence of refueling parameters on temperature rise. Zhao Yongzhi et al. [32] established a two-dimensional axisymmetric model of 70 MPa fast charging temperature rise, and used the model to study the effect of the boost mode and boost rate on the hydrogen temperature rise in the cylinder during fast charging. Zheng Jinyang et al. [33] developed a 70 MPa fast charging temperature rise test device, conducted the first 70 MPa fast charging experiment in China, and analyzed the influence of the gas cylinder structure on the temperature rise. Kim et al. [34] and Suryan et al. [35] carried out 35 MPa and 72 L type IV bottle fast filling tests, respectively, and established a three-dimensional numerical simulation model based on mass imports. Strieding et al. [36], through 35 MPa, 23.5 L type I cylinder (steel cylinder) test and thermodynamic simulation, studied the phenomenon of fast charging temperature rise, and found that the Joule-Thomson effect has no significant effect on the temperature rise, and proposed the filling of hydrogen trucks. Wang Ying et al. [37] conducted a design study on the hydrogen supply system of a 70 MPa hydrogen storage cylinder for automobiles, and designed a complete hydrogen supply system with an ionic liquid compressor. In 2020, Zhao Zhiyong et al. [38] conducted a numerical study on the fast charging process of a vehicle-mounted hydrogen storage cylinder. The study showed that the temperature rise of hydrogen in type IV cylinders was higher than that in type III cylinders and the position of the highest hydrogen temperature in type II and IV cylinders. However, all these studies were based on the hydrogen tank type geometry of the hydrogen tank types, and therefore lacked the universal applicability for temperature rise of hydrogen gas analysis.
In this paper, we have two main extensions based on previous work review. First, final hydrogen temperature from the theoretical adiabatic condition is estimated based on mass and energy balance method. Theoretical formulae fits experimental/simulated data very well. Second, the simulation results for non-adiabatic filling were compared with the theoretically calculated ones for adiabatic conditions. This study used a shear stress transport (k-ω) and NIST real gas model that includes corrections to test the thermal effects during the filling of a hydrogen storage tank (50 MPa, 343 L). In order to verify our simulation model, the pressure variation during a filling process was compared with the experimentally measured pressure values. There was good agreement in pressure variation with the experimentally measured ones for the fast filling process. The simulation results for non-adiabatic filling were then compared with the theoretically calculated ones for adiabatic conditions. The results of this study will be very useful in future hydrogen energy research and hydrogen charging station development.

2. Test Methods and Procedure

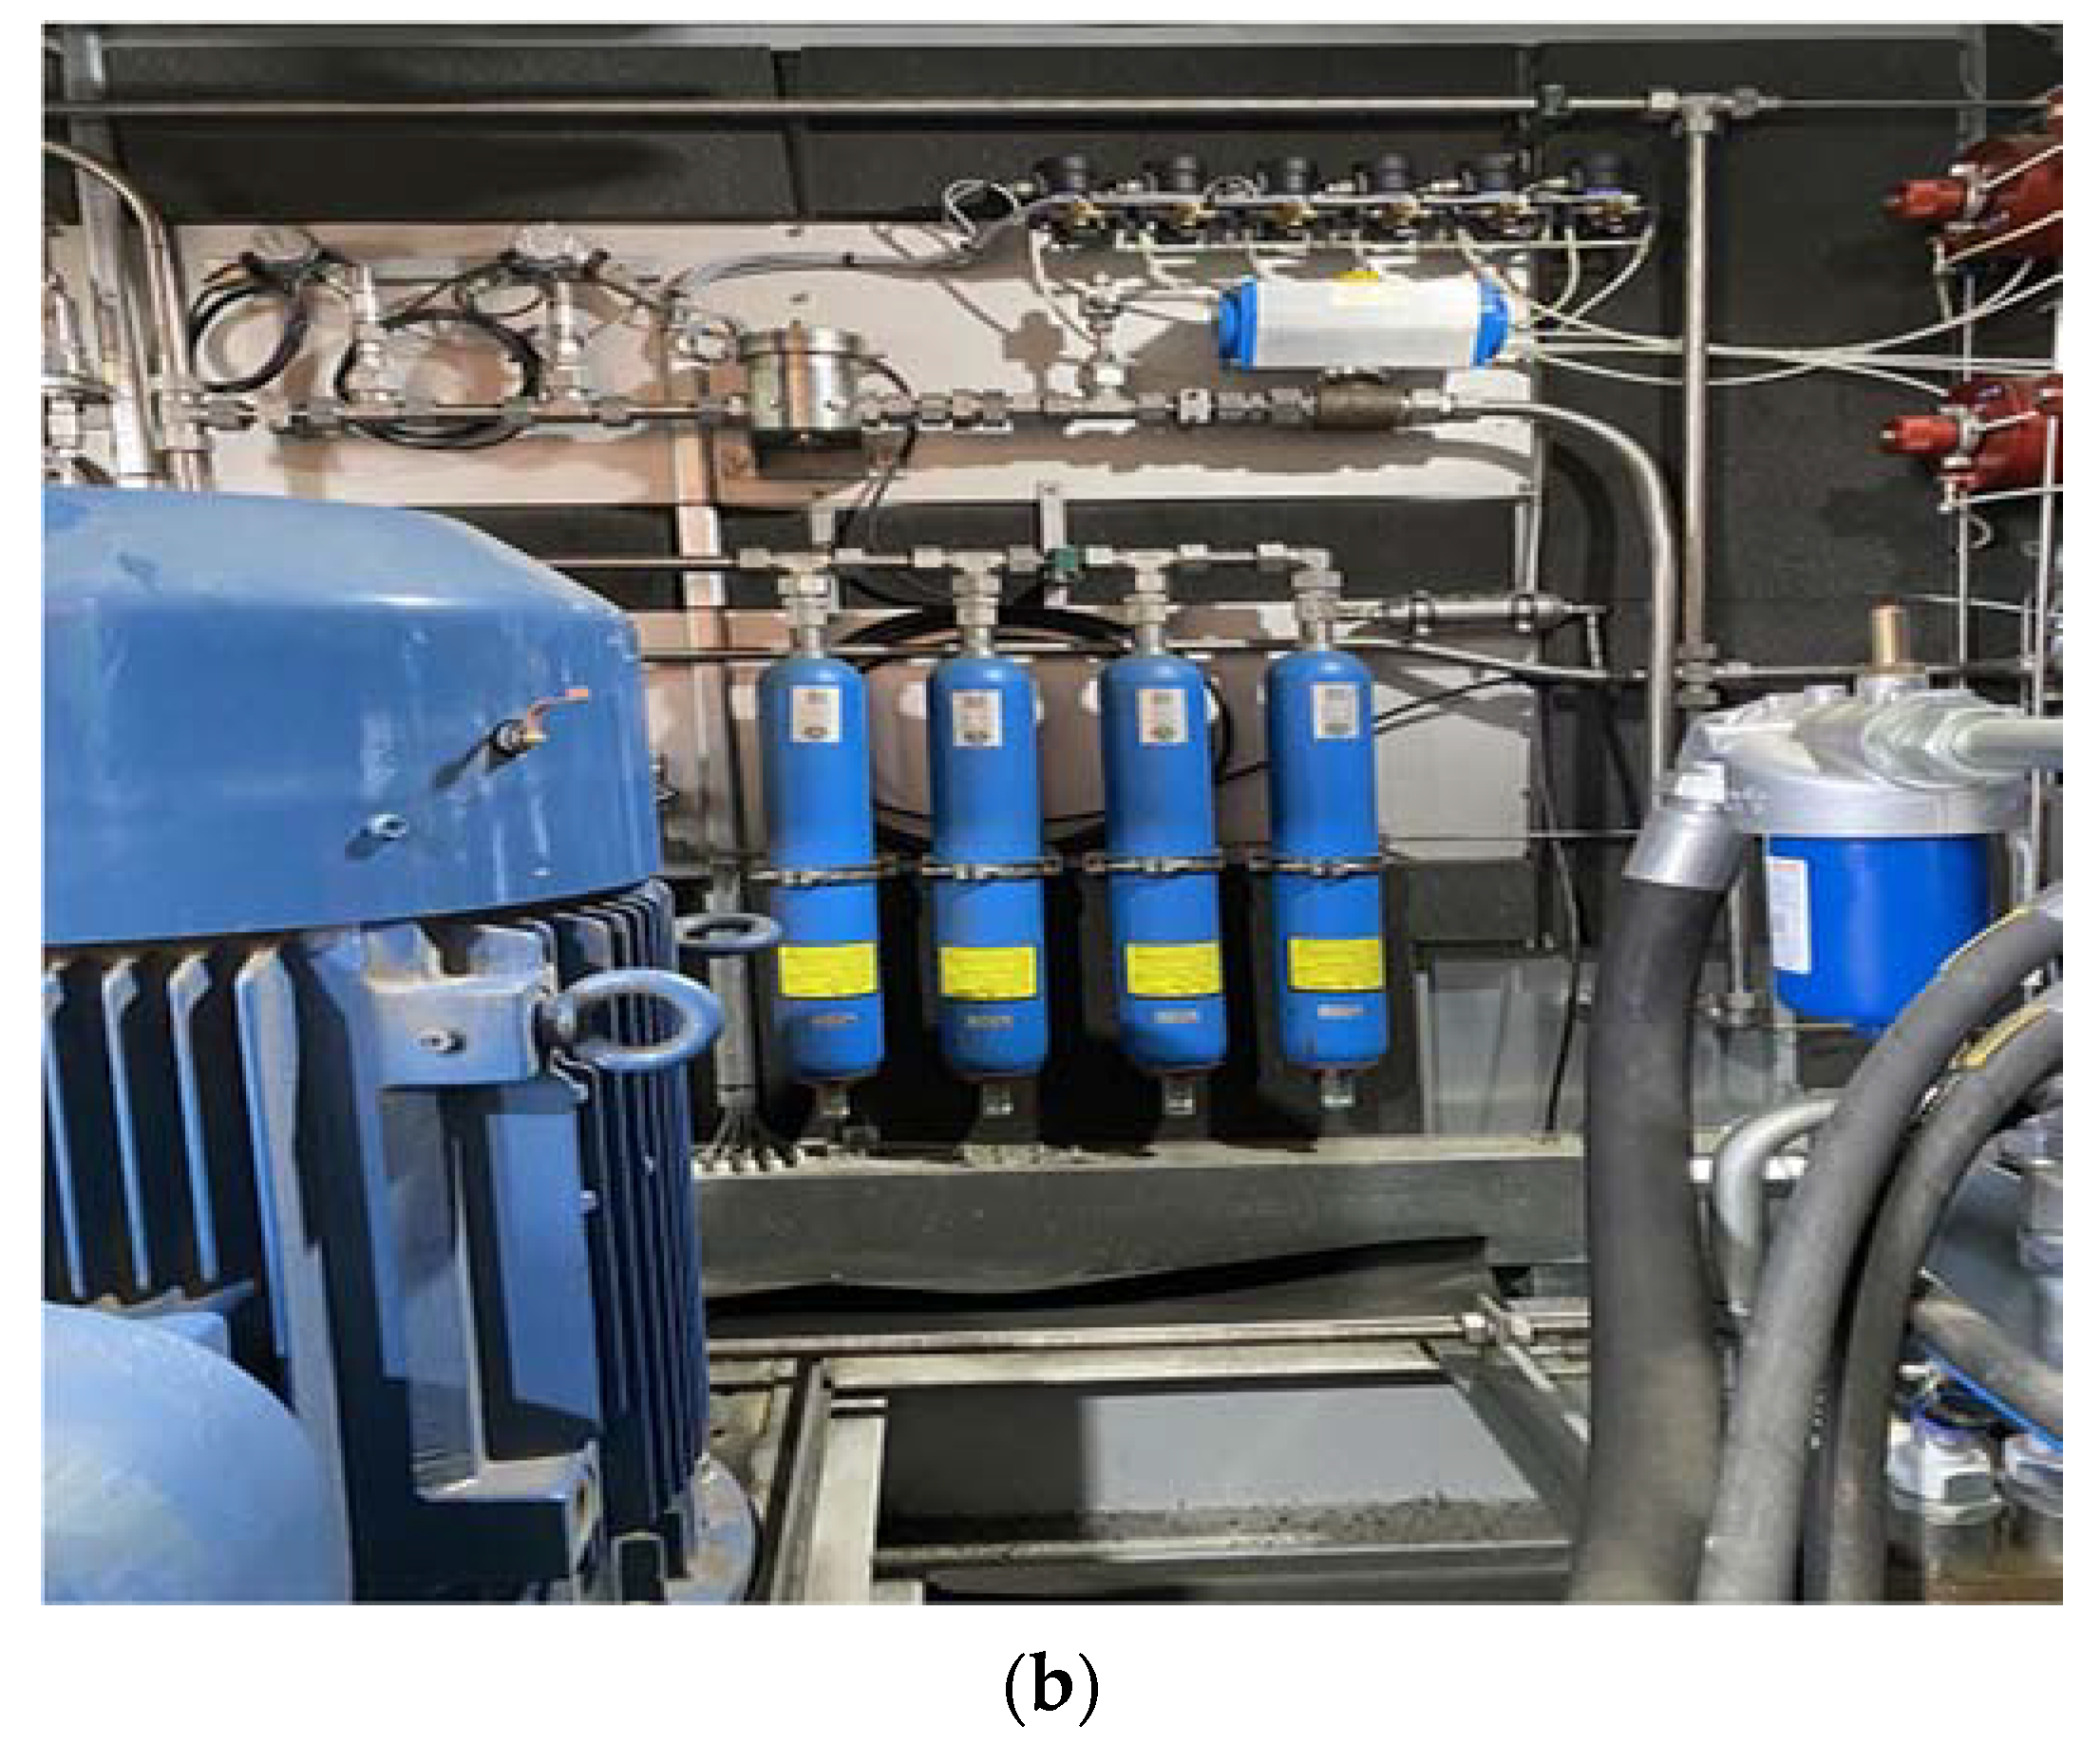
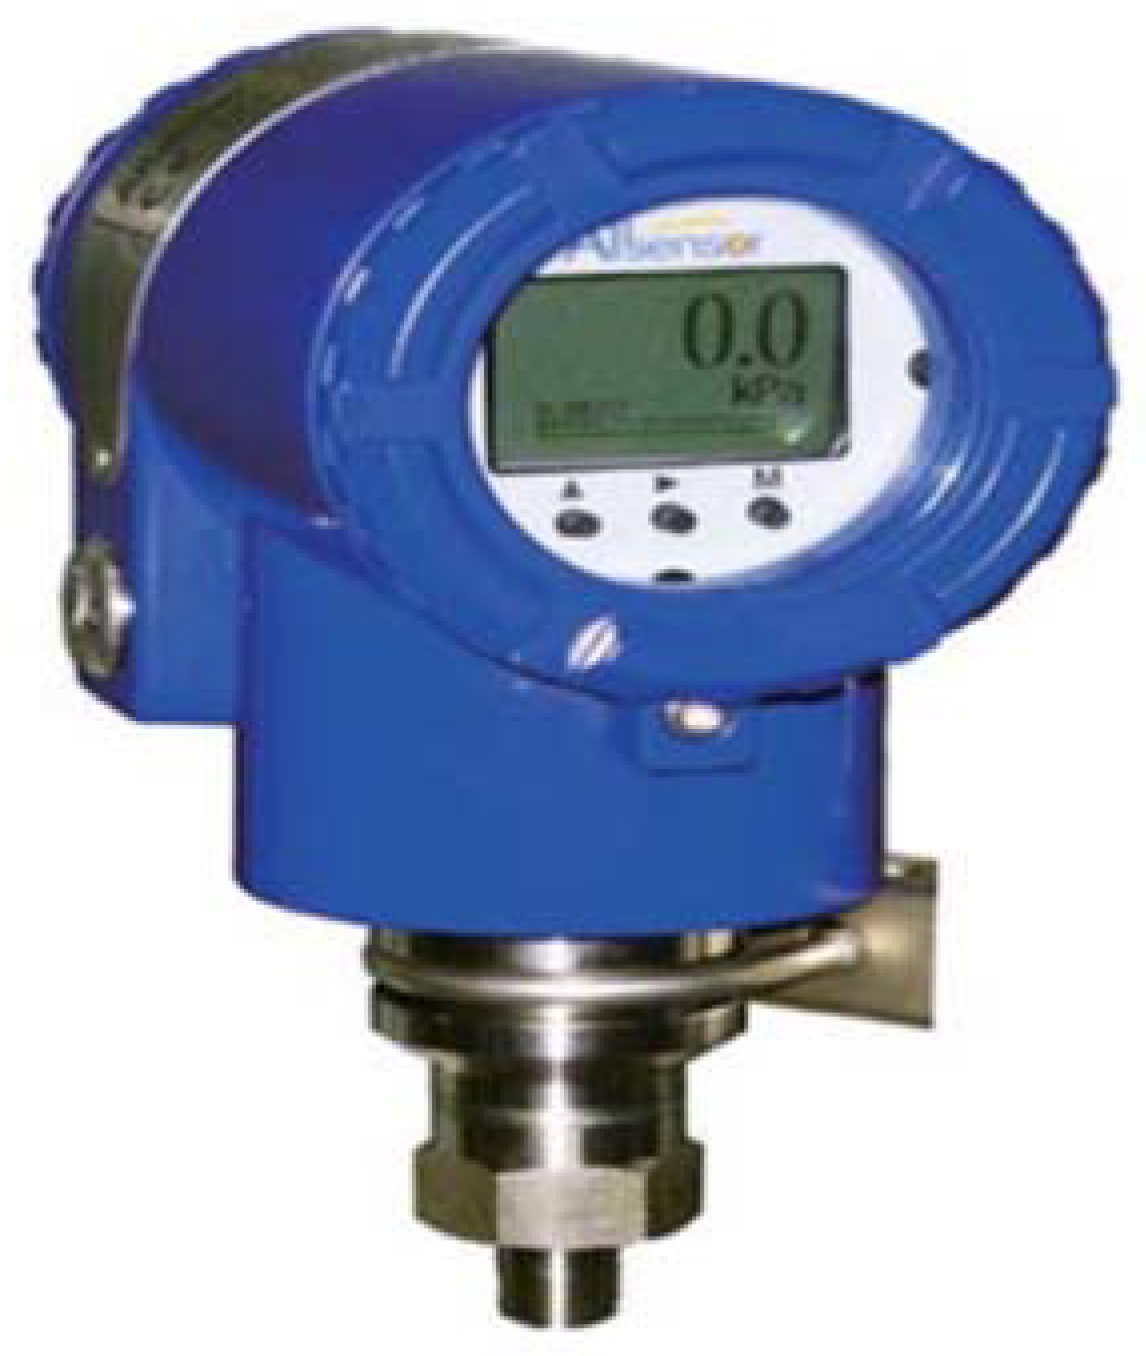
The hydrogen compression cycle system recycles the hydrogen compressed by a compressor at high pressure and stores it in a high-pressure container. When hydrogen gas filling was started in a vacuum state, the condition inside the container of the high pressure tank and the buffer tank was called the first cycle analysis, and when the filling process was started in the remaining condition, it was called the second cycle analysis. When the residual pressure of 11.3 MPa was presented in the high-pressure tank of the second cycle, the pressure that changed in the charging process was measured through experiments. As shown in Figure 1, a two-stage compressor and a high-pressure vessel was used in the experiment. Figure 2 shows the sensors measuring pressure and temperature on the hydrogen tank. The pressure uses a pressure transmitter (P601 series); sensor error is ±0.25%.

3. Hydrogen Charging Modeling inside the High Pressure Vessel

3.1. System Analysis

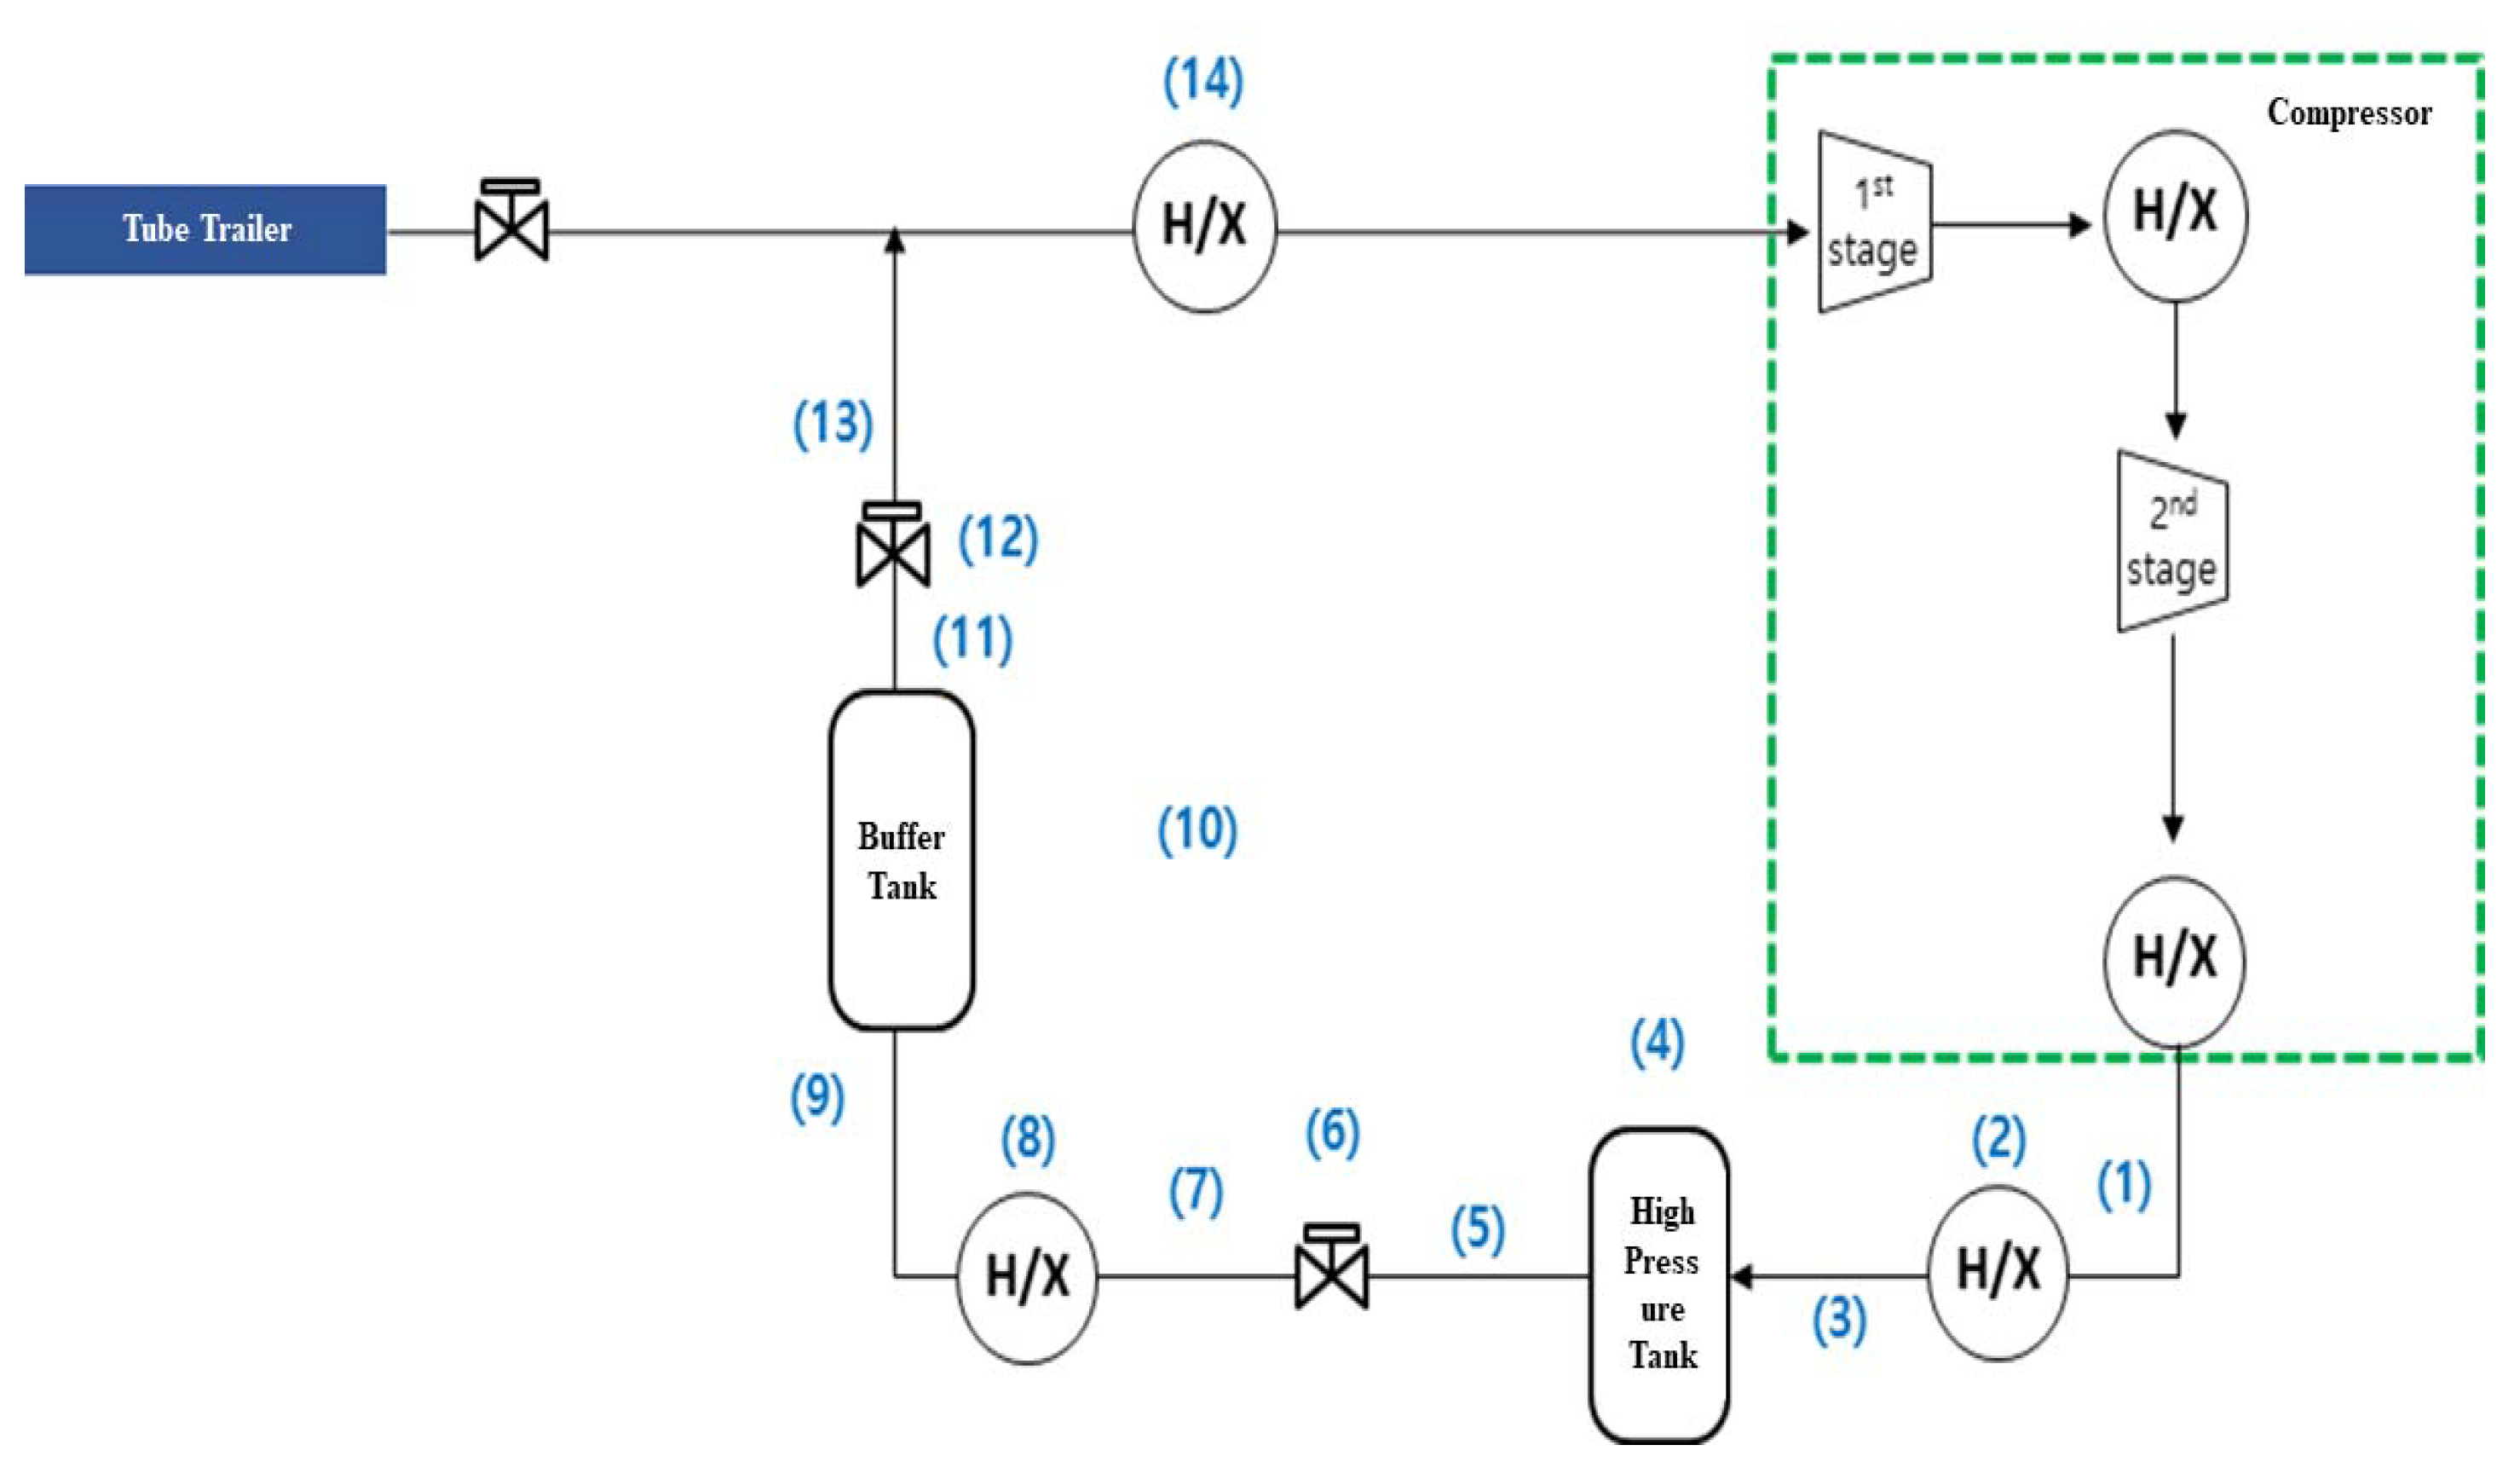
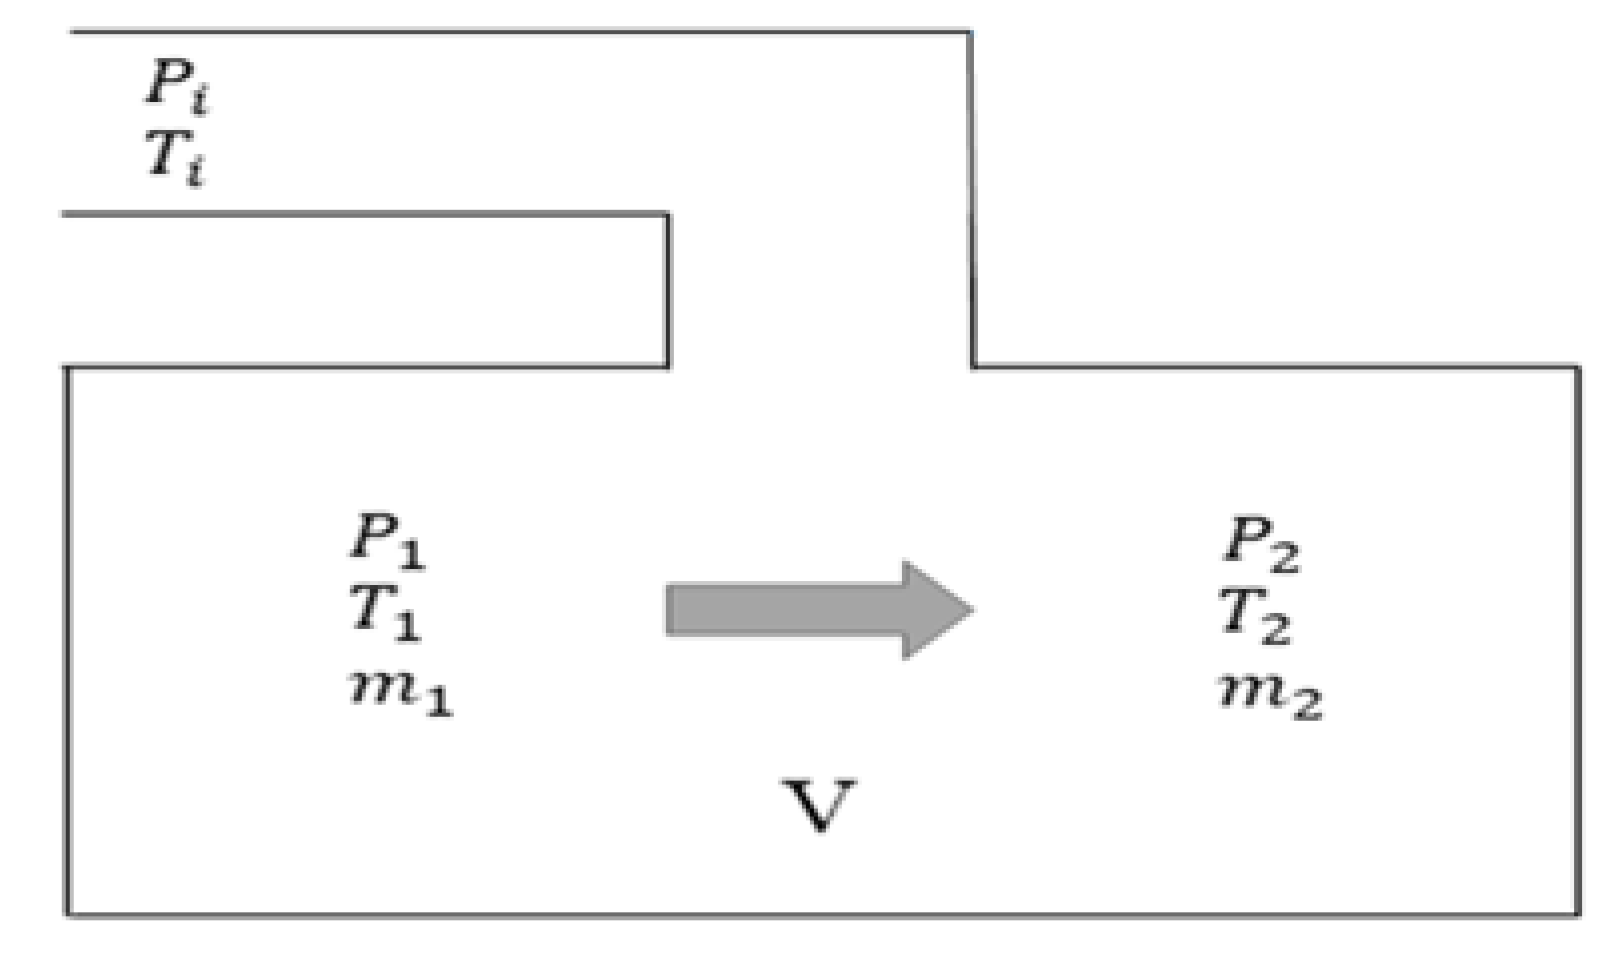
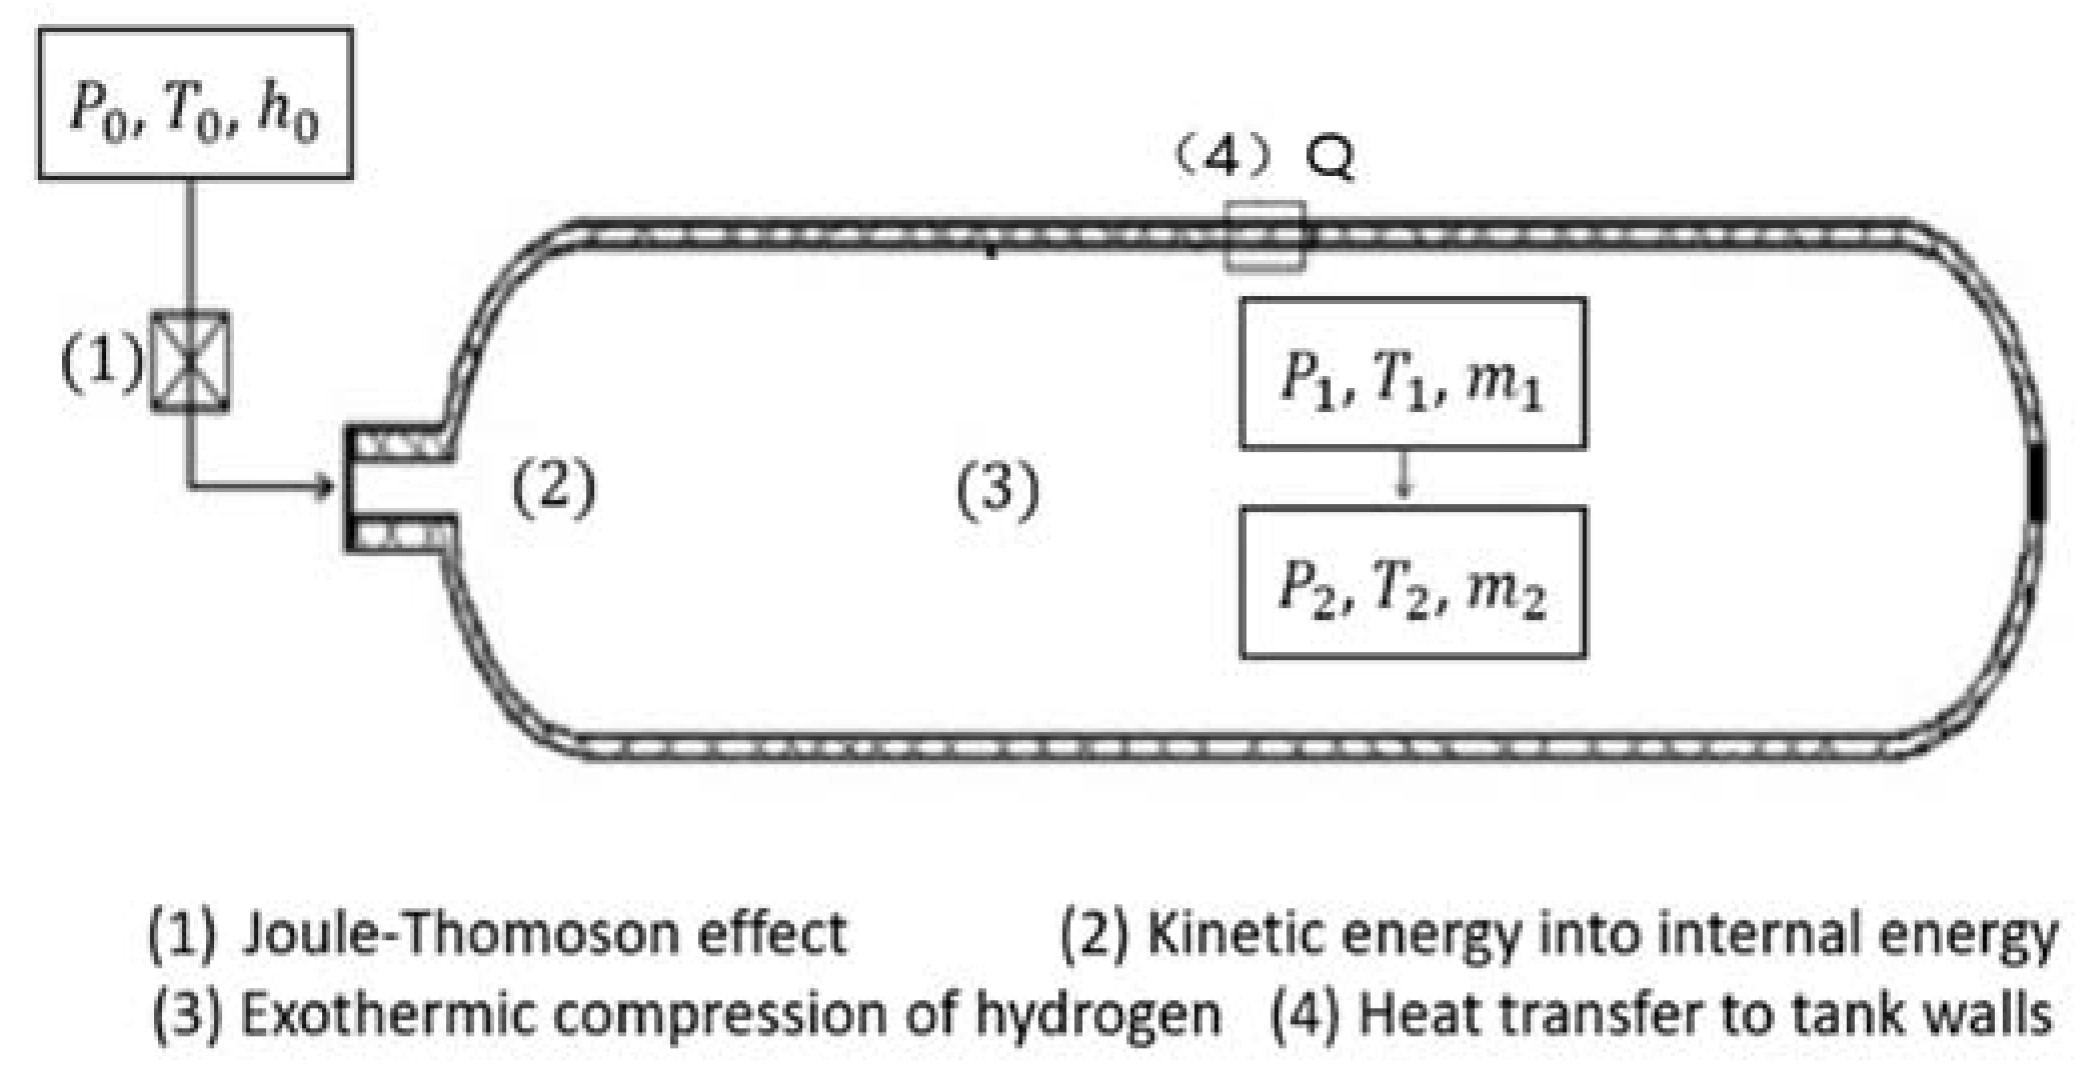
Figure 3 shows the overall system structure of the experiment [39]. After the hydrogen gas is discharged from the hydrogen storage tank trailer and compressed by a two-stage compressor, the compressed hydrogen gas passes through the heat exchanger and stores the low temperature and high pressure hydrogen gas in the tank (4) and the buffer tank (11). After the hydrogen is consumed, the system repeats the above process. As shown in Figure 3, the first and second stage are compressors, and H/X are the heat exchangers. (2), (8), and (14) are heat exchangers, (4) is the high pressure tank, (11) is the buffer tank, and (6), (12) are pressure reducing valves. (1), (3), (5), (7), (9), (11), and (13) are the inlet and outlet areas of the high pressure tank, heat exchanger, and pressure reducing valve. The description in temperature, pressure, and mass in the tank when hydrogen is filled into the high pressure tank and the buffer tank in the entire fast-filling system, is shown in Figure 4. Table 1 shows the initial data in high pressure storage. P i and T i are the inflow pressure and temperature flow into the high pressure tank; P 1 , T 1 , m 1 are the initial pressure, temperature, and mass in the high pressure tank; T 2 , P 2 , m 2 are the temperature, pressure, and mass in the high pressure tank after hydrogen filling process is completed.

3.2. Thermodynamic Analysis of the Filling Process

3.2.1. Model Assumptions

Figure 5 shows the thermodynamic exchange in the entire system. During the rapid hydrogen charging process, the state of the gas in the hydrogen cylinder is constantly filling, which is a process of thermodynamic change. The actual fast filling process needs to be simplified as necessary. The process of filling hydrogen in a high-pressure container is the process of storing hydrogen that has passed through the compressor in the container. During this process, the temperature of hydrogen increases; thus, the following assumptions helps to further analyze the fast filling process.
During the filling process, the natural convection heat exchange coefficient of the outer wall of the hydrogen tank is constant, and the ambient temperature is constant, T a m b = Measured value.
The material of the hydrogen cylinder is stainless steel, and the thermal conductivity of stainless steel is regarded as isotropic, and its thermal conductivity is considered constant; k = 16.3   W / ( m · K )
The temperature of the hydrogen that flows into the hydrogen tank is constant.
The gas in the compressed hydrogen storage tank is evenly distributed in pressure and temperature, and the temperature of the tank wall is also evenly distributed.
Consider the buoyancy effect caused by gravity.
The inlet boundary of the high-pressure hydrogen tank is a pressure inlet boundary constrained by variable conditions.
Solid components in the hydrogen gas cycling are rigid bodies without mechanical deformation.
Since the temperature and pressure changes drastically during filling, the corresponding physical parameters vary greatly. In order to get the simulation analysis closer to the actual working conditions, the gas in the filling process is regarded as a real gas. Functions of temperature and pressure used real gas parameters.

3.2.2. Model Equations

In the simulation model, the effects of heat transfer, turbulence, and NIST real gas are fully considered. The mass and energy balance equations of hydrogen are established. The control equations of the model are described as follows [40]:
Mass conservation equation:
ρ t + · ( ρ v ) = 0
Momentum equation:
t ( ρ v ) + · ( ρ v v ) = p + · ( τ ¯ ) + ρ g
Energy conservation equation:
t ( ρ E ) + · ( v ( ρ E + p ) ) = · { k g e f f T + [ τ ¯ · v ] }
where t is time, ρ is density of hydrogen gas, v is the Favre average of velocity, p is static pressure, τ ¯ is stress tensor, τ ¯ = μ [ v 2 / 3 · v I ] .
The transport equations for the shear stress transport (SST) k-omega model are:
t ( ρ k ) + · ( ρ U k ) = · [ ( μ + μ t σ k ) k ] + G k 1 β · ρ k ω
t ( ρ ω ) + · ( ρ U ω ) = · [ ( μ + μ t σ ω ) ω ] + G ω β ρ ω 2 + D ω
For turbulence modeling, the shear-stress transport (SST) k-ω model is chosen because of its robustness, computational economy, and good accuracy for turbulent flows with heat transfer. The model blends the robust and accurate formulation of the k-ω model in the near-wall region with the free-stream independence of the k-ε model in the far field. In the equations, G k 1 represents generation of turbulence kinetic energy due to mean velocity gradients, D ω the cross-diffusion term, σ k   and   σ ω are turbulent Prandtl numbers. In this test, the change law of the physical properties of hydrogen according to temperature and pressure is obtained through REFPROP 9.5 software, and the data obtained from REFPROP software is shared with simulation data, so that the simulation state is closer to the experimental situation. Since at high pressure, the ideal gas law is not capable of accurately describing the pressure behaviour, a real gas equation of state was used (Modified Benedict Webb Rubin [MBWR]):
P = n = 1 9 α n ρ n + exp [ ( ρ / ρ c r i t ) 2 ] n = 10 15 α n ρ 2 n 17
In this equation, ρ c r i t is the critical density, α n is the function of temperature. It is a temperature function composed of 32 adjustable parameters. The thermodynamic properties can be found in the references [41,42,43,44,45].

3.3. CFD Simulation Method

In this study, a solver based on 3D pressure was applied to the numerical simulation for the compressed hydrogen gas cycling. PISO algorithm is adopted for simulation calculation [38]. The user-defined function expands and improves the simulation calculation model. This model uses pressure and velocity coupling algorithms. The discrete calculation methods can be used as: standard pressure dispersion, momentum equation, turbulence energy and its dissipation rate calculation equation, the energy equation that also uses first-level upwind dispersion, and first-level implicit instantaneous equation. The fast filling process in the tank requires a transient solution. The time step should be suitable to ensure grid convergence. Therefore, the time step is set to be 0.01 s. A three-dimensional graph of the hydrogen storage bottle is shown in Figure 6. The diameter of the injector was 20 mm; the cylinder composed of two parts: a stainless steel solid shell and internal fluid (hydrogen gas). The specification and properties of the high pressure tank are shown in Table 2.
The heat exchange model between the gas and the storage tank wall is a key parameter of the mathematical model, but the obtained heat transfer coefficient needs to be close to the coefficient of the actual filling process. T. Bourgeois et al. [41] developed a heat transfer correlation for the actual filling process, as follows:
N u D i n = D h k = 0.14 R e d i n 0.67
The scope of application of Reynolds number and Rayleigh number are respectively given by:
6.6 × 10 4 < R e d i n < 1.8 × 10 5   and   6.3 × 10 10 < R a D i n t < 1.3 × 10 11
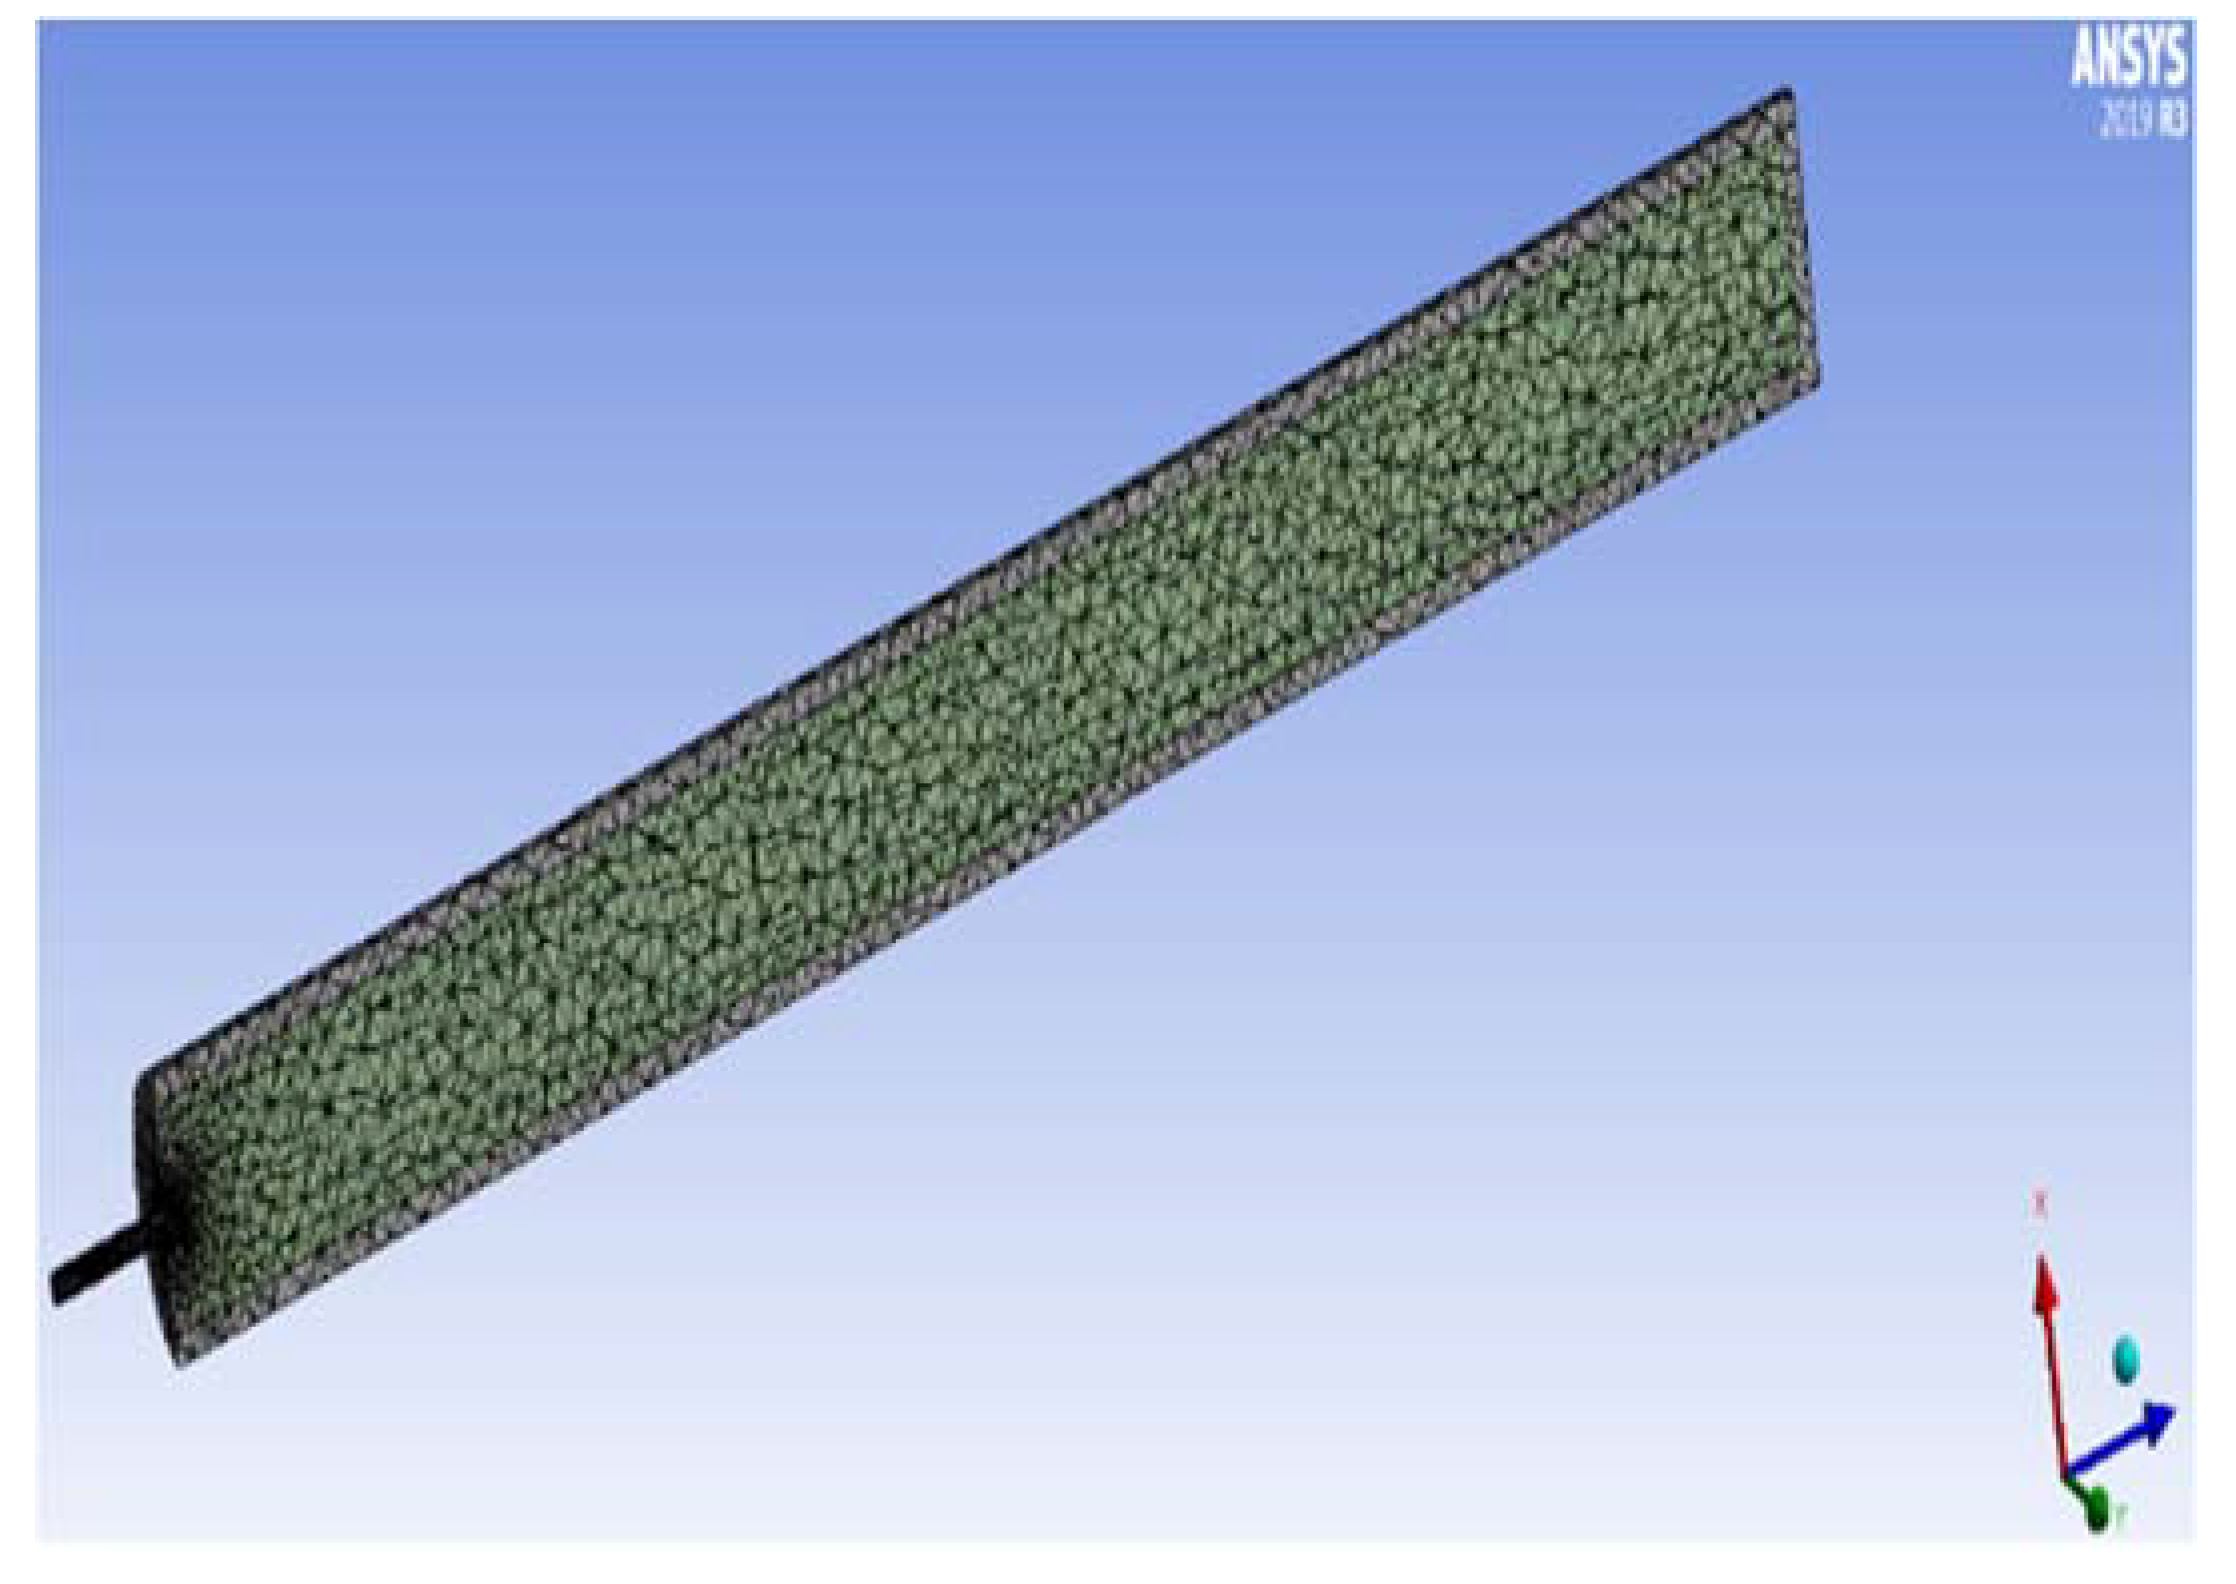
The geometry of the hydrogen storage tank used for simulation is illustrated in Figure 7. The details of properties of tank material and hydrogen are given in Table 3. The geometry is divided into two areas: a fluid area filled with hydrogen and a solid area. The influence of three grid densities on prediction accuracy was analyzed by using the number of cells. Therefore, this simulation uses a grid with 53,485 cells.

3.4. Thermodynamic Method

During the rapid hydrogen charging process, the state of the gas in the hydrogen cylinder was constantly changing, which was a process of thermodynamic change. The following assumptions are useful for further analysis of the rapid filling process.
The temperature and pressure in the initial hydrogen tank are constant.
The volume of the hydrogen tank is constant, ignoring the kinetic energy and potential energy of the hydrogen.
The filling process of the compressed hydrogen in a high-pressure container through a compressor is an adiabatic process, and no heat exchange is made with the outside.
The control equations of the model are described as follows:
Mass conservation equation:
d m d t = m ˙ i m ˙ e
Energy conservation equation:
d E d t = Q ˙ W ˙ + m ˙ i h i m ˙ e h e
Abel-Nobel equation of state:
p = ρ R T 1 B ρ
The present study used the Abel-Nobel equation of state for the real gas model. In this equation, B = 0.007691 m3 for hydrogen gas. Compared with the NIST (REFPROP9.5) data, the results obtained from Equation (10) have a relative error no more than 4% in the range of 300 K < T < 410 K for high pressure gaseous hydrogen [46]. The solutions of the mass balance Equation (8) and energy conservation Equation (9) are as follows:
m 2 ( h i u 2 ) = m 1 ( h i u 1 )
u = c v T ,   h = c p T
From Equations (10) to (12), the following equations are obtained:
Q = m 2 c v 2 T 2 m 1 c v 1 T 1 ( m 2 m 1 ) c p 0 T i
By using the Abel-Nobel equation of state, the following equation is obtained:
T 2 = P 2 T 0 c p 0 + P 2 B R [ R Q V + P 1 c v 1 T 1 R R T 1 + B P 1 P 1 c p 0 T i R R T 1 + B P 1 ] P 2 c v 2 R Q V P 1 T 1 c v 1 R R T 1 + B P 1 + P 1 T i c p 0 R R T 1 + B P 1
According to the measured pressure value, the final temperature T 2 was calculated by Equation (14). Equation (14) was thermodynamically derived under the condition of adiabatic filling process. Equation (14) for temperature rise calculation of storage cylinder has been put forward based on the state equation of real hydrogen gas and thermodynamic theory. Validation of the fitting formula for final temperature with experimental data is conducted.

4. Results and Discussion

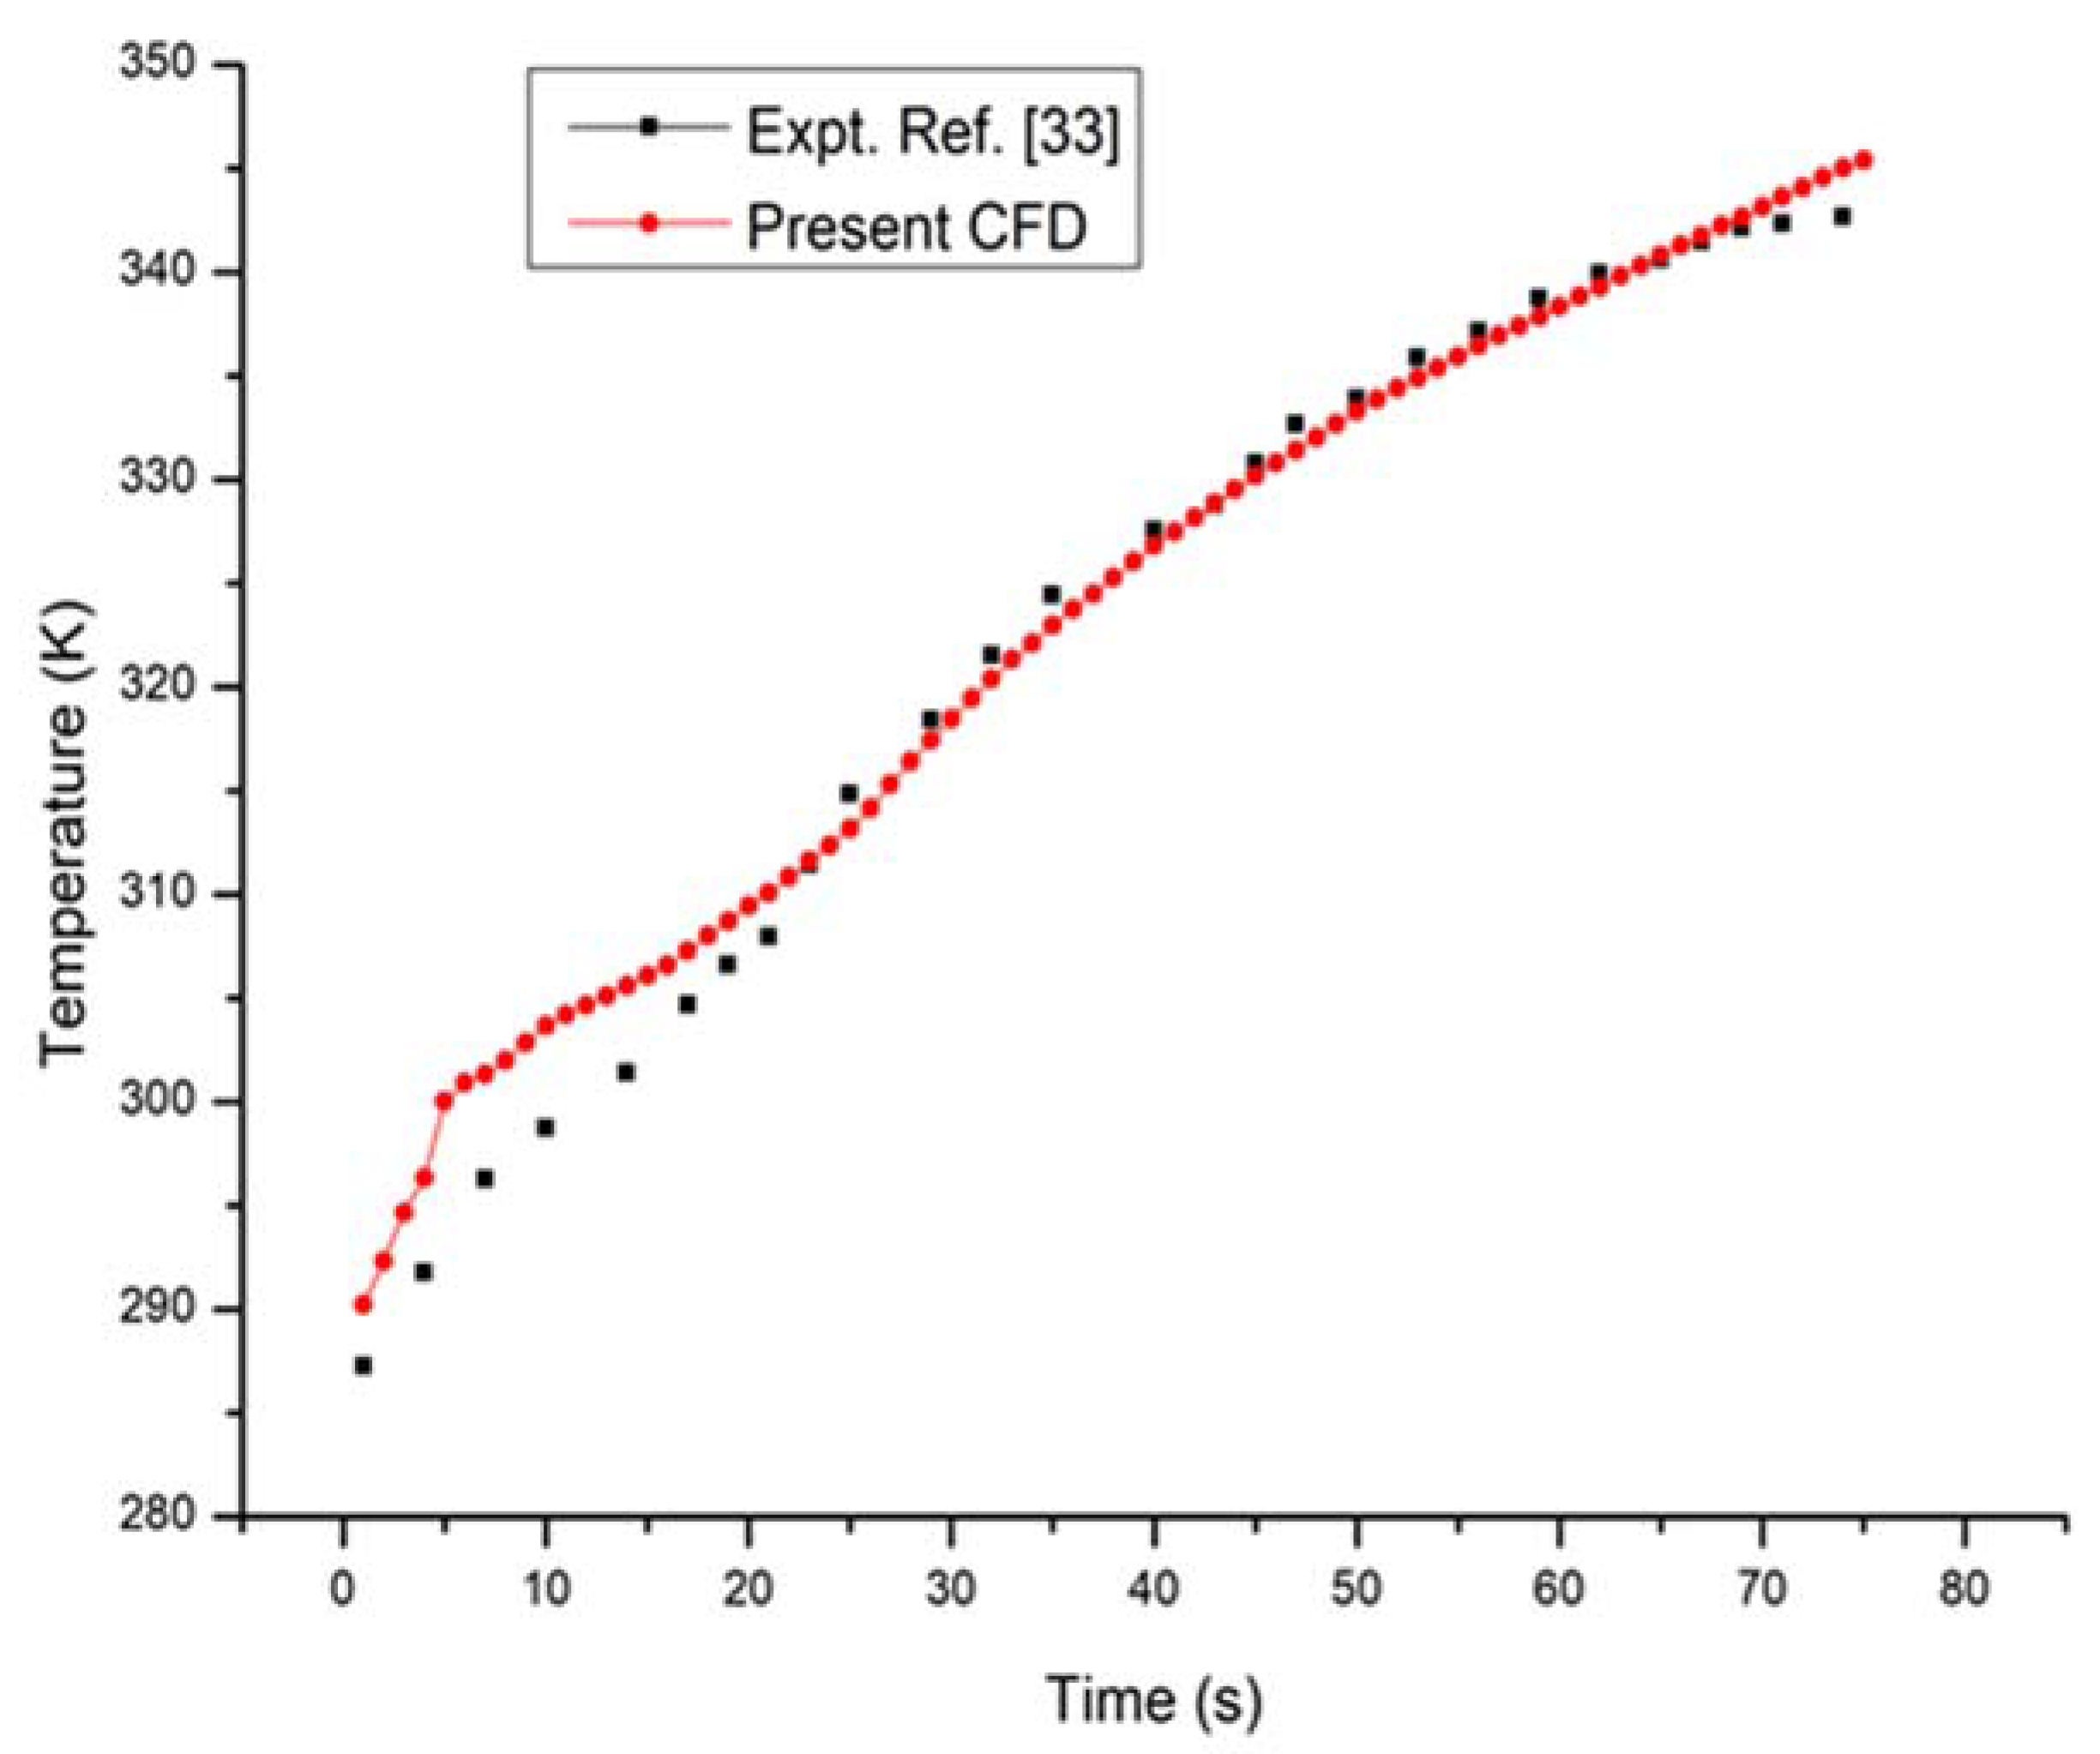
To verify the accuracy of the simulation model, a set of experimental data were selected for simulation from Ref. [33,47]. Figure 8 shows a comparison of the experimental and simulated temperature data. It can be seen that adopting the temperature with simulation filling to the almost same temperature rise as the experimental filling. The simulation results agree with the experiment data, which show that the simulation model has a high accuracy in predicting the temperature rise for the fast filling process. The deviation may be mainly caused by the above assumptions, the residual error of the inlet pressure profile, and real experimental conditions.
In the fast filling process, the temperature distribution in the hydrogen tank attracts a lot of attention. The gas temperature in the cylinder is gradually non-uniformly increased, axially and radially. During the filling process, the highest temperature occurs in the caudal region opposite, while the lowest temperature occurs near the inlet. With the gradual increase in in-cylinder gas temperature, heat is transferred from the gas to the inner wall, and leads to a stainless steel wall in temperature rise. Finally, heat is transferred from the tank to the surrounding environment through natural convection. Figure 9 shows the temperature distributions of hydrogen in the hydrogen tank. It can be seen that the distribution of temperature is relatively uniform. As can be seen from the temperature cloud diagram, there is significant temperature gradient in the hydrogen tank. The highest temperature appears at the central area and a local high temperature area with a slightly lower temperature at the bottom of the cylinder. The main reason for this is because fluid retention reduces the effect of convective heat transfer. The center temperature is the highest, and the outside temperature is slightly lower than the inside temperature. There are two reasons for this: One is because the external heat transfer coefficient is lower than the internal heat transfer coefficient. Secondly, there is an obvious temperature gradient along the jet path. The standard deviation in hydrogen temperature with the cylinder (not including the injection path) is relatively small, showing good temperature uniformity.
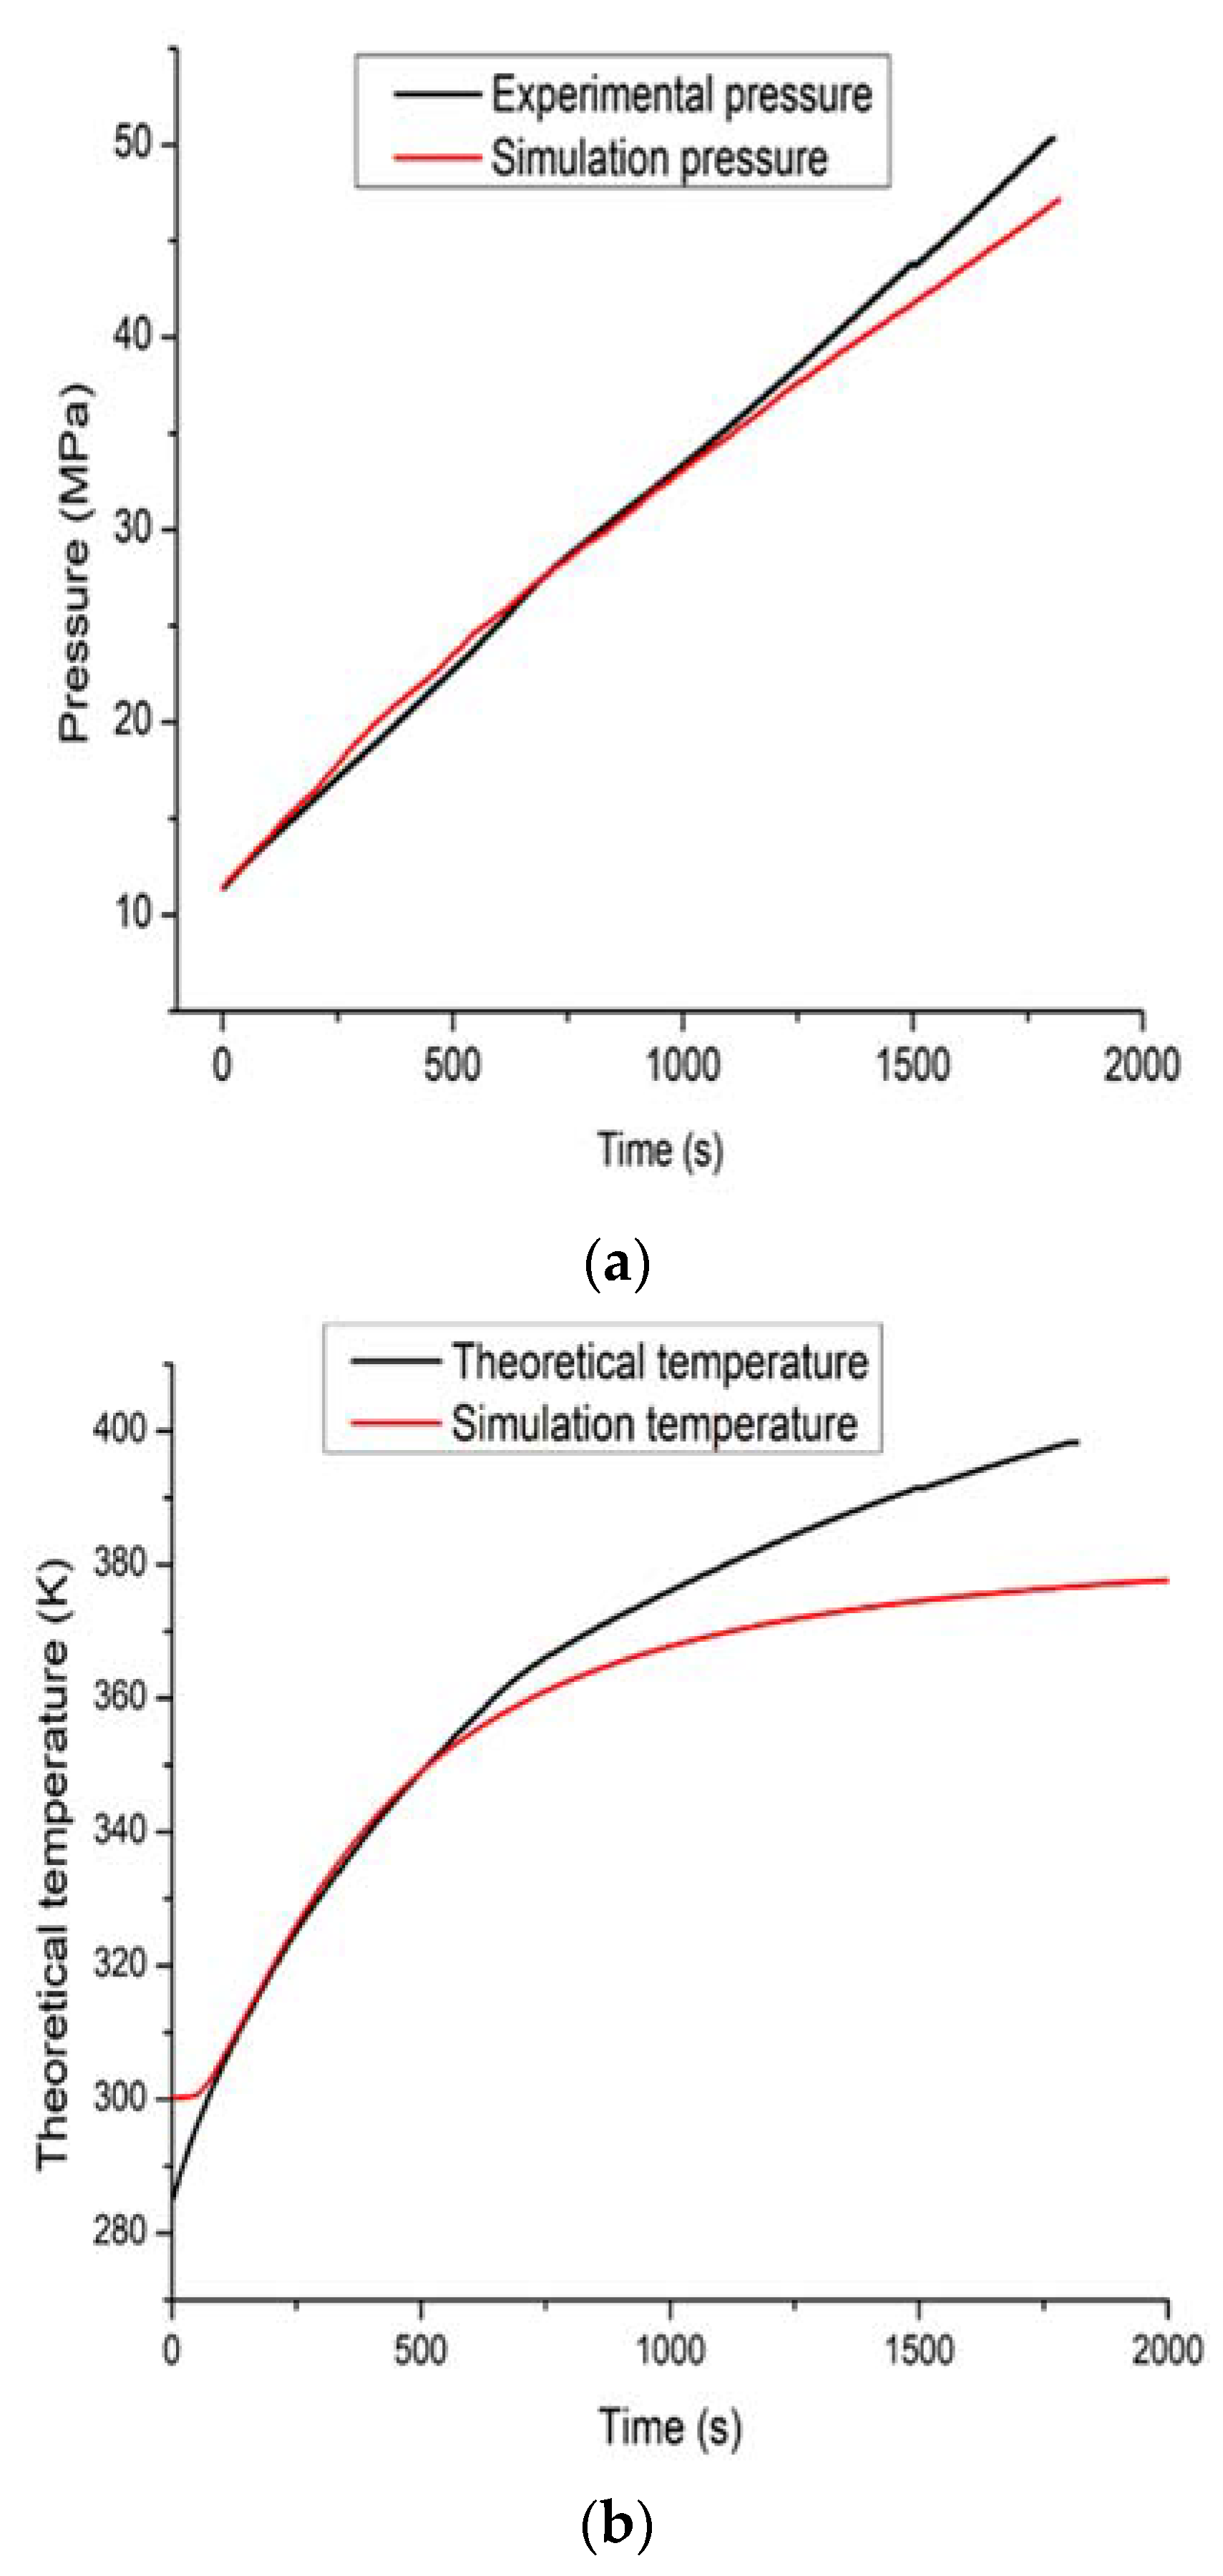
Figure 10 shows the rise in gas pressure and temperature over time. Figure 10a shows the comparison of the experimental and simulated pressure. The simulation results generally agree with the experiment data, and the deviation may be mainly caused by the above assumptions and the setting of inlet boundary. The error is obtained from linear regression of experimental data. Figure 10b shows the comparison of the simulation temperature and theoretical temperature that was calculated by Equation (14). The temperatures calculated from the simulation non-adiabatic condition results were lower than those from the theoretical adiabatic condition calculation. The maximum temperature in the tank grows rapidly at the onset of fast filling, and then the increase slows down, with a steady temperature near the end of the filling process. This is because in the fast filling process in the latter, the mass flow is small, and the heat absorption power of the stainless steel wall is greater than the temperature effect during filling.
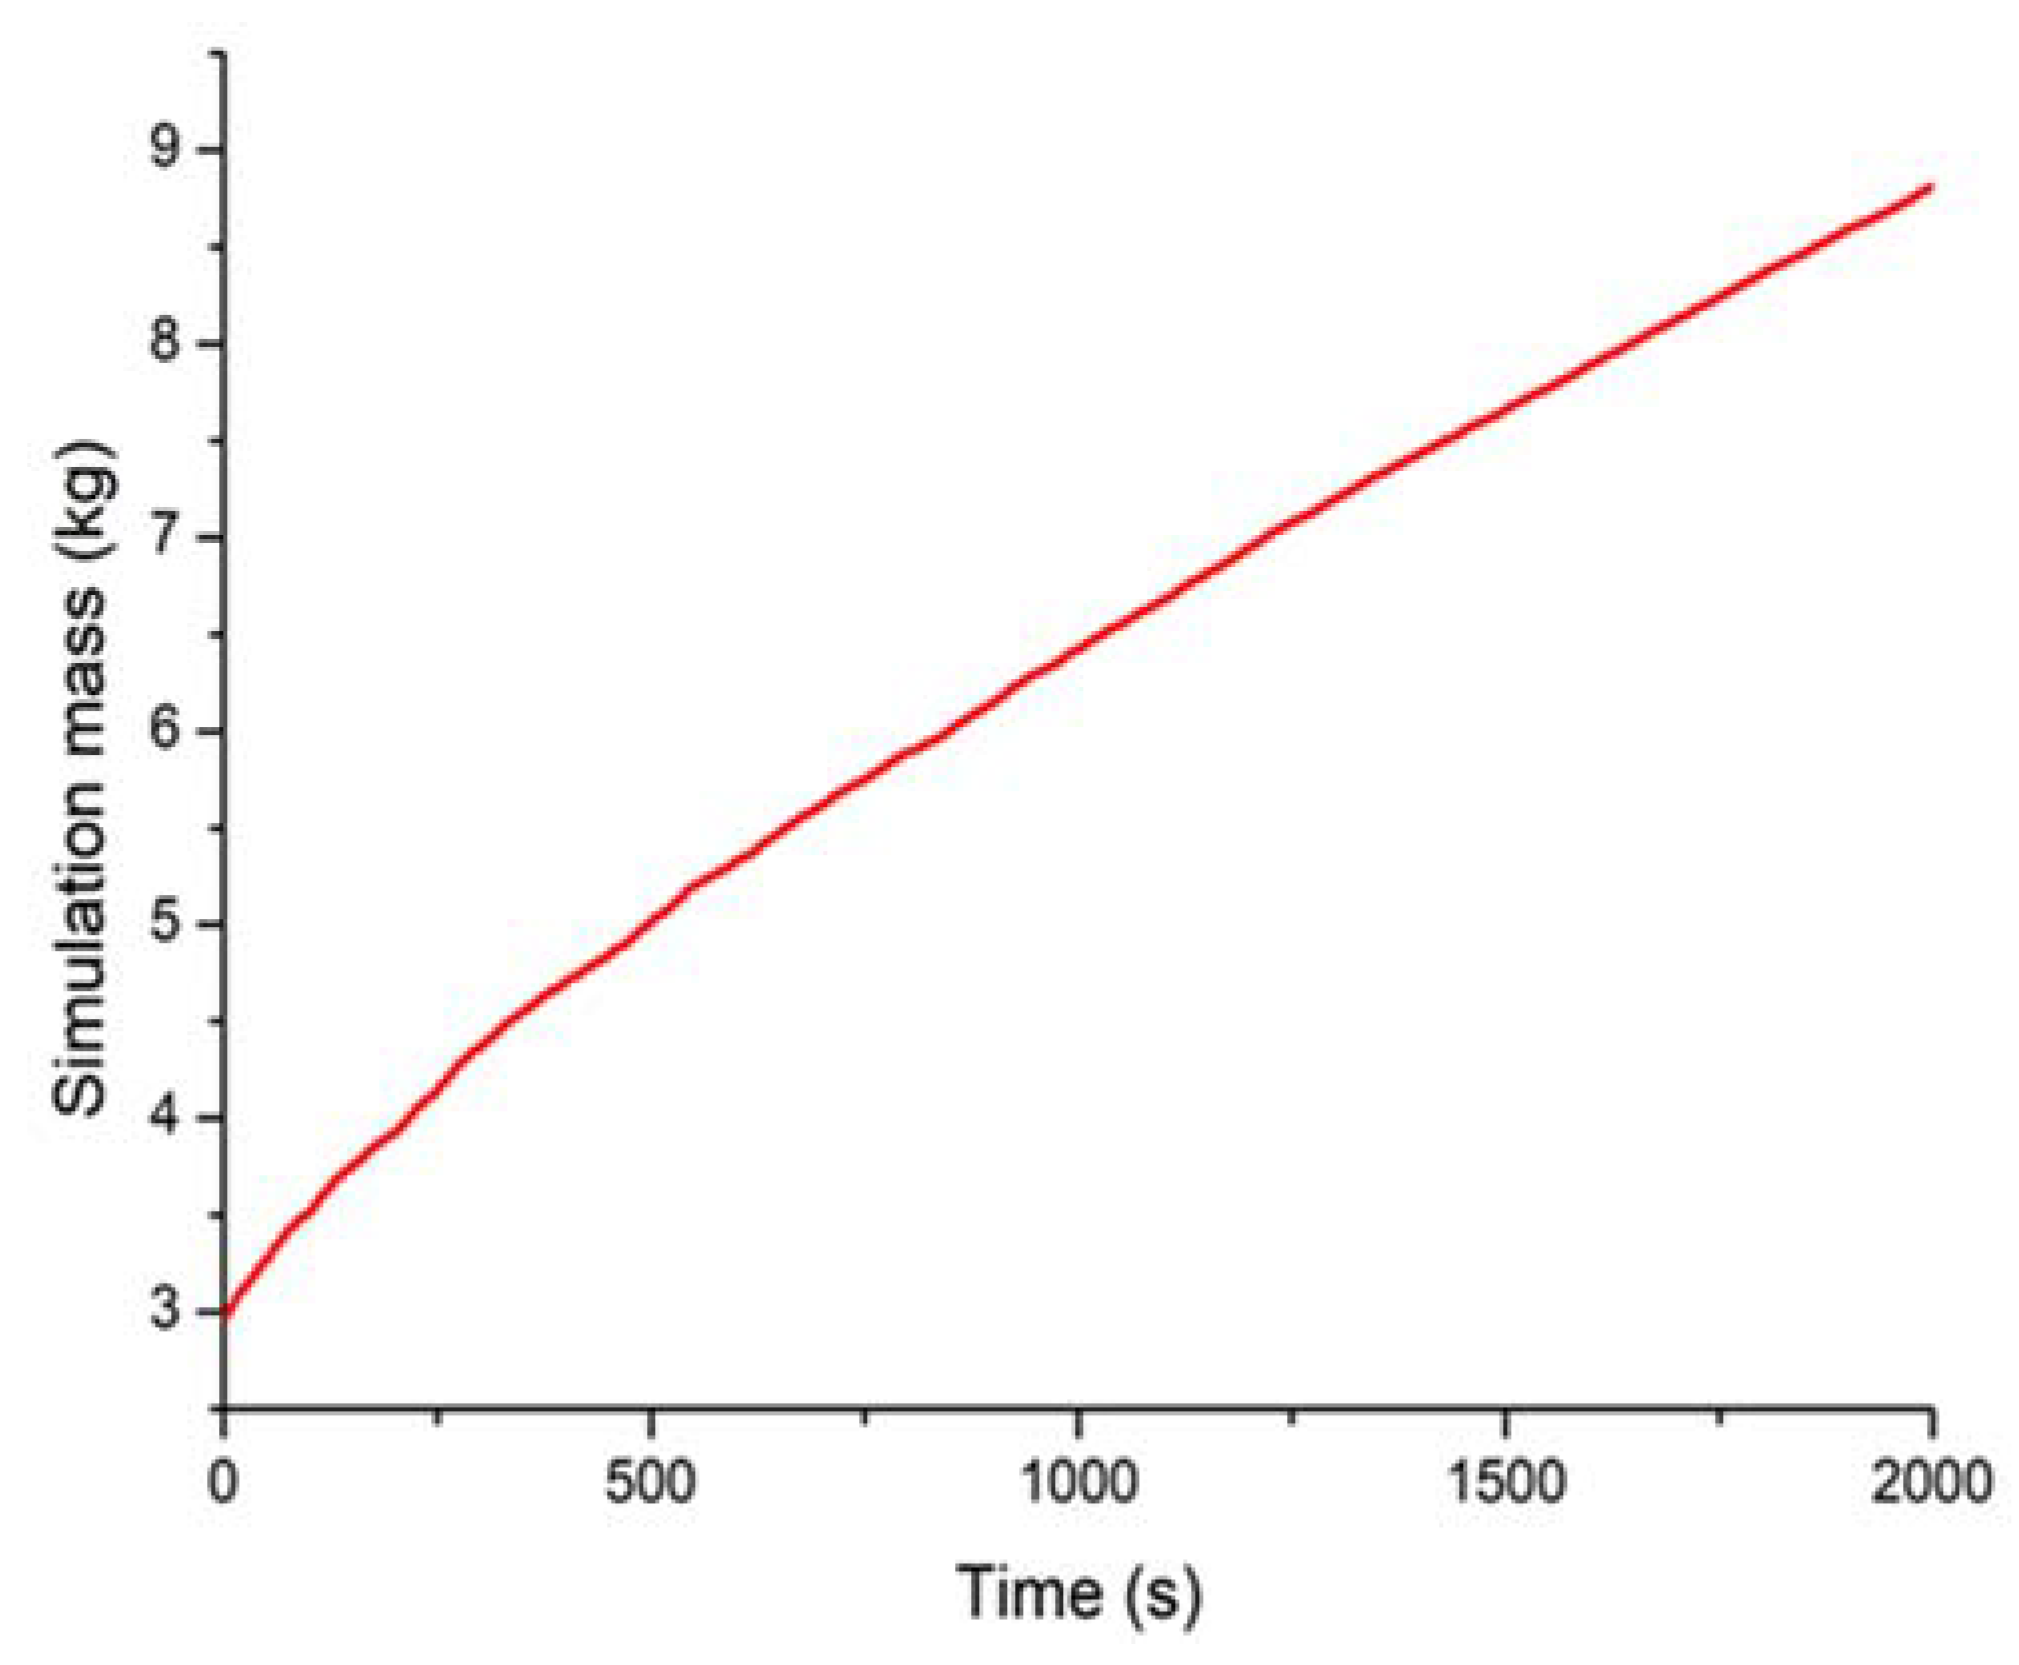
Figure 11 shows the mass of the high pressure vessel that changes during the course of the simulation. Table 4 shows a comparison of final temperature and mass in high pressure vessels. The results were obtained by using simulation software combined with the actual gas equation provided by REFPROP 9.5 under the same conditions as the experiment. The final temperature in the high pressure container was 378 K, and the final mass was 8.85 kg. The mass increased by 5.92 kg and the theoretical mass by 5.48 kg. The simulated mass is 8.2% higher than that of theoretical calculation.

5. Conclusions

The experimental method and simulation method of temperature and mass change in the presence of residual pressure in the second cycle are compared. This article mainly studied and predicted the changes in temperature and mass during the fast filling process. For this purpose, the study used a shear stress transport (k-ω) and NIST real gas model that includes corrections to test the thermal effects during the filling of hydrogen storage tanks (50 MPa, 343 L). According to the simulation results, the temperature distribution in the cylinder is obtained, and compared with the experimental data carried out under the same conditions. The temperatures calculated from the simulation non-adiabatic condition results were lower than those from the theoretical adiabatic condition calculation by 5.3%. The theoretical calculation was based on the experimentally measured pressure value. The simulated mass was 8.23% higher than the theoretical result. Because the calculated increase did not take into account heat transfer, and the simulation process fully considered the effect of heat transfer, the simulation results were closer to the experimental results. An accurate formula is used to calculate the final temperature rise by fitting the simulation results, which can achieve effective control of the temperature. The experimental results are in good agreement with the simulation results. The results of this study will be very useful for future hydrogen energy research and hydrogen charging station developments.

Author Contributions

Conceptualization, J.-T.K. and S.-J.J.; methodology, J.-T.K.; software, J.-Q.L.; validation, S.-J.J. and J.-T.K.; formal analysis, J.-Q.L.; investigation, J.-T.K.; resources, J.-Q.L.; data curation, J.-Q.L.; writing—original draft preparation, J.-Q.L.; writing—review and editing, J.-Q.L.; visualization, N.-S.M.; supervision, J.-T.K.; project administration, S.-J.J. and T.L.; funding acquisition, S.-J.J. and T.L. All authors have read and agreed to the published version of the manuscript.

Funding

This study was a research project conducted by the Ministry of Trade, Industry and Energy and supported by the Korea Institute of Energy Technology Evaluation and Planning (KETEP) as an energy technology development project (No.2017301004183, No.20183010041940).

Conflicts of Interest

The authors declare no conflict of interest.

Nomenclature

A i n Internal surface area of tank, (m2)
A o u t External surface area of tank, (m2)
h i n Heat transfer coefficient between hydrogen and tank wall, (W/m2·K)
h o u t Heat transfer coefficient between tank wall and ambient fluid, (W/m2·K)
h ˙ l Specific enthalpy of inflow hydrogen, (J/kg)
h ˙ e Specific enthalpy of outflow hydrogen, (J/kg)
c p Specific heat at constant pressure, (J/kg·K)
c v Specific heat at constant volume, (J/kg·K)
d i n Diameter of the injector of the tank, (m)
D i n Internal diameter, (m)
D o u t External diameter, (m)
LLength, (m)
mmass of hydrogen mass in the tank, (kg)
m 1 Initial hydrogen mass, (kg)
m i ˙ Hydrogen mass inflow rate for charging, (kg/s)
m e ˙ Hydrogen mass outflow rate for discharging, (kg/s)
N u i n Nusselt number of the gas, dimensionless. Nu = D h k = 0.14 R e d i n 0.67
R e d i n Reynolds number of the flow, R e d i n = 4 m ˙ π μ d i n
R a D i n Rayleigh number of the gas.
PPressure of the gas, (MPa)
P i Settled pressure in the tank, (MPa)
P 1 Initial pressure, (MPa)
P 2 Final pressure in the tank, (MPa)
TTemperature of the gas, (K)
T 1 Initial temperature, (K)
T i The temperature of inlet gas, (K)
T 2 Final temperature in the tank, (K)
T a m b Temperature of the ambient, T a m b = measured value., (K)
uSpecific internal energy, (J/kg).
kThermal conductivity of the gas (W/m·K.)
ρ Density of the gas, (kg/m3)
BAbel-Nobel constant, B = 0.007691 m3 for hydrogen gas

References

  1. Kim, Y.M.; Shin, D.G.; Kim, C.G. On-Board Cold Thermal Energy Storage System for Hydrogen Fueling Process. Energies 2019, 12, 561. [Google Scholar] [CrossRef] [Green Version]
  2. Li, M.; Bai, Y.; Zhang, C.; Song, Y.; Jiang, S.; Grouset, D.; Zhang, M. Review on the research of hydrogen storage system fast refueling in fuel cell vehicle. Int. J. Hydrogen Energy 2019, 44, 10677–10693. [Google Scholar] [CrossRef] [Green Version]
  3. Xiao, J.; Bénard, P.; Chahine, R. Charge-discharge cycle thermodynamics for compression hydrogen storage system. Int. J. Hydrogen Energy 2016, 12, 5531–5539. [Google Scholar] [CrossRef]
  4. Kim, K.; Shin, D.; Kim, Y.; Karng, S.W. Adiabatic Performance of Layered Insulating Materials for Bulk LH2 Storage Tanks. Trans. Korean Hydrogen New Energy Soc. 2016, 6, 642–650. [Google Scholar] [CrossRef] [Green Version]
  5. Wellnitz, J. Hydrogen storage systems for automotive applications: Project Storhy. Int. J. Sustain. Des. 2008, 1, 93–109. [Google Scholar] [CrossRef]
  6. Wang, L.; Ye, F.; Xiao, J.; Bénard, P.; Chahine, R. Heat transfer analysis for fast filling of on board hydrogen tank. Energy Procedia 2019, 158, 1910–1916. [Google Scholar] [CrossRef]
  7. An, G. Numerical analysis of fast-filling process of hydrogen storage cylinder for vehicles. Missiles Space Veh. 2009, 3, 50–55. [Google Scholar]
  8. Newhouse, N.L.; Liss, W.E. Fast filling of NGV fuel containers. SAE Trans. 1999, 108, 568–574. [Google Scholar]
  9. GTR Number 13. Global Technical Regulation on Hydrogen and Fuel Cell Vehicles; United Nations Economic Commission for Europe: Geneva, Switzerland, 2013. [Google Scholar]
  10. Society of Automotive Engineers. SAE J2579: Standard for Fuel Systems in Fuel Cell and Other Hydrogen Vehicles; Society of Automotive Engineers: Warrendale, PA, USA, 2013. [Google Scholar]
  11. International Organization for Standardization. ISO/TS 15869: Gaseous Hydrogen and Hydrogen Blends—Land Vehicle Fuel Tanks; International Organization for Standardization: Geneva, Switzerland, 2009. [Google Scholar]
  12. American national Standards Institude. ANSI HGV 2: Compressed Hydrogen Gas Vehicle Fuel Containers; American National Standards Institude: Washington, DC, USA, 2014. [Google Scholar]
  13. Tomioka, J.I.; Kiguchi, K.; Tamura, Y.; Mitsuishi, H. Influence of temperature on the fatigue strength of compressed-hydrogen tanks for vehicles. Int. J. Hydrogen Energy 2011, 36, 2513–2519. [Google Scholar] [CrossRef]
  14. Koshimizu, T.; Kasao, D.; Takata, Y.; Monde, M. Thermal Analysis on Filling Process in Hydrogen Tank. ASME Int. Mech. Eng. Congr. Expo. 2005, 42215, 141–148. [Google Scholar]
  15. Hirotani, R.; Terada, T.; Tamura, Y.; Mitsuishi, H.; Watanabe, S. Thermal Behavior in Hydrogen Storage Tank for Fuel Cell Vehicle on Fast Filling; SAE Technical Paper No. 2007-01-0688; SAE: Lyon, France, 2007. [Google Scholar]
  16. Khan, M.T.I.; Monde, M.; Setoguchi, T. Hydrogen gas filling into an actual tank at high pressure and optimization of its thermal characteristics. J. Therm. Sci. 2009, 18, 235–240. [Google Scholar] [CrossRef]
  17. Woodfield, P.L.; Monde, M.; Takano, T. Heat transfer characteristics for practical hydrogen pressure vessels being filled at high pressure. J. Therm. Sci. Technol. 2008, 3, 241–253. [Google Scholar] [CrossRef] [Green Version]
  18. Woodfield, P.L.; Monde, M.; Mitsutake, Y. Measurement of averaged heat transfer coefficients in high-pressure vessel during charging with hydrogen, nitrogen or argon gas. J. Therm. Sci. Technol. 2007, 2, 180–191. [Google Scholar] [CrossRef] [Green Version]
  19. Monde, M.; Woodfield, P.; Takano, T.; Kosaka, M. Estimation of temperature change in practical hydrogen pressure tanks being filled at high pressures of 35 and 70 MPa. Int. J. Hydrogen Energy 2012, 7, 5723–5734. [Google Scholar] [CrossRef]
  20. Galassi, M.C.; Papanikolaou, E.; Heitsch, M.; Baraldi, D.; Acosta Iborra, B.; Moretto, P. Validation of CFD models for hydrogen fast filling simulations. In Proceedings of the Fourth International Conference on Hydrogen Safety, San Francisco, CA, USA, 12–14 September 2011. [Google Scholar]
  21. Galassi, M.C.; Acosta-Iborra, B.; Baraldi, D.; Bonato, C.; Harskamp, F.; Frischauf, N.; Moretto, P. Onboard compressed hydrogen storage: Fast filling experiments and simulations. Energy Procedia 2012, 29, 192–200. [Google Scholar] [CrossRef]
  22. Galassi, M.C.; Baraldi, D.; Iborra, B.A.; Moretto, P. CFD analysis of fast filling scenarios for 70 MPa hydrogen type IV tanks. Int. J. Hydrogen Energy 2012, 37, 6886–6892. [Google Scholar] [CrossRef]
  23. Galassi, M.C.; Papanikolaou, E.; Heitsch, M.; Baraldi, D.; Iborra, B.A.; Moretto, P. Assessment of CFD models for hydrogen fast filling simulations. Int. J. Hydrogen Energy 2015, 39, 6252–6260. [Google Scholar] [CrossRef]
  24. Heitsch, M.; Baraldi, D.; Moretto, P. Numerical investigations on the fast filling of hydrogen tanks. Int. J. Hydrogen Energy 2011, 36, 2606–2612. [Google Scholar] [CrossRef]
  25. Acosta, B.; Moretto, P.; de Miguel, N.; Ortiz, R.; Harskamp, F.; Bonato, C. JRC reference data from experiments of on-board hydrogen tanks fast filling. Int. J. Hydrogen Energy 2014, 39, 20531–20537. [Google Scholar] [CrossRef]
  26. Melideo, D.; Baraldi, D.; Galassi, M.C.; Cebolla, R.O.; Iborra, B.A.; Moretto, P. CFD model performance benchmark of fast filling simulations of hydrogen tanks with pre-cooling. Int. J. Hydrogen Energy 2014, 39, 4389–4395. [Google Scholar] [CrossRef]
  27. Dicken, C.J.B.; Mérida, W. Temperature distribution within a compressed gas cylinder during fast filling. In Advanced Materials Research; Trans Tech Publications Ltd.: Stafa-Zurich, Switzerland, 2007; Volume 15, pp. 281–286. [Google Scholar]
  28. Dicken, C.J.B.; Merida, W. Measured effects of filling time and initial mass on the temperature distribution within a hydrogen cylinder during refuelling. J. Power Sources 2007, 165, 324–336. [Google Scholar] [CrossRef]
  29. Hosseini, M.; Dincer, I.; Naterer, G.F.; Rosen, M.A. Thermodynamic analysis of filling compressed gaseous hydrogen storage tanks. Int. J. Hydrogen Energy 2012, 37, 5063–5071. [Google Scholar] [CrossRef]
  30. Liu, Y.L.; Zhao, Y.Z.; Zhao, L.; Li, X.; Chen, H.G.; Zhang, L.F.; Zheng, J.Y. Experimental studies on temperature rise within a hydrogen cylinder during refueling. Int. J. Hydrogen Energy 2010, 35, 2627–2632. [Google Scholar] [CrossRef]
  31. Zhao, L.; Liu, Y.; Yang, J.; Zhao, Y.; Zheng, J.; Bie, H.; Liu, X. Numerical simulation of temperature rise within hydrogen vehicle cylinder during refueling. Int. J. Hydrogen Energy 2010, 35, 8092–8100. [Google Scholar] [CrossRef]
  32. Zhao, Y.; Liu, G.; Liu, Y.; Zheng, J.; Chen, Y.; Zhao, L.; Guo, J.; He, Y. Numerical study on fast filling of 70 MPa type III cylinder for hydrogen vehicle. Int. J. Hydrogen Energy 2012, 22, 17517–17522. [Google Scholar] [CrossRef]
  33. Zheng, J.; Guo, J.; Yang, J.; Zhao, Y.; Zhao, L.; Pan, X.; Zhang, L. Experimental and numerical study on temperature rise within a 70 MPa type III cylinder during fast refueling. Int. J. Hydrogen Energy 2013, 38, 10956–10962. [Google Scholar] [CrossRef]
  34. Kim, S.C.; Lee, S.H.; Yoon, K.B. Thermal characteristics during hydrogen fueling process of type IV cylinder. Int. J. Hydrogen Energy 2010, 35, 6830–6835. [Google Scholar] [CrossRef]
  35. Suryan, A.; Kim, H.D.; Setoguchi, T. Three dimensional numerical computations on the fast filling of a hydrogen tank under different conditions. Int. J. Hydrogen Energy 2012, 37, 7600–7611. [Google Scholar] [CrossRef]
  36. Striednig, M.; Brandstätter, S.; Sartory, M.; Klell, M. Thermodynamic real gas analysis of a tank filling process. Int. J. Hydrogen Energy 2014, 39, 8495–8509. [Google Scholar] [CrossRef]
  37. Wang, Y.; Dai, X.; You, H.; Gao, M. Research on the design of hydrogen supply system of 70 MPa hydrogen storage cylinder for vehicles. Int. J. Hydrogen Energy 2018, 43, 19189–19195. [Google Scholar] [CrossRef]
  38. Liu, J.; Zheng, S.; Zhang, Z.; Zheng, J.; Zhao, Y. Numerical study on the fast filling of on-bus gaseous hydrogen storage cylinder. Int. J. Hydrogen Energy 2020, 45, 9241–9251. [Google Scholar] [CrossRef]
  39. Song, B.H.; Myoung, N.S.; Jang, S.J.; Kwon, J.T. Hydrogen Compressor Cycle Analysis for the Operating Pressure of 50 MPa and High Charging Capacity. J. Korea Acad. Ind. Coop. Soc. 2020, 21, 66–73. [Google Scholar]
  40. Zirkel, A.; Laurien, E. Turbulence Modelling for CFD-Methods for Containment Flows. In High Performance Computing in Science and Engineering’11; Springer: Berlin/Heidelberg, Germany, 2012; pp. 451–467. [Google Scholar]
  41. Bourgeois, T.; Ammouri, F.; Weber, M.; Knapik, C. Evaluating the temperature inside a tank during a filling with highly-pressurized gas. Int. J. Hydrogen Energy 2015, 40, 11748–11755. [Google Scholar] [CrossRef]
  42. NIST Reference Fluid Thermodynamic and Transport Properties Database; Version 9.5; NIST: Gaithersburg, MD, USA, 2019.
  43. Younglove, B.A.; McLinden, M.O. An International Standard Equation of State for the Thermodynamic Properties of Refrigerant 123 (2, 2-Dichloro-1,1,1-Trifluoroethane). J. Phys. Chem. Ref. Data 1994, 23, 731–779. [Google Scholar] [CrossRef] [Green Version]
  44. Leachman, J.W.; Jacobsen, R.T.; Penoncello, S.G.; Lemmon, E.W. Fundamental equations of state for parahydrogen, normal hydrogen, and orthohydrogen. J. Phys. Chem. Ref. Data 2009, 38, 721–748. [Google Scholar] [CrossRef]
  45. Menter, F.R.; Kuntz, M.; Langtry, R. Ten years of industrial experience with the SST turbulence model. Turbulence. Heat Mass Transf. 2003, 4, 625–632. [Google Scholar]
  46. Winters, B. 70MPa Fast-Fill Modeling &Validation; Sandia National Laboratories: Albuquerque, NM, USA, 2010.
  47. Wang, L.; Zheng, C.; Wei, S.; Wang, B.; Wei, Z. Thermo-mechanical investigation of composite high-pressure hydrogen storage cylinder during fast filling. Int. J. Hydrogen Energy 2015, 40, 6853–6859. [Google Scholar] [CrossRef]
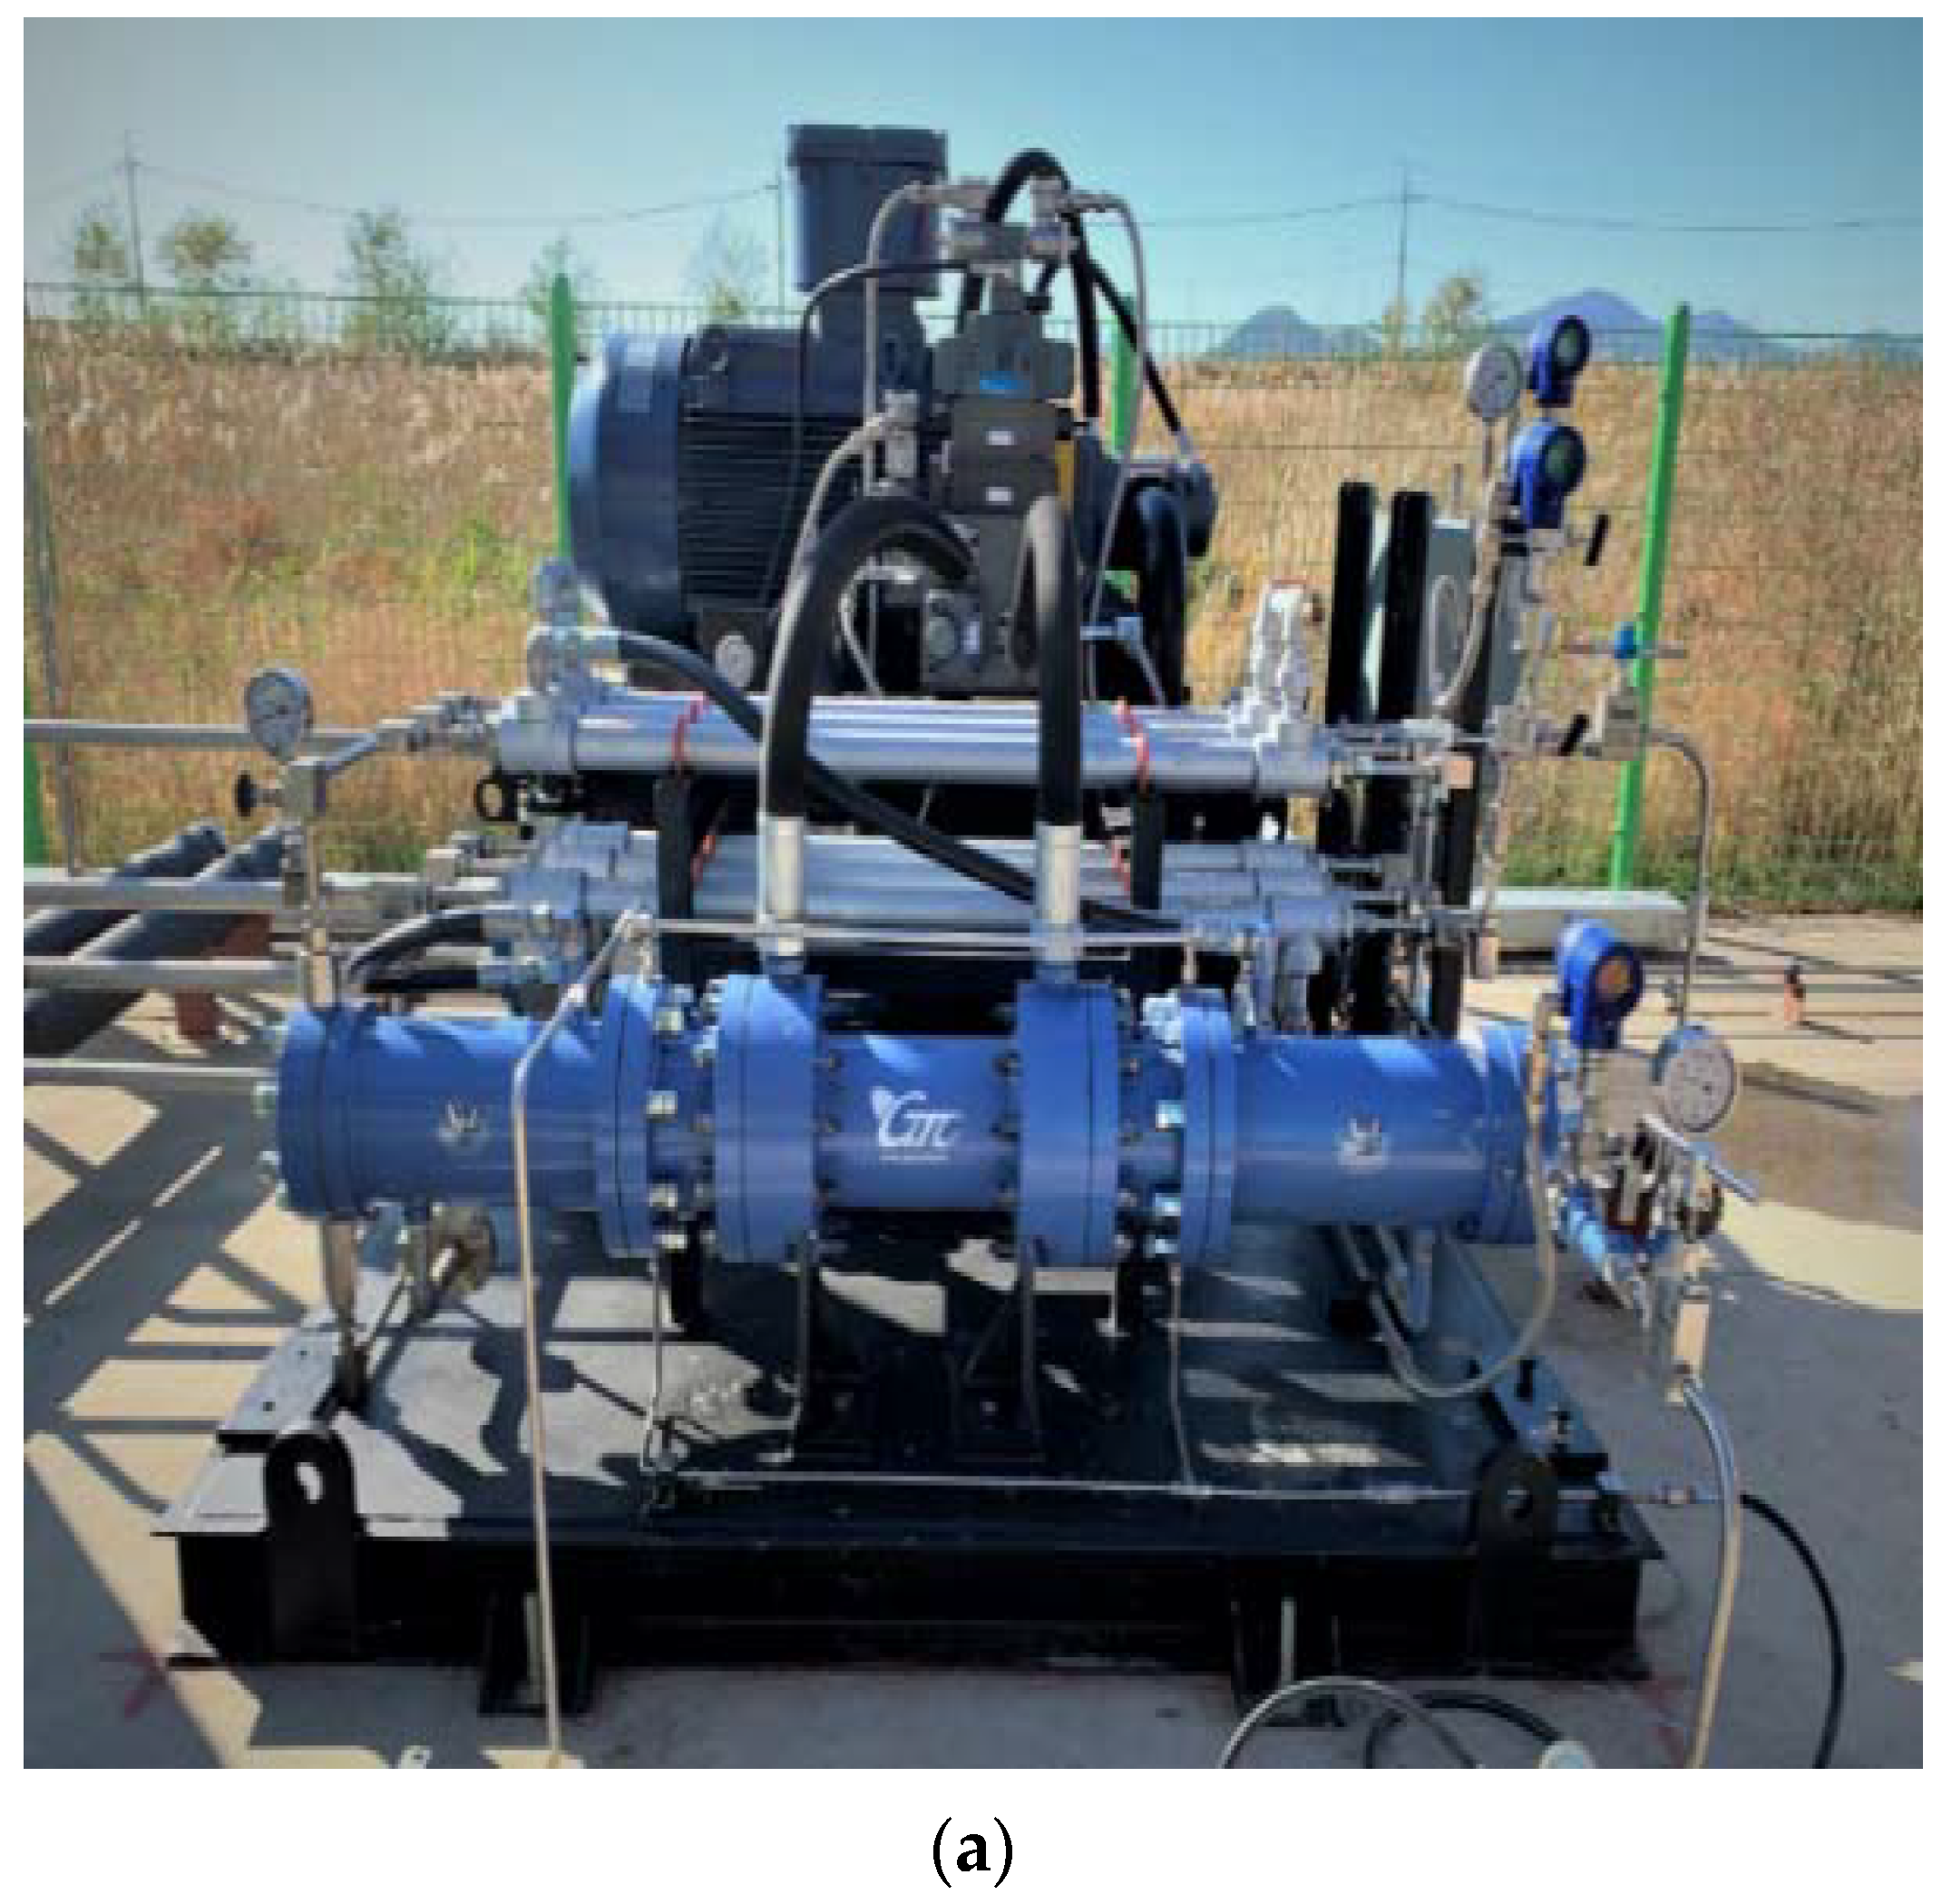
Figure 1. Hydrogen testing apparatus: (a) Hydrogen compression testing apparatus; (b) High pressure vessel for hydrogen storage.
Energies 13 06428 g001aEnergies 13 06428 g001b
Figure 2. The sensors measuring pressure on the hydrogen tank.
Energies 13 06428 g002
Figure 3. System structure of the hydrogen tank.
Energies 13 06428 g003
Figure 4. Simple diagram of the high pressure tank for hydrogen gas fast filling process.
Energies 13 06428 g004
Figure 5. Theoretical model of the fast filling process for a high-pressure hydrogen storage cylinder.
Energies 13 06428 g005
Figure 6. High pressure tank modeling.
Energies 13 06428 g006
Figure 7. Grid system of high pressure tank modeling.
Energies 13 06428 g007
Figure 8. Comparison of the experimental measurements and the simulated temperature data [33].
Energies 13 06428 g008
Figure 9. The temperature distributions of hydrogen in the high pressure hydrogen storage tank.
Energies 13 06428 g009
Figure 10. Comparison of the experimental, theoretical, and simulated data: (a) Pressure value. (b) Temperature value.
Energies 13 06428 g010
Figure 11. The mass of the high pressure vessel that changes during the course of the simulation.
Energies 13 06428 g011
Table 1. Initial data in high-pressure storage.
P i
(MPa)
T i
(K)
P 1
(MPa)
T 1
(K)
m 1
(kg)
P 2
(MPa)
T 2
(K)
m 2
(kg)
50313.1311.3300.15Initial mass50Final temperatureFinal mass
Table 2. The specification and properties of high pressure tank.
Specification
L (m)4.4197
D 1 (m)0.3143
D 2 (m)0.3985
d i n (m)0.0143
T (m)0.0842
Properties
K (W/m·K)16.3
h i n (W/m2·K)113.49
h o u t (W/m2·K)40
Table 3. Summary of the properties of hydrogen and cylinder.
Density
( k g / m 3 )
Specific Heat
( J / k g · K )
Thermal Conductivity
( W / m · K )
H 2
(50 MPa, 313.15 K)
29.65114,9570.233
Cylinder
(Stainless steel)
783050016.3
Table 4. Comparison of final temperature and mass in high pressure vessels.
ConditionTheoretical Method
(Adiabatic Filling)
Simulation Method
(Non-Adiabatic Filling)
Final temperature (K)397.12378
Final mass (kg)8.418.85
Charged mass (kg)5.485.92
Publisher’s Note: MDPI stays neutral with regard to jurisdictional claims in published maps and institutional affiliations.