Abstract
This paper follows on from an earlier publication on high-blend-rate binary gasoline-alcohol mixtures and reports results for some equivalent ternary fuels from several investigation streams. In the present work, new findings are presented for high-load operation in a dedicated boosted multi-cylinder engine test facility, for operation in modified production engines, for knock performance in a single-cylinder test engine, and for exhaust particulate emissions at part load using both the prototype multi-cylinder engine and a separate single-cylinder engine. The wide variety of test engines employed have several differences, including their fuel delivery strategies. This range of engine specifications is considered beneficial with regard to the “drop-in fuel” conjecture, since the results presented here bear out the contention, already established in the literature, that when specified according to the known ternary blending rules, such fuels fundamentally perform identically to their binary equivalents in terms of engine performance, and outperform standard gasolines in terms of efficiency. However, in the present work, some differences in particulate emissions performance in direct-injection engines have been found at light load for the tested fuels, with a slight increase in particulate number observed with higher methanol contents than lower. A hypothesis is developed to explain this result but in general it was found that these fuels do not significantly affect PN emissions from such engines. As a result, this investigation supplies further evidence that renewable fuels can be introduced simply into the existing vehicle fleet, with the inherent backwards compatibility that this brings too.
1. Introduction
The affordability of transport for the end-user is the key factor in the success of the motor vehicle, which has accelerated mankind’s economic development since its inception; cheap transportation is a driver of economies worldwide and this was not possible before the internal combustion engine (ICE). This state of affairs has arisen solely because of its cost-effectiveness and the resulting affordability and utility of the vehicles it is fitted to, coupled to the fact that liquid fuels make the storage and distribution of the energy that they require similarly cost-effective. This overall transport system cost-to-utility ratio has given rise to a situation where, for the first time in 2016, almost 95 million vehicles were manufactured, representing a year-round rate of three vehicles per second, and one billion passenger and commercial vehicles had been built by 2010 [1]. Furthermore, in a recent study, Gutzmer of INA-Schaeffler presented data showing that car production rates are accelerating and analysis of his data yields an estimate that the second billion vehicles will have been manufactured in the 2021–2022 time frame [2]. He estimates the ratio of ICE-only, plug-in hybrid electric vehicles (PHEVs) and battery electric vehicles (BEVs), and analysis of his figures shows that if there is no paradigm shift in customer behavior then three billion vehicles will have been built by 2030 [2]. Figure 1 presents the data of Gutzmer in these terms; Figure 2 shows that even with such an optimistic view of the take up of pure BEVs, the ICE will continue to dominate light-duty propulsion for years to come, and that even if what might be termed “peak engine” occurs in 2020, then still in 2030 nearly as many combustion engines will be made as were in 2014, when they will be manufactured at a rate of 2.66 per second. While there are many estimates in the literature, this data has been chosen because INA-Schaeffler is one of the Tier-1 suppliers with a great interest in the acceleration of electromobility, and so they can be assumed to present a scenario with a rapid take up of electric vehicles and corresponding substitution of ICEs. Plainly, despite various political pronouncements concerning the demise of the ICE, the automotive industry and its observers believe that they will continue the foreseeable future; other estimates by industry observers put a global penetration of PHEVs and BEVs combined at slightly less than 20% by 2030 [3]. One might therefore suggest that reports of the impending death of the ICE appear to be greatly exaggerated [4].
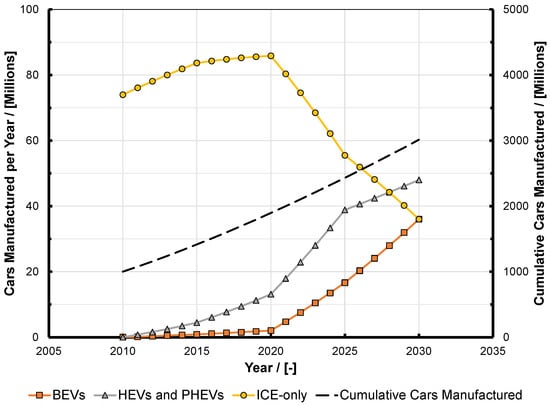
Figure 1.
Projected production volumes of cars split into different propulsion types (data adapted from that given in [2]). BEV: battery electric vehicle; HEV: hybrid electric vehicle; PHEV: plug-in hybrid electric vehicle. ICE: internal combustion engine.
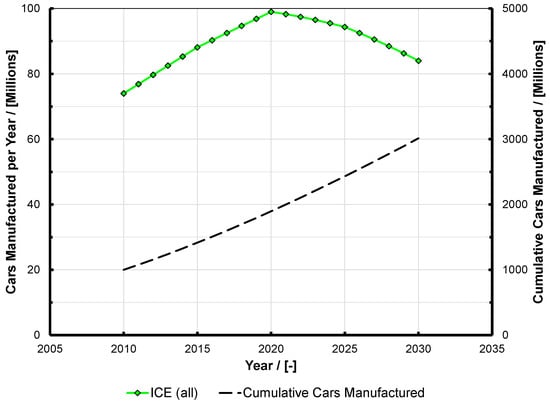
Figure 2.
Data from Figure 1 reworked to show vehicles with an internal combustion engine fitted (i.e., pure ICE and hybrid vehicles). The values for cumulative cars built is the same as on Figure 1. Note that in 2030, nearly as many engines are predicted to be built as in 2014, and the value of 84 million engines per year still represents 2.66 engines per second. ICE: internal combustion engine.
Synergistic with the vehicle manufacturing industry developing over time, the fuel supply industry has kept pace. Because there was no fossil hydrocarbon fuel supply industry then, early engines used bio-sourced fuels and the switch to fossil fuels was made early on, despite early concerns that demand would outstrip supply [5]. Cheapness of the energy store both in the infrastructure and aboard the vehicle is one factor in the affordability of the system, and the favorable economics of liquid fuel supply has given rise to a situation where the authors’ analysis of the global use of oil suggests that it is used continuously at a volume flow rate equivalent to 7.4% of that of Niagara Falls.
It should be remembered that the customer is de facto the only financial input to the whole system of vehicle manufacture and transport energy supply; all of the other stakeholders, being the vehicle manufacturers (OEMs), fuel companies and governments, take this money out of the system either as sales or taxation. If the consumer can no longer afford transportation, then a very worrying state of affairs will ensue.
While it is increasingly true that in many urban and extra-urban driving situations, modern production IC engines and exhaust after treatment systems actually clean the air (insofar as their tailpipe emissions of hydrocarbons (HCs), carbon monoxide (CO) and oxides of nitrogen (NOx) are significantly lower than the background concentration) [6,7], a larger global problem is that of the emission of fossil carbon dioxide (CO2). At present, the global atmospheric CO2 concentration is increasing by at least 3 ppm per year, despite global action being taken to limit it. While all possible steps need to be taken to move from fossil fuels to other energy carriers, as mentioned above it seems to be accepted as fact that an ICE has to operate on such fuels. This is plainly not the case. Referring to the above comments on the dawn of motoring, when vehicles used biofuels because there was no alternative and consequently there was no meaningful fossil carbon footprint in agriculture, it is an uncomfortable fact that early ICE vehicles were more carbon neutral than a BEV is today. Unfortunately, due to economics alone, society made the switch to fossil fuel to ensure the energy supply kept pace with the burgeoning demand. It is not fanciful to state that before this point, when it operated on biofuels, the early ICE vehicle was probably the most environmentally-friendly mechanized transport system we have had or will ever have. What we now desperately need to find an answer to is the real problem: that we presently fuel the majority of vehicles on fossil oil.
Alcohols are some of the most widely used alternative fuels in the automotive market. The fact that they can be made fully renewably and blended with gasoline is potentially a useful tool in the drive to reduce the release of fossil CO2 associated with transport, which is one of the most difficult energy consumption modes to decarbonize. This is especially true when one considers the cost of BEVs for all of the stakeholders in transport, and particularly for the consumer who (if the present economic model stays in place for the foreseeable future) appears to be expected to pay significantly more for vehicles than he or she presently does. While electricity may be cheap on a cost-per-MJ basis at the moment, and BEVs are approximately three times more efficient in their energy utilization than combustion engines, the price of such vehicles remains cost-prohibitive for many people, and is likely to remain so (especially considering total cost of ownership) even if future stretch targets for automotive traction battery costs are met [8].
Although, for the consumer, electrical energy is cheap in relation to transportation (liquid) fuel costs, there is of course no guarantee that this will continue to be the case. The application of life-cycle analysis (LCA) may also see increasing numbers of questions raised over the ecological impact of electrification, especially since many of the minerals and elements used in the manufacture of traction batteries and motors are extremely rare (for example cobalt, neodymium, dysprosium, and to a lesser extent lithium). There is also the danger of energy security concerns being swapped for concerns over commodity security—although it is true that, unlike the use of fossil fuels in combustion-engine vehicles, commodity security affects only the construction of EVs and not necessarily their use. There are moral concerns regarding how cobalt in particular is obtained, too. Therefore, due to the fact that alcohols can either be used as pure fuels in their own right or blended in many ways with existing fossil hydrocarbon fuels [9,10,11,12,13,14,15,16,17,18,19,20,21,22,23,24], there is, in the authors’ opinion, considerable merit in continuing to investigate them as a potential future automotive energy vector.
As stated, this paper follows on from a previous work in which the performance of several different mid- and high-blend alcohols were tested and compared to the performance of regular and premium gasolines in a variety of test engines [9]. A key tenet in the previous paper was that the binary blends tested, being either gasoline-ethanol or gasoline-methanol mixtures, were configured with the same stoichiometry. The paper showed that such fuels perform essentially identically in any given combustion system, at least in terms of engine torque, power, and brake specific fuel consumption (BSFC) at the same spark advance, and they could also reduce emissions of oxides of nitrogen dramatically; however, particulate matter reduction (tested in a direct-injection engine) was found to be more blend dependent, with that finding being presented for the first time there. This new work conducts similar tests for so-called ternary blends, configured from gasoline, ethanol, and methanol such that they have the same stoichiometry as the binary blends discussed in the previous work. Blends made from these components are termed ‘GEM’ blends here.
The present work utilizes fundamentally the same test engines and equipment as the previous investigation. While the ternary blend results are presented for the first time here, some reference will be made to the previous tests where pertinent, since many of the binary gasoline-alcohol blends reported there have the same stoichiometry as the GEM fuels investigated here; in fact in the space of possible blends at any given stoichiometry, the binary ones actually represent limit cases. This will be returned to later. This paper is constructed in the following manner, similar to how the authors dealt with the subject of binary blending of alcohols in gasoline [9]:
Section 2 discusses the rationale for and a method of introducing methanol into the bulk transport fuel pool, namely iso-stoichiometric blend formulation. This helps to set the context for work presented in the rest of this paper.
Section 3 discusses the testing of iso-stoichiometric GEM blends in the “Ultraboost” extreme downsizing 4-cylinder demonstrator engine at the University of Bath. The very high brake mean effective pressure (BMEP) that this engine is capable of operating at means that the data shown here represents testing of the hypothesis of identical performance from any blend configured according to the rules to a level not published before. Furthermore, the interaction with exhaust gas recirculation (EGR), already known to have excellent synergies with alcohol fuels, is shown. Some particulate emissions results are reported here, pertinent to the high-load operating conditions reported.
Section 4 discusses tests conducted at Ghent University using three different engines: two port-fuel-injection naturally-aspirated engines—one a production 4-cylinder and the other a single-cylinder research engine configured with a high compression ratio (CR)—and one multi-cylinder direct-injection engine. The blends tested correspond to the stoichiometry of E85 and in terms of knock all of the blends perform identically and fundamentally the same as E100.
Section 5 presents data gathered at the University of Oxford in which the particulate emissions performance of GEM blends is investigated in a single-cylinder test engine at light load. These findings have not been presented before, and how they reinforce the findings from the binary blend tests conducted in the first part of this investigation is discussed.
Finally, this paper ends with a Conclusions section.
2. A Strategy for Introducing Methanol into Transport Fuel by Configuring Ternary Blends as Drop-In Fuels
The two “light alcohols”, i.e., those with no isomers, ethanol and methanol, have for years been blended with gasoline to create fuels for SI engines, with E85 and M85 being examples of binary blends which have been commercialized for several years. For these fuels, the number represents the volume percentage of the alcohol (abbreviated to E and M) in admixture with gasoline. In fact all of the alcohols are miscible with gasoline to a greater or lesser extent and this gives rise to the potential to create multi-component blends to a target stoichiometry, provided this value is within an upper and lower target range.
The ternary—or three component—blends used to in this paper are all mixtures of gasoline and the light alcohols ethanol and methanol. Collectively, they are referred to as ‘GEM’ blends; and specifically “GXX EYY MZZ”, where XX, YY and ZZ are the volume percentages of the three individual components, respectively. The process by which such blends can be formulated and how they can offer a route to increased penetration of renewable energy in the fuel pool has been discussed before [17,18,19,20,22,24]. Both engine and vehicle tests of such blends have been reported, the latter showing that when ternary blends are configured with the same stoichiometric air-fuel ratio (AFR) as E85 (this nominally being a blend of 85% ethanol and 15% gasoline by volume)—approximately 9.7:1—then they are undetectable by a flex-fuel vehicle engine management system when such a vehicle has already been calibrated to be capable of taking any proportion of gasoline and E85 put into its fuel tank [17,18]. This is essentially due to near-identical volumetric energy content (the volumetric lower heating value (LHV)) in the blends as well their producing a near-identical response from a flex-fuel vehicle’s ethanol concentration sensor. Furthermore, in [18], it was shown that increasing the methanol content actually improved the cold startability of the vehicle, providing a further mechanism to keep increased renewable energy content in the fuel pool all year round.
All of these previous reports show that if followed, these ternary blending rules permit a method of simply creating fuel blends equivalent to any original binary gasoline-ethanol mixture. Recently, Pearson and co-workers [24] have defined more completely the blending rules for such an approach, and have shown the effect of water on AFR and volumetric LHV if this is left in ethanol (which could be very beneficial from a production energetics point of view). (Note that unlike all the other alcohols, methanol does not form an azeotrope with water, and consequently simple distillation is sufficient to dry it fully. By contrast, ethanol cannot be dried by simple distillation beyond 4.4% v/v water. In the case of the distillation of the water formed in a production process utilizing CO2 to synthesize methanol, the process can utilize the waste heat generated within the exothermic synthesis process itself, supporting the contention that once the feed stocks have been obtained using sustainable processes, all downstream processes and products can be maintained as fully sustainable too.) Pearson and co-workers show that blending for constant oxygen content is just as viable as blending for constant stoichiometry or volumetric energy content, and furthermore that the magnitude of the differences between the approaches are effectively negligible [24]. Importantly, when such ternary blends are configured in this manner, all such possible blends have near-identical volumetric LHV, practically the same octane numbers, and extremely close enthalpies of vaporization (to +/− 2%, the variation arising from treating the components on a mass basis) [17,18], all properties which need to be the same or similar for any fuel to capable of being ‘dropped in’ to an existing vehicle fuel and combustion system.
It has also been shown that for any given amount of ethanol that can be introduced into the total fuel pool, the ease of synthesis and hence supply of methanol means that introducing it to make GEM blends suitable for the vehicles already in the market effectively displaces gasoline [17]. In [17], the authors also show that within certain wide price limits, the resulting blends can be cheaper than gasoline on a per-unit-energy basis; furthermore in [25], it was shown that a taxation system based on taxing units of energy and applying a multiplier based on the fossil CO2 impact of supplying the energy in that form could provide a government with the means to encourage renewable energy at the expense of fossil fuels while keeping the overall taxation revenue gathered constant. Thus, a framework could be created to encourage the consumer to move away from fossil fuels based on their being more expensive to use than renewable fuels, while maintaining economic viability for all of the stakeholders.
For the case of stoichiometry equivalent to E85, the volume relationship between the components is shown in Figure 3. This was determined in previously-published work using a proprietary fuel characteristics tool [18,25], and here one can see that as the proportion of ethanol is reduced, so the rate of increase in the proportion of methanol is faster than that of the gasoline. This is because one volume unit of ethanol is equivalent to a binary gasoline-methanol volume unit with the proportions of 32.7:67.3 (this then sharing the 9:1 stoichiometric AFR of ethanol).
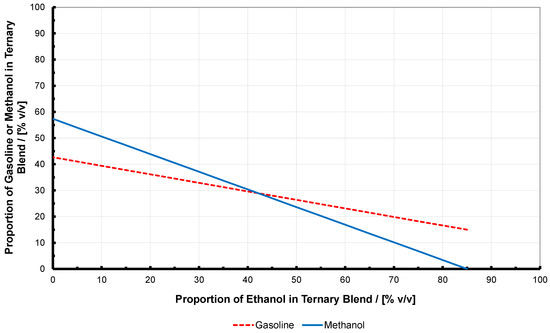
Figure 3.
Representation of how the volume proportions of three blend constituents change for a targeted stoichiometric AFR equivalent to that of E85 (i.e., 9.7). Here these constituents are gasoline, ethanol, and methanol, and together in this form they are termed iso-stoichiometric ‘GEM’ ternary blends. When reading this figure, note that E85 is effectively on the right; where the lines end is the limit of being able to meet the stoichiometric AFR limit of 9.7. The equivalent where no ethanol is present (i.e., M56) is on the extreme left.
Four such GEM blends were tested by Lotus Engineering in a Saab 9-3 BioPower production flex-fuel vehicle employing a virtual sensor to infer the alcohol concentrations that it was operating on. These initial tests showed that all of the blends were invisible to the vehicle’s on-board diagnostics system which was unmodified [17], provided that a certain minimum level of cosolvent was present; at very low temperatures M56 (the binary gasoline-methanol mixture with the same stoichiometric AFR as E85) was found to illuminate the malfunction indicator lamp. This was presumed to be due to phase separation because of the absence of any form of cosolvent in this particular fuel blend.
In GEM blends, the function of a cosolvent in mixtures of gasoline and methanol is undertaken by the ethanol provided some minimum volume is used. This minimum volume was investigated in later tests in a vehicle certified to a higher emissions standard utilizing a physical sensor for alcohol concentration. However, in this later series of tests, despite repeated cold soaks and related cold start tests at −20 °C, [18] a minimum requirement for ethanol was not found. Even M56 (i.e., the binary gasoline-methanol mixture) started satisfactorily, suggesting that such GEM blends could help to displace more gasoline from the fuel pool year round (for a fixed volume of ethanol that is available).
From the vehicle testing program conducted by Lotus, it was deduced that, since all of the vehicles in the parc do not all use the same alcohol concentration-sensing technology, a minimum ethanol concentration would in fact be needed to ensure the satisfactory operation of the entire fleet, and that this minimum level would be in the region of 10% by volume [18]. In turn, this implies that, without the addition of any other type of cosolvent, the E85-equivalent ternary blend with the maximum methanol concentration that could be used is G40 E10 M50.
A further important finding from this earlier work was that regardless of the technology used to sense the alcohol concentration in the fuel system near to the engine, energetic efficiency improvements on the order of 5% were possible. This was true for any of the ternary blends tested at the E85-equivalent stoichiometric AFR of 9.7:1 [17,18]. This is important when considering the amount of renewable energy that would have to be supplied to synthesize such fuels by the electrofuel route as per the approach discussed by various authors [26,27,28,29,30,31,32,33]. Later sections in this paper will provide further validation of the efficiency improvements possible.
Issues of material compatibility were investigated in another publication [20], together with results showing that exhaust emissions do not change significantly as the blends are altered, with all E85-equivalent ternary blends essentially out-performing gasoline in this respect. However, it should be noted that particulate and aldehyde emissions were not measured in these tests. Further, Pitcher et al. [21] investigated the spray morphology of GEM blends in an optical direct-injection engine, this being important because of its bearing on emissions and fuel consumption in engines using such fuel introduction technologies. They showed that there was no significant difference in morphology across the full spectrum of E85-equivalent blends. In the present work, Section 5 builds on this work and presents new data from GEM blends with regards to their soot-formation tendency, which is especially important with respect to Euro 6c (and higher) emissions legislation. These tests were conducted in a different optical engine, and represent the first time such particulate matter data from such blends has been presented by this group.
Considerable additional work on the GEM concept has been reported by Sileghem and co-workers in both port-fuel-injection (PFI) and direct-injection (DI) engines [34,35]. All of this work has shown that in terms of engine and combustion system performance any GEM blend configured according to the rules established by Pearson and Turner will perform in the same manner using the same engine control settings. Note that it is possible to produce ternary blends of other alcohols with gasoline, or even quaternary (or higher number) blends. Similarly, water can be included in such blends; the physicochemical characteristics of such these blends was investigated [24], although, practically speaking, phase separation would become an issue with the presence of water, the light alcohols being especially prone to this when in admixture with gasoline. Other authors have discussed physicochemical, performance, and blending aspects of binary gasoline-alcohol blend fuels in detail [36,37,38,39], but while it is accepted that challenges exist in blending alcohols with gasoline (such as high vapor pressure and evaporative emissions effects aboard the vehicle, or phase separation and blend stability in the distribution system, with materials compatibility issues in both), it is the authors’ belief that these are understood and by no means insurmountable, as evidenced by the amount of high-blend-rate binary mixtures of either ethanol or methanol that is or has been used around the world and the number of fully-homologated vehicles that have been sold that are capable of taking them.
From all of this initial work, the inherent compatibility of existing production flex-fuel technology with ternary blends with stoichiometric AFRs matched to fuels already in the market place has been established. It is therefore believed that a progressive rollout of such fuels, by methanol percentage and region, could allow staged introduction of methanol as a transport fuel. This has the potential to meaningfully reduce greenhouse gas emissions, improve energy security, and provide better air quality. Once the market has accepted the new fuel, it enables widespread use of an energy carrier which could eventually be completely decarbonized using the electrofuel approach [26,27,28,29,30,31,32,33], with methanol then becoming a chemically-liquefied form of hydrogen as an extension of the hydrogen economy [40]. At this point in time, a practical liquid fuel that has been fully decarbonized will have been realized.
3. Ternary Gasoline-Alcohol Blend Tests in the “Ultraboost” Extreme Downsizing Demonstrator Engine
The “Ultraboost” collaborative project, more properly known as “Ultra Boost for Economy”, was part-funded by the UK Technology Strategy Board (now Innovate UK) and started in 2010. It sought to demonstrate the potential to provide a vehicle-level CO2 reduction of 35% in an SUV by employing a heavily downsized (and ‘down-cylindered’) engine. One major target was that this new engine should be capable of generating the torque curve of the Jaguar Land Rover AJ133 V8 engine. That engine is of 5.0 L capacity and is naturally aspirated (NA). This performance had to be realized while operating on 95 research octane number (RON) standard pump gasoline [41] (in fact the project did indeed show that this CO2 reduction target was achievable and in fact greater than this was demonstrated by vehicle simulation using the dynamometer data gathered).
At the start of Ultraboost, there was no pre-ordained engine swept volume, but the final version of the engine was of in-line 4-cylinder configuration, with a compound-charging system and 2.0 L swept volume [41]. However, the first iteration of the design (termed ‘UB100’) was externally boosted by a charge air handling unit (CAHU) system at the University of Bath facility, where all of the engine test work, including taking the results reported here, was carried out. Specifications for this engine are given in Table 1. For detailed information on the other project partners and their responsibilities, the individual stages of the project, and the test facility, the reader is referred to [41].

Table 1.
Specifications of the Ultraboost extreme downsizing demonstrator engine in the externally-boosted “UB100” configuration, as used for the fuel blends testing reported here [41].
As well as for its prime aim as being a platform for the development of a self-contained technology demonstrator package, the engine was used for an extensive series of fuel tests within the program. For these fuel investigations accurate control of the engine’s plenum temperature and pressure was required and so the CAHU system was used throughout. Cooled EGR was also utilized in some of these tests, this being provided by a dedicated rig especially developed for the process. This rig took exhaust gas from the engine and pressurized it for delivery to the intake of the engine, where it was mixed with the air supply provided separately by the CAHU. This EGR supply system is discussed further in [41,42]. The temperature of the resulting combined charge was also controlled by the test facility, and it is this test equipment configuration that is used in the results presented below. The exhaust back pressure was controlled by the test cell also. The results of most of the other conventional hydrocarbon fuels tests have been presented in other publications [9,43,44,45,46,47].
From its original work on the ternary blends concept (see Section 2) and as a result of being a partner in the project, Lotus Engineering requested that E85 and an iso-stoichiometric ternary alcohol blend be tested within the Ultraboost project, and these fuels were then formulated by Shell; the specifications of these are shown in Table 2. In this section the ternary blend is henceforth termed “GEM”. In the present work, the results from these iso-stoichiometric blends will be compared to two commercial gasolines (95 and 98 RON), and with the project’s control fuel. This control or ‘base fuel’, was a standard pump gasoline sold as 95 RON fuel, but with some octane giveaway (from 97.0 RON, see Table 2) as a result of it having to achieve a motor octane number (MON) of 85, which is necessary for the European market. All of these fuels are also shown in Table 2. The 98 RON gasoline contained no ethanol, but both of the 95 RON fuels had 5% ethanol and all were production fuels of EN228 standard; as a consequence none of these are considered to be a gasoline-alcohol blend fuel in the discussion that follows.
Table 2.
Specifications of the gasoline, E85, and ternary gasoline-alcohol “GEM” fuels tested in the Ultraboost extreme downsizing demonstrator engine. All data was supplied by Shell and measured using standard industry test procedures and equipment.
Table 2 shows an interesting slight deviation from previous GEM fuel research insofar as the E85 and GEM did not have RON and MON values with closer alignment. Further, they did not have the same stoichiometric AFR. Here, they were made from different gasoline blend stocks, which was also a deviation from previous practice. Thus, before testing began, from their previous experience a slight difference in performance between these two fuels was expected by the authors; in the previously-reported work by Lotus Engineering the GEM blends were splash blended using the same gasoline each time and the achieved stoichiometric AFR range was tighter due to the use of Lotus Engineering’s proprietary fuels properties calculator (here the stoichiometric AFR range was just over +/−0.5% for the two fuels; in the previous work by Lotus Engineering, +0.2/−0.4% was achieved across six blends [17,19,20]).
To illustrate this, Figure 4 and Figure 5 show test data from ignition timing swings for the base fuel, E85, and GEM at the same operating conditions. These operating conditions and the rationale for adopting them have been discussed by Remmert et al. [43], together with other information on the testing conditions. Note that throughout this test campaign, daily checks on performance were maintained and no issues were raised on drift or repeatability by the researchers operating the engine. In Figure 4, the engine operating condition is 2000 rpm speed, with intake plenum conditions of 40 °C and 130 kPa gauge temperature and pressure, respectively. This intake condition is referred to as test point A later in this paper. For the results in Figure 5, the equivalent conditions are 3000 rpm, 60 °C, and 140 kPa gauge, respectively, and it included 10% cooled EGR; it is termed test point D. It is clear from these figures that both of these operating points are high-load conditions, and that both of the high-alcohol-content fuels yield significantly higher BMEP than the base gasoline for the same conditions; furthermore it should be noted that for all operating points discussed here it was these intake and exhaust boundary conditions that were maintained, fixing the air flow rate through the engine at each point, and not the fuel energy flow rate through the engine (despite the fact that the engine was operated at a relative AFR (or λ) of 1 throughout). Test points B and C will be discussed later.
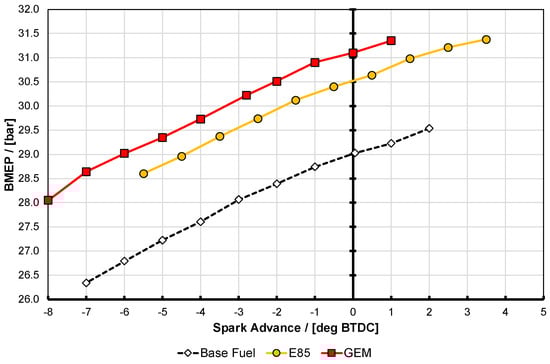
Figure 4.
Ignition timing swings at test point A for E85 and the GEM blend compared with the base 95 RON gasoline fuel. These results are all at a matched engine speed of 2000 rpm and with 40 °C temperature and 130 kPa gauge pressure in the plenum but without any cooled EGR. Note that the engine load (i.e., BMEP) varied with spark advance. See text for discussion on accuracy of the results.
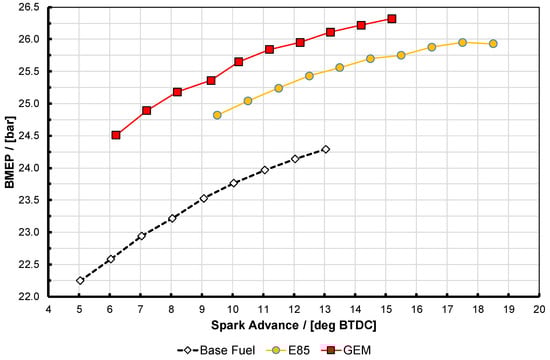
Figure 5.
Ignition timing swings at test point D for E85 and the GEM blend compared with the base 95 RON gasoline fuel. These results are all at a matched engine speed of 3000 rpm and with 60 °C temperature and 140 kPa gauge pressure in the plenum with 10% cooled EGR. Note that the engine load (i.e., BMEP) varied with spark advance. See text for discussion on accuracy of the results.
It is apparent that here the two high-proportion alcohol blend fuels did not perform quite identically. They both reached nearly the same maximum BMEP, with E85 being slightly higher, but interestingly the GEM blend generates approximately 0.6 bar more BMEP for any given amount of spark advance up to its knock-limited spark advance (KLSA) limit (this being the point at which the curves end, i.e., at these high BMEP conditions minimum park advance for best torque (MBT) could not be reached before this point, in spite of the high knock resistance of the fuels). It is presumed that the reason that E85 can generate slightly more BMEP is the fact that it can travel sufficiently further up its spark curve before it reaches its KLSA; this is likely a result of its higher RON and MON values as shown in Table 2. The reason that the GEM blend generates more BMEP at lower values of spark advance is possibly due to a combination of factors, including the fact that the exhaust back pressure (EBP) was slightly lower for the GEM blend than the E85. This is shown in Figure 6 for test point A, where it can also be seen that the gasoline case actually has the lowest EBP of all. For test point D Figure 7 shows the same thing, and the shape of the EBP curve for the GEM fuel here can be seen reflected in the BMEP curve in Figure 5, lending credence to this hypothesis; it should be noted that the absolute difference between the EBP values for test point D is much smaller than it was for test point A. The difference between the alcohol fuel cases was unfortunately not discovered until after the tests had been completed.
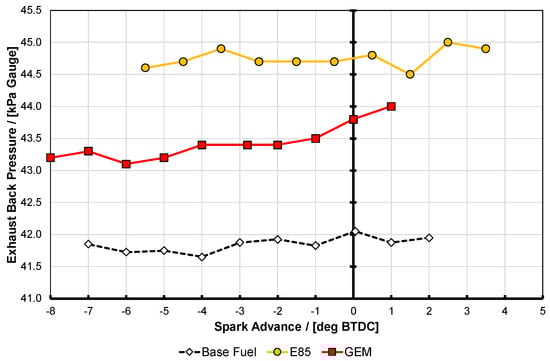
Figure 6.
Exhaust back pressure for the data presented in Figure 4, taken at test point A. See text for discussion on accuracy of the results.
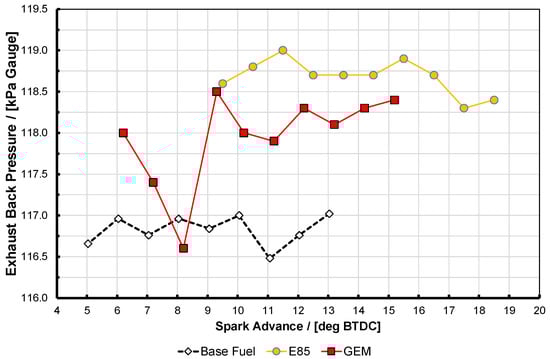
Figure 7.
Exhaust back pressure for the data presented in Figure 6, taken at test point D. See text for discussion on accuracy of the results.
The difference in plenum pressure and temperature across all of the test results shown in Figure 4, Figure 5, Figure 6 and Figure 7 was less than 0.3% and 1 °C, respectively, indicating the excellent accuracy with which the CAHU could hold the intake conditions constant. Note that the valve timing was held constant for each test condition and as a consequence the difference in back pressure is seen as the main reason for the difference in performance between E85 and the GEM blend, because it would lead to a difference in volumetric efficiency. It is not believed that the GEM blend would in itself give better performance, although another difference between the two high-blend alcohol fuels is that different gasoline blend stock was used for each. This is thought to be one of the reasons why the octane numbers of these two fuels vary by 1.4 units, too (as shown in Table 2), as well as the difference in stoichiometric AFR. Whether it is calculated on a mass or volume basis, the E85 and ternary blend will have essentially the same enthalpy of vaporization, as was discussed separately by Chupka et al. for ethanol blends [48] and by Turner et al. for GEM blends [17].
Regardless of the above discussion, it is apparent that the two high-blend alcohol fuels allow the engine to generate significantly more load for the same plenum conditions than when it operates on the baseline fuel. A total of four different test points (shown in Table 3 and including A and D mentioned above) were used to compare fuels during this part of the Ultraboost program, and the rationale for selecting these has been discussed in previous publications [24,43,44,45]. Salient results for these conditions are also presented in Figure 8, Figure 9 and Figure 10.
Table 3.
Test operating points for Ultraboost engine testing.
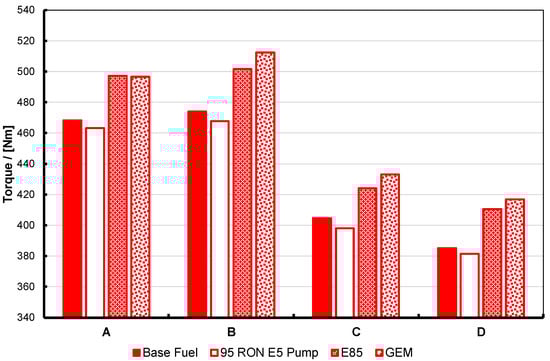
Figure 8.
Maximum torque for the base and 95 RON pump gasolines, E85 and the GEM blend, at four different fixed-intake conditions, operated at KLSA ignition timing. For description of the test operating points, labelled A to D here, see Table 3 and text. Note that the two high-alcohol blends have nearly-matched stoichiometry and enthalpy of vaporization, RON and MON, and as a consequence perform in an essentially identical manner.
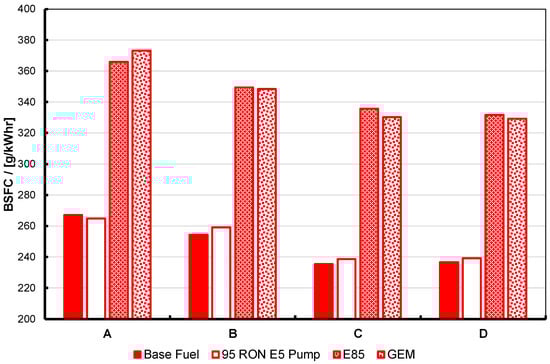
Figure 9.
BSFC at maximum torque for the base and 95 RON pump gasolines, E85 and the GEM blend, at four different fixed-intake conditions, operated at KLSA ignition timing. For description of the test operating points, labelled A to D here, see Table 3 and text. Note that the two high-alcohol blends have nearly-matched stoichiometry and enthalpy of vaporization, RON and MON, and as a consequence perform in an essentially identical manner.
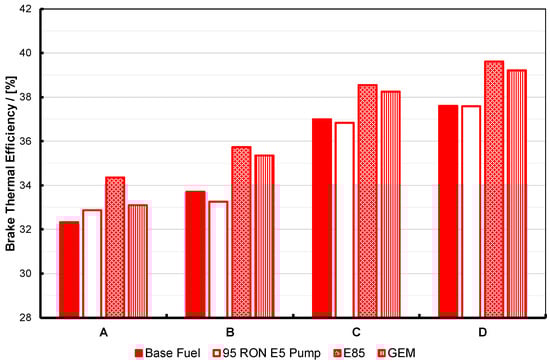
Figure 10.
Brake thermal efficiency at maximum torque for the base and 95 RON pump gasolines, E85 and the GEM blend, at four different fixed-intake conditions, operated at KLSA ignition timing. For description of the test operating points, labelled A to D here, see Table 3 and text. Note that the two high-alcohol blends have nearly-matched stoichiometry and enthalpy of vaporization, RON and MON, and as a consequence perform in an essentially identical manner.
Test point A was intended to represent a highly downsized engine operating near to the torque curve “knee point” but with no cooled EGR being used for knock mitigation. Test point B was effectively point A with the intake boosted to account for 10% external EGR being used by keeping the amount of oxygen flowing through the engine constant; the exhaust back pressure was, however, kept equal between these points. Points C and D are higher speed conditions but with markedly different back pressure. A supercharged engine condition was mimicked by point C, while point D intended to be representative of a turbocharged one with higher exhaust port back pressure; both of these use 10% EGR. Since the plenum conditions were the same for points C and D comparison between these was intended to see what the effect of increased hot residuals retention had on the knock limit. It is accepted, however, that with these two test points there is a conflating effect of reduced volumetric efficiency, even though they shared the same, unvarying, valve timing.
Within the discussion above regarding the slight difference in back pressure for the GEM fuel test, the results shown in Figure 8, Figure 9 and Figure 10 essentially show the expected response. The high-alcohol blends generate significantly greater torque at all test points than the two gasolines. At the same time, the BSFC for the alcohol blends is significantly higher than the two gasolines. However, the brake thermal efficiency for the alcohol blends is also significantly better: generally 1–2% better in absolute terms, and approximately 6% better at test point B. Part of the reason for this will be due to the higher molar expansion ratios of the alcohols versus gasoline, and thus their blends. The importance of this characteristic has been discussed by Szybist et al. [49] and Nguyen et al. [50].
The results for this section reinforce that the blending rules for ternary blends discussed in [17,18,19,20,22] are entirely borne out. As a counterpoint, it is interesting to note that the work of Waqas et al. [23] suggested that the octane of the gasoline used for the blend can have an effect in that a high RON base fuel allows linearity in octane numbers, but that a low RON base fuel yields a non-linear behaviors. However, in this section, the octane numbers of the blends were directly measured. Nevertheless, Waqas et al.’s observations have obvious implications when splash blending such ternary blends. This will be mentioned in later sections.
Some particulate emissions results are now reported here since they were taken as part of the Ultraboost project fuels investigation; Section 5 reports further results from a single-cylinder engine. Figure 11 shows the particulate emissions from the base fuel, E85 and GEM fuels at these test conditions. These were measured using a Cambustion DMS500 sampling at 1 Hz, at steady state, over 30 s and the mean and standard deviation (σ) of the data over that time were taken, with the methodology being equivalent to that discussed in Section 5 and fully described in [47]. The results show that at the four different operating points, the E85 fuel has the lowest PN emissions and the GEM fuel has higher particulate emissions compared to the base fuel. The high PN emissions from the GEM fuel are thought to be caused by the rapid evaporation of that fuel upon injection due to the presence of the high-vapor-pressure methanol. This rapid evaporation then causes locally rich regions to form, which leads to higher particulate emissions. A fuller analysis of these particulate emissions is included in [46,47,51].
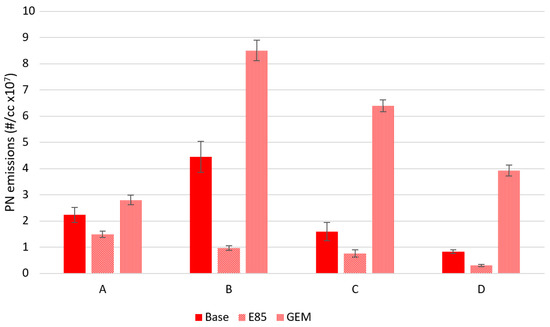
Figure 11.
PN emissions at maximum torque for standard gasoline and two high-alcohol blends at four different fixed-intake conditions. The GEM blend has the highest PN emissions. The error bars correspond to ±σ.
As a consequence of these tests, one can state that, as expected from previous work, the alcohols in general perform better than normal pump gasoline in terms of KLSA, maximum brake output, and thermal efficiency, and with the expected disadvantage in terms BSFC. The results gathered here, allowing for the difference in operating conditions (specifically, the higher back pressure evident when the GEM blend was tested), show the potential for GEM blends to perform at least as well as the binary gasoline-ethanol blends whose stoichiometric AFR they have been matched to, as has been shown in the authors’ previous work. These results are wholly in line with the findings of the first report on this alcohol fuel research using the Ultraboost research engine [9]. However, it must be noted that the presence of methanol in the GEM fuel leads to inferior performance with respect to particulate number, and so more work needs to be carried out in this area.
Nevertheless, it is interesting to reflect that through this approach methanol clearly has a better blending effect with gasoline than ethanol. The justification for this assertion is as follows. E85 and M56 are matched for the same stoichiometric AFR and are known from earlier work to have essentially identical properties, including latent heat, volumetric LHV, RON, MON, and sensitivity [17,18,19,20,22]. Previous researchers have discussed that rather than use liquid volume proportions to compare performance of such fuels, using the molar ratio would provide a better basis, since combustion occurs in the gas phase [11,24]. The molar ratios in these fuels have been calculated using a fuels properties calculator proprietary to the University of Bath [52] and using the logic propounded in [24], with the same properties for gasoline used throughout the calculations, i.e., which is not the case in the actual fuels blended here. Accepting this limitation, the results show that the ethanol mole fraction in E85 is 0.94, whereas the methanol molar concentration in M56 is 0.83. Ceteris paribus, since it can produce the same effect as a higher molar proportion of ethanol can, the lower molar proportion for methanol is proof of its better blending effect in gasoline. Using the same calculator, in the GEM blend tested here the ethanol and methanol mole fractions are 0.24 and 0.63, respectively, giving a total alcohol mole fraction of 0.87, i.e., between the two binary blends, which is logically what one would expect.
Thus, if one wants primarily to improve performance of a gasoline-alcohol fuel, methanol appears to be the better blend component of the two alcohols. It is believed that this is borne out by the initial results of the Co-Optima project in the United States. This project, which is looking at biofuel options to improve energy security for the US and which is looking at medium blend rates (below 30%), has found that of the various different chemical families tried, the alcohols are the most desirable [53]. Indeed in [54], in terms of RON, for a given-percentage blend-rate methanol was shown to have a better response than ethanol when expressed up to ~20% by volume. From the results discussed here at higher blend rates, due to the marked reduction in the volume of methanol required to obtain the same engine efficiency as ethanol when in admixture with gasoline discussed above, it seems self-evident to the authors that in terms of performance methanol is a much more favorable additive when compared with ethanol for transport fuel. As mentioned earlier, it can also extend the impact of a given fixed volume of ethanol (this being limited by biomass availability, for example) when blended together with gasoline, as has been discussed by Turner et al. [17]. Ternary blending of the three components can also make the distillation curve more acceptable than binary blending, overcoming one of the drawbacks listed by the Co-Optima project. As the Co-Optima project moves forward, methanol has been eliminated as a candidate blend agent, primarily on the grounds of blend stability at lower concentrations than discussed here. To the authors of this work methanol would seem to be a preferred choice when considering ternary blends and with engine performance as the sole criterion; unfortunately there has not been such consideration of ternary blends within Co-Optima. The effect of ternary blending of gasoline with the light alcohols on engine performance will be further investigated in the following sections of the present paper.
4. Performance and Emissions of Iso-Stoichiometric GEM Blends in Production Engines and Blend Knock-Limited Spark Advance Tests
Ghent University has operated several engines using pure methanol in a research stream investigating the desirable characteristics of methanol combustion in optimized engines. The alcohols in general have the potential to increase power and efficiency of SI engines [55,56], and their interesting properties allow different load control strategies to be used as well [57]. These studies have shown that any potential improvement is dependent upon the method of engine operation, but with this biased towards the alcohol such benefits can be provided while still maintaining the functional advantage of flex-fuel capability (i.e. so that gasoline could still be used, albeit with lower performance or efficiency, when the alcohol fuel is unavailable). To investigate this concept further, three naturally-aspirated engines were operated on gasoline, methanol and several GEM blends. These were a 4-cylinder PFI production-type Volvo engine, a single-cylinder research engine based on an Audi PFI engine, and a 4-cylinder Hyundai production engine utilizing DI. Details of these engines are shown in Table 4.
Table 4.
Test engine specifications.
All the measurements presented here were taken at steady-state operating conditions at various speeds and loads. Stoichiometric operation was adopted in order to enable the use of a three-way catalyst (TWC). For the Hyundai engine, fitted with DI, tests were conducted with early injection. This resulted in a homogeneous mixture using a closed-loop feedback to control the air/fuel ratio to stoichiometric conditions. MBT spark timing was applied, except for knock-limited operating conditions, where KLSA-2° crank angle was used.
The notion that blends of methanol and ethanol with gasoline with the same stoichiometry as E85 can be used in flex-fuel engines has been investigated on the Volvo 1.8 L engine and Hyundai 2.4 L. The performance, efficiency and emissions of different GEM blends were measured and compared to those on the pure constituent components to evaluate their potential. Additionally, the Audi engine was used for a preliminary study of the knock behavior of these blends because it had a higher CR.
The blends tested in the 1.8 L Volvo engine are shown in Table 5. All were splash blended using a conventional 95 RON pump gasoline. (Note that the blends tested on the Hyundai engine were very similar in terms of volume percentages but used a Haltermann EEE certification gasoline.) In Table 5, there are two binary blends: Blend A represents an idealized ‘normal’ E85 and Blend D is the iso-stoichiometric gasoline-methanol equivalent. This has 57% v/v methanol, 1% v/v methanol more than in the earlier study of Turner et al. [22]. This difference is because of the stoichiometric AFR of the gasoline in this blend. The two remaining blends in Table 5 are true ternary blends. Blend B has half the ethanol of Blend A, and Blend C has half that of Blend B, and in each case, the gasoline and methanol component volumes has been adjusted to maintain the target stoichiometry.
Table 5.
Properties of the GEM blends tested on the 4-cylinder 1.8 L PFI production engine.
Apparent in this data is the fact that as the gasoline proportion increases so the specific CO2 emissions (reported in gCO2/MJ) decrease; this is because methanol has the lowest carbon intensity in terms of gCO2/MJ of the three blend components, and more methanol has to be added as the gasoline content rises.
4.1. Performance
First, the results from the Volvo 1.8 L engine will be discussed. In this engine, four different GEM blends were tested for which the brake thermal efficiency (BTE) is shown in Figure 12. In this figure, the BTE is shown for all blends at a constant load of 40 Nm (2.82 bar BMEP) over a speed range from 1500 to 3500 rpm. Within the range of experimental uncertainty, all of the iso-stoichiometric blends have similar BTEs. Furthermore, this is valid for all of the loads tested.
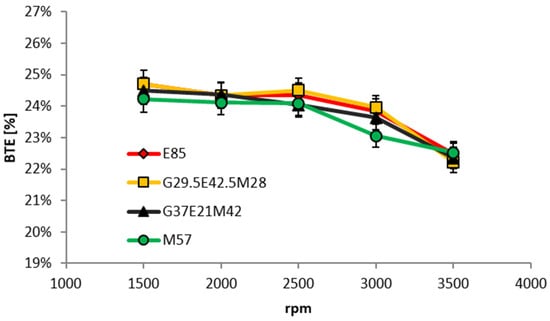
Figure 12.
BTE of various iso-stoichiometric GEM blends as a function of engine speed for a fixed brake torque of 40 Nm (2.82 bar BMEP).
Figure 13 displays a comparison of the BTEs for an average for the GEM blends with their gasoline, methanol, ethanol components at fixed loads of 40 and 80 Nm. This was performed for the GEM blends because their results shown in Figure 12 are within experimental uncertainty. When compared to gasoline, it is clear that the GEM blends show significant efficiency gains, being close to that of pure ethanol. The best for BTE is methanol, which might be expected from the results already discussed.
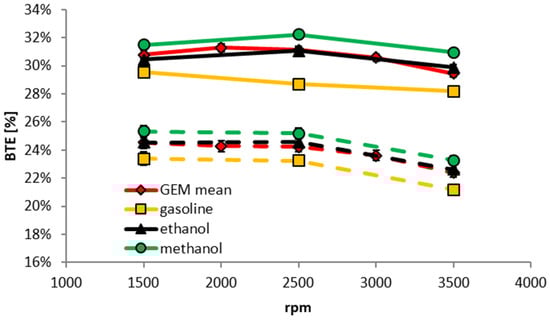
Figure 13.
Brake thermal efficiency when operating on various fuels as a function of engine speed for different fixed brake torques of 40 Nm (2.82 bar BMEP) (dashed lines) and 80 Nm (5.64 bar BMEP) (solid lines).
Because of the near-identical LHV of the four iso-stoichiometric GEM blends (see Table 5) the BSFC results do not depend on mixture composition. This is shown in Figure 14. Figure 15 is a comparison of the BSFCs of the components and the mean of the GEM blends for 40 and 80 Nm. Despite better efficiency with GEM blends, this engine consumes ~32% more fuel by volume than when operating on GEM mixtures than when it is using gasoline. Because of the properties of alcohols this difference would be expected to be smaller for modern highly-downsized and pressure-charged direct-injection (DI) engines. With a full optimization of such an engine, the situation would in all likelihood be further improved.
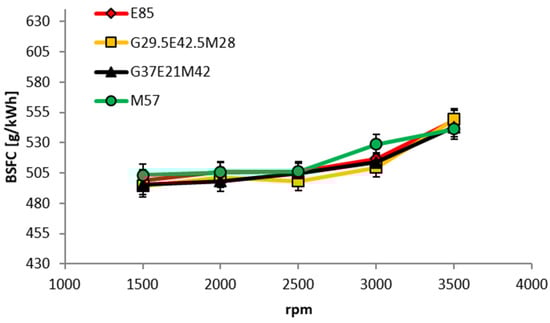
Figure 14.
BSFC of GEM blends as a function of engine speed for a fixed brake torque of 40 Nm (2.82 bar BMEP).
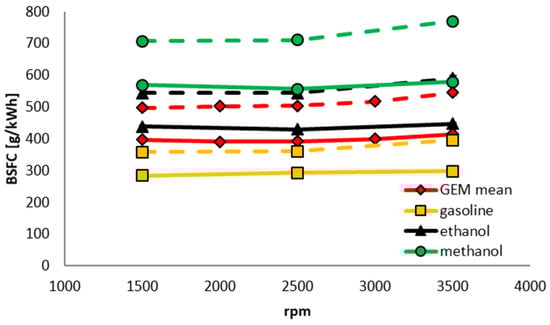
Figure 15.
BSFC as a function of engine speed for different fixed brake torques of 40 Nm (dashed lines) and 80 Nm (solid lines).
In the following section, the focus will be on the difference between the two binary GEM blends as measured on the direct-injected Hyundai engine: E85 and M56. Note that because a different gasoline was used to formulate the GEM blends for these tests, the composition of the binary gasoline-methanol blend has changed slightly compared to the blends listed in Table 5, reducing by 1%. From the results shown in Figure 12, Figure 13, Figure 14 and Figure 15 it is expected that the results of every other GEM blend shown there would be aligned with the results of the binary blends tested in this study.
First, measurements were performed using E85 at fixed loads of 50, 75 and 150 Nm across a speed range of 1500 to 3000 rpm, then these were repeated using M56. In order to produce the same torque output, very small adjustments of the throttle valve were permitted with the two fuels, but the start of injection timing and injection pressure and ignition timing were kept the same throughout. In Figure 16, BTE for the two fuels is shown at the different engine loads, and the only significant difference (i.e., greater than 1%) can be seen at 150 Nm and 2500 rpm, where the error bars do not overlap.
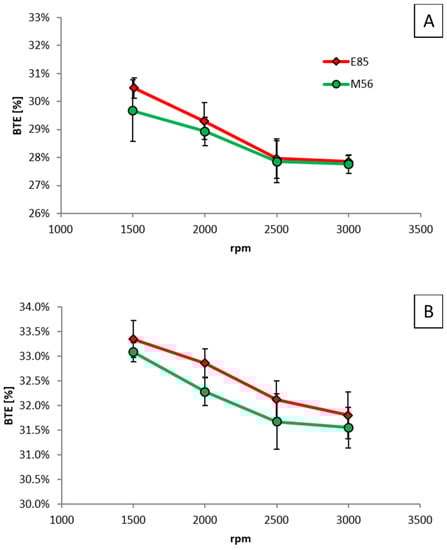
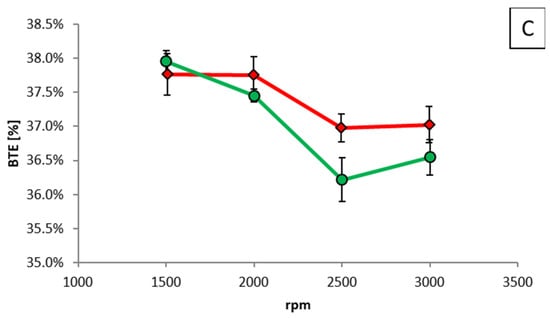
Figure 16.
BTE as a function of engine speed for different fixed brake torques of (A) 50 Nm, (B) 75 Nm, and (C) 150 Nm.
As stated, most of the injection parameters were fixed, the injection duration being the only variable. Figure 17 shows the difference in this variable between E85 and M56. The difference is bigger than 1% for 50 Nm and 75 Nm for one operating point, whereas for 150 Nm, the differences are larger but still only 2.7% at maximum.
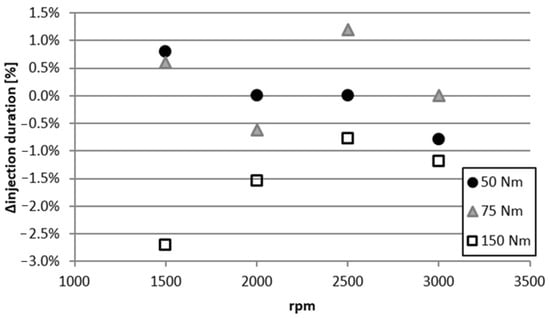
Figure 17.
Difference in injection duration of M56 compared to E85 as a function of engine speed for different fixed brake torques of 50, 75, and 150 Nm.
4.2. NOx Emissions
Figure 18 compares the four GEM blends tested on the 1.8 L PFI Volvo engine in terms of their engine-out NOx emissions. Gasoline fueling generates the highest NOx emissions and methanol the lowest, while those from the GEM blends lie somewhere between the two. Since most NOx is produced by the thermal mechanism (itself highly dependent on the maximum temperature reached) alcohol fuels generate lower levels of this pollutant because of their lower adiabatic flame temperature. At lower engine speeds and loads lower NOx emissions are believed to be partly the result of elevated levels of internal EGR; this is because with the use of conventional throttling to control the engine’s output to a fixed load, the vacuum in the intake is higher for the alcohol fuels due to the fact that they have higher BTE. Note that no knock occurred during the measurements using all the GEM blends and MBT timing could be set for every load and engine speed. In Figure 18, generally speaking, the higher the gasoline content the higher the NOx output, regardless of the proportions of the type of alcohol used to create the blend. Further research in this areas would be warranted.
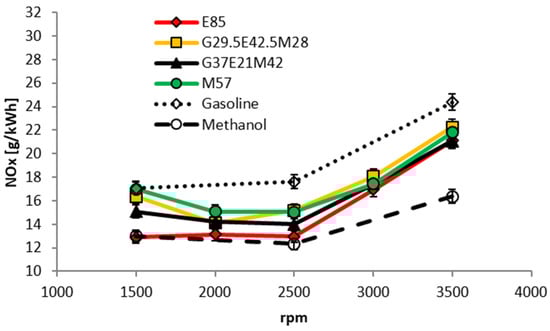
Figure 18.
NOx emissions as a function of engine speed for a fixed brake torque of 40 Nm (2.82 bar BMEP).
The engine-out NOx emissions of E85 and M56 as a function of engine speed, measured on the DI Hyundai engine, are shown in Figure 19. Here the load is higher, at 75 Nm, and again MBT was achievable throughout. For NOx, E85 performs slightly better than M56 although the error bars overlap for most points.
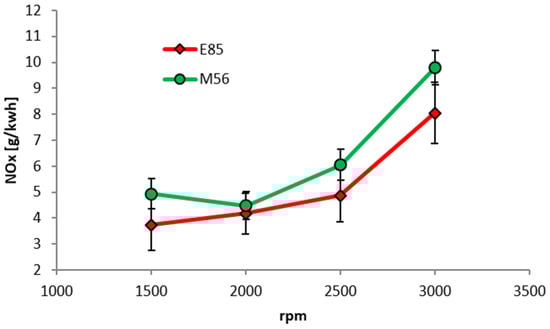
Figure 19.
NOx emissions as a function of engine speed for a fixed brake torque of 75 Nm (5.29 bar BMEP).
4.3. Knock Behavior
From all of the previous work, it is expected that the different GEM fuels would have very similar knock behavior [17,19,20]. To investigate this, all the blends and the individual components were tested on the Audi-based single-cylinder engine, but configured with a higher-than-standard CR of 13.1:1 as shown in Table 4 above. The engine was operated as a fixed BMEP of 7.71 bar (i.e., 25 Nm) and the speed was fixed at 2000 rpm. For each fuel, the ignition timing was advanced until an intermediate knocking condition was obtained. In addition to the RON 95 gasoline used as the component to formulate the blends, a RON 98 gasoline was also investigated. The results of this experiment are shown in Figure 20.
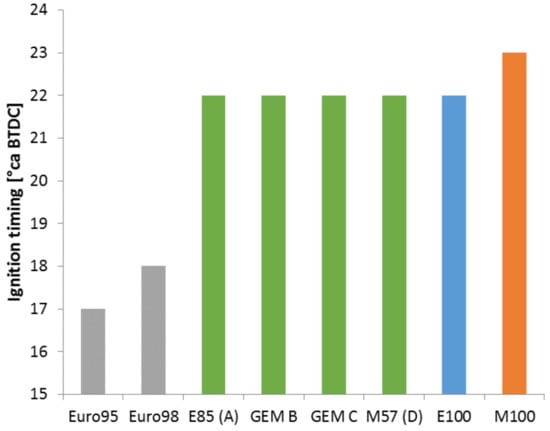
Figure 20.
Knock-limited spark advance of all GEM blends and individual blend components. Audi-based single-cylinder research engine configured with a higher-than-standard CR of 13.1:1. Operating point of 25 Nm (BMEP = 7.71 bar) and 2000 rpm.
In Figure 20, all the GEM blends have the same ignition timing at incipient knock (determined by a combination of audible knock and the third derivative of the pressure signal passing a threshold value). It is therefore reasonable to suppose that they have constant octane numbers. Furthermore, pure ethanol produces the same result. The GEM blends were configured to be equivalent to E85 which has 93% molar concentration of ethanol as discussed earlier and so this is understandable. Methanol still displays superior knock resistance to all of the other fuels.
Since the fuels used in this section were splash blended using relatively high-octane gasoline, this work is considered to support the observations of Waqas et al. that using such a gasoline as a blend component ensures linearity in the knock resistance of the resulting fuel [23].
5. Particulate Emissions from GEM Fuels in a Direct-Injection Spark-Ignition Engine
In Section 3, high-load PN emissions from the Ultraboost 4-cylinder engine operating on GEM blends were reported. Here, particulate emissions are presented from four GEM fuels and a base gasoline, measured from a single-cylinder DI engine at lighter engine loads. This was performed because while gaseous emissions have been presented several times for GEM blends, PN emission have not been recorded as much.
5.1. Fuels Tested
For this experiment, four GEM fuels were splash blended from the three components. Their composition was the same as those tested in the first paper published by Turner et al. [17] and is reproduced in Table 6, together with their predicted dry vapor pressure equivalent (DVPE).
Table 6.
Composition of the GEM fuels tested in the single-cylinder DI engine.
The base gasoline for these blends was a CEC RF-02-03-specification gasoline supplied by BP. This gasoline has no oxygenated components present in it, and its properties are shown in Table 7. Note that in this table the abbreviation DVPE refers to dry vapor pressure equivalent, and IBP to the initial boiling point in the distillation curve, T90 to the point at which 90% of the fuel mass has boiled off, and FBP to the final boiling point at which the last components boil off.
Table 7.
Composition of the base CEC RF-02-03 gasoline test fuel.
5.2. Expected Fuel Effects on PN Emissions
It has previously been noted [59] that AFRs rich of stoichiometric increase particulate emissions. This is true of ethanol, but the increase in particulate matter (PM) emissions rich of stoichiometric for ethanol is very small, and anyway compared to gasoline it is effectively a dramatic reduction; as an example, E10 has been shown to produce a greater than one order of magnitude reduction in PM emissions compared with straight gasoline [60]. This is thought to be due to the presence of oxygen in the fuel molecule which reduces the concentration of intermediate species that are important to the formation of precursors to soot [61].
As methanol is added to a fuel, its vapor pressure increases, as can be seen by the change in predicted DVPE in Table 6. High vapor pressures can result in the flash boiling of the fuel on injection, leading to very poor mixture preparation and concomitantly high levels of PM emissions.
Flash boiling occurs when a liquid jet is injected into a volume with a pressure lower than the saturation vapor pressure of the liquid. Here the fuel evaporates so quickly that it essentially does so as it leaves the injector, occurring in an “onion skin” manner, with the outer layers evaporating first. This is regardless of the composition of the layers and is known to occur in DI engines [62]. The liquid is then rapidly depressurized, becoming superheated and consequently thermodynamically unstable, only regaining its stability by flash boiling.
5.3. Test Engine
The single-cylinder engine used for these tests was based on that of the Jaguar AJ133 5.0 L V8 engine [63]. Its specification are shown in Table 8. It is described more fully in [58] and here it was not used in its optical configuration.
Table 8.
Single-cylinder DI engine specifications. IVO = intake valve opens; IVC = intake valve closes; EVO = exhaust valve opens; EVC = exhaust valve closes; ATDC = after top dead center; ABDC = after bottom dead center; BBDC = before bottom dead center.
5.4. Particulate Measurements
A Cambustion DMS500 [64] was used to measure PN emissions. While this was not a legislative test, in order to make these results representative of PN emissions measured during such a test, a Wiebe filter was used to mimic the effect of the PMP legislatively-compliant protocol [65]. Measurements at 1 Hz were taken for 60 s at steady state, and the mean and standard deviation (σ) of the data over that time were taken.
5.5. Results
For these experiments, the engine was operated at two fixed indicated mean effective pressure (IMEP) points (corresponding to low and medium loads) at 1500 rpm as shown as in Table 9. For each load, open-loop AFR control was used at λ = 0.9 and 1.01. λ = 1.01 was chosen to avoid any small rich mixture excursions which are known to have a large effect on the PM emissions from non-oxygenated fuels [59]. Because of this, these rich excursions tend to dominate drive cycle PM results, hence testing was also conducted at λ = 0.9.
Table 9.
Engine operating conditions for GEM fuels and gasoline. BTDC = before top dead center.
Figure 21 shows the PN emissions from the GEM fuels at light load (2.6 bar IMEP). In these results, there is a clear trend of increasing PN emissions for the GEM fuels from blends A to C as the methanol quantity increases. Confidence in these results is provided by the fact that the experimental sequence was randomized and a single repeat of GEM D was undertaken with highly repeatable results.
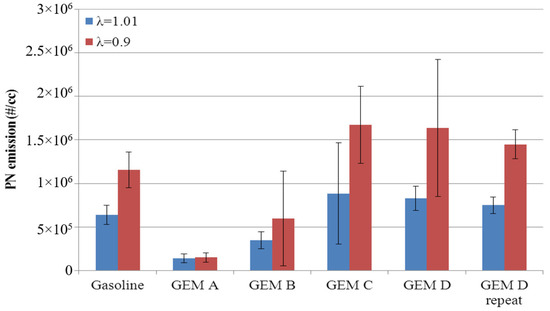
Figure 21.
PN emissions from GEM fuels at 2.6 bar IMEP. Error bars correspond to ±σ.
In Figure 21, it also is shown clearly that once a certain level of methanol is passed in the fuel (say GEM Blend C), there is no further increase in PN emissions. Furthermore the base gasoline values fall half way in the sequence, i.e., gasoline gives higher levels of PN emissions than GEM B, but lower than GEM C. At this load point, this in turn suggests that the presence of ethanol reduces PN while methanol does the opposite, despite a higher proportion of oxygenated components; it is flash boiling that also explains this. Since the methanol component flashes first, this results in poor mixture preparation and hence increases PN emissions. As the amount of methanol in the fuel is reduced, its deleterious effect in this regard is reduced, and instead other factors that cause oxygenate fuels to reduce particulate emissions become important, causing PN emissions to then be reduced from the gasoline levels.
Figure 22 shows the PN emissions from Blend A, Blend D and gasoline at the higher load operating point (4.9 bar IMEP). While the light load trends are repeated, the PN emissions of Blend D are now below those of the gasoline baseline. It is hypothesized that at higher pressures the flash boiling of methanol is suppressed, allowing those factors which generally cause oxygenate fuels to reduce PN to dominate in the same way that they do for ethanol.
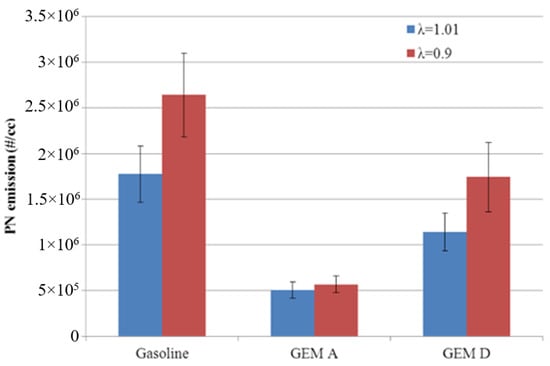
Figure 22.
PN emissions from gasoline and two GEM fuels at 4.9 bar IMEP. Error bars correspond to ±σ.
Overall, the results in this section show that using GEM fuels in DI engines will not significantly impact PN emissions versus gasoline, other than possibly to decrease them significantly. The caveat is that at light load, and when methanol is present in a high proportion, the results suggest that a slight increase in PN emissions over those from gasoline may be seen, but as the load increases, then all such GEM fuels will then give lower PN emissions. This is likely due to methanol flash boiling at low pressures, and this effect reducing as the BMEP increases. The equivalent conditions are not reached for the ethanol in the fuel for either test point, so it tends to suppress PN emission formation. Further research is warranted into this phenomenon and whether, where other alcohols are being considered as blend components in future fuels (for example, butanol), they show any similar trends.
6. Conclusions
Through investigations in several different research engines, this paper has shown that, at mid-to high-blend rates:
- In support of earlier work by the authors and other research groups, ternary (three component) mixtures of gasoline, ethanol, and methanol (or GEM) can be formulated using an iso-stoichiometric approach to provide a drop-in alternative fuel for any given binary gasoline-ethanol blend.
- When so configured, such GEM fuels have matched gravimetric lower heating values, heats of vaporization, and molar concentrations of reactants in the charge. The latter two characteristics gives rise to similar molar expansion ratios and extremely close RON and MON values. With these come very close sensitivities.
- The improvement in full-load performance of such high-blend-rate fuels in terms of KLSA, and the associated better BMEP and thermal efficiency, is entirely in line with what is expected for high-blend alcohols over conventional gasoline fuels. There is also the expected disadvantage in terms of BSFC due to the reduction in gravimetric energy content in relation to pure hydrocarbon fuels. These results are consistent with the literature and regardless of EGR being used or the amount of exhaust back pressure applied to the combustion system (to simulate turbocharged or supercharged operation of an engine).
- NOx emissions are shown to be lower with the alcohol blends (and lowest with pure methanol). Furthermore they are consistent for the iso-stoichiometric formulations, with a suggestion that within such GEM blends increased methanol content tends to lower NOx emissions further.
- When tested in a single-cylinder engine, the knock performance of the tested blends is essentially identical, and at the high blend rate (equivalent to the stoichiometry of E85) the same as pure ethanol and very close to that of methanol. This result is in line with the previous observations on the RON, MON, and sensitivity performance of such blends.
- In terms of particulate emissions, the results presented here show that using GEM fuels is unlikely to impact the PN emissions from DI engines significantly, and that many of these fuels can decrease the magnitude observed.
- GEM fuels with a higher proportion of methanol do tend to generate more PN emissions than gasoline at low load, which is attributed to higher degrees of flash boiling at lower in-cylinder pressures. However, this result reverses with increased load and may be due to the change in the dominance of flash boiling effects, with the presence of oxygen in the fuel then reducing the number of particulate precursors formed in combustion.
- At lower loads the presence of a high proportion of ethanol in a blend significantly reduces PN emissions compared to gasoline. This is again believed to be due to the molecule containing oxygen; the flash boiling effect is also lower for ethanol than it is for methanol, which is believed to contribute to this result.
Because methanol can be manufactured using low- and zero-net-carbon pathways (using biological routes which remove CO2 from the atmosphere via plant growth or by direct air capture and utilization in a fully synthetic manufacturing route, respectively), there is thus the potential to introduce it into the fuel pool used by the more than 9 million E85-gasoline flex-fuel vehicles in existence via GEM ternary blends. The lower price of methanol could also beneficially impact the fuel cost on a per unit energy basis, which is generally not the case for E85. Furthermore, although only demonstrated here at a blend rate equivalent to E85, the approach is also viable for any gasoline-ethanol binary blend.
Author Contributions
Conceptualization, J.W.G.T., S.V., F.C.P.L., and P.P.E.; methodology, J.W.G.T., A.G.J.L., L.S., and F.C.P.L.; validation, A.G.J.L., J.V., L.S., and F.C.P.L.; formal analysis, J.W.G.T., S.V., L.S., and F.C.P.L.; investigation, A.G.J.L., L.S., and F.C.P.L.; resources, S.A., S.V., and F.C.P.L.; data curation, J.W.G.T., A.G.J.L., L.S., and F.C.P.L.; writing—original draft preparation, J.W.G.T, L.S., S.V., and F.C.P.L.; writing—review and editing, A.G.J.L., S.A., C.J.B., J.V., L.S., F.C.P.L., and P.P.E.; funding acquisition, S.A., C.J.B., S.V., and F.C.P.L. All authors have read and agreed to the published version of the manuscript.
Funding
Elements of the reported research took place as part of the “Ultra Boost for Economy” project part funded by the Technology Strategy Board, now Innovate UK, the United Kingdom’s innovation agency; their support is similarly gratefully acknowledged. J. Vancoillie and L. Sileghem gratefully acknowledge fellowships from the Research Foundation—Flanders (FWO09/ASP/030 and FWO11/ASP/056).
Acknowledgments
Although too numerous to detail here, the historical support and encouragement of many individuals and organizations involved in the methanol industry and flex-fuel vehicle production is very gratefully acknowledged. Their faith in what was initially a purely academic finding concerning the properties of iso-stoichiometric GEM fuels has been extremely valuable and encouraging throughout the conduct of all aspects of this research. The partners in the Ultraboost project were Jaguar Land Rover, Lotus Engineering, GE Precision Engineering, Shell Global Solutions, CD-adapco, the University of Bath, Imperial College London, and the University of Leeds, and all of their help and contributions to the reported work are gratefully acknowledged.
Conflicts of Interest
The authors declare no conflict of interest.
Abbreviations
| ABDC | After top dead center |
| AFR | Air-fuel ratio |
| ATDC | After top dead center |
| BBDC | Before bottom dead center |
| BEV | Battery electric vehicle |
| BMEP | Brake mean effective pressure |
| BSFC | Brake specific fuel consumption |
| BTDC | Before top dead center |
| BTE | Brake thermal efficiency |
| CAHU | Charge air handling unit |
| CO | Carbon monoxide |
| CO2 | Carbon dioxide |
| CR | Compression ratio |
| DI | Direct injection |
| DOHC | Double overhead camshaft |
| DVPE | Dry vapor pressure equivalent |
| EGR | Exhaust gas recirculation |
| EVC | Exhaust valve closes |
| EVO | Exhaust valve opens |
| FBP | Final boiling point (at which the last components boil off in the distillation curve) |
| GEM | Gasoline-ethanol–methanol |
| HC | Hydrocarbons |
| IBP | Initial boiling point (at which the first components boil off in the distillation curve) |
| ICE | Internal combustion engine |
| IMEP | Indicated mean effective pressure |
| ITE | Indicated thermal efficiency |
| IVC | Intake valve closes |
| IVO | Intake valve opens |
| KLSA | Knock-limited spark advance |
| LHV | Lower heating value |
| MBT | Minimum spark advance for best torque |
| MON | Motor octane number |
| NOx | Oxides of nitrogen |
| OHC | Overhead camshaft |
| PFI | Port fuel injection |
| PM | Particulate matter |
| PN | Particle number |
| ppm | Parts per million |
| RON | Research octane number |
| SI | Spark ignition |
| T90 | Point at which 90% of the fuel mass has boiled off (in the distillation curve) |
| TWC | Three-way catalyst |
| ∆hvap | Heat of vaporization |
| σ | Standard deviation |
References
- Gross, M. A planet with two billion cars. Curr. Biol. 2016, 26, R307–R310. [Google Scholar] [CrossRef]
- Gutzmer, P. Mobility for Tomorrow—Between the Poles of Electrification. In Proceedings of the 26th Aachen Colloquium, Aachen, Germany, 9–11 October 2017. [Google Scholar]
- Woodward, M. New Market. New Entrants. New Challenges. Battery Electric Vehicles. Deloitte. 2019. Available online: https://www2.deloitte.com/content/dam/Deloitte/uk/Documents/manufacturing/deloitte-uk-battery-electric-vehicles.pdf (accessed on 19 June 2020).
- Leach, F.C.P.; Akehurst, S.; Brace, C.; Busch, H.; Cairns, A.; Davy, M.; Gavaises, M.; Heikal, M.H.; Linne, M.; Shayler, P.; et al. Road bumps for electric cars (letter). Economist 2017, 413, 16. [Google Scholar]
- White, T.L. Alcohol as a Fuel for the Automobile Motor; SAE Technical Paper Series; SAE International: Warrendale, PA, USA, 1907. [Google Scholar] [CrossRef]
- Niizato, T. Future direction of Engine and PHEV technology at Honda. In Proceedings of the 14th International Conference on Engines for Vehicles, Hokkaido, Japan, 27–31 August 2017. [Google Scholar]
- Fraidl, G.; Kapus, P.; Mitterecker, H.; Weißbäck, M. Internal Combustion Engine 4.0. MTZ Worldw. 2018, 79, 26–33. [Google Scholar] [CrossRef]
- Powell, N.; Hill, N.; Bates, J.; Bottrell, N.; Biedka, M.; White, B.; Pine, T.; Carter, S.; Patterson, J.; Yucel, S. Impact Analysis of Mass EV Adoption and Low Carbon Intensity Fuels Scenarios. CONCAWE Report RD18-001538-4. 24 August 2018. Available online: https://www.fuelseurope.eu/wp-content/uploads/Mass-EV-Adoption-and-Low-Carbon-Fuels-Scenarios.pdf (accessed on 30 November 2020).
- Turner, J.W.G.; Lewis, A.G.J.; Akehurst, S.; Brace, C.J.; Verhelst, S.; Vancoillie, J.; Sileghem, L.; Leach, F.C.P.; Edwards, P.P. Alcohol fuels for spark-ignition engines: Performance, efficiency and emission effects at mid to high blend rates for binary mixtures and pure components. Proc. Inst. Mech. Eng. Part D J. Automob. Eng. 2018, 232, 36–56. [Google Scholar] [CrossRef]
- Foong, T.M.; Morganti, K.J.; Brear, M.J.; da Silva, G.; Yang, Y.; Dryer, F.L. The octane numbers of ethanol blended with gasoline and its surrogates. Fuel 2014, 115, 727–739. [Google Scholar] [CrossRef]
- Anderson, J.E.; Leone, T.G.; Shelby, M.H.; Wallington, T.J.; Bizub, J.J.; Foster, M.; Lynskey, M.G.; Polovina, D. Octane Numbers of Ethanol-Gasoline Blends: Measurements and Novel Estimation Method from Molar Composition. SAE Technical Paper 2012-01-1274. In Proceedings of the SAE 2012 World Congress, Detroit, MI, USA, 24–26 April 2012. [Google Scholar] [CrossRef]
- Bergström, K.; Melin, S.-A.; Jones, C.C. The New ECOTEC Turbo BioPower Engine from GM Powertrain—Utilizing the Power of Nature’s resources. In Proceedings of the 28th International Vienna Motor Symposium, Vienna, Austria, 26–27 April 2007. [Google Scholar]
- Bergström, K.; Nordin, H.; Königstein, A.; Marriott, C.D.; Wiles, M.A. ABC—Alcohol Based Combustion Engines—Challenges and Opportunities. In Proceedings of the 16th Aachen Colloquium, Aachen, Germany, 7 October 2007; pp. 1031–1071. [Google Scholar]
- Turner, J.W.G.; Pearson, R.J.; Holland, B.; Peck, B. Alcohol-Based Fuels in High Performance Engines. SAE Technical Paper 2007-01-0056. In Proceedings of the SAE Fuels and Emissions Conference, Cape Town, South Africa, 23–25 January 2007. [Google Scholar] [CrossRef]
- Wallner, T.; Miers, S.A. Combustion Behavior of Gasoline and Gasoline/Ethanol Blends in a Modern Direct-Injection 4-Cylinder Engine. SAE Technical Paper 2008-01-0077. In Proceedings of the SAE 2008 World Congress, Detroit, MI, USA, 14–17 April 2008. [Google Scholar] [CrossRef]
- West, B.H.; López, A.J.; Theiss, T.J.; Graves, R.L.; Storey, J.M.; Lewis, S.A. Fuel Economy and Emissions of the Ethanol-Optimized Saab 9-5-Biopower. SAE Technical Paper 2007-01-3994. In Proceedings of the SAE Powertrain & Fluid Systems Conference and Exhibition, Rosemont, IL, USA, 29 October–1 November 2007. [Google Scholar] [CrossRef]
- Turner, J.W.G.; Pearson, R.J.; Purvis, R.; Dekker, E.; Johansson, K.; Bergström, K. GEM Ternary Blends: Removing the Biomass Limit by using Iso-Stoichiometric mixtures of Gasoline, Ethanol and Methanol. SAE Paper Number 2011-24-0113. In Proceedings of the 10th International Conference on Engines and Vehicles, Capri, Naples, Italy, 11–16 September 2011. [Google Scholar] [CrossRef]
- Turner, J.W.G.; Pearson, R.J.; Dekker, E.; Iosefa, B.; Dolan, G.A.; Johansson, K.; Bergström, K. Evolution of alcohol fuel blends towards a sustainable transport energy economy. In Proceedings of the 2012 MIT Energy Initiative Symposium: Prospects for Flexible- and Bi-Fuel Light Duty Vehicles, Cambridge, MA, USA, 19 April 2012. [Google Scholar]
- Turner, J.W.G.; Pearson, R.J.; McGregor, M.A.; Ramsay, J.M.; Dekker, E.; Iosefa, B.; Dolan, G.A.; Johansson, K.; Bergström, K. GEM Ternary Blends: Testing Iso-Stoichiometric mixtures of Gasoline, Ethanol and Methanol in a Production Flex-Fuel Vehicle Fitted with a Physical Alcohol Sensor. SAE Paper Number 2012-01-1279. In Proceedings of the SAE 2012 World Congress, Detroit, MI, USA, 24–26 April 2012. [Google Scholar] [CrossRef]
- Turner, J.W.G.; Pearson, R.J.; de Goede, S.B.A.; Woolard, C. GEM Ternary Blends: Investigations into Exhaust Emissions, Blend Properties and Octane Numbers. SAE Paper Number 2012-01-1586. In Proceedings of the SAE Powertrains, Fuels and Lubricants Meeting, Malmo, Sweden, 18–20 September 2012. [Google Scholar]
- Pitcher, G.; Turner, J.W.G.; Pearson, R.J. GEM Ternary Blends of Gasoline, Ethanol and Methanol: An Initial Investigation into Fuel Spray and Combustion Characteristics in a Direct-Injected Spark-Ignition Optical Engine using Mie Imaging. SAE Technical Paper 2012-01-1740. In Proceedings of the SAE Powertrains, Fuels and Lubricants Meeting, Malmo, Sweden, 18–20 September 2012. [Google Scholar] [CrossRef]
- Turner, J.W.G.; Pearson, R.J.; Dekker, E.; Iosefa, B.; Dolan, G.; Johansson, K.; Bergström, K. Extending the role of alcohols as transport fuels using iso-stoichiometric ternary blends of gasoline, ethanol and methanol. Appl. Energy 2013, 102, 72–86. [Google Scholar] [CrossRef]
- Waqas, M.; Naser, N.; Sarathy, M.; Feijs, J.; Morganti, K.; Nyrenstedt, G.; Johansson, B. Auto-Ignition of Iso-Stoichiometric Blends of Gasoline-Ethanol-Methanol (GEM) in SI, HCCI and CI Combustion Modes. SAE Technical Paper 2017-01-0726. In Proceedings of the SAE 2017 World Congress, Detroit, MI, USA, 4–6 April 2017. [Google Scholar] [CrossRef]
- Pearson, R.J.; Turner, J.W.G.; Bell, A.; de Goede, S.; Woolard, C.; Davy, M.H. Iso-stoichiometric fuel blends: Characterisation of physicochemical properties for mixtures of gasoline, ethanol, methanol and water. Proc. Inst. Mech. Eng. Part D J. Automob. Eng. 2014, 229, 111–139. [Google Scholar] [CrossRef]
- Turner, J.W.G.; Pearson, R.J.; Harrison, P.; Marmont, A.; Jennings, R.; Verhelst, S.; Vancoillie, J.; Sileghem, L.; Pecqueur, M.; Martens, K.; et al. Evolutionary decarbonization of transport: A contiguous roadmap to affordable mobility using Sustainable Organic Fuels for Transport. In Proceedings of the Institution of Mechanical Engineers Sustainable Vehicle Technologies Conference, Gaydon, UK, 15–16 November 2012. [Google Scholar]
- Pearson RJTurner, J.W.G.; Eisaman, M.D.; Littau, K.A. Extending the Supply of Alcohol Fuels for Energy Security and Carbon Reduction. SAE Technical Paper 2009-01-2764. In Proceedings of the SAE Powertrain, Fuels and Lubricants Meeting, San Antonio, TX, USA, 2–4 November 2009. [Google Scholar] [CrossRef]
- Pearson, R.J.; Eisaman, M.D.; Turner, J.W.G.; Edwards, P.P.; Jiang, Z.; Kuznetsov, V.L.; Littau, K.A.; di Marco, L.; Taylor, S.R.G. Energy storage via carbon-neutral fuels made from CO2, water, and renewable energy. Proc. IEEE 2012, 100, 440–460. [Google Scholar] [CrossRef]
- Verhelst, S.; Turner, J.W.G.; Sileghem, L.; Vancoillie, J. Methanol as a fuel for internal combustion engines. Prog. Energy Combust. Sci. 2019, 70, 43–88. [Google Scholar] [CrossRef]
- Steinberg, M. Production of synthetic methanol from air and water using controlled thermonuclear reactor power—I. Technology and energy requirement. Energy Convers. 1977, 17, 97–112. [Google Scholar] [CrossRef]
- Olah, G.A.; Goeppert, A.; Prakash, G.K.S. Beyond Oil and Gas: The Methanol Economy, 2nd ed.; Wiley-VCH Verlag GmbH & Co. KGaA: Weinheim, Germany, 2009; ISBN 98-3-527-32422-4. [Google Scholar]
- Bandi, A.; Specht, M.; Weimer, T.; Schaber, K. CO2 recycling for hydrogen storage and transportation—Electrochemical CO2 removal and fixation. Energy Convers. Manag. 1995, 36, 899–902. [Google Scholar] [CrossRef]
- Stucki, S.; Schuler, A.; Constantinescu, M. Coupled CO2 recovery from the atmosphere and water electrolysis: Feasibility of a new process for hydrogen storage. Int. J. Hydrog. Energy 1995, 20, 653–663. [Google Scholar] [CrossRef]
- Weimer, T.; Schaber, K.; Specht, M.; Bandi, A. Methanol from atmospheric carbon dioxide: A liquid zero emission fuel for the future. Energy Convers. Manag. 1996, 37, 1351–1356. [Google Scholar] [CrossRef]
- Sileghem, L.; Coppens, A.; Casier, B.; Vancoillie, J.; Verhelst, S. Performance and emissions of iso-stoichiometric ternary GEM blends on a production SI engine. Fuel 2014, 117, 286–293. [Google Scholar] [CrossRef]
- Sileghem, L.; Ickes, A.; Wallner, T.; Verhelst, S. Experimental Investigation of a DISI Production Engine Fuelled with Methanol, Ethanol, Butanol and ISO-Stoichiometric Alcohol Blends. SAE Technical Paper 2015-01-0768. In Proceedings of the SAE 2015 World Congress, Detroit, MI, USA, 21–23 April 2015. [Google Scholar] [CrossRef]
- Shirazi, S.A.; Abdollahipoor, B.; Martinson, J.; Windom, B.; Foust, T.D.; Reardon, K.F. Effects of dual-alcohol gasoline blends on physiochemical properties and volatility behavior. Fuel 2019, 252, 542–552. [Google Scholar] [CrossRef]
- Larsson, T.; Stenlaas, O.; Erlandsson, A. Future Fuels for DISI Engines: A Review on Oxygenated, Liquid Biofuels. SAE Technical Paper 2019-01-0036. In Proceedings of the SAE 2018 World Congress, Detroit, MI, USA, 10–12 April 2018. [Google Scholar] [CrossRef]
- Shirazi, S.A.; Abdollahipoor, B.; Windom, B.; Reardon, K.F.; Foust, T.D. Effects of blending C3-C4 alcohols on motor gasoline properties and performance of spark ignition engines: A review. Fuel Process. Technol. 2020, 197, 106194. [Google Scholar] [CrossRef]
- Bergthorson, J.M.; Thomson, M.J. A review of the combustion and emissions properties of advanced transportation biofuels and their impact on existing and future engines. Renew. Sustain. Energy Rev. 2015, 42, 1393–1417. [Google Scholar] [CrossRef]
- Züttel, A.; Remhof, A.; Borgschulte, A.; Friedrichs, O. Hydrogen: The future energy carrier. Phil. Trans. R. Soc. Part A 2010, 368, 3329–3342. [Google Scholar] [CrossRef]
- Turner, J.W.G.; Popplewell, A.; Patel, R.; Johnson, T.; Darnton, N.J.; Richardson, S.; Bredda, S.W.; Jackson, R.; Bithell, C.; Tudor, R.; et al. Ultra Boost for Economy: Extending the Limits of Extreme Engine Downsizing. SAE Technical Paper 2014-01-1185. In Proceedings of the SAE 2014 World Congress, Detroit, MI, USA, 8–10 April 2014; Volume 7. [Google Scholar] [CrossRef]
- Lewis, A.G.J.; Akehurst, S.; Turner, J.W.G.; Patel, R.; Popplewell, A. Observations on the measurement and performance impact of catalyzed vs. non-catalyzed EGR on a heavily downsized DISI engine. SAE Technical Paper 2014-01-1196. In Proceedings of the SAE 2014 World Congress, Detroit, MI, USA, 8–10 April 2014; Volume 7. [Google Scholar] [CrossRef]
- Remmert, S.M.; Cracknell, R.; Head, B.; Schuetze, A.; Lewis, A.G.J.; Akehurst, S.; Turner, J.W.G.; Popplewell, A. Octane Response in a Downsized, Highly Boosted Direct Injection Spark Ignition Engine. SAE Technical Paper 2014-01-1397. In Proceedings of the SAE 2014 World Congress, Detroit, MI, USA, 8–10 April 2014; Volume 7. [Google Scholar] [CrossRef]
- Campbell, S.; Remmert, S.; Cracknell, R.; Schuetze, A.; Warnecke, W.; Lewis, A.; Akehurst, S.; Turner, J.W.G.; Patel, R.; Popplewell, A. Fuel Effects in a Downsized, Highly Boosted Direct Injection Spark Ignition Engine. In Proceedings of the 23rd Aachen Colloquium, Aachen, Germany, 6–8 October 2014. [Google Scholar]
- Remmert, S.; Campbell, S.; Cracknell, R.; Schuetze, A.; Lewis, A.; Giles, K.; Akehurst, S.; Turner, J.W.G.; Popplewell, A.; Patel, R. Octane Appetite: The Relevance of a Lower Limit to the MON Specification in a Downsized, Highly Boosted DISI Engine. SAE Technical Paper 2014-01-2718. In Proceedings of the SAE 2014 Powertrain, Fuels and Lubricants Conference, Birmingham, UK, 20–23 October 2014; Volume 7. [Google Scholar] [CrossRef]
- Leach, F.C.P.; Stone, C.R.; Richardson, D.; Lewis, A.G.J.; Akehurst, S.; Turner, J.W.G.; Remmert, S.; Campbell, S.; Cracknell, R.F. The effect of oxygenate fuels on PN emissions from a highly boosted GDI engine. Fuel 2018, 225, 277–286. [Google Scholar] [CrossRef]
- Leach, F.C.P.; Stone, R.; Richardson, D.; Lewis, A.G.J.; Akehurst, S.; Turner, J.W.G.; Remmert, S.; Campbell, S.; Cracknell, R.F. Particulate emissions from a highly boosted gasoline direct injection engine. Int. J. Engine Res. 2018, 19, 347–359. [Google Scholar] [CrossRef]
- Chupka, G.M.; Christensen, E.; Fouts, L.; Alleman, T.L.; Ratcliff, M.A.; McCormick, R.L. Heat of Vaporization Measurements for Ethanol Blends Up to 50 Volume Percent in Several Hydrocarbon Blendstocks and Implications for Knock in SI Engines. SAE Technical Paper 2015-01-0763. In Proceedings of the SAE 2015 World Congress, Detroit, MI, USA, 21–23 April 2015; Volume 8. [Google Scholar] [CrossRef]
- Szybist, J.P.; Chakravathy, K.; Daw, C.S. Analysis of the Impact of Selected Fuel Thermochemical Properties on Internal Combustion Engine Efficiency. Energy Fuels 2012, 26, 2798–2810. [Google Scholar] [CrossRef]
- Nguyen, K.-D.; Szybist, J.; Sileghem, L.; Verhelst, S. Effects of molar expansion ratio of fuels on engine efficiency. Fuel 2020, 263, 116743. [Google Scholar] [CrossRef]
- Leach, F.C.P.; Stone, R.; Richardson, D.; Lewis, A.G.J.; Akehurst, S.; Turner, J.W.G.; Shankar, V.; Chahal, J.; Cracknell, R.F.; Aradi, A. The effect of fuel composition on particulate emissions from a highly boosted GDI engine—An evaluation of three particulate indices. Fuel 2019, 252, 598–611. [Google Scholar] [CrossRef]
- Millwood, D.; Turner, J.W.G. Fuel Properties Calculator; Proprietary Software; University of Bath: Bath, UK, 2020. [Google Scholar]
- Sluder, C.S. Estimation of the Fuel Efficiency Potential of Six Gasoline Blendstocks Identified by the U.S. Department of Energy’s Co-Optimization of Fuels and Engines Program. SAE Technical Paper 2019-01-0017. In Proceedings of the SAE 2019 Powertrain, Fuels and Lubricants Conference, San Antonio, TX, USA, 22–24 January 2019. [Google Scholar] [CrossRef]
- McCormick, R.L.; Fioroni, G.; Fouts, L.; Christensen, E.; Yanowitz, J.; Polikarpov, E.; Albrecht, K.; Gaspar, D.J.; Gladden, J.; George, A. Selection Criteria and Screening of Potential Biomass-Derived Streams as Fuel Blendstocks for Advanced Spark-Ignition Engines. SAE Int. J. Fuels Lubr. 2017, 10, 442–460. [Google Scholar] [CrossRef]
- Vancoillie, J.; Verhelst, S.; Demuynck, J.; Sierens, R.; Rusu, E.; Pantile, V. Efficiency Comparison between Hydrogen, Methanol and Gasoline on a Production-Type Four-Cylinder Engine. In Proceedings of the 13th EAEC European Automotive Conference, Valencia, Spain, 14–16 June 2011. [Google Scholar]
- Pearson, R.J.; Turner, J.W.G.; Peck, A.J. Gasoline-ethanol-methanol tri-fuel vehicle development and its role in expediting sustainable organic fuels for transport. In Proceedings of the IMechE Low Carbon Vehicles Conference, London, UK, 20–21 May 2009. [Google Scholar]
- Naganuma, K.; Vancoillie, J.; Verhelst, S.; Sileghem, L.; Turner, J.W.G.; Pearson, R.J.; Martens, K. Drive cycle analysis of load control strategies for methanol fuelled ICE vehicle. SAE Technical Paper 2012-01-1606. In Proceedings of the SAE International Powertrains, Fuels and Lubricants Meeting, Malmo, Sweden, 18–20 September 2012. [Google Scholar]
- Leach, F.C.P.; Richardson, D.; Stone, R. The Influence of Fuel Properties on Particulate Number Emissions from a Direct Injection Spark Ignition Engine. SAE Technical Paper 2013-01-1558. In Proceedings of the SAE 2013 World Congress, Detroit, MI, USA, 16–18 April 2013. [Google Scholar] [CrossRef]
- Peckham, M.S.; Finch, A.; Campbell, B.; Price, P.; Davies, M.T. Study of Particle Number Emissions from a Turbocharged Gasoline Direct Injection (GDI) Engine Including Data from a Fast-Response Particle Size Spectrometer. SAE Technical Paper 2011-01-1224. In Proceedings of the SAE 2011 World Congress, Detroit, MI, USA, 12–14 April 2011. [Google Scholar] [CrossRef]
- Chen, L.; Braisher, M.; Crossley, A.; Stone, R. The Influence of Ethanol Blends on Particulate Matter Emissions from Gasoline Direct Injection Engines. SAE Technical Paper 2010-01-0793. In Proceedings of the SAE 2010 World Congress, Detroit, MI, USA, 13–15 April 2010. [Google Scholar] [CrossRef]
- Litzinger, T.; Stoner, M.; Hess, H.; Boehman, A. Effects of oxygenated blending compounds on emissions from a turbocharged direct injection diesel engine. Int. J. Engine Res. 2000, 1, 57–70. [Google Scholar] [CrossRef]
- Davy, M.H.; Williams, P.A. The Effects of Flash Boiling on Mixture Formation in a Firing Direct-Injection Spark-Ignition (DISI) Engine. In Proceedings of the International Congress on Direkteinspritzung im Ottomotor II (Gasoline Direct Injection Engines), Munich, Germany, 16–17 November 1999; pp. 154–170. [Google Scholar]
- Sandford, M.; Page, G.; Crawford, P. The All New AJV8. SAE Technical Paper 2009-01-1060. In Proceedings of the SAE 2009 World Congress, Detroit, MI, USA, 20–23 April 2009. [Google Scholar] [CrossRef]
- Reavell, K.; Hands, T.; Collings, N. A Fast Response Particulate Spectrometer for Combustion Aerosols. SAE Technical Paper 2002-01-2714. In Proceedings of the SAE Powertrain & Fluid Systems Conference, San Diego, CA, USA, 21–24 October 2002. [Google Scholar] [CrossRef]
- Andersson, J.; Giechaskiel, B.; Muñoz-Bueno, R.; Sandbach, E.; Dilara, P. Particle Measurement Programme (PMP) Light-Duty Inter-Laboratory Correlation Exercise (ILCE_LD) Final Report; European Commission Joint Research Centre Institute for Environment and Sustainability: Ispra, Italy, 2007. [Google Scholar]
Publisher’s Note: MDPI stays neutral with regard to jurisdictional claims in published maps and institutional affiliations. |
© 2020 by the authors. Licensee MDPI, Basel, Switzerland. This article is an open access article distributed under the terms and conditions of the Creative Commons Attribution (CC BY) license (http://creativecommons.org/licenses/by/4.0/).