Article

Are BBQs Significantly Polluting Air in Poland? A Simple Comparison of Barbecues vs. Domestic Stoves and Boilers Emissions

by
Artur Badyda
1,*,
Piotr Krawczyk
2,
Jan Stefan Bihałowicz
3,
Karolina Bralewska
3,
Wioletta Rogula-Kozłowska
3,
Grzegorz Majewski
4,
Przemysław Oberbek
5,
Andrzej Marciniak
3 and
Mariusz Rogulski
1
1
Faculty of Building Services, Hydro- and Environmental Engineering, Warsaw University of Technology, 00-653 Warszawa, Poland
2
Faculty of Power and Aeronautical Engineering, Warsaw University of Technology, 00-665 Warszawa, Poland
3
Institute of Safety Engineering, The Main School of Fire Service, 01-629 Warszawa, Poland
4
Institute of Environmental Engineering, Warsaw University of Life Sciences, 02-787 Warszawa, Poland
5
Central Institute for Labour Protection–National Research Institute, 00-701 Warszawa, Poland
*
Author to whom correspondence should be addressed.
Energies 2020, 13(23), 6245; https://doi.org/10.3390/en13236245
Submission received: 23 October 2020 / Revised: 18 November 2020 / Accepted: 19 November 2020 / Published: 26 November 2020
(This article belongs to the Special Issue Energy Processes, Systems and Equipment)

Abstract

:
The study attempts to compare the total annual emissions of selected air pollutants emitted during occasional grilling and the emission of the same pollutants from small domestic heating installations. For this purpose, in the absence of any data on the emission of pollutants during grilling processes, tests were carried out consisting of measuring the concentration of air pollutants in exhaust streams from two types of grills (solid fuel grill powered by charcoal briquette and gas grill powered by liquid propane), using popularly prepared dishes (previously marinated meat and raw, seasoned mixed vegetables). The concentrations of PM2.5, CH4, CO, CO2, H2O, NH3, N2O, NO, NO2, SO2 were measured in the exhaust stream from both grills using a particulate matter (PM) measuring device and a portable spectrometer, separately while grilling the same portions of meat and vegetables. Then, considering the available data on Poles’ barbecue habits, the emissions that are released into the air during occasional grilling were estimated. The calculated emissions were compared with the data on emissions from domestic heating installations used in Poland. It has been shown that during grilling, as much as 2.30, 92.07, 4.11, 3.83, 2.96, and 9.81 Gg of PM2.5, CO, NOx, SO2, NH3, and CH4 may be released into the atmosphere in Poland, respectively. In the case of PM, the amount of the pollutant emitted to the air is over 100 times lower than the emissions caused by the operation of small heating installations. In the case of other pollutants, the differences are smaller. Nevertheless, emissions from grills should not be underestimated as, in certain periods of the year, these sources may be responsible for not meeting the air quality standards in selected areas of the country, and thus the excessive exposure of people to pollutants resulting in negative health consequences. Therefore, attention was paid to the legitimacy of abandoning the use of charcoal and charcoal briquette grills and replacing them with gas-powered grills or electric ones, not only due to the health benefits of food and lower human exposure, but also by the reason of ecological values.

1. Introduction

According to the data of The National Centre for Emissions Management (KOBiZE), the main source of air pollution in Poland is the so-called low-stack emission, i.e., the emission of harmful gases and particles from emitters not exceeding 40 m above the ground, resulting mainly from combustion processes in local stoves/boilers rooms and domestic furnaces and fireplaces, i.e., the municipal and households sector [1,2]. Due to lower price and widespread access, coal, charcoal, and wood are mostly used in domestic furnaces, and in mining regions also brown coal, silts, and fleets [3]. In Poland, the problem of low-stack emissions is aggravated by a large number of coal stoves, burning of low-quality coal, wood, and sometimes even municipal waste, the use of inefficient and old-type boilers with manual stoking and natural draft, and a long heating season (from October to March) [3,4]. The phenomenon of emissions from the municipal and households sector occurs mainly in the areas of single-family housing and applies to the whole year. The most unfavorable situation, however, appears in winter, when there is the highest heat demand. The scale of the problem is proved by seasonal changes of particulate matter, polycyclic aromatic hydrocarbons (PAH), and gaseous pollutants (NOx, SO2) levels [5,6,7,8,9].
Low-stack emission is also a significant source of air pollution in many regions worldwide, including Canada, the United States, Australia, Ireland, Austria, Italy, where it is mainly associated with wood burning in fireplaces and wood burning stoves [10,11,12,13,14,15,16,17]. Fireplaces are inefficient combustion devices with high uncontrolled excess air rates and without any sort of secondary combustion, resulting in a significant quantity of unburnt combustibles. Several studies indicate that burning in fireplaces is accompanied by the emission of a wide spectrum pollutants, i.e., fine and coarse particles (particulate matter—PM), carbon monoxide (CO), carbon dioxide (CO2), nitrogen dioxide (NO2), polycyclic aromatic hydrocarbon (PAHs), and volatile organic compounds (VOCs) [13,15,16,17,18,19,20]. Research by Guo et al. [13] conducted in 27 randomly selected Irish houses, found that concentrations of CO and particulate matter inside homes with fireplaces were several times higher than the average concentrations in a normal house with central heating. Alves et al. [15] who compared fine particle emission from cast iron woodstove operated manually in batch mode, with handheld control of combustion air and from a traditional Portuguese brick open fireplace operated manually in batch mode, with no control of combustion air, showed that PM2.5 emission factors (g × kg−1 fuel burned, dry basis) were higher for the fireplace and the woodstove.
Another, increasingly important source of atmospheric air pollutants including PM, carbon monoxide (CO), nitrogen oxides (NOx), volatile organic compounds (VOCs), carbonyls, trace metals, and polycyclic aromatic hydrocarbons (PAHs) are barbecue grills powered by lump charcoal and charcoal briquettes [21,22,23,24,25,26,27]. According to the reports of Hearth, Patio and Barbecue Association almost 64% of U.S. adults own a grill, while in Canada—about 72%. More than half of them use a charcoal grill [28]. About 75% of owners grill during the whole year, at least 1–2 times per week, especially during birthday parties, camping trips, holidays, or sports events. In Poland, according to the research conducted by the TNS Polska (Public Opinion Research Centre) in 2015, the barbecue season lasts from late spring to early autumn. Then, 30.7% of Poles grill at least once a week, and another 43.6% 2–3 times a month. Herein, the vast majority also use traditional charcoal or charcoal briquette fired grills for this purpose. In Poland, the problem of air pollution due to grilling occurs especially in resorts, recreation places, i.e., clearings outside the city, or on beaches with designated places for this purpose. Air pollutant emissions from grilling may be a significant source of health exposure, and the mechanism of the impact of pollutants on human health may be similar to emissions from the combustion of solid fuels in household furnaces (coal boilers/stoves or fireplaces), except that the emissions from the grill takes place at the level of the human respiratory tract, and the emission from the boiler—10–40 m above the ground. Preliminary measurements results of air pollutants emitted from selected grill furnaces [24] showed that this method of food preparation favors the emission of significant amounts of solid particles, which, especially when using traditional fuels (charcoal and briquette), contain groups of polycyclic aromatic hydrocarbons (PAHs) in high concentrations. Research on pollutant emissions related to grilling mainly concerns indoor PM and PAHs concentrations during grilling in residences and restaurants [23,29,30,31,32], as well as dietary exposure, and health risk related to polycyclic aromatic hydrocarbons in grilled meals [24,33,34,35,36,37]. There is much less research to investigate the influence of outdoor barbecue smoke on atmospheric air quality [26,27,38].
Investigations of Rahman and Kim [39] indicate that charcoal-fueled grills are also a source of offensive odorants, including aldehydes, VOCs, carbonyls, reduced sulfur compounds, and ammonia. The emission of odorants also accompanies the burning of wood in domestic stoves [40]. While emissions from a stack appear on the Environmental Protection Act (EPA) [41] list of factors that can cause odors, grilling is not included in this list. A relatively small number of publications on the subject of odors accompanying burning in grills and stoves allows to conclude that this problem is not fully understood, which is the result of the high level of complexity of research in this subject, significant costs of their conduct, and the lack of uniform legal regulation for odor standards. The EU suggests introducing local regulations in this matter, therefore the permissible concentrations of odorous substances in most EU countries result from internal, national legal acts regulating the permissible concentrations of air pollutants. In Germany, France, the Netherlands, Great Britain, Japan, the United States, and Canada, legal solutions are available covering both regulations on emission standards, limit levels, as well as research methods and modelling of odor spread, as well as nuisance assessment using sociological research. However, they mainly focus on the emission of odorous substances in industry and agriculture, as well as in other branches of the economy. The problem of air pollution and odors accompanying grilling and burning in domestic stoves is becoming more and more noticeable. The nuisance of air pollution and odors accompanying the use of grills, wood-fired stoves is evidenced by solutions introduced in some districts, housing communities, public places prohibiting grilling or allowing the use of gas or electric grills. In some Polish provinces, a periodic ban on burning in fireplaces is also introduced, especially in the winter season when the risk of smog episodes appearance increases.
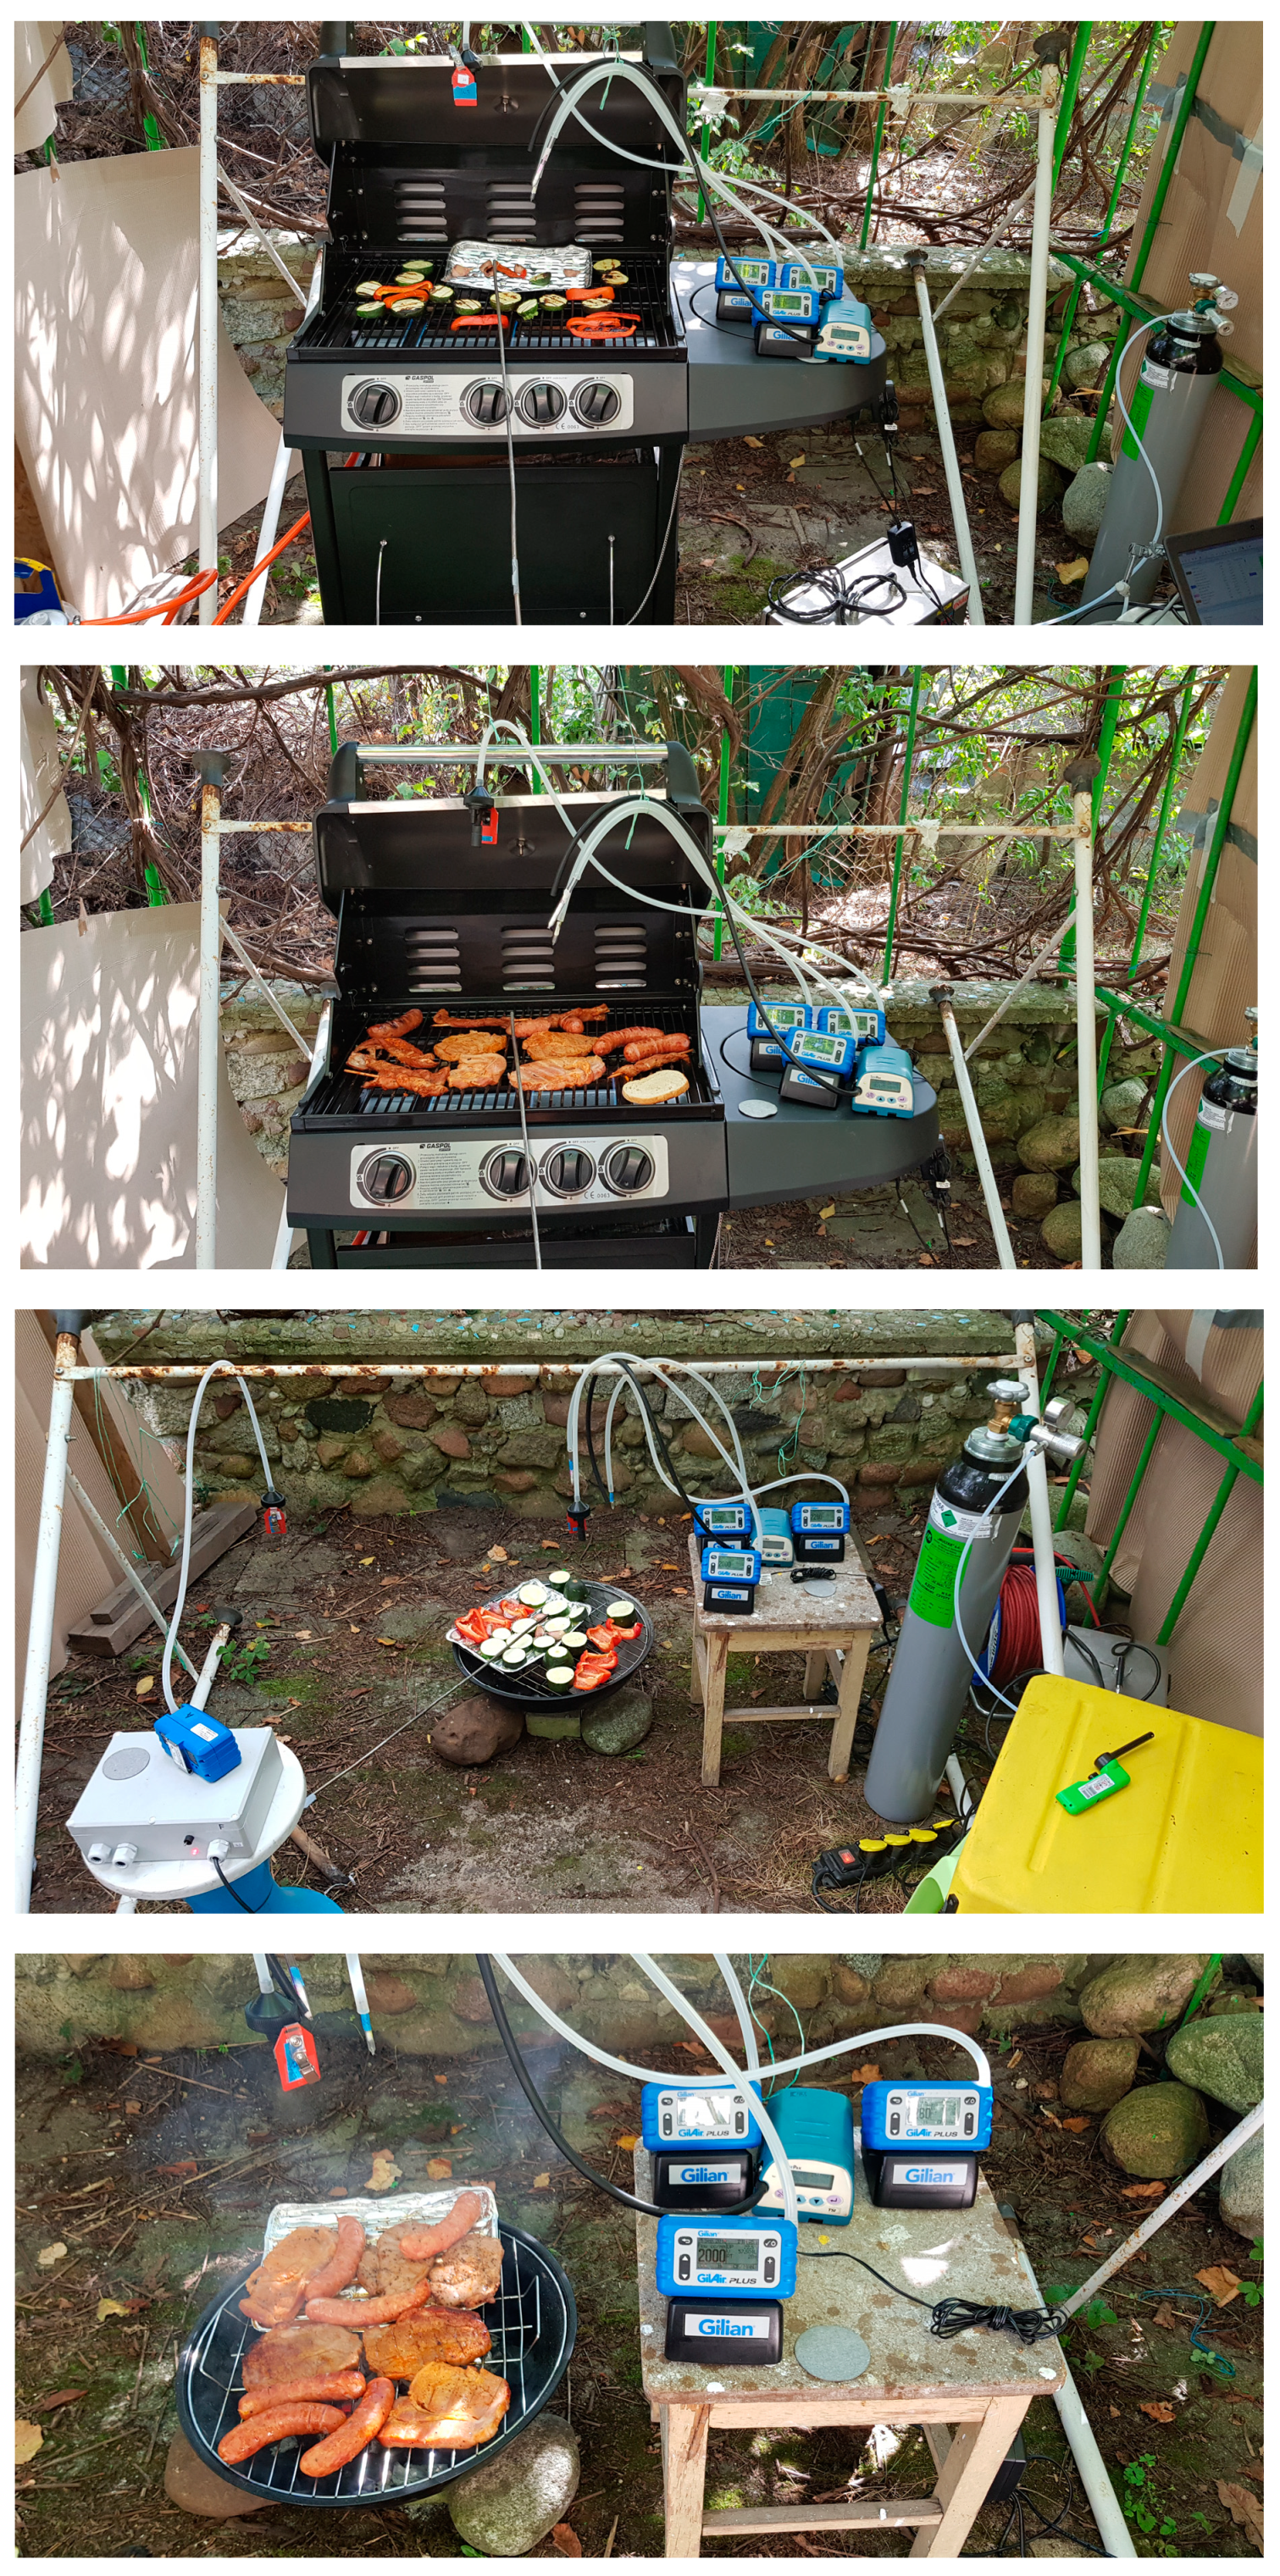
The aim of this study was to present, analyze, and discuss the results of experimental measurements, in which the scope of the first studies [24] was extended to include the analysis of the concentrations of particulate matter and selected gaseous pollutants emitted from grill furnaces powered by charcoal and gas. For comparative purposes, the results of measurements of pollutants in emission streams generated during the combustion of solid fuels in selected domestic heating devices are also presented. The experiment was conducted in Warsaw because the emission structure in this city is the closest to the emission structure in other European cities.

2. Materials and Methods

2.1. Instruments and Measurements

The study covering emissions of selected combustion products of grilling (PM2.5, CH4, CO, CO2, H2O, NH3, N2O, NO, NO2, SO2) was conducted in the summer period, in typical conditions for a barbecue party. The measurements were completed in allotment gardens located in one of the districts of Warsaw, capital of Poland, at a considerable distance (about 1500 m) from the nearest air pollutants emission sources (road) that may potentially interfere with the measurement results. The investigation was made on 6 September 2018 (average daily temperature: 18.5 °C, no precipitation, air pressure at station level 1001 hPa, relative humidity 75%, average daily wind velocity 2.0 m/s) and 11 September 2018 (average daily temperature: 17.9 °C, no precipitation, air pressure at station level 1008 hPa, relative humidity 68%, average daily wind velocity 1.9 m/s). We used two types of grills: charcoal briquette-fueled (B) and liquid propane-fueled (G). Measurements were done each day on the different type of grill in order to minimize interference of different exhausts in the measurement device (Figure 1).
We analyzed emission from empty grills (i.e., without any food) and during the preparation of meat and vegetables separately. The type and weight of dishes were identical during both days of grilling—they were the barbeque sets from a popular grocery supermarket. In the exhaust stream we put particulate matter probe, PM2.5 aspirator, and spectrometer which was continuously measuring the concentration of CH4, CO, CO2, H2O, NH3, N2O, NO, NO2, SO2.
The SidePak AM510 Personal Aerosol Monitor from TSI Inc. (Shoreview, MN, USA) was selected for continuous measurements of PM2.5 concentrations over the grill hearth. The device uses 90° light scattering technology with a 670 nm laser diode to determine the mass concentration of the selected particles fraction (from 0.1 to 2.5 μm in this case). By means of an automatic pump installed in the device, a continuous stream of air along with the aerosol is introduced into the measuring chamber. The measuring range is from 0 to 20,000 μg/m3 and the resolution 1 μg/m3. The air flow rate through the apparatus was set at the level of 1.7 dm3/min and data were collected with a 1-min time resolution. Zero stability was checked at the beginning of each measurement procedure.
The measurement of the concentration of gaseous substances was done using gas analyzer Gasmet DX 4000 (Vantaa, Finland). It is a portable FTIR (Fourier transformed infrared spectroscopy) gas analyzer. This system utilizes hot-and-wet measurement principle (no drying or dilution). The measuring range for individual gases is: water vapor from 0 to 10%, carbon dioxide from 0 to 25%, carbon monoxide from 0 to 400 mg/m3n, nitrogen monoxide from 0 to 250 mg/m3n, nitrogen dioxide from 0 to 200 mg/m3n, sulfur dioxide from 0 to 14,000 mg/m3n, ammonia from 0 to 200 mg/m3n and methane from 0 to 7000 mg/m3n. Other characteristic parameters of the analyzer are: scanning frequency 10 spectra/s, wave spectrum range 900–4200 cm−1, and gas flow 140 dm3/h. Measured gas pressure is the atmospheric pressure.

2.2. Data Analysis

For all the collected data we calculated basic descriptive measures: minimum, quartiles, median, maximum, and mean values. During the experiment 40 data series were collected. The lengths of the series were different. Using the Shapiro–Wilk test we checked each set whether the collected data met the assumption of a normal distribution [42]. If the concentrations of given substances for different grilling types were characterized by a normal distribution, we used the Welch t-test [43] to compare whether the distributions were similar or not. If for a given substance any of four sets did not met the hypothesis of distribution normality, we chose Mann–Whitney U test to evaluate the similarity of sets [44]. The choice of the U test is a result of different sizes of samples. We performed these calculations using Python 3.7 [45] with packages pandas [46], SciPy [47], and Matplotlib [48].
We also estimated the total emission of substances during grilling different kinds of meals (meat and vegetables). The concentrations were observed as time series, so we were able to find total emission during the whole grilling process. The emission EM of a given substance in the specific process of grilling i is defined by Riemann sum [49] over partition defined by the sampling rate of concentration.
E M i = k = 1 n i C i ( t k ) q i ( t k ) Δ t i k ,
where k indexes time series, ni is a length of the i-th time series, Ci is a concentration of a given substance, qi is the flow of gas above the grill, and Δtik is a time step in i-th time series. If we assume constant flow of air in all-time series since the temperature of grills was kept the same in all measurements, the formula simplifies, and we can calculate the sum. It does not allow us to give an exact numerical value of emitted kg during the grilling, however, we can compare the emissions between grilling of meat and vegetables on briquette or gas-fueled grill.

2.3. Methodology of Emission Estimation

We estimated the annual emission from the stoves and compared it with the emissions from briquette-fueled and gas-fueled grills.
For stoves, we used the concentration of total suspended particles (TSP), carbon monoxide (CO), nitrogen oxides (NOx), and sulfur dioxide (SO2) in the exhaust gases according to [50]. Since we had only data about the TSP from the stoves, we used values provided in [51] in order to calculate PM2.5 concentration based on the TSP concentration. According to data, the PM2.5 to TSP ratio is 10% for biomass stove, 30% for old type stove, and 60% for modern (eco) stove. We calculated the flow of the exhaust emitted per fuel mass and hence we were able to calculate the emission factors of these substances. The data on the total annual consumption of wood and coal in domestic stoves/boilers in Poland were also used [52]. According to the report of Institute of Environmental Economics about the energy efficiency in Poland in 2017 [53], we assumed the division of coal-fueled stoves into old type (81.5%) and the new type (18.5%). The same study provides information about the share of the given quality of coal (86.1% good quality, 8.3% poor quality, 5.6% unknown). For the bio-mass fueled stoves we assumed that 30% of fuel mass is wet and 70% is dry. All these data and assumptions allowed us to calculate the annual emission of selected pollutants in Poland for a given type of stove. We compared the emission to the data published by Statistics Poland [54] about the total household emissions of the same pollutants.
In the case of grill analysis, we used the average concentrations of PM2.5, CO, SO2, NH3, CH4 calculated from our experimental data. The concentration of NOx we calculated according to Formula (2). Again, we calculated the exhaust flow and emission factors of these pollutants per kg of mass of fuel.
C NO x = 46 30 C NO + C NO 2
We estimated the amount of the briquette used for grills according to the national survey “How do Poles grill?” conducted in April 2015 by the TNS Polska (Public Opinion Research Centre, Warsaw, Poland) on a sample of 1000 Poles over 15 years old [55]. We assumed that grilling season lasts 20 weeks, from the so-called long weekend related to national holidays at the beginning of May and ends just after the end of summer break in schools, in the first week of September. We estimated the annual number of grilling events in Poland taking into consideration the frequency of grilling activities according to the responses given in the above-mentioned TNS survey. The data on a normalized share of meat (66.7%) and vegetables (13.5%) used for grilling purposes were based also on the results of the same study [55]. We also considered results of another survey, “Barbecue habits of Poles,” completed in March 2017 by IQS commissioned by Coca-Cola Poland Services (Warsaw, Poland) on a representative nationwide sample of 500 Poles aged 16–49 [56] as the input data for calculation of the duration of grilling processes. The briquette consumption for a single grilling process was estimated on the results of our experiment. Consumption was assumed at the level of 1.3 kg/h. All the aforementioned data were used to estimate the total annual emissions from all grilling activities in Poland.
The data about the gaseous grills are very limited since gas grills are not popular in Poland. The data provided by [57] indicate that 90% of grills are powered by charcoal or charcoal briquettes, and 2% are powered by liquid gas (usually liquid propane). We decided therefore that the annual duration of all gas grilling processes in Poland is the total duration calculated for the charcoal and charcoal briquettes grilling divided by 45 (ratio reflecting the ownership shares). The propane consumption of grills we estimated at level 0.365 kg/h based on technical details of selected types of gaseous grills available on the Polish market [58]. These data were used for the calculation of the total consumption of liquid propane for barbecue purposes and of annual emission from gas-fueled grills.

3. Results and Discussion

We analyzed the concentration data collected during the experiment. 
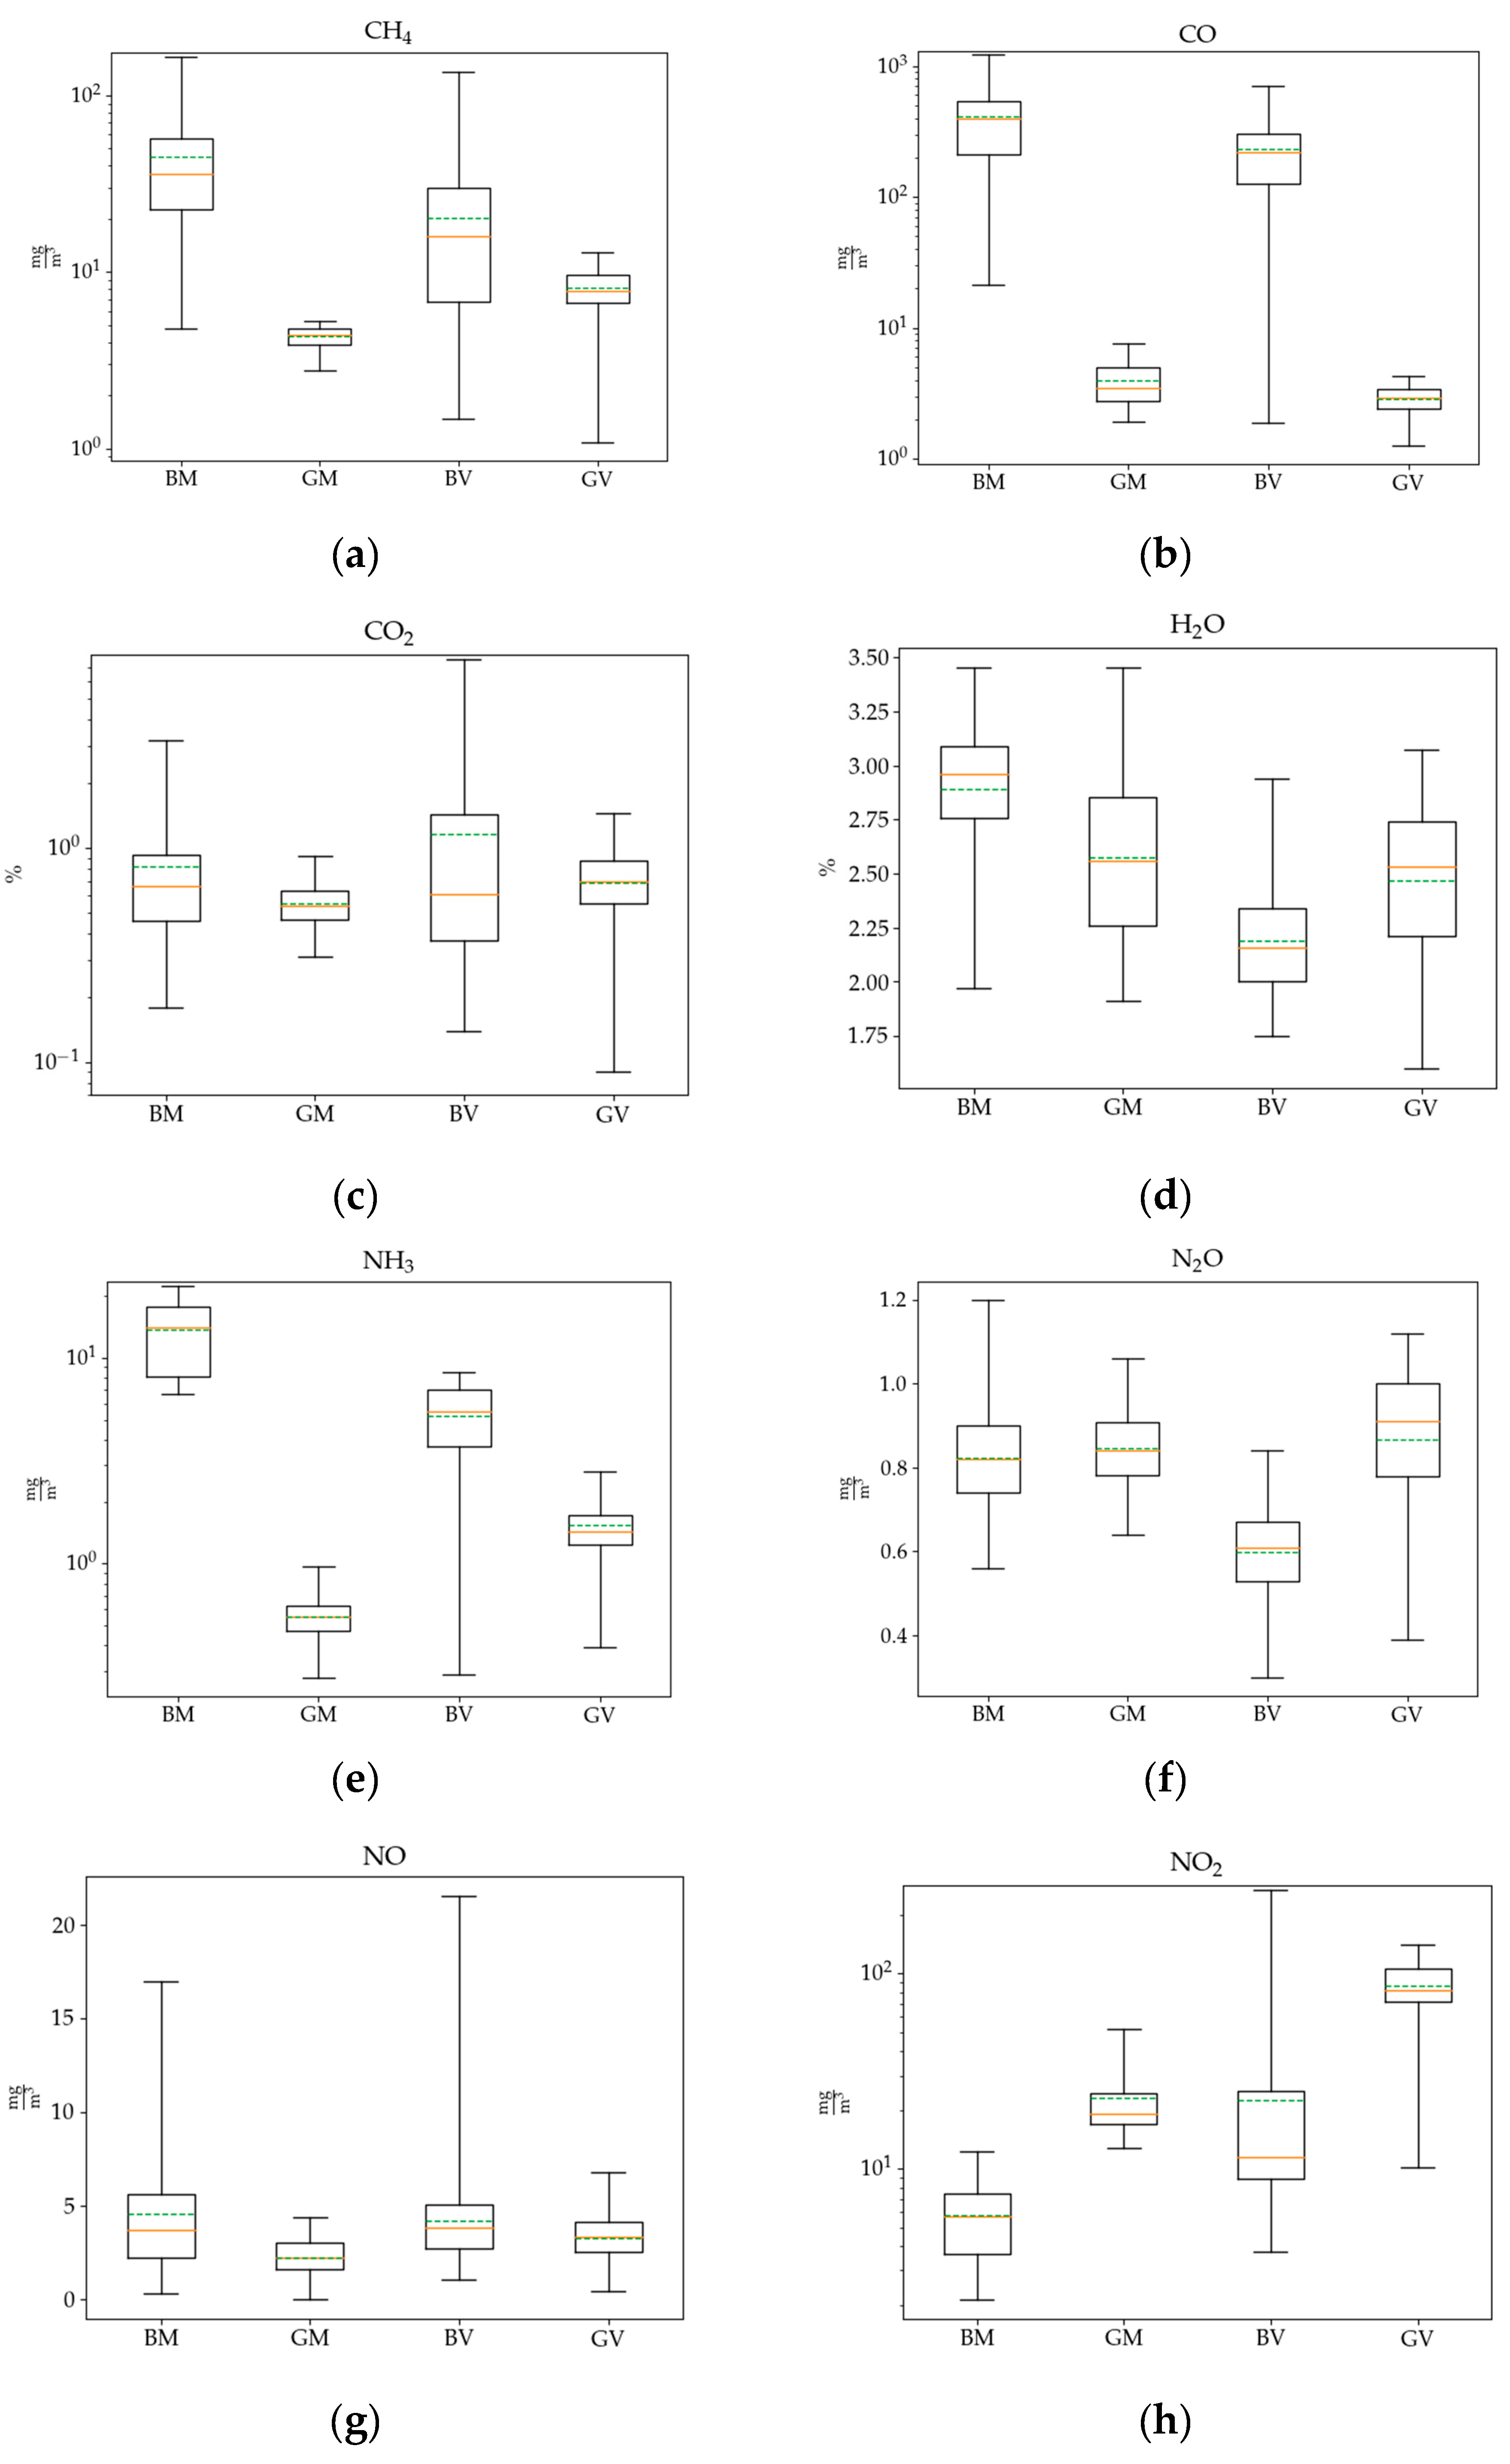
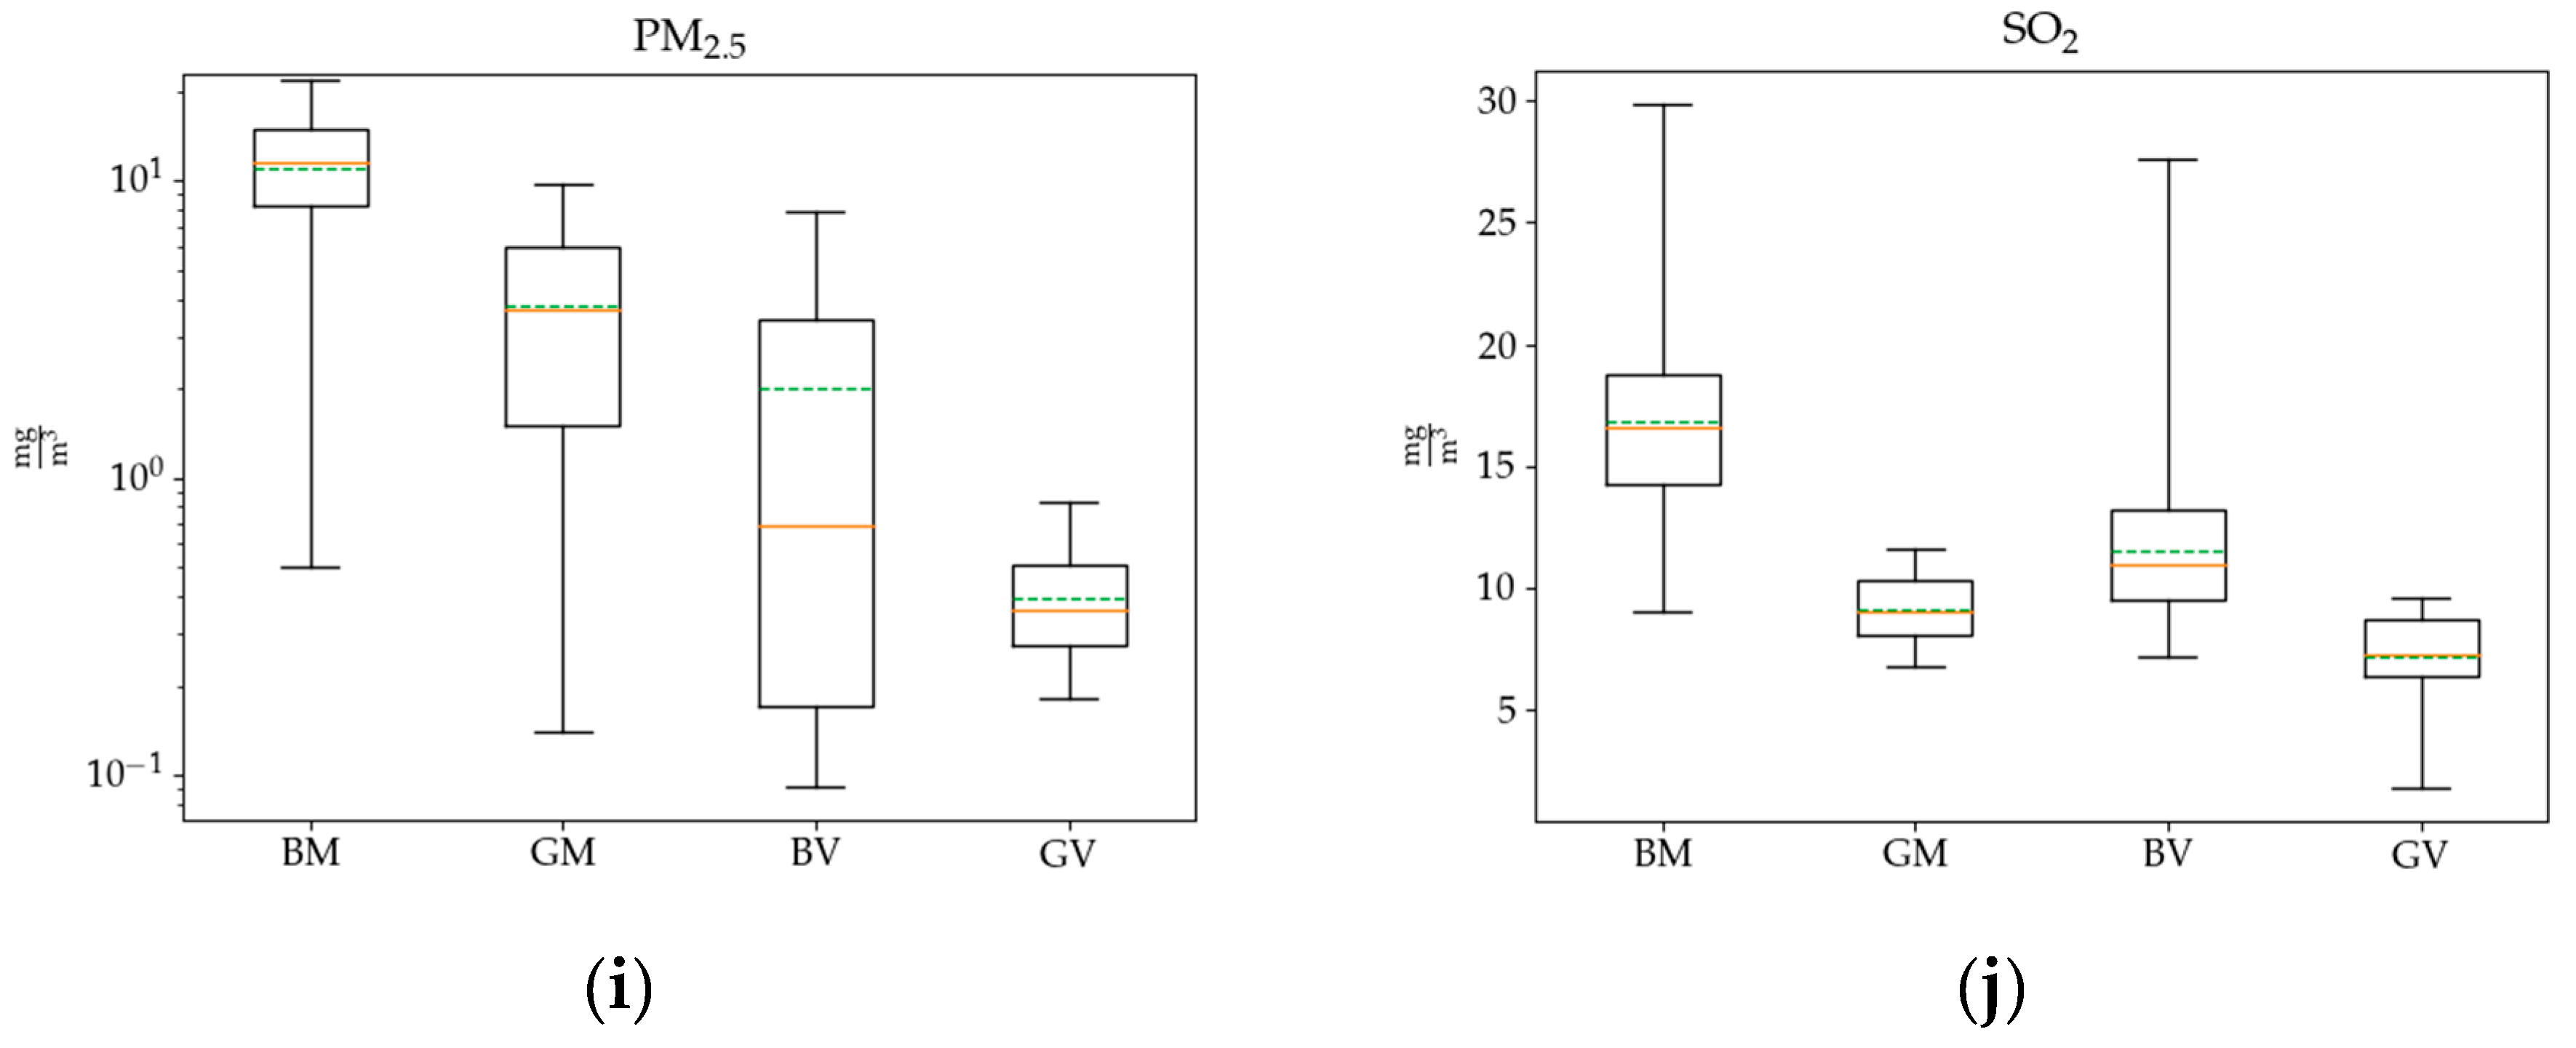
Figure 2 presents the matrix of 10 plots, one for each analyzed substance. For each substance, four data sets are presented—the concentrations above the grill hearth during the preparation of meat (M) or vegetables (V) on charcoal briquette-fueled grill (B) or gas-fueled grill (G). The data sets were typically 170 samples long. The concentrations of pollutants and green-house gases exhibited high variability depending on the type of fuel burned and the kind of prepared meal (meat vs. vegetables). Concentrations of almost all of the analyzed substances, except for NO2, were much higher during the preparation of meals with the use of charcoal briquette than with the liquid propane. The most pronounced differences concern CO concentrations, which for meat and vegetables, respectively, were 155 and 189 times higher during briquette combustion than during gas combustion, then NH3 (36-times for meat, six-times for vegetables), CH4 (15-times for meat, five-times for vegetables), and PM2.5 (four-times meat, 13-times vegetables). Although the results present different variability, we observed two main patterns in concentrations: BM > BV > GM > GV or BM > BV > GV > GM (for example for CO) and BM > GM > BV > GV (for example for PM2.5 and in the inverse order for NO2). The first pattern suggests that the concentration is mainly influenced by the type of fuel, and the second suggests the type of grilled material as the main cause of emission. We found that the first pattern is typical for the concentrations of CH4, CO, NH3, SO2, while the second one for PM2.5 and NO2 (reversed order).
We performed the Shapiro–Wilk test to check which of the 40 data sets are taken from the normal distribution. The result showed that only five sets represent normal distribution for α = 0.1: PM2.5 BM, CO GV, NO GV, NO2 BM, and NH3 GM (for details see Appendix A). We decided to use only the Mann–Whitney U test for a comparison of four data sets in each of the 10 groups. The test showed that only eight pairs of sets reveal similarities at α = 0.01 (detailed results of tests are presented in Appendix A). These are for H2O%: GM-GV, for CO2% BM-BV, BM-GV, GM-BV, BV-GV, for N2O BM-GM, for NO BM-BV, BM-GV.
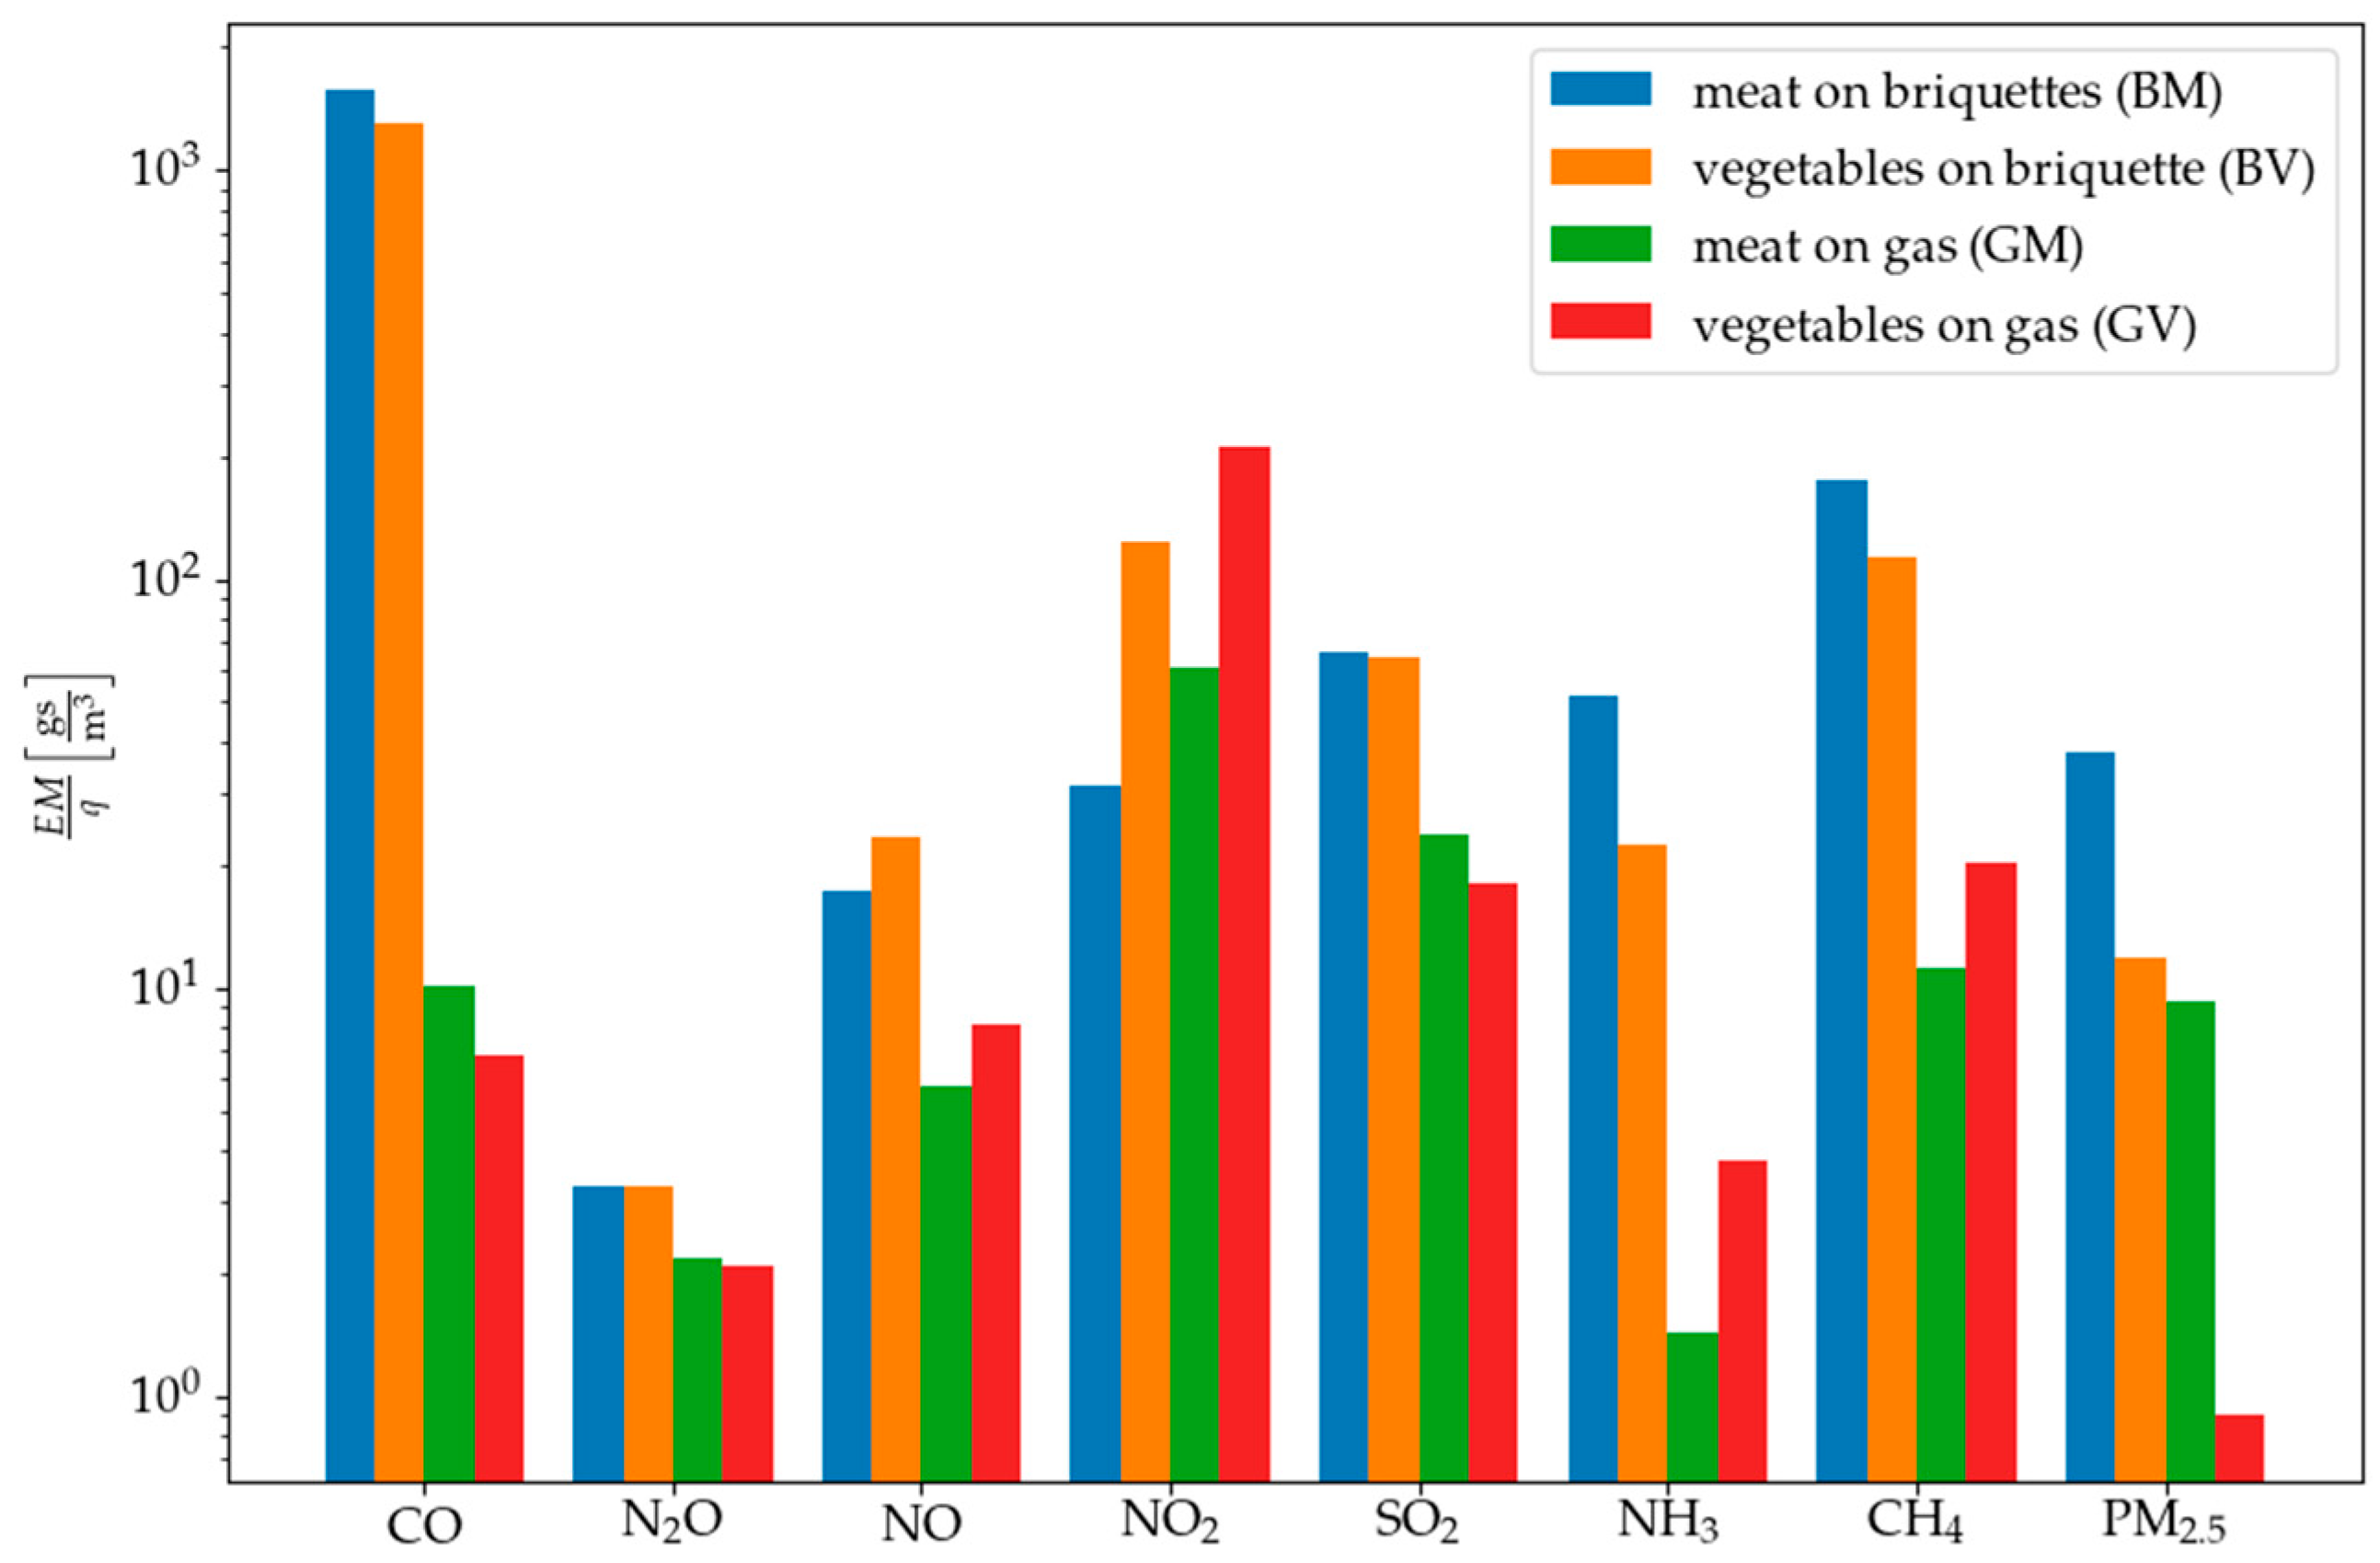
We calculated the total emissions according to Formula (1). The emissions per unit flow are presented in Figure 3. During the combustion of briquettes, the highest emissions of CO (1299–1578 g × s/m3) and CH4 per unit flow (112–173 g × s/m3) were noted. High emissions per unit flow, which were observed for carbon monoxide, may indicate an incorrect combustion process. CO is a product of incomplete combustion, generally associated with the smoldering phase. Burning briquettes in inefficient devices such as grills generate high levels of CO due to relatively low temperatures and a reduced or almost no visible flame above the layer [59]. Methane is an important component released during biomass combustion [60]. In the case of gas-fueled grills, the highest emission per unit flow was recorded for NO2 (60–210 g × s/m3). NO2 emissions from gas combustion are mostly associated with thermal and prompt formation, whereas the dominant mechanism of NO2 formation during the combustion of briquettes is from the fuel nitrogen content since the temperatures achieved in grills are usually too low for prompt and thermal formation [61,62]. Summarizing, we see similar tendencies as in the concentration box plots (Figure 2). The order of the emissions of CO, PM2.5, SO2, and N2O is as follows: BM > BV > GM > GV. It means that the total emission is firstly dependent on fuel type and secondarily on the type of grilled products. In case of NO, NH3, and CH4 the situation is different and fuel type has a crucial influence on emission (i.e., B > G) while it was not possible to determine the impact of the kind of grilled dishes. The total emission of NO2 during the grilling shows that there is no clear relation of emission to dish or fuel.
The total emissions of pollutants and gases observed over the charcoal briquette-fueled grill hearth are comparable to that reported by Vicente et al. and Yu et al., who tested the emission of the gaseous pollutants and particulate matter (PM2.5) from charcoal combustion in a typical brick barbecue grill [27,62]. There are few data on pollutant emissions depending on the type of meal being prepared. The results in this regard were presented in [63], where it was shown that marinated meat yielded an increased total VOC and total PM emissions compared to non-marinated meat and there were no significant differences in emission rates between chicken and beef.
Table 1 summarizes the annual emissions of individual pollutants released during meat and vegetables grilling on two types of grills (charcoal briquette and gas-fueled) and the annual emissions related to the combustion of coal and wood in three types of stoves/boilers (bio-mass, old type, Ecoproject stove) taking into account the quality of the fuel (high vs. poor). Table 2 compares the emissions from briquette and gas-fueled grills with the total emissions from three types of stoves and with the data from the Statistics Poland [54] on emissions of the analyzed pollutants from households. In addition, Table 2 shows the percentage of individual pollutants from grills in the annual emission resulting from combustion in the above-mentioned stoves/boilers. According to the data presented in the Table 1 and Table 2, CO has the highest mass share in the total mass of pollutants emitted during the year due to grilling, while PM2.5 the lowest. In case of wood and coal combustion in stoves, the largest mass share also belongs to CO, and the lowest to NOx (in case of old type stoves) and PM2.5 (in case of Ecoproject stoves), but the authors did not reach the data on NH3 and CH4 emissions related to combustion in different kind of stoves. Emissions of pollutants released by grilling account for a small percentage (2–8%) of the annual emissions of pollutants resulting from combustion of coal and wood in stoves. However, it should not be interpreted that the emissions of pollutants from the grilling processes are negligible. It results from the intensive use of domestic stoves and boilers herein and the associated high PM and gaseous emissions [1]. The comparison of the calculation data on emissions from grills and boilers with the statistical data of Statistics Poland and the fact that they are of the same order of magnitude confirms the justifiability of the assumptions made in the calculations. Although the total emissions from grills is definitely lower compared to the annual emissions from stoves/boilers, it can be treated as a significant cause of seasonal changes in air quality, i.e., in the grill season, which in Poland lasts from spring to early autumn. Frequent grilling can deteriorate the air quality, especially at campsites, single-family houses, holiday cottages estates, suburban clearings, arcades with restaurants, or beaches with a designated barbecue area, where dozens of outdoor barbecue events take place almost every day. It can also be an important cause of health exposure and the resulting adverse health effects, which in the case of air quality are of great importance in Poland [64,65]. Barbecue cooking can have a significant influence on ambient air quality due to the uncontrolled emissions and subsequent diffusion and transport mechanism with the wind [62,66]. It should be noted that the study did not take into account the concentrations of other pollutants released during grilling, e.g., polycyclic aromatic hydrocarbons, or trace metals—the concentration of which during grilling were higher compared to the ambient atmosphere according to research [23,27]. In the case of emissions from home furnaces and stoves, the combustion process is much more refined and controlled. Air quality management is not accidental as it is when burning solid fuel on a grill. In modern stoves/boilers (meeting the requirements of the Ecoproject Directive), not only the value of the excess air coefficient is controlled, but also its distribution in the furnace chamber. As a result, PM2.5, CO, NOx, SO2 emissions are significantly lower than in the case of burning fuel on the grill (Table 1 and Table 2). The PM2.5 concentration was calculated according to [51].
Obtained results indicate that further studies on the concentrations of various pollutants released during grilling and the assessment of health exposure should be investigated. The calculations described above are based on emission data only for Poland, where the measurements were carried out. In future research, based on the data on low-stack emissions in other countries, e.g., UK, Ireland, Germany [67,68], and based on barbecue habits of their citizens, a similar analysis could be carried out using the methodology proposed in the manuscript.

4. Conclusions

The tests carried out in the described investigation consisted of measuring selected gaseous pollutants and particulates from two types of grills during the preparation of typical types of food used while grilling. Considering the measurement time and assuming evenly distributed in time emissions during grills usage, PM and considered gaseous pollutants emission factors were calculated for each type of grill and fuel. They were compared with the emission factors from small domestic furnaces powered by hard coal and biomass (wood).
Research results demonstrated that the pollutants present in the emission streams over the grill hearths powered by traditional fuels (charcoal briquettes) are present in lower concentrations than in the case of domestic coal or wood stoves/boilers. The emissions from grills, however, occur at the breathing height in the direct presence of the grill operator. The results of the analyses show that the concentrations of some pollutants from grills show a greater dependence on the type of fuel used (in case of CH4, CO, NH3, SO2), and others on the type of grilled food (in case of PM2.5 and NO2). However, regardless the pattern, research results indicate that in the spring and summer period, emissions from grills may locally be a serious air pollutant, and therefore may also be an important health risk factor resulting from inhalation of pollutants from grilling processes.

Author Contributions

Conceptualization: A.B., G.M., W.R.-K., P.K.; methodology: A.B., G.M., P.K., W.R.-K.; software: J.S.B.; investigation, measurement: A.B., G.M., W.R.-K., P.K., P.O., M.R., J.S.B., K.B., A.M.; validation: A.B., W.R.-K., J.S.B., K.B.; data curation: J.S.B., P.K.; funding acquisition: A.B., G.M., W.R.-K.; writing—original draft preparation: A.B., W.R.-K., J.S.B., K.B.; writing—review and editing: A.B., G.M.; visualization: J.S.B.; supervision: A.B. All authors have read and agreed to the published version of the manuscript.

Funding

This research received no external funding. Research was financed from the private resources of the authors. Costs of the manuscript preparation and publishing were partially covered by The Main School of Fire Service and Warsaw University of Technology.

Conflicts of Interest

The authors declare no conflict of interest.

Appendix A

The Appendix A contains the detailed results of statistical analyses.
Table A1. The p-value of the Shapiro–Wilk test for samples. Significant values at α = 0.1 are marked with green.
BMBVGMGV
CH40.0000.0000.0010.001
CO0.0000.0000.0000.179
CO2%0.0000.0000.0650.007
H2O%0.0000.0000.0030.000
N2O0.0020.0010.0360.000
NH30.0000.0000.2270.000
NO0.0000.0000.0570.108
NO20.2390.0000.0000.003
PM2.50.1680.0000.0330.025
SO20.0000.0000.0010.000
Table A2. The p-value of the Mann–Whitney U test for PM2.5, values significant at α = 0.1 are marked with green, at α = 0.05 yellow, and at α = 0.01 orange.
BMBVGMGV
BM1.01.6 × 10−105.8 × 10−191.2 × 10⁻¹⁵
BV 1.00.000188.0 × 10−8
GM 1.00.0096
GV 1.0
Table A3. The p-value of the Mann–Whitney U test for H2O%, values significant at α = 0.1 are marked with green, at α = 0.05 yellow, and at α = 0.01 orange.
BMBVGMGV
BM1.01.4 × 10−123.1 × 10−559.4 × 10⁻²⁰
BV 1.04.3 × 10−210.079
GM 1.09.7 × 10−14
GV 1.0
Table A4. The p-value of the Mann–Whitney U test for CO2, values significant at α = 0.1 are marked with green, at α = 0.05 yellow, and at α = 0.01 orange.
BMBVGMGV
BM1.01.5 × 10−50.470.47
BV 1.00.0221.88 × 10−8
GM 1.00.33
GV 1.0
Table A5. The p-value of the Mann–Whitney U test for CO, values significant at α = 0.1 are marked with green, at α = 0.05 yellow, and at α = 0.1 orange.
BMBVGMGV
BM1.03.6 × 10−481.3 × 10−143.4 × 10−43
BV 1.02.7 × 10−526.2 × 10⁻⁸
GM 1.02.4 × 10−47
GV 1.0
Table A6. The p-value of the Mann–Whitney U test for N2O, values significant at α = 0.1 are marked with green, at α = 0.05 yellow, and at α = 0.01 orange.
BMBVGMGV
BM1.00.0164.7 × 10−470.00018
BV 1.03.5 × 10−500.0010
GM 1.01.3 × 10−29
GV 1.0
Table A7. The p-value of the Mann–Whitney U test for NO, values significant at α = 0.1 are marked with green, at α = 0.05 yellow, and at α = 0.01 orange.
BMBVGMGV
BM1.08.6 × 10−110.180.028
BV 1.03.9 × 10−264.9 × 10⁻¹²
GM 1.00.00013
GV 1.0
Table A8. The p-value of the Mann–Whitney U test for NO2, values significant at α = 0.1 are marked with green, at α = 0.05 yellow, and at α = 0.01 orange.
BMBVGMGV
BM1.03.3 × 10−172.8 × 10−136.1 × 10⁻¹⁷
BV 1.08.0 × 10−128.0 × 10−38
GM 1.01.1 × 10−44
GV 1.0
Table A9. The p-value of the Mann–Whitney U test for SO2, values significant at α = 0.1 are marked with green, at α = 0.05 yellow, and at α = 0.01 orange.
BMBVGMGV
BM1.03.0 × 10−453.2 × 10−421.1 × 10−46
BV 1.06.8 × 10−208.9 × 10⁻¹⁸
GM 1.05.3 × 10−45
GV 1.0
Table A10. The p-value of the Mann–Whitney U test for NH3, values significant at α = 0.1 are marked with green, at α = 0.05 yellow, and at α = 0.01 orange.
BMBVGMGV
BM1.03.6 × 10−484.4 × 10−522.3 × 10−46
BV 1.05.6 × 10−473.2 × 10−38
GM 1.02.2 × 10−39
GV 1.0
Table A11. The p-value of the Mann–Whitney U test for CH4, values significant at α = 0.1 are marked with green, at α = 0.05 yellow, and at α = 0.01 orange.
BMBVGMGV
BM 1.5 × 10−472.4 × 10−203.4 × 10−36
BV 1.01.5 × 10−314.7 × 10−36
GM 1.08.9 × 10−12
GV 1.0

References

  1. Ministry of the Environment. National Air Protection Program until 2020 (with a Prospect until 2030); Air Protection, Ministry of the Environment: Warsaw, Poland, 2015.
  2. Zieliński, E.; Wielgus, A.; Dreliszak, J.; Zukow, W. Air pollution-selected health effects in Poland. J. Educ. Health Sport 2018, 8, 641–648. [Google Scholar]
  3. Proszak-Miąsik, D.; Rabczak, S. Methods for reducing low emissions from heating devices in single- family housing. E3S Web Conf. 2018, 45, 00069. [Google Scholar] [CrossRef] [Green Version]
  4. Adamczyk, J.; Piwowar, A.; Dzikuć, M. Air protection programmes in Poland in the context of the low emission. Environ. Sci. Pollut. Res. 2017, 24, 16316–16327. [Google Scholar] [CrossRef] [PubMed]
  5. Rogula-Kozłowska, W.; Klejnowski, K.; Rogula-Kopiec, P.; Ośródka, L.; Krajny, E.; Błaszczak, B.; Mathews, B. Spatial and seasonal variability of the mass concentration and chemical composition of PM2.5 in Poland. Air Qual. Atmos. Health 2014, 7, 41–58. [Google Scholar] [CrossRef] [PubMed] [Green Version]
  6. Jędruszkiewicz, J.; Czernecki, B.; Marosz, M. The variability of PM10 and PM2.5 concentrations in selected Polish agglomerations: The role of meteorological conditions, 2006–2016. Int. J. Environ. Health 2017, 27, 441–462. [Google Scholar] [CrossRef]
  7. Majewski, G.; Rogula-Kozłowska, W.; Rozbicka, K.; Rogula-Kopiec, P.; Mathews, B.; Brandyk, A. Concentration, chemical composition and origin of PM1: Results from the first long-term measurement campaign in Warsaw (Poland). Aerosol Air Qual. Res. 2018, 18, 636–654. [Google Scholar] [CrossRef]
  8. Wiśniewska, K.; Lewandowska, A.U.; Staniszewska, M. Air quality at two stations (Gdynia and Rumia) located in the region of Gulf of Gdansk during periods of intensive smog in Poland. Air Qual. Atmos. Health 2019, 12, 879–890. [Google Scholar] [CrossRef] [Green Version]
  9. Chambers, S.D.; Podstawczyńska, A. Improved method for characterising temporal variability in urban air quality part II: Particulate matter and precursors in central Poland. Atmos. Environ. 2019, 219, 117040. [Google Scholar] [CrossRef]
  10. Dasch, J.M. Particulate and gaseous emissions from wood-burning fireplaces. Environ. Sci. Technol. 1982, 16, 643–667. [Google Scholar] [CrossRef]
  11. Gullett, B.K.; Touati, A.; Hays, M.D. PCDD/F, PCB, HxCBz, PAH, and PM Emission factors for fireplace and woodstove combustion in the San Francisco Bay Region. Environ. Sci. Technol. 2003, 37, 1758–1765. [Google Scholar] [CrossRef]
  12. Zuk, M.; Rojas, L.; Blanco, S.; Serrano, P.; Cruz, J.; Angeles, F.; Tzintzun, G.; Armendariz, C.; Edwards, R.D.; Johnson, M.; et al. The impact of improved wood-burning stoves on fine particulate matter concentrationsin rural Mexican homes. J. Expo. Sci. Environ. Epidemiol. 2007, 17, 224–232. [Google Scholar] [CrossRef] [Green Version]
  13. Guo, L.; Lewis, J.O.; McLaughlin, J.P. Emissions from Irish domestic fireplaces and their impact on indoor air quality when used as supplementary heating source. Glob. NEST J. 2008, 10, 209–216. [Google Scholar]
  14. Caseiro, A.; Bauer, H.; Schmidl, C.; Pio, C.A.; Puxbaum, H. Wood burning impact on PM10 in three Austrian regions. Atmos. Environ. 2009, 43, 2186–2195. [Google Scholar] [CrossRef]
  15. Alves, C.; Gonçalves, C.; Fernandes, A.P.; Tarelho, L.; Pio, C. Fireplace and woodstove fine particle emissions from combustion of western Mediterranean wood types. Atmos. Res. 2011, 101, 692–700. [Google Scholar] [CrossRef]
  16. Evtyugina, M.; Alves, C.; Calvo, A.; Nunes, T.; Tarelho, L.; Duarte, M.; Prozil, S.O.; Evtuguin, D.V.; Pio, C. VOC emissions from residential combustion of Southern and mid-European woods. Atmos. Environ. 2014, 83, 90–98. [Google Scholar] [CrossRef]
  17. Gennaro, G.; Dambruoso, P.R.; Gilio, A.; Palma, V.; Marzocca, A.; Tutino, M. Discontinuous and continuous indoor air quality monitoring in homes with fireplaces or wood stoves as heating system. Int. J. Environ. Res. Public Health 2016, 13, 78. [Google Scholar] [CrossRef]
  18. Purvis, C.R.; McCrillis, R.C.; Kariher, P.H. Fine particulate matter (PM) and organic speciation of fireplace emissions. Environ. Sci. Technol. 2000, 34, 1653–1658. [Google Scholar] [CrossRef]
  19. Fine, P.M.; Cass, G.R.; Simoneit, B.R.T. Chemical characterization of fine particle emissions from the fireplace combustion of wood types grown in the Midwestern and Western United States. Environ. Eng. Sci. 2004, 21, 387–409. [Google Scholar] [CrossRef]
  20. Ozil, F.; Tschamber, V.; Haas, F.; Trouve, G. Efficiency of catalytic processes for the reduction of CO and VOC emissions from wood combustion in domestic fireplaces. Fuel Process. Technol. 2009, 90, 1053–1061. [Google Scholar] [CrossRef]
  21. Kabir, E.; Kim, K.H.; Ahn, J.W.; Hong, O.F.; Sohn, J.R. Barbecue charcoal combustion as a potential source of aromatic volatile organic compounds and carbonyls. J. Hazard. Mater. 2010, 174, 492–499. [Google Scholar] [CrossRef]
  22. Chen, J.W.; Wang, S.L.; Hsientang Hsieh, D.P.; Yang, H.H.; Lee, H.L. Carcinogenic potencies of polycyclic aromatic hydrocarbons for back-door neighbors of restaurants with cooking emissions. Sci. Total Environ. 2012, 417, 68–75. [Google Scholar] [CrossRef] [PubMed]
  23. Huang, H.L.; Lee, W.M.G.; Wu, F.S. Emissions of air pollutants from indoor charcoal barbecue. J. Hazard. Mater. 2016, 302, 198–207. [Google Scholar] [CrossRef] [PubMed]
  24. Badyda, A.J.; Widziewcz, K.; Rogula-Kozłowska, W.; Majewski, G.; Jureczko, I. Inhalation exposure to PM-bound polycyclic aromatic hydrocarbons released from barbecue grills powered by gas, lump charcoal, and charcoal briquettes. Adv. Exp. Med. Biol. 2017, 1023, 11–27. [Google Scholar]
  25. Lango-Reynoso, V.; López-Spiegel, J.; Lango-Reynoso, F.; Castañeda-Chávez, M.D.R.; Montoya-Mendoza, J. Estimation of CO2 Emissions Produced by Commercial Grills in Veracruz, Mexico. Sustainability 2018, 10, 464. [Google Scholar] [CrossRef] [Green Version]
  26. Song, Y.; Sun, L.; Wang, X.; Zhang, Y.; Wang, H.; Li, R.; Xue, L.; Chen, J.; Wang, W. Pollution characteristics of particulate matters emitted from outdoor barbecue cooking in urban Jinan in eastern China. Front. Environ. Sci. Eng. 2018, 12, 14. [Google Scholar] [CrossRef]
  27. Yu, K.P.; Chen, Y.C.; Miao, Y.J.; Siregar, S.; Tsai, Y.W.; Lee, W.M.G. Effects of oil drops and the charcoal’s proximate composition on the air pollution emitted from charcoal barbecues. Aerosol Air Qual. Res. 2020, 20, 1480–1494. [Google Scholar] [CrossRef] [Green Version]
  28. Hearth, Patio and Barbecue Association, 2020—State of the Barbecue Industry. Available online: https://www.hpba.org/Resources/PressRoom/ID/1911/2020-State-of-the-Barbecue-Industry (accessed on 2 October 2020).
  29. Lee, S.C.; Li, W.M.; Yin Chan, L. Indoor air quality at restaurants with different styles of cooking in metropolitan Hong Kong. Sci. Total Environ. 2001, 279, 181–193. [Google Scholar] [CrossRef]
  30. Ho, S.S.H.; Yu, J.Z.; Chu, K.W.; Yeung, L.L. Carbonyl emissions from commercial cooking sources in Hong Kong. J. Air Waste Manag. 2006, 56, 1091–1098. [Google Scholar] [CrossRef] [PubMed] [Green Version]
  31. Taner, S.; Pekey, B.; Pekey, H. Fine particulate matter in the indoor air of barbeque restaurants: Elemental compositions, sources and health risks. Sci. Total Environ. 2013, 454, 79–87. [Google Scholar] [CrossRef] [PubMed]
  32. Alves, C.A.; Duarte, M.; Nunes, T.; Moreira, R.; Rocha, S. Carbonaceous particles emitted from cooking activities in Portugal. Glob. NEST J. 2014, 16, 412–420. [Google Scholar]
  33. Aaslyng, M.D.; Duedahl-Olesen, L.; Jensen, K.; Meinert, L. Content of heterocyclic amines and polycyclic aromatic hydrocarbons in pork, beef and chicken barbecued at home by Danish consumers. Meat Sci. 2013, 93, 85–91. [Google Scholar] [CrossRef] [PubMed]
  34. Torkmahalleh, M.A.; Ospanova, S.; Baibatyrova, A.; Nurbay, S.; Zhanakhmet, G.; Shah, D. Contributions of burner, pan, meat and salt to PM emission during grilling. Environ. Res. 2018, 164, 11–17. [Google Scholar] [CrossRef] [PubMed]
  35. Jiang, D.; Wang, G.; Li, L.; Wang, X.; Li, W.; Li, X.; Shao, L.; Li, F. Occurrence, dietary exposure, and health risk estimation of polycyclic aromatic hydrocarbons in grilled and fried meats in Shandong of China. Food Sci. Nutr. 2018, 6, 2431–2439. [Google Scholar] [CrossRef] [PubMed] [Green Version]
  36. Cheng, J.; Zhang, X.; Ma, Y.; Zhao, J.; Tang, Z. Concentrations and distributions of polycyclic aromatic hydrocarbon in vegetables and animal-based foods before and after grilling: Implication for human exposure. Sci. Total Environ. 2019, 690, 965–972. [Google Scholar] [CrossRef]
  37. Iko Afé, O.H.; Saegerman, C.; Kpoclou, Y.E.; Anihouvi, V.B.; Douny, C.; Igout, A.; Mahillon, J.; Hounhouigan, D.J.; Scippo, M.L. Polycyclic aromatic hydrocarbons contamination of traditionally grilled pork marketed in South Benin and health risk assessment for the Beninese consumer. Food Addit. Contam. Part A 2020, 37, 742–752. [Google Scholar] [CrossRef]
  38. Wu, C.; Bao, L.J.; Guo, Y.; Li, S.M.; Zeng, E.Y. Barbecue fumes: An overlooked source of health hazards in outdoor settings? Environ. Sci. Technol. 2015, 49, 10607–10615. [Google Scholar] [CrossRef]
  39. Rahman, M.; Kim, K.H. Release of offensive odorants from the combustion of barbecue charcoals. J. Hazard. Mater. 2012, 215, 233–242. [Google Scholar] [CrossRef]
  40. Kistler, M.; Schmidl, C.; Padouvas, E.; Giebl, H.; Lohninger, J.; Ellinger, R.; Bauer, H.; Puxbaum, H. Odor, gaseous and PM10 emissions from small scale combustion of wood types indigenous to Central Europe. Atmos. Environ. 2012, 51, 86–93. [Google Scholar] [CrossRef] [Green Version]
  41. Parliament of the United Kingdom. Environmental Protection Act 1990; The Stationery Office: London, UK, 1990.
  42. Shapiro, S.S.; Wilk, M.B. An analysis of variance test for normality (complete samples). Biometrika 1965, 52, 591–611. [Google Scholar] [CrossRef]
  43. Welch, B.L. The generalization of ‘student’s’ problem when several different population variances are involved. Biometrika 1947, 34, 28–35. [Google Scholar] [CrossRef]
  44. Man, H.B.; Whitney, D.R. On a test of whether one of two random variables is stochastically larger than the other. Ann. Math. Stat. 1947, 18, 50–60. [Google Scholar] [CrossRef]
  45. Python Software Fundation. Python Language Reference, Version 3.7; Python Software Foundation: Wilmington, NC, USA, 2020. [Google Scholar]
  46. McKinney, W. Data structures for statistical computing in Python. In Proceedings of the 9th Python in Science Conference, Austin, TX, USA, 28 June–3 July 2010. [Google Scholar]
  47. Virtanen, P.; Gommers, R.; Oliphant, T.E.; Haberland, M.; Reddy, T.; Cournapeau, D.; Burovski, E.; Peterson, P.; Weckesser, W.; Bright, J.; et al. SciPy 1.0: Fundamental algorithms for scientific computing in Python. Nat. Methods 2020, 17, 261–272. [Google Scholar] [CrossRef] [PubMed] [Green Version]
  48. Hunter, J.D. Matplotlib: A 2D graphics environment. Comput. Sci. Eng. 2007, 9, 90–95. [Google Scholar] [CrossRef]
  49. Maurin, K. Analysis Part One: Elements, 1st ed.; Springer Netherlands: Heidelberg, Germany, 1976. [Google Scholar]
  50. Kubica, K. Proposal of Energy and Emission Criteria for Central Heating Boilers Fired with Solid Fuels Promoted under the Low-Stack Emission Reduction Program (PONE); Polish Chamber of Ecology: Katowice, Poland, 2013; (Elaboration in Polish). [Google Scholar]
  51. Stanek, W.; Kubica, R.; Plis, M.; Bogacz, W.; Falecki, A. Wielowariantowa Analiza Eliminowania Przestarzałych, Niskoefektywnych Energetycznie i Wysokoemisyjnych Źródeł Wytwarzania Energii Użytkowej ze Spalania Węgla w Indywidualnych Gospodarstwach Domowych, STOPSMOG Elaboration; Institute of Environmental Protection-National Reseach Institute: Warsaw, Poland, 2017; (Elaboration in Polish). [Google Scholar]
  52. Stala-Szlugaj, K. Analysis of the municipal and housing hard coal consumers sector. Energy Policy J. 2017, 20, 117–133. [Google Scholar]
  53. Dreger, M.; Lewandowski, P.; Mazur, J.; Pytliński, Ł.; Sałach, K.; Skoczkowski, T.; Sokulska, A.; Śniegocki, A.; Toborek-Mazur, J.; Walczak, E. et al. Energy efficiency in Poland. 2017 Review; Institute of Environmental Economics: Cracow, Poland, 2018; (Elaboration in Polish). [Google Scholar]
  54. Statistics Poland. Environment 2019; Zakład Wydawnictw Statystycznych: Warsaw, Poland, 2019; (Elaboration in Polish).
  55. TNS Poland. Available online: www.wirtualnemedia.pl/artykul/3-4-polakow-regularnie-grilluje-kielbasa-najpopularniejsza (accessed on 20 October 2020).
  56. Barbecue Habits of Poles. Available online: https://www.wiadomoscihandlowe.pl/artykul/grillowe-zwyczaje-polakow-raport-na-majowke (accessed on 18 October 2020).
  57. Barbecue Trends in the UK & Europe. Available online: https://www.slideshare.net/KatyPhillips6/barbecue-trends-in-the-uk-europe (accessed on 18 October 2020).
  58. How much gas does a grill consume and what does a gas grill cost? Available online: https://www.broilking.pl/blog/ile-gazu-zuzywa-grill-i-jaki-jest-koszt-grillowania-na-gazie (accessed on 18 October 2020).
  59. MacCarty, N.; Still, D.; Ogle, D. Fuel use and emissions performance of fifty cooking stoves in the laboratory and related benchmarks of performance. Energy Sustain. Dev. 2010, 14, 161–171. [Google Scholar] [CrossRef]
  60. Bhattacharya, S.C.; Albina, D.O.; Abdul Salam, P. Emission factors of wood and charcoal-fired cookstoves. Biomass Bioenergy 2002, 23, 453–469. [Google Scholar] [CrossRef]
  61. Brunner, T.; Obernberger, I.; Scharler, R. Primary measures for low-emission residential wood combustion—Comparison of old with optimised modern systems. In Proceedings of the 17th European Biomass Conference & Exhibition, Hamburg, Germany, 29 June–3 July 2009. [Google Scholar]
  62. Vicente, E.D.; Vicente, A.; Evtyugina, M.; Carvalho, R.; Tarelho, L.A.C.; Oduber, F.I.; Alves, C. Particulate and gaseous emissions from charcoal combustion in barbecue grills. Fuel Process. Technol. 2018, 176, 269–306. [Google Scholar] [CrossRef]
  63. United States Environmental Protection Agency. Emissions from street vendor cooking devices (charcoal. Grilling); Office of Research and Development: Washington, DC, USA, 1999.
  64. Adamkiewicz, Ł.; Badyda, A.J.; Gayer, A.; Mucha, D. Disability-adjusted life years in the assessment of health effects of traffic-related air pollution. Adv. Exp. Med. Biol. 2015, 834, 15–20. [Google Scholar]
  65. Badyda, A.J.; Grellier, J.; Dąbrowiecki, P. Ambient PM2.5 exposure and mortality due to lung cancer and cardiopulmonary diseases in polish cities. Adv. Exp. Med. Biol. 2017, 944, 9–17. [Google Scholar]
  66. Loomis, D.; Grosse, Y.; Lauby-Secretan, B.; El Ghissassi, F.; Bouvard, V.; Benbrahim-Tallaa, L.; Guha, N.; Baan, R.; Mattock, H.; Straif, K. The carcinogenicity of outdoor air pollution. Lancet Oncol. 2013, 14, 1262–1263. [Google Scholar] [CrossRef]
  67. Mitchell, E.J.S.; Lea-Langton, A.R.; Jonesa, L.M.; Williams, A.; Layden, P.; Johnson, R. The impact of fuel properties on the emissions from the combustion of biomass and other solid fuels in a fixed bed domestic stove. Fuel Process. Technol. 2016, 142, 115–123. [Google Scholar] [CrossRef]
  68. Viana, M.; Alastuey, A.; Querol, X.; Guerreiro, C.; Vogt, M.; Colette, A.; Collet, S.; Albinet, A.; Fraboulet, I.; Lacome, J.; et al. Contribution of Residential Combustion to Ambient Air Pollution and Greenhouse Gas Emissions; Technical Report 2015/1; European Topic Centre on Air Pollution and Climate Change Mitigation: Bilthoven, The Netherlands, 2016. [Google Scholar]
Figure 1. Measuring points and devices.
Energies 13 06245 g001
Figure 2. Concentration of selected pollutants and green-house gases directly above the grill during preparation of BM—meat on coal briquette, GM—meat on gas-fueled grill, BW—vegetables on coal briquette, GW—vegetables on gas-fueled grill: (a) CH4 in mg/m3, (b) CO in mg/m3, (c) CO2 in %, (d) H2O in %, (e) NH3 in mg/m3, (f) N2O in mg/m3, (g) NO in mg/m3, (h) NO2 in mg/m3, (i) PM2.5 in mg/m3, (j) SO2 in mg/m3. Whiskers are from the minimum to maximum values, the box is from the first quartile to the third quartile, the orange line represents the median, and the green, dashed line represents the average value.
Energies 13 06245 g002aEnergies 13 06245 g002b
Figure 3. The total emissions of substances per unit flow over the grill. The figure allows us to compare the relative total emissions of substances in different grilling conditions.
Energies 13 06245 g003
Table 1. The annual emissions of pollutants released during grilling processes taking into account the percentage of the type of prepared meals (meat vs. vegetables) and annual emissions of the same pollutants released from three types of stoves (bio-mass, old type, and Ecoproject) taking into account the quality of the fuel used (high vs. poor).
Briquette-Fueled GrillsGas-Fueled GrillsBio-Mass StovesOld Type StovesEcoproject Stoves
ShareMeat 67% 1Vegetables 14% 1Meat 67% 1Vegetables 14% 1Dry Wood 70%Wet Wood 30%High Quality Coal 86%Poor Quality Coal 8%High Quality Coal 86%Poor Quality Coal 8%
Gg/Year
PM2.52.210.080.0060.0009.78 26.77 239.61 25.36 20.86 20.08 2
CO82.899.170.0060.001608.58423.831320.35178.8053.525.16
NOx2.911.140.0390.0246.522.7926.722.5810.701.03
SO23.360.450.0130.0022.541.86125.7526.670.000.00
NH32.750.210.0010.000NANANANANANA
CH49.000.800.0060.002NANANANANANA
1 Share of meat and vegetables in grilling; 2 PM2.5 emission calculated as fraction of TSP emission according to [51].
Table 2. The comparison of summed up annual emissions from grills (briquette and gas-fueled) with the total emissions from three types of stoves and the percentage of individual pollutants from grills in the annual emissions of pollutants resulting from combustion in stoves.
Briquette-Fueled Grills [Gg/Year]Gas-Fueled Grills [Gg/Year]Stoves [Gg/Year]Statistics Poland Data Stoves [Gg/Year]Ratio of Briquette-Fueled Grills Emission/Stoves Emission [%]
PM2.52.290.00662.46121.954
CO92.060.0062590.241365.954
NOx4.110.06350.3561.628
SO23.820.015156.81132.312
NH32.950.001NANANA
CH49.800.009NANANA
Publisher’s Note: MDPI stays neutral with regard to jurisdictional claims in published maps and institutional affiliations.

