Abstract
This paper presents the results of measuring the final energy consumption for heating and domestic hot water (DHW) preparation and indoor conditions in 15 apartments located in pre-war tenement houses. The measurements were compared to the computed energy consumption. The calculations ware made based on the model calibrated by field measurements. The discrepancies between measurements and calculations were assessed using the energy performance gap (EPG). Calculations were made separately for energy for heating and for DHW preparation. Additionally, the results of EPG calculations for different levels of analysis are presented aiming at assessing the impact of weather, temperature in the surrounding zones and users’ behavior. Users’ behaviors influencing the size of the EPG were divided into typical (energy saving or excessive energy consumption) and forced (energy poverty, response to the apartment’s surroundings, technical limitations. The connection between the heating sources and the heating habits has been clearly observed in the research. The former (typical) behaviors were the origin of the energy gap in the apartments heated with natural gas and district heating. The latter (forced) were the origin of the gap in the apartments heated with mostly electricity and solid fuel (with one exception: one apartment that utilized the district heating).
1. Introduction
The implementation of zero-emission plans in Europe poses serious challenges for EU countries. One is that new buildings must be designed to be near zero energy [1]. However, it seems that modernizing existing facilities is even more difficult. In this case, pre-war tenement buildings with the highest energy demand appear to be the greatest challenge. In these buildings, it is necessary to change the heating systems to low-emission ones, and first to reduce their energy consumption. Each EU country faces different challenges in this area.
In Poland, an additional problem with pre-war buildings is the significant number of flats still equipped with solid-fuel heating systems. Research carried out in Wroclaw, Poland, in 2019 showed a high concentration of such heat sources in buildings built before 1945, i.e., downtown tenement houses. It turned out that as many as 64% of the apartments heated with solid fuel in the city (12,000 out of 18,700) are included in this group of buildings [2]. Carbon-based heat sources are the direct cause of emissions of substances such as particulate matter (PM2.5, PM10), benzo(a)pyrene (BaP), nitrogen oxides, sulfur dioxide, and carbon monoxide. The emission level is also directly related to the energy consumption of buildings. Estimating this energy provides a basis for building models related not only to air pollution, but also to energy modeling of municipal buildings (UBEM) [3]. Actions should be taken on many levels and interrelated goals should be defined: improving air quality in cities, reducing the energy consumption of buildings in urban agglomerations, and improving the quality of life of their inhabitants.
To conduct large-scale activities, it is necessary to properly identify the housing structure, which will allow for long-term planned research and investments. The current research directions are aimed at developing a methodology for modeling the energy demand of buildings at various scales. The micro scale includes individual premises and buildings, the meso scale determines the energy consumption of districts or building quarters, and the macro scale applies to entire cities [4]. The basic input data for modeling are meteorological data, 3D models of cities, and nongeometric properties of buildings. Such modeling also requires the prioritization of housing stock into building archetypes. Their construction is based mainly on the age, shape, method of use, and heating systems used. The process of creating archetypes is a crucial part of building models and making them reliable. The main problem indicated by the researchers is the fact that UBEM designers do not have access to the measured final energy consumption in premises or buildings. Limited access to such data and generally insufficient knowledge about the thermal properties of buildings in different age categories often make it impossible to simulate uncertainty and reduce the inaccuracies in model construction [3]. Therefore, it is necessary to provide data resulting from the calculation of energy demand, as well as on actual energy consumption in selected well-recognized buildings. There is a need to develop a way to consider user behavior that significantly affects the real energy consumption of buildings and apartments. In addition, researchers point out the need for a detailed approach to the problem of predicting energy demand profiles of building resources with detailed time resolution. These profiles should take into account geographic location, user behavior, and the effectiveness of various energy systems and technologies in cities [5].
To conclude, the literature lacks information supporting the determination of energy demand considering all of the above conditions on a micro scale, especially in older buildings. Currently, methods for energy calculation and saving mainly focus on new buildings and algorithmic determination of energy consumption, hence they often fail for existing buildings [6]. The share of historic buildings in the centers of European cities is large, which means that accurate information on their energy consumption is critical in the process of modeling and planning changes aimed at local improvement of air quality, but also to affect progressive climate change. Researchers who have access to data on the actual energy consumption of older buildings emphasize that they may use less energy than expected, pointing to the fact that the greater energy demand of these buildings leads to more conscious use of the systems [6]. Collecting as much data as possible on this topic will allow researchers to construct more accurate energy models for cities.
The actual energy consumption of a building often differs significantly from the computed value, even if it is obtained using advanced complex software for dynamic simulated energy performance. This phenomenon is commonly known and described in the literature as the energy performance gap (EPG) [7,8,9]. Many authors use this indicator to assess the energy situation in relation to real measurements for residential, nonresidential, and single-family buildings [10]. The energy performance gap is defined depending on the situation. For example, de Wilde [9] defines three types of gaps: between initial predictions and measurements, between machine learning and measurements, and between predictions and display certificates in legislation. The article, however, is mostly related to the design of new buildings. In the literature, this coefficient also appears in studies that describe the effects of the thermal modernization process of buildings. For example, in [11], EPG is defined as the difference between actual and design consumption as a fraction of the design consumption. Interesting research is presented in the article [8]. The size of the EPG was determined for different refurbishment solution. The scientists analyzed the impact of the occupants’ interviews and surveys, and the consequential feedback to the occupants about the correct behaviors and use of the heating system. The results show that, for the buildings in which occupants learned how to optimally use the system, EPG was equal or smaller than 0% and occupant behaviors has been identified as one of the causes of the gap.
In the context of modernized buildings, it is worth noting that the literature describes a certain tendency of users to increase their needs after higher technological standards are achieved in the building, the so-called rebound effect. This effect is also known as the Jevons paradox [12]. It was found that the assumed economic use of energy in such cases is not always confirmed, and the truth is often the opposite. The rebound effect is described in two forms: indirect and direct. The direct rebound effect is described as increased efficiency and the associated reduced cost of a product or service, resulting in its increased consumption. The indirect rebound effect describes the situation where savings from reduced efficiency cost enable spending more income on other products and services [13]. A complementary concept is described in [14], in which the authors introduced the term “prebound effect”. This effect measures the discrepancy between the measured and calculated energy requirements of existing buildings that have not been thermomodernized. Researchers have observed that these buildings consume less energy than calculated using the methods in energy certification. A higher prebound effect in combination with low income may be a sign of energy poverty. The authors emphasize that further research is needed to understand motivations and practices in households that show a high prebound effect.
The actual level of final energy demand of a building is influenced by users’ behaviors, which is related to the tenants’ individual characteristics, such as their age and habits [15,16,17,18,19]. For example, the heating schedule for the residences of retirees will differ significantly from those of young working people or families with children. Since the former stay in their apartments more and usually have higher temperature requirements, a correspondingly longer heating time is needed. Kashif et al. [20] stated that both time and environmental factors create a certain context, which means that residents must perform certain activities to adapt their surroundings to their needs. As inhabitants have different approaches to the balance between indoor comfort and energy consumption [21,22,23,24,25], they behave differently despite being in the same environment. It can be concluded that the existing studies confirm the discrepancies between expected and observed energy parameters of buildings. The energy performance gap is mainly due to differences between the assumptions for engineering calculations and reality, including, in a significant way, the behaviors of users: the savings effect or the effect of increased demand. This paper enriches this topic by providing information on the size of the difference between real and computed energy consumption in pre-war tenement houses, indicating the reasons. As it turns out, users’ behaviors are very closely related to the characteristics of heating systems in buildings and reflect more problems than those mentioned in the literature so far.
2. Materials and Methods
2.1. Aim of the Research
The aim of the research was to measure the energy gap between the real and computed energy consumption of residential premises located in pre-war tenement houses and to indicate possible reasons for its occurrence. The calculations were made separately for energy for space heating and for the preparation of domestic hot water (DHW). The research was extended with a detailed analysis of the actual situation in apartments and their surroundings. Not only was energy consumption measured in the examined premises, but also the parameters of indoor and outdoor air and other factors determining the energy consumption of apartments. The collected data allowed for model development using field measurements. The model was then used to simulate energy consumption under various conditions. This in-depth analysis was aimed at assessing the impact of users’ behaviors and real weather conditions on the energy consumption of tenement houses in Wroclaw.
2.2. Subject of Study
Measurements were carried out in 15 apartments (labeled A1–A15) located in pre-war tenement houses in the selected quarter of the city of Wroclaw (Poland) from 14 January to 9 March 2020. The technical standards of the facilities are varied: there are buildings that require extensive renovation (very bad condition), buildings in slightly better condition (bad condition), neglected buildings often found in Wroclaw (average condition), and those in which partial or full thermal modernization has been carried out (good condition). The facades of exemplary buildings, showing their typical technical conditions, can be seen in Figure 1. All apartments are in the same type of building (built before 1920), but they were selected due to differences on the micro scale. They differ in size, location in the building, heat source, and the tenants’ situation and lifestyle. The premises were selected for research based on a pilot study conducted in 2018 [26] covering 410 residential premises. Basic data on the examined premises are presented in Table 1. Additionally, the issues important for the test results should be emphasized: there was no bathroom in apartment A9 and no DHW preparation system in apartment A7.
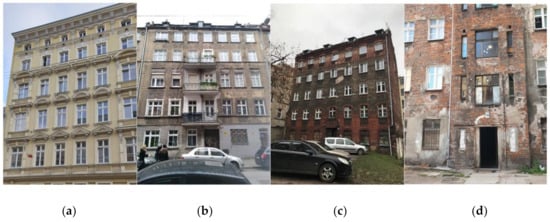
Figure 1.
Four specified technical conditions of tenement houses in Wroclaw (according to Table 1 and described in the text): (a) good; (b) average; (c) bad; (d) very bad.

Table 1.
Basic information about the apartments.
2.3. Measurements
Measurements were carried out using the devices listed in Table 2. Air temperature, relative humidity, and carbon dioxide concentration in the rooms were recorded. Temperature and consumption of tap water and DHW (if any) were measured in each apartment. Detailed information on electricity consumption in the apartments was also obtained. Thermal energy consumption measurements varied depending on the heat source. In the case of premises equipped with district heating, readings were obtained from individual energy meters. In the case of flats with heat sources powered by natural gas, gas flow was measured, if possible, or consumption was noted manually at daily intervals.
Table 2.
Measuring Devices.
In the case of apartments heated by electric heaters, each heat source was connected to an individual electricity meter. In flats heated with solid fuel stoves, the weight of fuel used for heating was registered and the temperature of the tiled stove surface was measured. Additionally, thermovision studies were carried out to better investigate these heat sources, and the values of ambient temperature and insolation were measured.
2.4. Computational Models
For each apartment, a calculation model of final energy demand for heating and DHW preparation was developed, based on the guidelines of the standard [27] and Polish regulations [28]. The model development was preceded by a detailed site inspection. During the field visits, the area of the premises, the level of thermal modernization of the building, the construction of building partitions, and the technical condition of windows and doors were determined. Weather conditions and conditions of use of the apartments were assumed according to the guidelines for engineering calculations [28]. Assessments made in strict accordance with these recommendations are described as Simulation 3.
To increase the accuracy of the calculations, the data of weather observed during the tests were used. It should be noted that in the analyzed period, the average ambient temperature was higher than in previous years. Figure 2 compares these values against the average values from the last 10 heating seasons in Wroclaw and the average temperature from the 30-year period, which are used in the calculations for energy certification of buildings [29].
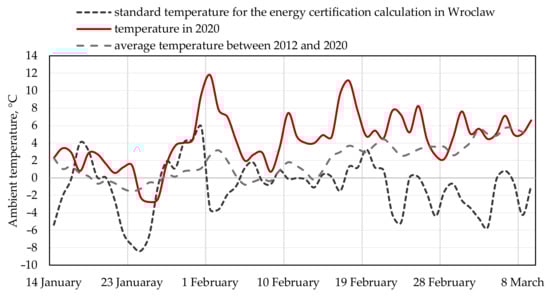
Figure 2.
Average daily ambient temperatures in Wroclaw in the selected period.
The average ambient temperature during the study period was 4.4 °C, while the average for the last 10 years in the same period was 1.9 °C. An even lower value of −1.0 °C is reached with the data used in calculating audits and energy certification. Therefore, there is as much as a 5.4 °C difference in relation to the period of research. It should be emphasized that the period of the last 10 years is characterized by much milder temperatures in the heating season than in previous years. The average ambient temperature in the last 10 years in Wroclaw was 1.72 °C higher than for the same period in 2000–2009 [30] and 3.15 °C higher according to the climatic data prepared for energy audit and certification [29]. As a result, the computational energy demand for heating is overstated in relation to the real values. The scale of these discrepancies is shown in the energy gap values described in this paper.
The calibration process was based on the recognition of users’ habits. In order to determine actual internal heat gains, data on the time for basic housework, home furnishings, and the use schedule of the premises were obtained. The level of ventilation was estimated based on measuring the concentration of carbon dioxide and obtaining information from residents on the organization of air exchange in the rooms, i.e., the presence of ventilation grilles and trickle vents. In the calibration process, the internal air temperature was measured in every room of the apartments, as well as in staircases, basements, and attics. As a result, the actual temperatures of the surrounding spaces were determined. For calibration of the energy consumption calculation model for DHW production, actual measurements of domestic hot water consumption were used. The most important data used in the calibration process are shown in Table 3. The calibration process was performed until the simulation result was equal to the real final energy use (qH, qW), also described in Table 3.
Table 3.
Results of the measurements: conditions during measurements and standard of use of apartments.
Internal temperature is a very important factor that affects energy consumption for heating in residential premises. In the case of the tested apartments, a correlation between the average internal temperature and the type of heating system used was observed, as shown in Figure 3. In flats supplied from central heat sources (A8–A11) and individual gas boilers (A12–A15), this profile was correct and no significant differences in temperature were observed in different rooms. The temperature of the examined apartments oscillated between average and maximum values. The inhabitants were able to maintain thermal comfort in the rooms without much effort. Indoor temperature is not only based on thermal comfort needs, but is also an indicator of problems related to energy poverty or the inability to provide adequate temperature [31]. In some of the apartments, the average interior temperature during the research period was about 16 °C, and the lowest recorded in the bathroom was 13 °C. This is mainly due to the heating characteristics of solid fuel stoves (A1–A4) and the most expensive electric-powered systems in Poland (A5–A7). In apartments heated with systems powered by solid fuel or electricity, the interior temperature profile is not correct. Significant differences in the measured air temperature in different rooms in the apartment were observed, and temperature changes oscillated between average and minimum observed values.
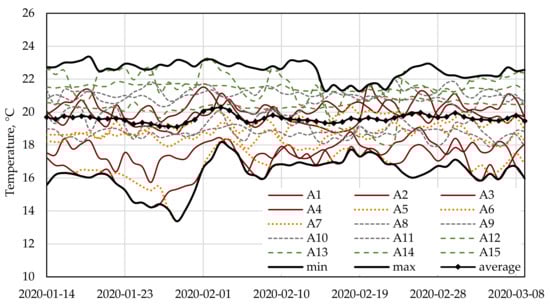
Figure 3.
Average indoor air temperatures in apartments during the tests: 14 January to 9 March 2020.
2.5. Simulations
The final energy consumption simulation for space heating and DHW preparation in apartments was carried out for various variants of the use of premises (simulations 0–4), as follows:
- Simulation 0: The results show the actual final energy consumption for space heating and DHW preparation during the research period (14 January to 9 March 2020). The results of this simulation correspond to the apartment use conditions (see Table 3) and weather conditions observed during the tests.
- Simulation 1: The results show the final energy consumption for space heating and DHW preparation in the research period for the weather conditions observed during the tests, but for the proper use of the apartment. The proper use is defined by interior temperature, ventilation level and DHW consumption as described below the interior temperature in the apartments was changed to comply with the requirements of Polish regulations [32], i.e., 20 °C in residential rooms and 24 °C in bathrooms. The ventilation level was assumed to meet the hygienic minimum [33], which should allow the CO2 concentration to be maintained at the appropriate level. DHW consumption was assumed at the level of 40 L/day per person (which corresponds to the average DHW consumption in all analyzed premises).
- Simulation 2: The results show the final energy consumption for space heating and DHW preparation in the research period for proper use of the apartment, as described in simulation 1, but for weather conditions corresponding to the data used in engineering calculations [28].
- Simulation 3: The results show the final energy consumption for space heating and DHW preparation in the research period for the weather conditions corresponding to the data used in engineering calculations [28] and for the use of the premises described as standard in engineering calculations of energy demand [32].
- Simulation 4: The results show the final energy consumption for space heating and DHW preparation in the research period for the weather conditions observed during the tests and for the use of the premises described as standard in engineering calculations of energy demand [32].
2.6. Methods of Energy Performance Gap Calculation
The energy performance gap is determined by the difference between the measured and calculated heating energy consumption in a given period. In this paper, the EPG indicator is defined at several levels.
in Equation (1) describes the gap between the measurement results (simulation 0) and engineering calculations (simulation 3) of total final energy consumption for space heating and DHW preparation (h + w). This indicator includes all factors that affect the size of the energy gap.
in Equation (2) describes the gap between the measurement results (simulation 0) and engineering calculations (simulation 3) of final energy consumption for space heating (h).
in Equation (3) describes the gap between the measurement results (simulation 0) and engineering calculations (simulation 3) of final energy consumption for DHW preparation (w).
in Equation (4) describes the gap between the results of simulation 1 and engineering calculations (simulation 3) of final energy consumption for space heating (h). This indicator determines the energy gap between engineering calculations and the simulation of the proper use of the apartment in the observed meteorological conditions.
in Equation (5) describes the gap between the results of simulation 1 and engineering calculations (simulation 3) of final energy consumption for DHW preparation (w). This indicator determines the energy gap between engineering calculations and the simulation of the proper domestic hot water consumption.
in Equation (6) describes the gap between the results of simulation 2 and engineering calculations (simulation 3) of final energy consumption for space heating (h). This indicator determines the energy gap between engineering calculations and the simulation of the proper use of the apartment for the meteorological conditions corresponding to the data used in engineering calculations.
in Equation (7) describes the gap between the results of simulation 4 and engineering calculations (simulation 3). This indicator can be understood as the energy gap resulting from the difference in the meteorological conditions used for the calculations.
and have not been defined, because, in these cases, the use of the DHW system (the consumption of domestic hot water) in apartments does not change, and the influence of the ambient temperature on energy consumption for DHW preparation is not included in the calculations.
3. Results and Discussion
3.1. Final Energy Use: Measurement vs. Calculation
The actual unit consumption of final energy for space heating and DHW preparation and the demand calculated according to the assumptions of simulation 3 (engineering calculations) are shown in Figure 4. The results for individual apartments are very different. These differences were expected due to the location of the apartment in the building and its insulation. For example, apartments A10, A12, A14, A15 are in a good technical condition and have lower than other average heat transfer coefficient (Table 1), so their unit energy demand should be the lowest. Despite this, the lowest values are observed in A5–A9, and the most significant differences between energy consumption compared to expectations are in A1–A10. The reasons for such unlike energy consumption compared to expectations are very low temperature of indoor air in the premises, insufficient ventilation, and/or the influence of the environment, i.e., the flow of thermal energy from zones adjacent to the apartment. Little insulation of interior walls causes intensive heat exchange between zones in the building. In the case of A9 these zones are exceptionally warm (for example the temperature in the staircase adjacent to apartment A9 exceeded 22 °C), so its unit energy demand is low. The opposite effect was observed in apartment A1, where the adjacent spaces are extremely underheated. This shows how important it is to analyze in detail the temperature of adjacent spaces, such as staircases, basements, and attics. These are important elements that influence the energy gap, which are discussed in detail later in the paper.
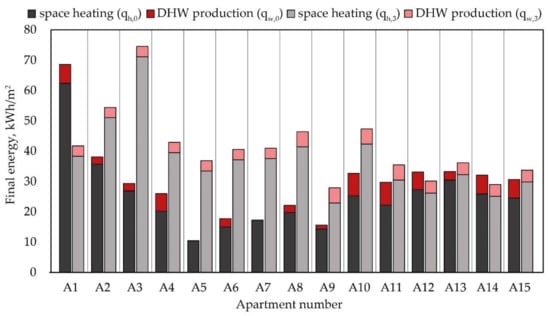
Figure 4.
Final energy for space heating and domestic hot water (DHW) production: measurement vs. calculation.
3.2. Energy Performance Gap
The results of energy performance gap (EPG) calculations for different levels of analysis are presented in Table 4.
Table 4.
Energy performance gap for different levels of analysis.
The energy gap for space heating and DHW preparation between measurement and engineering calculation results () is significant and is shown in Figure 5. Apartments A1–A4 are heated with solid fuel. In this case, the energy gap is −0.55 on average (excluding A1, for which the EPG value is positive at 0.3). A5–A7 are heated with electricity and are characterized by an energy gap of −0.7 on average. A8–A11 are heated with district heat and are characterized by a slightly smaller energy gap of −0.49 on average. A11–A15, for which the energy gap is the smallest at −0.2 on average, are heated with natural gas. There are different reasons for the discrepancy between the energy gap calculated for space heating and DHW preparation. A detailed analysis of this problem was performed and described below.
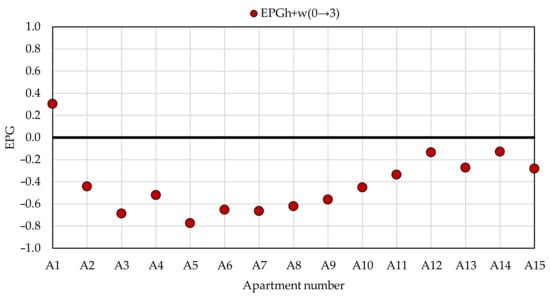
Figure 5.
Energy performance gap for heating and DHW preparation.
In Table 4 an expected energy gap between measurement and engineering calculations, due to significant differences in ambient temperature (see Figure 2), is presented (). These values range from −0.31 to −0.39. Comparing the results of and , Table 4, by extending the analysis with the actual parameters of the use of the premises, most of the apartments (A2–A11) have a greater negative EPG, which means that they actually consume less energy than expected. Several apartments (A1, A12–A14) have higher values, i.e., they consume more energy than calculated.
To understand the causes of this condition, it is necessary to examine residents’ behavior. The indoor temperature and the ventilation level in many apartments differ significantly from the norm. If they were correct, the energy performance gap would be smaller. This situation is marked and calculated as () and presented in Figure 6. It is worth noting that the difference in EPG values calculated for the real () and proper () operation is the highest for apartments A2–A8 and A11. These are heated with solid fuel and electricity, and two with district heat. The differences are significant and mostly cannot be classified as positively understood energy saving. In many apartments, the effect of energy poverty is noticeable, as manifested by extreme underheating and/or insufficient ventilation. In some premises heated with solid fuel (A2, A4), energy saving may be additionally forced by difficulty with operating the system, and not by energy poverty. In only one case, A11, the energy saving effect was not forced by the financial situation and technical problems.
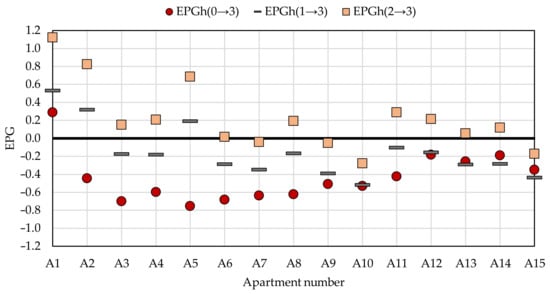
Figure 6.
Energy performance gap for space heating.
Figure 6 also shows the value of the energy performance gap between the results of simulations 2 and 3 (). Despite the fact that both simulations were performed with the same meteorological conditions, the EPG value in many cases does not approach 0. The obtained values are both strongly positive (1.12 for apartment A1) and negative (−0.28 for A10). These values illustrate the effects of imprecise assumptions regarding ventilation of rooms, internal heat gains, and temperatures in internal zones surrounding the apartment on the calculations. The latter especially contributes to significant differences between actual consumption, both positive and negative, and expected values, which is most noticeable in A1, A2, and A5, which are in buildings in very serious technical condition. Extremely underheated spaces and empty premises surrounding these flats increase their actual energy consumption.
The results of EPG calculations related to DHW preparation are shown in Figure 7. The discrepancies between measurement and calculation are significant (see ). As with space heating, in some cases they are not dictated by typical user behavior, but by energy poverty and technical limitations (e.g., lack of bathrooms). This is the case of apartments A5, A7, A8, and A9. The EPG values calculated for the situation where all inhabitants consume similar amounts of DHW (the average of the measurements) are also significant (). This means that methods of estimating DHW consumption, at least in the case of Poland, require many studies, such as those shown in [34]. It is necessary to clarify the calculation methods because the current ones do not meet expectations. In pre-war tenement houses, due to their significant energy consumption related to space heating, this problem may not be very important, but in new buildings, the EPG related to DHW preparation systems may have a significant impact on the assessment of the entire facility.
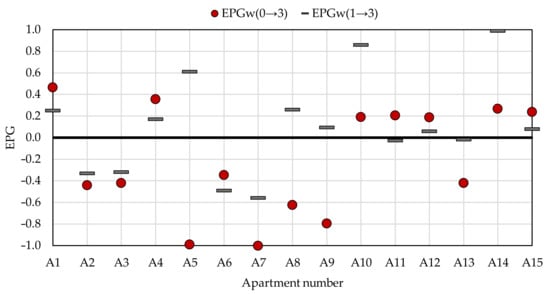
Figure 7.
Energy performance gap for DHW production.
4. Conclusions
The conducted in situ research made it possible to identify user behavior and helped to calibrate energy models of apartments in pre-war tenement houses, that allowed to perform simulations helping to analyze the energy performance gap on several levels connected to the apartment’s utilization and ambient temperature. On this basis, the energy performance gap for heating and DHW production has been analyzed. The calculated values turned out to be significant and negative, reaching even −0.78. Only in one considered case, the value obtained was positive and equaled to 0.3. The detailed analysis allowed us to refine crucial issues. The size of the energy gap is influenced not only by the ambient and internal temperature, but also by the temperature of surrounding spaces (for example: empty premises or stairways), which is different from the assumptions for the calculations. User behaviors that influence the size of the EPG can be divided into typical (energy saving or excessive energy consumption) and forced (energy poverty, response to the environment around the apartment, technical limitations). The former (typical) behaviors were the origin of the energy gap in the apartments heated with natural gas and district heating (A9–A15). The latter (forced) were the origin of the gap in the apartments heated with mostly electricity and solid fuel (A1–A8). The only exception was the apartment A8, that utilized the district heating. The most important forced aspects observed during the research were as follows: not heating some rooms, providing additional heating with gas cookers, covering the ventilation grids, limiting ventilation of the rooms, and consuming very little domestic hot water. Correctly determining and classifying the energy performance gap between expected and actual energy consumption can be important for the proper planning and implementation of thermal modernization in pre-war buildings. It may allow for better determination of energy and cost savings by considering the specific nature of the use of such buildings. It is important, because the high energy consumption of premises in tenement houses and the related high costs are the common problems faced by the residents. The connection between the heating resources cost and the heating habits has been clearly observed in the research. Solid fuel is a cheap energy resource in Poland, and it is currently used by the poorest part of the society. Electricity is expensive and requires significant savings. Heating with district heat usually allows residents to maintain thermal comfort, while natural gas, the cheapest source of thermal energy, combined with the good condition of tenement houses allows residents to freely manage their resources. The research results show that a good energy standard of a building together with a modern and cost-acceptable heating source help to eliminate the forced energy gap. Further research on the impact of resident’s behavior on the energy consumption and the size of the energy gap may be crucial for micro-scale modeling. Studying these behaviors requires an interdisciplinary approach, in particular a combination of engineering and social sciences. Energy behavior is not static; it changes with accumulated experience and financial and technical possibilities and is often inconsistent. These factors increase research difficulties and should be considered in any energy behavior analysis to minimize inaccuracies in assessing the situation.
Author Contributions
Conceptualization, M.S.-Z., E.S. and K.P; Methodology and Validation, M.S.-Z., E.S., K.P., A.C.; Formal Analysis and Investigation, M.S.-Z., E.S. and K.P; Resources and Data Curation, M.S.-Z., E.S., K.P., A.C. and M.K.; Writing—Original Draft Preparation, E.S., M.S.-Z.; Writing—Review & Editing, E.S., M.S.-Z.; Visualization, K.P.; Supervision, M.S.-Z.; All authors have read and agreed to the published version of the manuscript.
Funding
The project was implemented thanks to the “Divercity 4—Polish-Norwegian cooperation in the field of creating modern development solutions in cities” project with an EUR 300,000 grant from Iceland, Lichtenstein, and Norway through the EEA and Norway Grants. The initiative aims to identify the most effective solutions and create a cooperation network as well as exchange experiences between Polish self-governments and the Donor States, with particular emphasis on the subject of social participation in urban renewal and improvement of the urban environment. The funders had no role in the design of the study; in the collection, analyses, or interpretation of data; in the writing of the manuscript, or in the decision to publish the results.
Conflicts of Interest
The authors declare no conflict of interest.
Nomenclature
| DHW | Domestic hot water |
| Apartment numbers | |
| Average heat transfer coefficient, W/m2K | |
| Internal temperature, | |
| Domestic hot water consumption, | |
| Domestic hot water temperature, | |
| Internal gains, | |
| Energy performance gap for space heating | |
| Energy performance gap for domestic hot water preparation | |
| Energy performance gap for space heating and domestic hot water production | |
| Final energy for space heating, | |
| Final energy for domestic hot water preparation, | |
| Simulation numbers |
References
- Directive (EU) 2018/2002 of the European Parliament and of the Council of 11 December 2018 Amending Directive 2012/27/EU on Energy Efficiency. 2018. Available online: http://data.europa.eu/eli/dir/2018/2002/oj (accessed on 18 December 2020).
- Baborska-Narożny, M.; Szulgowska-Zgrzywa, M.; Piechurski, K.; Stefanowicz, E.; Fidorów-Kaprawy, N.; Laska, M.; Machyńska, A.; Chmielewska, A.; Wójcik, F. Źródła Ciepła na Paliwo Stałe w Budynkach Mieszkalnych we Wrocławiu. 2019. Available online: https://bip.um.wroc.pl/attachments/download/80120. (accessed on 17 December 2020).
- Reinhart, C.F.; Davila, C.C. Urban building energy modeling—A review of a nascent field. Build. Environ. 2016, 97, 196–202. [Google Scholar] [CrossRef]
- Frayssinet, L.; Merlier, L.; Kuznik, F.; Hubert, J.-L.; Milliez, M.; Roux, J.-J. Modeling the heating and cooling energy demand of urban buildings at city scale. Renew. Sustain. Energy Rev. 2018, 81, 2318–2327. [Google Scholar] [CrossRef]
- Kazas, G.; Fabrizio, E.; Perino, M. Energy demand profile generation with detailed time resolution at an urban district scale: A reference building approach and case study. Appl. Energy 2017, 193, 243–262. [Google Scholar] [CrossRef]
- Aksoezen, M.; Daniel, M.; Hassler, U.; Kohler, N. Building age as an indicator for energy consumption. Energy Build. 2015, 87, 74–86. [Google Scholar] [CrossRef]
- Zou, P.X.W.; Xu, X.; Sanjayan, J.; Wang, J. Review of 10 years research on building energy performance gap: Life-cycle and stakeholder perspectives. Energy Build. 2018, 178, 165–181. [Google Scholar] [CrossRef]
- Calì, D.; Osterhage, T.; Streblow, R.; Müller, D. Energy performance gap in refurbished German dwellings: Lesson learned from a field test. Energy Build. 2016, 127, 1146–1158. [Google Scholar] [CrossRef]
- De Wilde, P. The gap between predicted and measured energy performance of buildings: A framework for investigation. Autom. Constr. 2014, 41, 40–49. [Google Scholar] [CrossRef]
- Kowalski, P.; Szałański, P. Computational and the real energy performance of a single-family residential building in Poland—An attempt to compare: A case study. E3S Web Conf. 2017, 17, 00045. [Google Scholar] [CrossRef]
- Galvin, R. Making the “rebound effect” more useful for performance evaluation of thermal retrofits of existing homes: Defining the “energy savings deficit” and the “energy performance gap”. Energy Build. 2014, 69, 515–524. [Google Scholar] [CrossRef]
- Jevons, W.S. The Coal Question: An Inquiry Concerning the Progress of the Nation, and the Probable Exhaustion of Our Coal-Mines; Macmillan and Co.: London, UK; Cambridge, UK, 1865. [Google Scholar]
- Maxwell, D.; Owen, P.; McAndrew, L.; Muehmel, K.; Neubauer, A. Addressing the Rebound Effect, A Report for the European Commission DG Environment; European Commission DG ENV: Ivry-sur-Seine, France, 2011. [Google Scholar]
- Galvin, R.; Sunikka-Blank, M. Quantification of (p)rebound effects in retrofit policies—Why does it matter? Energy 2016, 95, 415–424. [Google Scholar] [CrossRef]
- Pisello, A.L.; Piselli, C.; Cotana, F. Influence of human behavior on cool roof effect for summer cooling. Build. Environ. 2015, 88, 116–128. [Google Scholar] [CrossRef]
- Al-Mumin, A.; Khattab, O.; Sridhar, G. Occupants’ behavior and activity patterns influencing the energy consumption in the Kuwaiti residences. Energy Build. 2003, 35, 549–559. [Google Scholar] [CrossRef]
- De Meester, T.; Marique, A.-F.; De Herde, A.; Reiter, S. Impacts of occupant behaviours on residential heating consumption for detached houses in a temperate climate in the northern part of Europe. Energy Build. 2013, 57, 313–323. [Google Scholar] [CrossRef]
- Yu, Z.; Fung, B.C.M.; Haghighat, F.; Yoshino, H.; Morofsky, E. A systematic procedure to study the influence of occupant behavior on building energy consumption. Energy Build. 2011, 43, 1409–1417. [Google Scholar] [CrossRef]
- Guerra Santin, O.; Itard, L.; Visscher, H. The effect of occupancy and building characteristics on energy use for space and water heating in Dutch residential stock. Energy Build. 2009, 41, 1223–1232. [Google Scholar] [CrossRef]
- Kashif, A.; Ploix, S.; Dugdale, J.; Le, X.H.B. Simulating the dynamics of occupant behaviour for power management in residential buildings. Energy Build. 2013, 56, 85–93. [Google Scholar] [CrossRef]
- De Groot, E.; Spiekman, M.; Opstelten, I. Dutch research into user behavior in relation to energy use of residences. In Proceedings of the PLEA 2008—25th Conference on Passive and Low Energy Architecture, Dublin, Ireland, 22–24 October 2008. [Google Scholar]
- Menezes, A.C.; Cripps, A.; Bouchlaghem, D.; Buswell, R. Predicted vs. actual energy performance of non-domestic buildings: Using post-occupancy evaluation data to reduce the performance gap. Appl. Energy 2012, 97, 355–364. [Google Scholar] [CrossRef]
- Dall’O’, G.; Sarto, L.; Galante, A.; Pasetti, G. Comparison between predicted and actual energy performance for winter heating in high-performance residential buildings in the Lombardy region (Italy). Energy Build. 2012, 47, 247–253. [Google Scholar] [CrossRef]
- Lopes, M.A.R.; Antunes, C.H.; Martins, N. Energy behaviours as promoters of energy efficiency: A 21st century review. Renew. Sustain. Energy Rev. 2012, 16, 4095–4104. [Google Scholar] [CrossRef]
- Paone, A.; Bacher, J.-P. The Impact of Building Occupant Behavior on Energy Efficiency and Methods to Influence It: A Review of the State of the Art. Energies 2018, 11, 953. [Google Scholar] [CrossRef]
- Baborska-Narożny, M.; Szulgowska-Zgrzywa, M.; Fidorów-Kaprawy, N.; Chmielewska, A.; Laska, M.; Stefanowicz, E.; Piechurski, K. Ciepło w Domu Gdy Zimno na Dworze. 2018. Available online: h8p://w-r.com.pl/projekty/cieplozimno/ (accessed on 20 October 2020).
- International Organization for Standardization. ISO 52016-1:2017, Energy Performance of Buildings—Energy Needs for Heating and Cooling, Internal Temperatures and Sensible and Latent Heat Loads—Part 1: Calculation Procedures; ISO: Geneva, Switzerland, 2017. (In Polish) [Google Scholar]
- Polish Minister of Infrastructure and Economic Development. Regulation of the Polish Minister of the Infrastructure and Economic Development of 21 February 2015 on the methodology for determining of building or part of the building and energy performance certificates. J. Laws 2015, 376. (In Polish) [Google Scholar]
- Ministry of Investment and Development. Data for Buildings Energy Calculations. Available online: https://dane.gov.pl/pl/dataset/797,typowe-lata-meteorologiczne-i-statystyczne-dane-klimatyczne-dla-obszaru-polski-do-obliczen-energetycznych-budynkow (accessed on 22 October 2020).
- Remund, J.; Müller, S.; Schmutz, M.; Gra, P. Meteonorm: Global Meteorogical Database for Solar Energy and Applied, 7-11/IX/2020, Version 8. In Proceedings of the 35th European PV Solar Energy Conference and Exhibition (EUPVSEC 2018), Brussels, Belgium, 24–28 September 2018. [Google Scholar]
- Baborska-Narożny, M.; Szulgowska-Zgrzywa, M.; Mokrzecka, M.; Chmielewska, A.; Fidorow-Kaprawy, N.; Stefanowicz, E.; Piechurski, K.; Laska, M. Climate justice: Air quality and transitions from solid fuel heating. Build. Cities 2020, 1, 120–140. [Google Scholar] [CrossRef]
- Polish Minister of Infrastructure and Economic Development. Regulation of the Polish Minister of the Infrastructure and Economic Development of 12 April 2002 on the Technical Conditions, Which Are to Be Met by Buildings and Their Location. J. Laws 2002. (In Polish) [Google Scholar]
- Polish Normalization Committee. PN-83/B-03430/Az3:2000 Ventilation in Residential Buildings of Collective Residence and Public Utility Buildings—Requirements. 2000; (In Polish). Available online: http://www.iko.pwr.wroc.pl/PracowDrct/Agnieszka_Zajac/_PN-83_B-03430_doc.pdf (accessed on 18 December 2020).
- Chmielewska, A.; Szulgowska-Zgrzywa, M.; Danielewicz, J. Domestic hot water consumption in multiapartment buildings. E3S Web Conf. 2017, 17, 00014. [Google Scholar] [CrossRef]
Publisher’s Note: MDPI stays neutral with regard to jurisdictional claims in published maps and institutional affiliations. |
© 2020 by the authors. Licensee MDPI, Basel, Switzerland. This article is an open access article distributed under the terms and conditions of the Creative Commons Attribution (CC BY) license (http://creativecommons.org/licenses/by/4.0/).