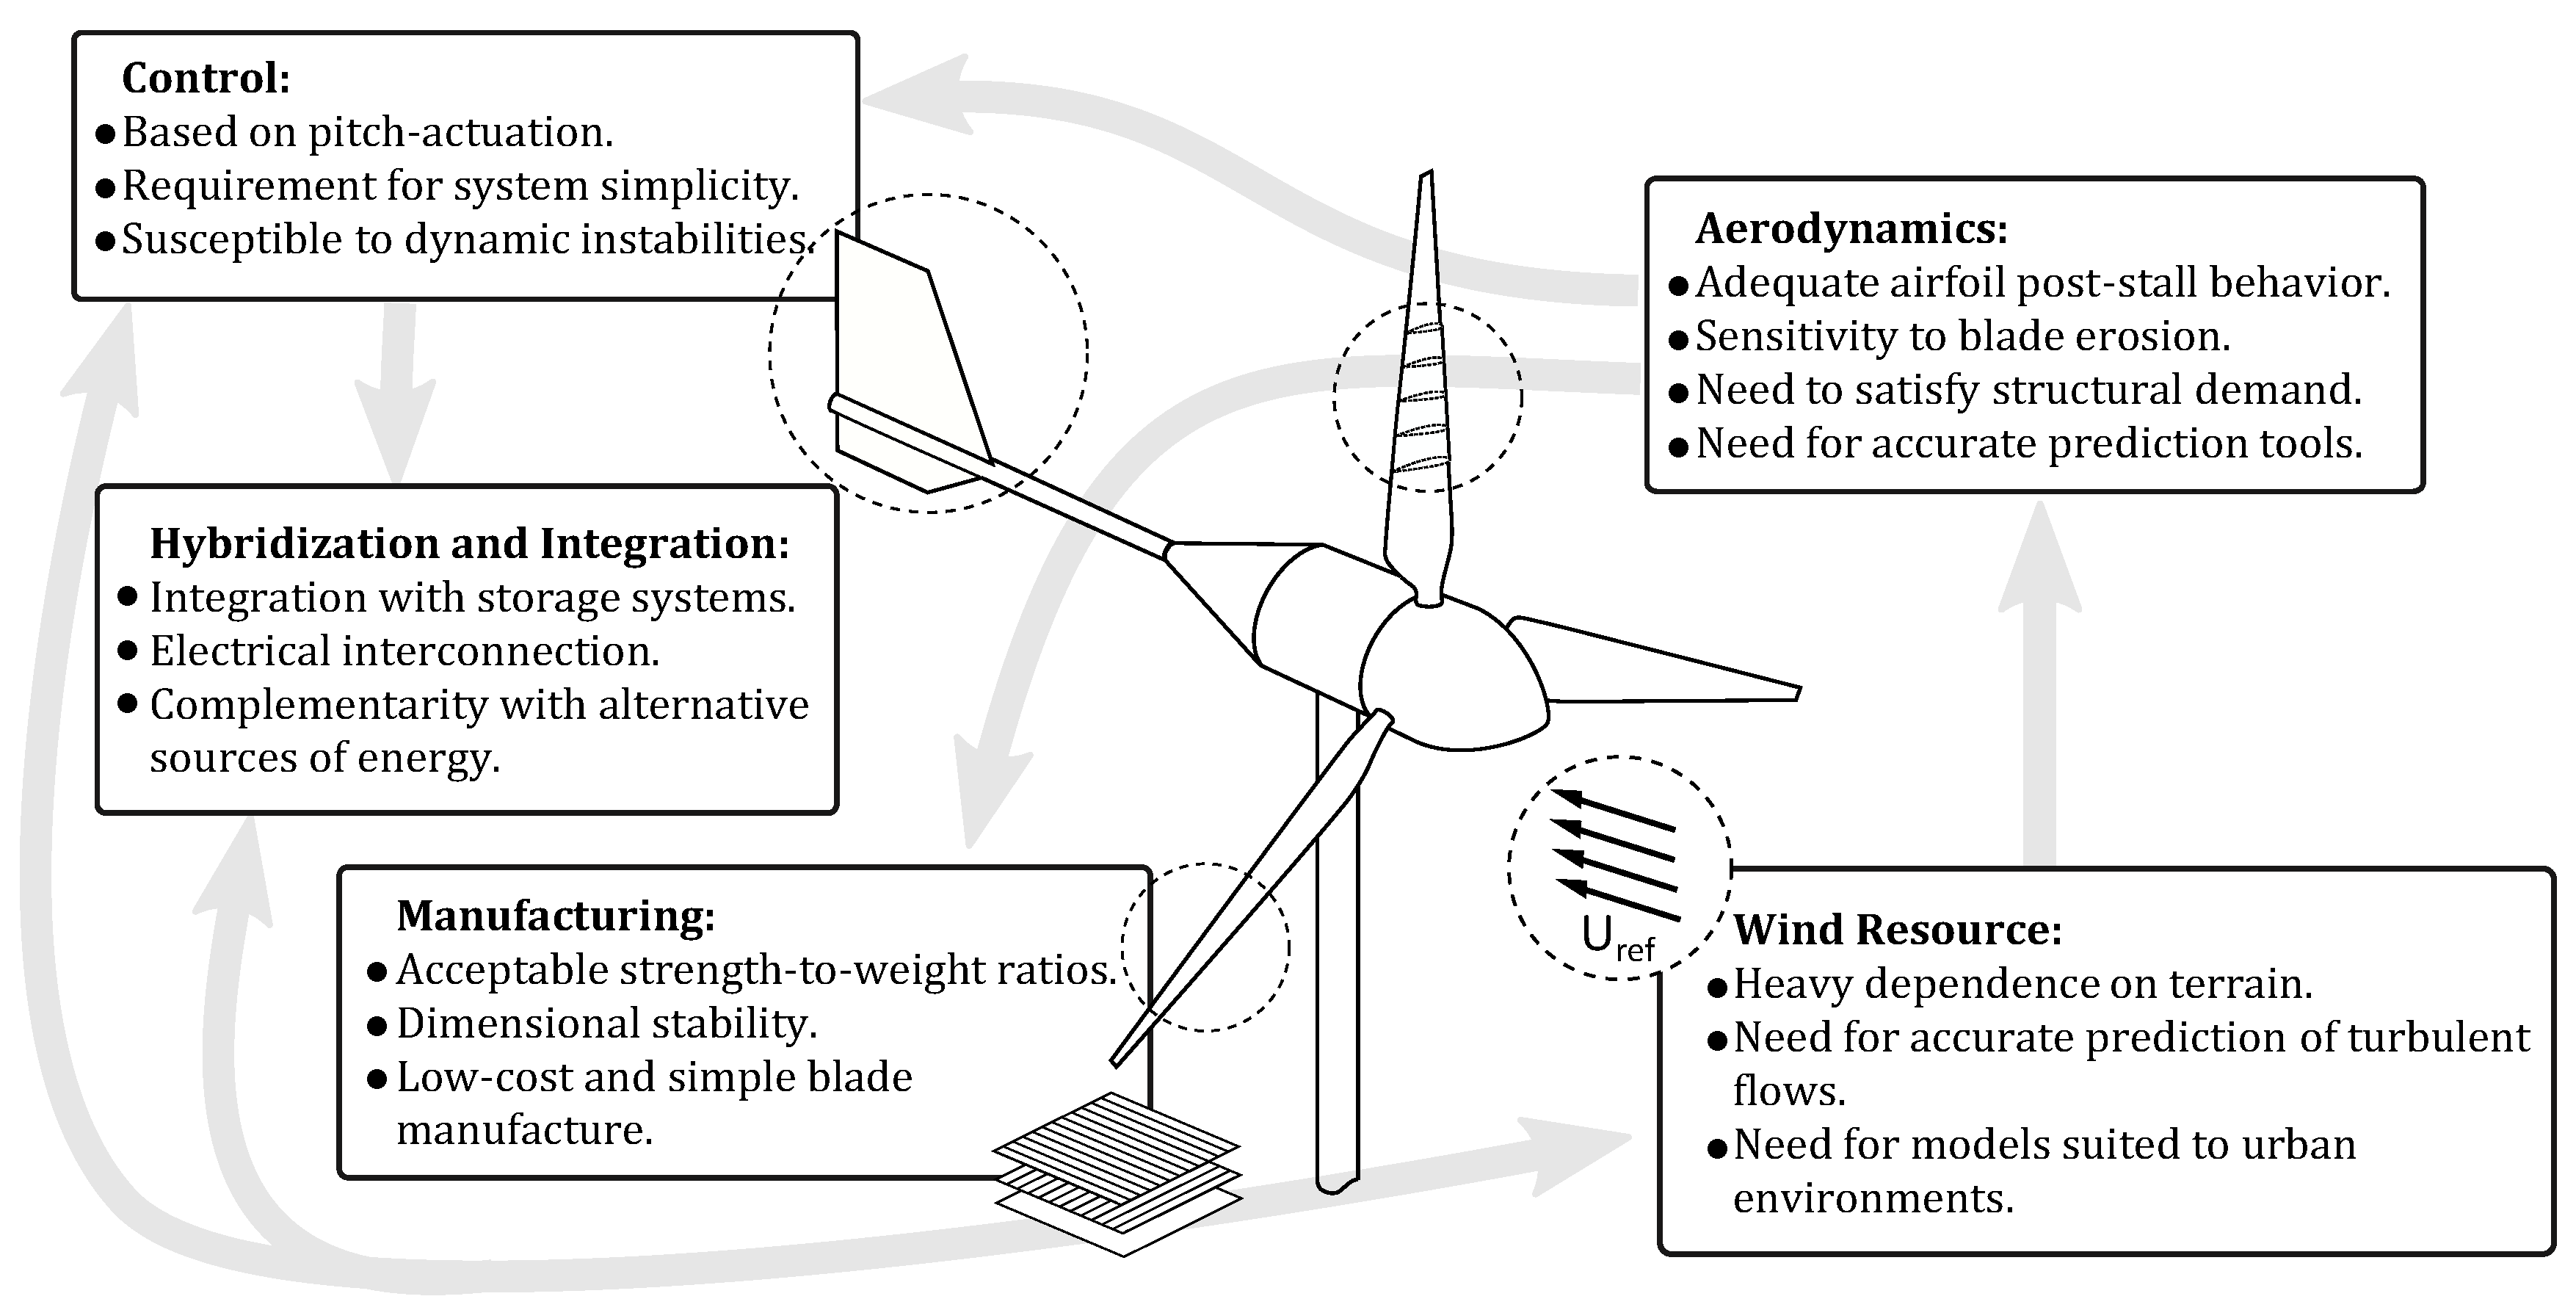
Technological and Operational Aspects That Limit Small Wind Turbines Performance

 ,
,  , , ,
, , ,  and
and
Abstract
1. Introduction
- Technology cost feasibility, in terms of manufacturing costs, maintenance costs and lifespan [30];
- Improvement in efficiency at low wind speeds in areas near the consumer centers where the resource may no be optimal [31];
- Noise control or reduction, owing to operation of SWTs is expected to be closer to the end-consumer, then turbines must be as quiet as possible [32]; and,
- Hybridization and integration with other sources of renewable energy, attending to the principle of spatial and temporal complementarity of the respective natural resources [33].
- As wind resource is the most differential factor when comparing SWTs with their large counterparts, most of the recent works have focused on it. Tadie Fogaing et al. [34] reviewed wind energy resources in urban locations, where is mentioned the requirement of SWT in applications close to consumption areas. Therefore, the wind energy study must have a precise evaluation of the wind speed profile.
- James and Bahaj [35] focused on micro- and small-scale wind turbine in the UK context. Principally, the authors addressed SWTs installed in buildings in the UK such as rural, suburban and urban environments. Additionally, the authors compared the wind speed computational tool called NOABL (Numerical Objective Analysis Boundary Layer) with annual measurements in rural, suburban and urban areas.
- Micallef and van Bussel [36] documented recent works related to SWTs and addressed a series of different disciplines connected to the aerodynamics in urban environments. The authors proposed an interesting discussion on the nature of existing methodologies for assessing wind resource in urban areas, encompassing analytical, experimental and numerical-based methods. KC et al. [37] presented a review on the topic of SWTs in the built environment aiming to understand issues related to wind resource, SWT performance, appropriate sitting and suitability of IEC 61400-2 in such environment.
- Within the context of rotor aerodynamic design, the work of Karthikeyan et al. [38] is one of the most relevant precedents, as they explore the self-starting behavior in SWTs, discuss on different devices for the improvement of performance and, gather information on airfoil sections for wind turbine blades for low Reynolds conditions, for which several design techniques are implemented.
- Regarding design control approaches, Menezes et al. [39] reviewed some relevant works related to the topic of wind turbine control divided into three main areas: wind turbine torque control, blade pitch control and grid integration control; it does not focus on SWTs neither vertical- nor horizontal axis-wind turbines. That works recognized the small number of works that address the wind turbine control concepts and presents a literature review of the topic to provide a base for further investigations in the field of wind turbine control techniques. In the discussion, the authors considered the potential of smart rotor applications and the overall potential of wind turbine control in the sustainable energy sector.
2. Wind Resource Estimation
2.1. Wind Speed Estimation
2.2. CFD Wind Velocity Profile Estimation
2.3. Standard IEC 61400-2
3. Turbulence Effects on Wind Profiles and STWs Perfomance
4. Aerodynamic Wind Turbine Rotor
4.1. Low Reynolds Airfoils
4.2. Airfoil Aerodynamic Aspects
4.3. Numerical Approaches for Aerodynamic Assessment
5. Manufacturing Procedures
5.1. Composite Reinforced Materials
5.2. Emerging Manufacturing Techniques
6. Control Systems Approaches
7. Hybridization and Integration
8. Assessment of Currently Available SWTs
Results
9. Conclusions
Author Contributions
Funding
Conflicts of Interest
References
- IEA. World Energy Outlook 2019; Technical Report WEO—2019; International Energy Agency: Paris, France, 2019. [Google Scholar]
- Ahmad, T.; Zhang, D. A critical review of comparative global historical energy consumption and future demand: The story told so far. Energy Rep. 2020, 6, 1973–1991. [Google Scholar] [CrossRef]
- International Energy Agency (IEA) and the World Bank. Sustainable Energy for All 2017—Progress toward Sustainable Energy (Summary); Technical Report; License: Creative Commons Attribution CC BY 3.0 IGO; World Bank: Washington, DC, USA, 2017. [Google Scholar]
- Twaha, S.; Ramli, M.A. A review of optimization approaches for hybrid distributed energy generation systems: Off-grid and grid-connected systems. Sustain. Cities Soc. 2018, 41, 320–331. [Google Scholar] [CrossRef]
- Lian, J.; Zhang, Y.; Ma, C.; Yang, Y.; Chaima, E. A review on recent sizing methodologies of hybrid renewable energy systems. Energy Convers. Manag. 2019, 199, 112027. [Google Scholar] [CrossRef]
- Torres-Madroñero, J.L.; Tamayo-Avendaño, J.M.; Bernal-del Río, S.; Sierra-Pérez, J.; Nieto-Londoño, C.; Mejía-Gutiérrez, R.; Osorio-Gómez, G. Formulation and simulation of a hybrid solar PV-wind generation system with photovoltaic concentration for non-interconnected areas to the energy grid. E3S Web Conf. 2020, 181, 02002. [Google Scholar] [CrossRef]
- Torres-Madroñero, J.L.; Nieto-Londoño, C.; Sierra-Pérez, J. Hybrid Energy Systems Sizing for the Colombian Context: A Genetic Algorithm and Particle Swarm Optimization Apbproach. Energies 2020, 13, 5648. [Google Scholar] [CrossRef]
- Moreno-Gamboa, F.; Escudero-Atehourtua, A.; Nieto-Londoño, C. Performance evaluation of external fired hybrid solar gas-turbine power plant in Colombia using energy and exergy methods. Therm. Sci. Eng. Prog. 2020, 20, 100679. [Google Scholar] [CrossRef]
- United Nations. The Sustainable Development Goals Report 2020; Technical Report; United Nations Publications: New York, NY, USA, 2020. [Google Scholar]
- Stoll, B.; Andrade, J.; Cohen, S.; Brinkman, G.; Martinez-Anido, C.B. Hydropower Modeling Challenges; Technical Report NREL/TP-5D00-68231; Prepared under Task No. WFGX.1040; National Renewable Energy Laboratory: Golden, CO, USA, 2017.
- Arango-Aramburo, S.; Turner, S.W.; Daenzer, K.; Ríos-Ocampo, J.P.; Hejazi, M.I.; Kober, T.; Álvarez-Espinosa, A.C.; Romero-Otalora, G.D.; van der Zwaan, B. Climate impacts on hydropower in Colombia: A multi-model assessment of power sector adaptation pathways. Energy Policy 2019, 128, 179–188. [Google Scholar] [CrossRef]
- Kondolf, G.M.; Gao, Y.; Annandale, G.W.; Morris, G.L.; Jiang, E.; Zhang, J.; Cao, Y.; Carling, P.; Fu, K.; Guo, Q.; et al. Sustainable sediment management in reservoirs and regulated rivers: Experiences from five continents. Earth Future 2014, 2, 256–280. [Google Scholar] [CrossRef]
- del Río, D.A.; Moffett, H.; Nieto-Londoño, C.; Vásquez, R.E.; Escudero-Atehortúa, A. Chivor’s Life Extension Project (CLEP): From Sediment Management to Development of a New Intake System. Water 2020, 12, 2743. [Google Scholar] [CrossRef]
- REN21. Renewables 2018 Global Status Report. A Comprehensive Annual Overview of the State of Renewable Energy; Technical Report GSR2018; REN21 Secretariat: Paris, France, 2018. [Google Scholar]
- Jouhara, H.; Żabnieńska Góra, A.; Khordehgah, N.; Ahmad, D.; Lipinski, T. Latent Thermal Energy Storage Technologies and Applications: A Review. Int. J. Thermofluids 2020, 2020, 100039. [Google Scholar] [CrossRef]
- Jouhara, H.; Khordehgah, N.; Almahmoud, S.; Delpech, B.; Chauhan, A.; Tassou, S.A. Waste heat recovery technologies and applications. Therm. Sci. Eng. Prog. 2018, 6, 268–289. [Google Scholar] [CrossRef]
- Fierro, J.J.; Escudero-Atehortua, A.; Nieto-Londoño, C.; Giraldo, M.; Jouhara, H.; Wrobel, L.C. Evaluation of waste heat recovery technologies for the cement industry. Int. J. Thermofluids 2020, 7-8, 100040. [Google Scholar] [CrossRef]
- WWEA: World Wind Energy Association. 2017 Summary: Small Wind World Repprt. Available online: https://wwindea.org/blog/2017/06/02/wwea-released-latest-global-small-wind-statistics/ (accessed on 17 September 2020).
- The International Renewable Energy Agency. Quality Infrastructure for RETs—Small Wind Turbines (for Policy Makers); IRENA: Abu Dhabi, UAE, 2015; p. 56. [Google Scholar]
- The International Renewable Energy Agency. IRENA. Wind power—Technology Brief. Energy 2016, 1–24. [Google Scholar]
- The International Renewable Energy Agency. IRENA. Renewable Energy Sources. Available online: https://www.irena.org/ (accessed on 1 May 2019).
- The International Renewable Energy Agency. IRENA. Wind Energy. Available online: https://www.irena.org/wind (accessed on 9 April 2020).
- Moreira Chagas, C.C.; Pereira, M.G.; Rosa, L.P.; da Silva, N.F.; Vasconcelos Freitas, M.A.; Hunt, J.D. From megawatts to kilowatts: A review of small wind turbine applications, lessons from the US to Brazil. Sustainability 2020, 12, 2760. [Google Scholar] [CrossRef]
- Small Wind Certification Council. ICC-SWCC Summary Report SWCC-11-04; Technical Report; Small Wind Certification Council: Brea, CA, USA, 2019. [Google Scholar]
- Small Wind Certification Council. ICC-SWCC Summary Report SWCC-10-12; Technical Report; Small Wind Certification Council: Brea, CA, USA, 2019. [Google Scholar]
- Small Wind Certification Council. ICC-SWCC SUMMARY REPORT LPP-16-05; Technical Report; Small Wind Certification Council: Brea, CA, USA, 2019. [Google Scholar]
- Leary, J.; Czyrnek-Delêtre, M.; Alsop, A.; Eales, A.; Marandin, L.; Org, M.; Craig, M.; Ortiz, W.; Casillas, C.; Persson, J.; et al. Finding the niche: A review of market assessment methodologies for rural electrification with small scale wind power. Renew. Sustain. Energy Rev. 2020, 133, 110240. [Google Scholar] [CrossRef]
- El-Askary, W.A.; Sakr, I.M.; AbdelSalam, A.M.; Abuhegazy, M.R. Modeling of wind turbine wakes under thermally-stratified atmospheric boundary layer. J. Wind. Eng. Ind. Aerodyn. 2017, 160, 1–15. [Google Scholar] [CrossRef]
- Battisti, L.; Benini, E.; Brighenti, A.; Dell’Anna, S.; Raciti Castelli, M. Small wind turbine effectiveness in the urban environment. Renew. Energy 2018, 129, 102–113. [Google Scholar] [CrossRef]
- Tabassum, M.; Kashem, S.B.A.; Mathew, K. Distributed energy generation–Is it the way of the future? Lect. Notes Electr. Eng. 2018, 436, 627–636. [Google Scholar] [CrossRef]
- Tummala, A.; Velamati, R.K.; Sinha, D.K.; Indraja, V.; Krishna, V.H. A review on small scale wind turbines. Renew. Sustain. Energy Rev. 2016, 56, 1351–1371. [Google Scholar] [CrossRef]
- Nolan Clark, R. Small Wind: Planning and Building Successful Installations; Cambridge University Press: Cambridge, UK, 2014. [Google Scholar] [CrossRef]
- Jurasz, J.; Canales, F.A.; Kies, A.; Guezgouz, M.; Beluco, A. A review on the complementarity of renewable energy sources: Concept, metrics, application and future research directions. Renew. Sustain. Energy Rev. 2019, 195, 703–724. [Google Scholar] [CrossRef]
- Tadie Fogaing, M.B.; Gordon, H.; Lange, C.F.; Wood, D.H.; Fleck, B.A. A Review of Wind Energy Resource Assessment in the Urban Environment. Lect. Notes Energy 2019, 70, 7–36. [Google Scholar] [CrossRef]
- James, P.A.B.; Bahaj, A.S. Small-Scale Wind Turbines; Elsevier Inc.: Cambridge, MA, USA, 2017; pp. 389–418. [Google Scholar] [CrossRef]
- Micallef, D.; Van Bussel, G. A review of urban wind energy research: Aerodynamics and other challenges. Energies 2018, 11, 2204. [Google Scholar] [CrossRef]
- KC, A.; Whale, J.; Urmee, T. Urban wind conditions and small wind turbines in the built environment: A review. Renew. Energy 2019, 131, 268–283. [Google Scholar] [CrossRef]
- Karthikeyan, N.; Kalidasa Murugavel, K.; Arun Kumar, S.; Rajakumar, S. Review of aerodynamic developments on small horizontal axis wind turbine blade. Renew. Sustain. Energy Rev. 2015, 42, 801–822. [Google Scholar] [CrossRef]
- Menezes, E.J.N.; Araújo, A.M.; da Silva, N.S.B. A review on wind turbine control and its associated methods. J. Clean. Prod. 2018, 174, 945–953. [Google Scholar] [CrossRef]
- Murthy, K.; Rahi, O. A comprehensive review of wind resource assessment. Renew. Sustain. Energy Rev. 2017, 72, 1320–1342. [Google Scholar] [CrossRef]
- Krohn, S.; Morthorst, P.E.; Awerbuch, S. The economics of wind energy. Eur. Wind. Energy Assoc. 2009, 13, 28–29. [Google Scholar]
- Elsner, P.; Suarez, S. Renewable energy from the high seas: Geo-spatial modelling of resource potential and legal implications for developing offshore wind projects beyond the national jurisdiction of coastal States. Energy Policy 2019, 128, 919–929. [Google Scholar] [CrossRef]
- Tandjaoui, M.; Benachaiba, C.; Abdelkhalek, O.; Dennai, B.; Mouloudi, Y. The Impact of Wind Power Implantation in Transmission Systems. Energy Procedia 2013, 36, 260–267. [Google Scholar] [CrossRef]
- Oke, T.R. Boundary Layer Climates, 2nd ed.; Routledge: London, UK, 1987. [Google Scholar]
- Abohela, I.; Hamza, N.; Dudek, S. Effect of roof shape, wind direction, building height and urban configuration on the energy yield and positioning of roof mounted wind turbines. Renew. Energy 2013, 50, 1106–1118. [Google Scholar] [CrossRef]
- Mannan, S. (Ed.) Chapter 15—Emission and Dispersion. In Lees’ Loss Prevention in the Process Industries (Fourth Edition), 4th ed.; Butterworth-Heinemann: Oxford, UK, 2012; pp. 752–1074. [Google Scholar] [CrossRef]
- ABB. Cuaderno de Aplicaciones Técnicas. Plantas Eólicas; ABB: Barcelona, Spain, 2010; pp. 1–109. [Google Scholar]
- Masseran, N. Markov Chain model for the stochastic behaviors of wind-direction data. Energy Convers. Manag. 2015, 92, 266–274. [Google Scholar] [CrossRef]
- Acosta, J.L.; Combe, K.; Djokić, S.Ž.; Hernando-Gil, I. Performance assessment of micro and small-scale wind turbines in urban areas. IEEE Syst. J. 2012, 6, 152–163. [Google Scholar] [CrossRef]
- Sedaghat, A.; Hassanzadeh, A.; Jamali, J.; Mostafaeipour, A.; Chen, W.H. Determination of rated wind speed for maximum annual energy production of variable speed wind turbines. Appl. Energy 2017, 205, 781–789. [Google Scholar] [CrossRef]
- IEC. IEC 61400-2. Wind Turbines—Part 2: Small Wind Turbines; IEC: Geneva, Switzerland, 2013. [Google Scholar]
- Zhou, Q.; Wang, C.; Zhang, G. Hybrid forecasting system based on an optimal model selection strategy for different wind speed forecasting problems. Appl. Energy 2019, 250, 1559–1580. [Google Scholar] [CrossRef]
- Toja-Silva, F.; Kono, T.; Peralta, C.; Lopez-Garcia, O.; Chen, J. A review of computational fluid dynamics (CFD) simulations of the wind flow around buildings for urban wind energy exploitation. J. Wind. Eng. Ind. Aerodyn. 2018, 180, 66–87. [Google Scholar] [CrossRef]
- Toja-Silva, F.; Peralta, C.; Lopez-Garcia, O.; Navarro, J.; Cruz, I. Roof region dependent wind potential assessment with different RANS turbulence models. J. Wind. Eng. Ind. Aerodyn. 2015, 142, 258–271. [Google Scholar] [CrossRef]
- Antoniou, N.; Montazeri, H.; Neophytou, M.; Blocken, B. CFD simulation of urban microclimate: Validation using high-resolution field measurements. Sci. Total Environ. 2019, 695. [Google Scholar] [CrossRef]
- Argyropoulos, C.D.; Markatos, N.C. Recent advances on the numerical modelling of turbulent flows. Appl. Math. Model. 2015, 39, 693–732. [Google Scholar] [CrossRef]
- Nieto, F.; Hargreaves, D.M.; Owen, J.S.; Hernández, S. On the applicability of 2D URANS and SST k-ω turbulence model to the fluid-structure interaction of rectangular cylinders. Eng. Appl. Comput. Fluid Mech. 2015, 9, 157–173. [Google Scholar] [CrossRef]
- Markatos, N.C. The mathematical modelling of turbulent flows. Appl. Math. Model. 1986, 10, 190–220. [Google Scholar] [CrossRef]
- Toja-Silva, F.; Peralta, C.; Lopez-Garcia, O.; Navarro, J.; Cruz, I. On roof geometry for urban wind energy exploitation in high-rise buildings. Computation 2015, 3, 299–325. [Google Scholar] [CrossRef]
- Rakib, M.I.; Evans, S.P.; Clausen, P.D. Measured gust events in the urban environment, a comparison with the IEC standard. Renew. Energy 2020, 146, 1134–1142. [Google Scholar] [CrossRef]
- Davis, F.K.; Newstein, H. The Variation of Gust Factors with Mean Wind Speed and with Height. J. Appl. Meteorol. 1968, 7, 372–378. [Google Scholar] [CrossRef]
- Antonio, O.L.C.; Wood, D.H. Measurements of semi-urban gust factors for wind load determination. Green Energy Technol. 2018, PartF10, 17–25. [Google Scholar] [CrossRef]
- KC, A.; Whale, J.; Evans, S.P.; Clausen, P.D. An investigation of the impact of wind speed and turbulence on small wind turbine operation and fatigue loads. Renew. Energy 2020, 146, 87–98. [Google Scholar] [CrossRef]
- Woolmington, T.; Sunderland, K.; Blackledge, J.; Conlon, M. The progressive development of turbulence statistics and its impact on wind power predictability. Energy 2014, 77, 25–34. [Google Scholar] [CrossRef]
- Rakib, M.I.; Nay, S.; Evans, S.; Clausen, P. Wind Regimes in Urban Environments: Experimental Comparison with the IEC 61400.2-2013 Open Terrain Wind Model. Res. Top. Wind. Energy 2019, 8, 201–214. [Google Scholar] [CrossRef]
- Dilimulati, A.; Stathopoulos, T.; Paraschivoiu, M. Wind turbine designs for urban applications: A case study of shrouded diffuser casing for turbines. J. Wind. Eng. Ind. Aerodyn. 2018, 175, 179–192. [Google Scholar] [CrossRef]
- Pagnini, L.C.; Burlando, M.; Repetto, M.P. Experimental power curve of small-size wind turbines in turbulent urban environment. Appl. Energy 2015, 154, 112–121. [Google Scholar] [CrossRef]
- Lubitz, W.D. Impact of ambient turbulence on performance of a small wind turbine. Renew. Energy 2014, 61, 69–73. [Google Scholar] [CrossRef]
- Ward, N.J.; Stewart, S.W. A turbulence intensity similarity distribution for evaluating the performance of a small wind turbine in turbulent wind regimes. Wind Eng. 2015, 39, 661–673. [Google Scholar] [CrossRef]
- Cooney, C.; Byrne, R.; Lyons, W.; O’Rourke, F. Performance characterisation of a commercial-scale wind turbine operating in an urban environment, using real data. Energy Sustain. Dev. 2017, 36, 44–54. [Google Scholar] [CrossRef]
- Carbó Molina, A.; De Troyer, T.; Massai, T.; Vergaerde, A.; Runacres, M.C.; Bartoli, G. Effect of turbulence on the performance of VAWTs: An experimental study in two different wind tunnels. J. Wind. Eng. Ind. Aerodyn. 2019, 193. [Google Scholar] [CrossRef]
- Emejeamara, F.C.; Tomlin, A.S. A method for estimating the potential power available to building mounted wind turbines within turbulent urban air flows. Renew. Energy 2020, 153, 787–800. [Google Scholar] [CrossRef]
- Emejeamara, F.C.; Tomlin, A.S.; Millward-Hopkins, J.T. Urban wind: Characterisation of useful gust and energy capture. Renew. Energy 2015, 81, 162–172. [Google Scholar] [CrossRef]
- Orrell, A.; Preziuso, D.; Foster, N.; Morris, S.; Homer, J. 2018 Distributed Wind Market Report; Technical Report; USDOE Office of Energy Efficiency and Renewable Energy: Richland, WA, USA, 2019.
- IRENA Secretariat. Renewable Energy Technologies: Cost Analysis Series, Wind Power; Technical Report; International Renewable Energy Agency (IRENA): Abu Dhabi, UAE, 2012. [Google Scholar]
- Tangler, J.L.; Somers, D.M. NREL Airfoil Families for HAWTs; Technical Report; National Renewable Energy Laboratory: Golden, CO, USA, 1995.
- Somers, D.M. The S825 and S826 Airfoils; Technical Report; National Renewable Energy Laboratory: Golden, CO, USA, 2005.
- Somers, D.M. The S822 and S823 Airfoils; Technical Report; National Renewable Energy Laboratory: Golden, CO, USA, 2005.
- Somers, D.M. The S833, S834, and S835 Airfoils; Technical Report; National Renewable Energy Laboratory: Golden, CO, USA, 2005. [CrossRef]
- Giguère, P.; Selig, M.S. New airfoils for small horizontal axis wind turbines. J. Sol. Energy Eng. Trans. ASME 1998, 120, 108–114. [Google Scholar] [CrossRef]
- Tangler, J. The Evolution of Rotor and Blade Design; Technical Report; National Renewable Energy Lab.: Golden, CO, USA, 2000.
- Lissaman, P.B.S. Low-reynolds-number airfoils. Annu. Rev. Fluid Mech. 1983, 15, 223–239. [Google Scholar] [CrossRef]
- Selig, M.; McGranahan, B. Wind tunnel aerodynamic tests of six airfoils for use on small wind turbines. In Proceedings of the 42nd AIAA Aerospace Sciences Meeting and Exhibit, Reno, NV, USA, 5–8 January 2004; p. 1188. [Google Scholar]
- Selig, M.S.; Guglielmo, J.; Broeren, A.; Guigère, P. Summary of Low-Speed Airfoil Data Vol. 1; SoarTech Publications: Virginia Beach, WV, USA, 1995. [Google Scholar]
- Selig, M.S.; Lyon, C.A.; Giguere, P.; Ninham, C.P.; Guglielmo, J.J. Summary of Low-Speed Airfoil Data Vol. 2; SoarTech Publications: Virginia Beach, WV, USA, 1996. [Google Scholar]
- Lyon, C.A.; Broeren, A.P.; Guigère, P.; Gopalarathnam, A.; Selig, M.S. Summary of Low-Speed Airfoil Data Vol. 3; SoarTech Publications: Virginia Beach, WV, USA, 1997. [Google Scholar]
- Henriques, J.C.; Marques da Silva, F.; Estanqueiro, A.I.; Gato, L.M. Design of a new urban wind turbine airfoil using a pressure-load inverse method. Renew. Energy 2009, 34, 2728–2734. [Google Scholar] [CrossRef]
- Kim, T.; Lee, S.; Kim, H.; Lee, S. Design of low noise airfoil with high aerodynamic performance for use on small wind turbines. Sci. China Technol. Sci. 2010, 53, 75–79. [Google Scholar] [CrossRef]
- Drela, M. XFOIL: An Analysis and Design System for Low Reynolds Number Airfoils. In Low Reynolds Number Aerodynamics; Mueller, T.J., Ed.; Springer: Berlin/Heidelberg, Germany, 1989; pp. 1–12. [Google Scholar]
- Natarajan, K.; Thomas, S.; Ramachadran Bhagavathi Ammal, A. Numerical Investigation of Airfoils For Small Wind Turbine Applications. Therm. Sci. 2016, 20, S1091–S1098. [Google Scholar] [CrossRef]
- Van Treuren, K.W. Small-Scale Wind Turbine Testing in Wind Tunnels Under Low Reynolds Number Conditions. J. Energy Resour. Technol. Trans. ASME 2015, 137, 051208. [Google Scholar] [CrossRef]
- Grasso, F. Usage of numerical optimization in wind turbine airfoil design. J. Aircr. 2011, 48, 248–255. [Google Scholar] [CrossRef]
- Grasso, F. Hybrid optimization for wind turbine thick airfoils. In Proceedings of the 53rd AIAA/ASME/ASCE/AHS/ASC Structures, Structural Dynamics and Materials Conference, Honolulu, HI, USA, 23–26 April 2012; pp. 1–12. [Google Scholar]
- Benim, A.C.; Diederich, M.; Pfeiffelmann, B. Aerodynamic optimization of airfoil profiles for small horizontal axis wind turbines. Computation 2018, 6, 34. [Google Scholar] [CrossRef]
- Ram, K.R.; Lal, S.; Rafiuddin Ahmed, M. Low Reynolds number airfoil optimization for wind turbine applications using genetic algorithm. J. Renew. Sustain. Energy 2013, 5. [Google Scholar] [CrossRef]
- Wata, J.; Faizal, M.; Talu, B.; Vanawalu, L.; Sotia, P.; Ahmed, M.R. Studies on a low Reynolds number airfoil for small wind turbine applications. Sci. China Technol. Sci. 2011, 54, 1684–1688. [Google Scholar] [CrossRef]
- Singh, R.K.; Ahmed, M.R.; Zullah, M.A.; Lee, Y.H. Design of a low Reynolds number airfoil for small horizontal axis wind turbines. Renew. Energy 2012, 42, 66–76. [Google Scholar] [CrossRef]
- Hall, D.R. Airfoil Designs for a Small and Large Horizontal Axis Wind Turbine. In Proceedings of the 53rd AIAA Aerospace Sciences Meeting, Kissimmee, FL, USA, 5–9 January 2015; p. 1034. [Google Scholar]
- Chillon, S.; Uriarte-Uriarte, A.; Aramendia, I.; Martínez-Filgueira, P.; Fernandez-Gamiz, U.; Ibarra-Udaeta, I. jBAY Modeling of Vane-Type Vortex Generators and Study on Airfoil Aerodynamic Performance. Energies 2020, 13, 2423. [Google Scholar] [CrossRef]
- Hutchinson, J.; Schubel, P.; Warrior, N. A cost and performance comparison of LRTM and VI for the manufacture of large scale wind turbine blades. Renew. Energy 2011, 36, 866–871. [Google Scholar] [CrossRef]
- Melendez-Vega, P.A.; Venkataramanan, G.; Ludois, D.; Reed, J. Low-Cost Light-Weight Quick-Manufacturable Blades for Human-Scale Wind Turbines. In Proceedings of the 2011 IEEE Global Humanitarian Technology Conference, Seattle, WA, USA, 30 October–1 November 2011; pp. 154–159. [Google Scholar] [CrossRef]
- Latoufis, K.; Pazios, T.; Hatziargyriou, N. Locally Manufactured Small Wind Turbines: Empowering communities for sustainable rural electrification. IEEE Electrif. Mag. 2015, 3, 68–78. [Google Scholar] [CrossRef]
- Pourrajabian, A.; Dehghan, M.; Javed, A.; Wood, D. Choosing an appropriate timber for a small wind turbine blade: A comparative study. Renew. Sustain. Energy Rev. 2019, 100, 1–8. [Google Scholar] [CrossRef]
- Clausen, P.D.; Reynal, F.; Wood, D.H.; Reynal, F.; Wood, D.H. Design, manufacture and testing of small wind turbine blades. In Advances in Wind Turbine Blade Design and Materials; Elsevier: Cambridge, UK, 2013; pp. 413–431. [Google Scholar] [CrossRef]
- Latoufis, K.; Riziotis, V.; Voutsinas, S.; Hatziargyriou, N. Effects of Leading Edge Erosion on the Power Performance and Acoustic Noise Emissions of Locally Manufactured Small Wind Turbine Blades. J. Phys. Conf. Ser. 2019, 1222, 012010. [Google Scholar] [CrossRef]
- Wood, D. Small Wind Turbines. In Green Energy and Technology; Springer: London, UK, 2011. [Google Scholar] [CrossRef]
- Mishnaevsky, L.; Branner, K.; Petersen, H.N.; Beauson, J.; McGugan, M.; Sørensen, B.F.; Mishnaevsky, L., Jr.; Branner, K.; Petersen, H.N.; Beauson, J.; et al. Materials for wind turbine blades: An overview. Materials 2017, 10, 1285. [Google Scholar] [CrossRef] [PubMed]
- Sharma, S.; Wetzel, K.K. Process Development Issues of Glass—Carbon Hybrid-reinforced Polymer Composite Wind Turbine Blades. J. Compos. Mater. 2010, 44, 437–456. [Google Scholar] [CrossRef]
- Lawrence, J.M.; Neacsu, V.; Advani, S.G. Modeling the impact of capillary pressure and air entrapment on fiber tow saturation during resin infusion in LCM. Compos. Part A Appl. Sci. Manuf. 2009, 40, 1053–1064. [Google Scholar] [CrossRef]
- van Oosterom, S.; Allen, T.; Battley, M.; Bickerton, S. An objective comparison of common vacuum assisted resin infusion processes. Compos. Part A Appl. Sci. Manuf. 2019, 125, 105528. [Google Scholar] [CrossRef]
- Patiño, I.D.; Power, H.; Nieto-Londoño, C.; Flórez, W.F. Stokes—Brinkman formulation for prediction of void formation in dual-scale fibrous reinforcements: A BEM/DR-BEM simulation. Comput. Mech. 2017, 59, 555–577. [Google Scholar] [CrossRef]
- Patiño Arcila, I.; Power, H.; Nieto-Londoño, C.; Flórez Escobar, W. Boundary Element Method for the dynamic evolution of intra-tow voids in dual-scale fibrous reinforcements using a Stokes–Darcy formulation. Eng. Anal. Bound. Elem. 2018, 87, 133–152. [Google Scholar] [CrossRef]
- Herrera, C.; Sierra-Pérez, J.; Nieto-Londoño, C. Analytical determination of viscous permeability of hybrid fibrous reinforcements. Int. J. Thermofluids 2020, 7–8, 100042. [Google Scholar] [CrossRef]
- Correa-Álvarez, M.; Villada-Quiceno, V.; Sierra-Pérez, J.; García-Navarro, J.G.; Nieto-Londoño, C. Structural design of carbon/epoxy bio-inspired wind turbine blade using fluid/structure simulation. Int. J. Energy Res. 2016, 40, 1832–1845. [Google Scholar] [CrossRef]
- Herrera, C.; Correa, M.; Villada, V.; Vanegas, J.; García, J.; Nieto-Londoño, C.; Sierra-Pérez, J. Structural design and manufacturing process of a low scale bio-inspired wind turbine blades. Compos. Struct. 2019, 208, 1–12. [Google Scholar] [CrossRef]
- Kaminski, M.; Loth, E.; Griffith, D.T.; Qin, C.C. Ground testing of a 1additively-manufactured wind turbine blade with bio-inspired structural design. Renew. Energy 2020, 148, 639–650. [Google Scholar] [CrossRef]
- Ikeda, T.; Tanaka, H.; Yoshimura, R.; Noda, R.; Fujii, T.; Liu, H. A robust biomimetic blade design for micro wind turbines. Renew. Energy 2018, 125, 155–165. [Google Scholar] [CrossRef]
- Ng, B.; New, T.; Palacios, R. Bio-Inspired Leading-Edge Tubercles to Improve Fatigue Life in Horizontal Axis Wind Turbine Blades; American Institute of Aeronautics and Astronautics Inc., AIAA: Grapevine, TX, USA, 2017. [Google Scholar] [CrossRef]
- Seidel, C.; Jayaram, S.; Kunkel, L.; Mackowski, A. Structural analysis of biologically inspired small wind turbine blades. Int. J. Mech. Mater. Eng. 2017, 12. [Google Scholar] [CrossRef]
- Cognet, V.; Courrech du Pont, S.; Thiria, B. Material optimization of flexible blades for wind turbines. Renew. Energy 2020, 160, 1373–1384. [Google Scholar] [CrossRef]
- Watson, S.; Moro, A.; Reis, V.; Baniotopoulos, C.; Barth, S.; Bartoli, G.; Bauer, F.; Boelman, E.; Bosse, D.; Cherubini, A.; et al. Future emerging technologies in the wind power sector: A European perspective. Renew. Sustain. Energy Rev. 2019, 113, 109270. [Google Scholar] [CrossRef]
- Sessarego, M.; Wood, D. Multi-dimensional optimization of small wind turbine blades. Renew. Wind Water Sol. 2015, 2, 9. [Google Scholar] [CrossRef]
- Poole, S.; Phillips, R. Rapid prototyping of small wind turbine blades using additive manufacturing. In Proceedings of the 2015 Pattern Recognition Association of South Africa and Robotics and Mechatronics International Conference (PRASA-RobMech), Port Elizabeth, South Africa, 26–27 November 2015; pp. 189–194. [Google Scholar] [CrossRef]
- Chaudhary, M.; Prakash, S. Design and fabrication of small horizontal axis wind turbine rotors at low reynolds number. Int. J. Innov. Technol. Explor. Eng. 2019, 8, 4454–4463. [Google Scholar] [CrossRef]
- Rahimizadeh, A.; Kalman, J.; Fayazbakhsh, K.; Lessard, L. Recycling of fiberglass wind turbine blades into reinforced filaments for use in Additive Manufacturing. Compos. Part B Eng. 2019, 175. [Google Scholar] [CrossRef]
- Shah, D.U.; Schubel, P.J.; Clifford, M.J. Can flax replace E-glass in structural composites? A small wind turbine blade case study. Compos. Part B Eng. 2013, 52, 172–181. [Google Scholar] [CrossRef]
- Sant, T.; Farrugia, R.N.; Muscat, M.; Caruana, C.; Axisa, R.; Borg, A.; Cassar, C.M.; Cassar, J.; Cordina, C.; Farrugia, A.; et al. Development and performance testing of a small, multi-bladed wind turbine. Wind Eng. 2019. [Google Scholar] [CrossRef]
- Bostan, V.; Bostan, I.; Dulgheru, V.; Sobor, I.; Vaculenco, M.; Odainai, V.; Gladis, V. Study of the aerodynamics of wind rotors with horizontal axis: Design, manufacture, testing. In Proceedings of the 2017 International Conference on Electromechanical and Power Systems (SIELMEN), Iasi, Romania, 11–13 October 2017; pp. 308–314. [Google Scholar] [CrossRef]
- Kam, T.Y. Design and Fabrication of Composite Wind Blades for a 5kW Wind Power System. In ASME International Mechanical Engineering Congress and Exposition; American Society of Mechanical Engineers: New York, NY, USA, 2012; Volume 3, pp. 513–518. [Google Scholar] [CrossRef]
- Xie, W.; Zeng, P.; Lei, L. A novel folding blade of wind turbine rotor for effective power control. Energy Convers. Manag. 2015, 101, 52–65. [Google Scholar] [CrossRef]
- Xie, W.; Zeng, P.; Lei, L. Wind tunnel experiments for innovative pitch regulated blade of horizontal axis wind turbine. Energy 2015, 91, 1070–1080. [Google Scholar] [CrossRef]
- Hatami, A.; Moetakef-Imani, B. Innovative adaptive pitch control for small wind turbine fatigue load reduction. Mechatronics 2016, 40, 137–145. [Google Scholar] [CrossRef]
- Rocha, P.C.; de Araujo, J.C.; Lima, R.P.; da Silva, M.V.; Albiero, D.; de Andrade, C.; Carneiro, F. The effects of blade pitch angle on the performance of small-scale wind turbine in urban environments. Energy 2018, 148, 169–178. [Google Scholar] [CrossRef]
- Mohammadi, E.; Fadaeinedjad, R.; Naji, H.R. Flicker emission, voltage fluctuations, and mechanical loads for small-scale stall- and yaw-controlled wind turbines. Energy Convers. Manag. 2018, 165, 567–577. [Google Scholar] [CrossRef]
- Civelek, Z. Optimization of fuzzy logic (Takagi-Sugeno) blade pitch angle controller in wind turbines by genetic algorithm. Eng. Sci. Technol. Int. J. 2019. [Google Scholar] [CrossRef]
- Khaled, M.; Ibrahim, M.M.; Hamed, H.E.A.; AbdelGwad, A.F. Investigation of a small Horizontal–Axis wind turbine performance with and without winglet. Energy 2019, 187, 115921. [Google Scholar] [CrossRef]
- Venkaiah, P.; Sarkar, B.K. Hydraulically actuated horizontal axis wind turbine pitch control by model free adaptive controller. Renew. Energy 2020, 147, 55–68. [Google Scholar] [CrossRef]
- Siavash, N.K.; Najafi, G.; Hashjin, T.T.; Ghobadian, B.; Mahmoodi, E. An innovative variable shroud for micro wind turbines. Renew. Energy 2020, 145, 1061–1072. [Google Scholar] [CrossRef]
- Jukes, T.N. Smart control of a horizontal axis wind turbine using dielectric barrier discharge plasma actuators. Renew. Energy 2015, 80, 644–654. [Google Scholar] [CrossRef]
- Maheri, A.; Noroozi, S.; Toomer, C.; Vinney, J. A simple algorithm to modify an ordinary wind turbine blade to an adaptive one. In Proceedings of the European Wind Energy Conference, Athens, Greece, 27 February–2 March 2006; Volume 2, pp. 1195–1202. [Google Scholar]
- Nicholls-Lee, R.F.; Turnock, S.R. Enhancing performance of a horizontal axis tidal turbine using adaptive blades. In Proceedings of the OCEANS 2007-Europe, Aberdeen, Scotland, 18–21 June 2007. [Google Scholar] [CrossRef]
- Barr, S.M.; Jaworski, J.W. Optimization of tow-steered composite wind turbine blades for static aeroelastic performance. Renew. Energy 2019, 139, 859–872. [Google Scholar] [CrossRef]
- Capuzzi, M.; Pirrera, A.; Weaver, P.M. A novel adaptive blade concept for large-scale wind turbines. Part I: Aeroelastic behaviour. Energy 2014, 73, 15–24. [Google Scholar] [CrossRef]
- Capuzzi, M.; Pirrera, A.; Weaver, P.M. A novel adaptive blade concept for large-scale wind turbines. Part II: Structural design and power performance. Energy 2014, 73, 25–32. [Google Scholar] [CrossRef]
- Capuzzi, M.; Pirrera, A.; Weaver, P.M. Structural design of a novel aeroelastically tailored wind turbine blade. Thin-Walled Struct. 2015, 95, 7–15. [Google Scholar] [CrossRef]
- Zahle, F.; Tibaldi, C.; Pavese, C.; McWilliam, M.K.; Blasques, J.; Hansen, M.H. Design of an Aeroelastically Tailored 10 MW Wind Turbine Rotor. J. Phys. Conf. Ser. 2016, 753. [Google Scholar] [CrossRef]
- Restrepo-Montoya, D.; Alvarez-Montoya, J.; Sierra-Pérez, J.; Nieto-Londoño, C. Artificial Intelligence Metamodeling Approach to Design Smart Composite Laminates with Bend-Twist Coupling. In Proceedings of the 2019 IEEE 2nd International Conference on Renewable Energy and Power Engineering (REPE), Toronto, ON, Canada, 2–4 November 2019; pp. 155–159. [Google Scholar]
- Herath, M.T.; Lee, A.K.L.; Prusty, B.G. Design of shape-adaptive wind turbine blades using Differential Stiffness Bend-Twist coupling. Ocean Eng. 2015, 95, 157–165. [Google Scholar] [CrossRef]
- Maheri, A.; Noroozi, S.; Vinney, J. Application of combined analytical/FEA coupled aero-structure simulation in design of wind turbine adaptive blades. Renew. Energy 2007, 32, 2011–2018. [Google Scholar] [CrossRef]
- Vesel, R.W.; McNamara, J.J. Performance enhancement and load reduction of a 5MW wind turbine blade. Renew. Energy 2014, 66, 391–401. [Google Scholar] [CrossRef]
- Scott, S.; Capuzzi, M.; Langston, D.; Bossanyi, E.; McCann, G.; Weaver, P.M.; Pirrera, A. Effects of aeroelastic tailoring on performance characteristics of wind turbine systems. Renew. Energy 2017, 114, 887–903. [Google Scholar] [CrossRef]
- Bianchini, A.; Ferrara, G.; Ferrari, L. Pitch Optimization in Small-size Darrieus Wind Turbines. Energy Procedia 2015, 81, 122–132. [Google Scholar] [CrossRef]
- Abdalrahman, G.; Melek, W.; Lien, F.S. Pitch angle control for a small-scale Darrieus vertical axis wind turbine with straight blades (H-Type VAWT). Renew. Energy 2017, 114, 1353–1362. [Google Scholar] [CrossRef]
- Sagharichi, A.; Ghaghelestani, T.N.; Toudarbari, S. Impact of harmonic pitch functions on performance of Darrieus wind turbine. J. Clean. Prod. 2019, 241, 118310. [Google Scholar] [CrossRef]
- de Boer, H.S.H.S.; van Vuuren, D.D.P. Representation of variable renewable energy sources in TIMER, an aggregated energy system simulation model. Energy Econ. 2017, 64, 600–611. [Google Scholar] [CrossRef]
- Abbes, D.; Martinez, A.; Champenois, G. Life cycle cost, embodied energy and loss of power supply probability for the optimal design of hybrid power systems. Math. Comput. Simul. 2014, 98, 46–62. [Google Scholar] [CrossRef]
- Impram, S.; Varbak Nese, S.; Oral, B. Challenges of renewable energy penetration on power system flexibility: A survey. Energy Strategy Rev. 2020, 31, 100539. [Google Scholar] [CrossRef]
- Paredes, J.R.; Ramírez, J.J. Variable Renewable Energies and Their Contribution to Energy Security: Complementarity in Colombia; Banco Interamericano de Desarrollo: Washington, DC, USA, 2017; p. 59. [Google Scholar]
- Bhandari, B.; Poudel, S.R.; Lee, K.T.; Ahn, S.H. Mathematical modeling of hybrid renewable energy system: A review on small hydro-solar-wind power generation. Int. J. Precis. Eng. Manuf. Green Technol. 2014, 1, 157–173. [Google Scholar] [CrossRef]
- Koutroulis, E.; Kolokotsa, D.; Potirakis, A.; Kalaitzakis, K. Methodology for optimal sizing of stand-alone photovoltaic/wind-generator systems using genetic algorithms. Sol. Energy 2006, 80, 1072–1088. [Google Scholar] [CrossRef]
- Lehtola, T.; Zahedi, A. Solar energy and wind power supply supported by storage technology: A review. Sustain. Energy Technol. Assess. 2019, 35, 25–31. [Google Scholar] [CrossRef]
- Huu, D.N. An innovative adaptive droop control based on available energy for dc micro distribution grids y. Energies 2020, 13, 2983. [Google Scholar] [CrossRef]
- Mahesh, A.; Sandhu, K.S. Hybrid wind/photovoltaic energy system developments: Critical review and findings. Renew. Sustain. Energy Rev. 2015, 52, 1135–1147. [Google Scholar] [CrossRef]
- Shivarama Krishna, K.; Sathish Kumar, K. A review on hybrid renewable energy systems. Renew. Sustain. Energy Rev. 2015, 52, 907–916. [Google Scholar] [CrossRef]
- Chauhan, A.; Saini, R.P. A review on Integrated Renewable Energy System based power generation for stand-alone applications: Configurations, storage options, sizing methodologies and control. Renew. Sustain. Energy Rev. 2014, 38, 99–120. [Google Scholar] [CrossRef]
- Siddaiah, R.; Saini, R.P. A review on planning, configurations, modeling and optimization techniques of hybrid renewable energy systems for off grid applications. Renew. Sustain. Energy Rev. 2016, 58, 376–396. [Google Scholar] [CrossRef]
- Tezer, T.; Yaman, R.; Yaman, G. Evaluation of approaches used for optimization of stand-alone hybrid renewable energy systems. Renew. Sustain. Energy Rev. 2017, 73, 840–853. [Google Scholar] [CrossRef]
- Kajela, D.; Manshahia, M.S. Optimization of Renewable Energy Systems: A Review. Int. J. Sci. Res. Sci. Technol. 2017, 3, 769–794. [Google Scholar] [CrossRef]
- Chaib, A.; Achour, D.; Kesraoui, M. Control of a Solar PV/wind Hybrid Energy System. Energy Procedia 2016, 95, 89–97. [Google Scholar] [CrossRef]
- Sinha, S.; Chandel, S.S. Review of recent trends in optimization techniques for solar photovoltaic-wind based hybrid energy systems. Renew. Sustain. Energy Rev. 2015, 50, 755–769. [Google Scholar] [CrossRef]
- Khare, V.; Nema, S.; Baredar, P. Solar-wind hybrid renewable energy system: A review. Renew. Sustain. Energy Rev. 2016, 58, 23–33. [Google Scholar] [CrossRef]
- Al-falahi, M.D.; Jayasinghe, S.D.; Enshaei, H. A review on recent size optimization methodologies for standalone solar and wind hybrid renewable energy system. Energy Convers. Manag. 2017, 143, 252–274. [Google Scholar] [CrossRef]
- Maleki, A.; Pourfayaz, F. Optimal sizing of autonomous hybrid photovoltaic/wind/battery power system with LPSP technology by using evolutionary algorithms. Sol. Energy 2015, 115, 471–483. [Google Scholar] [CrossRef]
- Mayer, M.J.; Szilágyi, A.; Gróf, G. Environmental and economic multi-objective optimization of a household level hybrid renewable energy system by genetic algorithm. Appl. Energy 2020, 269, 115058. [Google Scholar] [CrossRef]
- Erich, H. Wind Turbines: Fundamentals, Technologies, Application, Economics; Springer: Berlin/Heidelberg, Germany, 2006. [Google Scholar]
- Abdelhady, S.; Borello, D.; Santori, S. Economic Feasibility of Small Wind Turbines for Domestic Consumers in Egypt Based on the New Feed-in Tariff. Energy Procedia 2015, 75, 664–670. [Google Scholar] [CrossRef]
- Rodriguez-Hernandez, O.; Martinez, M.; Lopez-Villalobos, C.; Garcia, H.; Campos-Amezcua, R. Techno-economic feasibility study of small wind turbines in the Valley of Mexico metropolitan area. Energies 2019, 12, 890. [Google Scholar] [CrossRef]
- Orrell, A.; Foster, N.; Morris, S.; Homer, J. 2016 Distributed Wind Market Report; Technical Report; Pacific Northwest National Lab. (PNNL): Richland, WA, USA, 2017.
- Pitteloud, J.D.; Gsänger, S. 2016 Small Wind World Report; Technical Report; Pacific Northwest National Lab. (PNNL): Richland, WA, USA, 2016.
- Small Wind Certification Council. Xzeres Skystream 3.7 SWCC Summary Report; Technical Report; Small Wind Certification Council: Brea, CA, USA, 2019. [Google Scholar]
- Xzeres. Xzeres SKYSTREAM 3.7 Turbine Specifications. Available online: https://www.xzeres.com (accessed on 15 October 2020).
- Small Wind Certification Council. Kingspan KW6 SWCC Summary Report; Technical Report; Small Wind Certification Council: Brea, CA, USA, 2014. [Google Scholar]
- Small Wind Certification Council. Endurance S-343 SWCC Summary Report; Technical Report; Small Wind Certification Council: Brea, CA, USA, 2014. [Google Scholar]
- ENAIR. Aerogenerador ENAIR 200: E200 Manual. Available online: https://www.enair.es/es/aerogeneradores/e200 (accessed on 15 October 2020).
- Bergey. Excel 10 Spec Sheet. Available online: http://www.bergey.com/products/grid-tied-turbines/excel-10/ (accessed on 15 October 2020).
- Wang, C.N.; Tibo, H.; Duong, D.H. Renewable Energy Utilization Analysis of Highly and Newly Industrialized Countries Using an Undesirable Output Model. Energies 2020, 13, 2629. [Google Scholar] [CrossRef]


| Terrain Type | |
|---|---|
| Cities, forests | 0.7 |
| Suburbs, wooded countryside | 0.3 |
| Villages, country with trees | 0.1 |
| Open farmland, few trees and buildings | 0.03 |
| Flat grassy planes | 0.01 |
| Flat desert, rough seas | 0.01 |
| Terrain Type | |
|---|---|
| Calm sea | 0.09 |
| Agricultural area—limited presence of obstacles less than 6 m high | 0.12 |
| Agricultural area—limited presence of obstacles between 6 m and 8 m high | 0.16 |
| Agricultural area—a lot of presence of obstacles between 6 m and 8 m high | 0.20 |
| Urban or forest area | 0.30 |
| Terrain Morphology | k |
|---|---|
| Mountainous area | 1.2–1.7 |
| Great plains—Hills | 1.8–2.5 |
| Open area | 2.5–3.0 |
| coastal zone | 3.1–3.5 |
| Islands | 3.5–4.0 |
| SWT Class | I | II | III | IV |
|---|---|---|---|---|
| [m/s] | 50 | 42.5 | 37.5 | 30 |
| [m/s] | 10 | 8.5 | 7.5 | 6 |
| 0.18 | 0.18 | 0.18 | 0.18 | |
| a | 2 | 2 | 2 | 2 |
| Designation | Characteristics | Source | |||||
|---|---|---|---|---|---|---|---|
| S822 | 16% | 50.2–87.0 | 1.00–0.78 | 1.06–1.45 | 100,000–500,000 | Tip-dedicated, smooth stall. | [76] |
| S823 | 21.2% | 75.6 | 1.03 | 1.23 | 500,000 | Root-dedicated, smooth stall. | [76,78] |
| S833 | 18% | - | - | 1.10 | 400,000 | Quiet, primary airfoil, smooth stall. | [79] |
| S834 | 15% | 78.8 | 0.75 | 1.12 | 500,000 | Quiet, tip-dedicated, smooth stall. | [79,83] |
| S835 | 21% | - | - | 1.20 | 250,000 | Quiet, root-dedicated, smooth stall. | [79] |
| SG6040 | 16% | 46.0–86.6 | 1.16–1.13 | 1.29–1.49 | 100,000–500,000 | Insensitive to L.E. roughness. | [80] |
| SG6041 | 10% | 51.5–84.4 | 0.86–0.61 | 1.15–1.36 | 100,000–500,000 | Insensitive to L.E. roughness. | [80] |
| SG6042 | 10% | 55.6–105.9 | 1.10–0.84 | 1.35–1.52 | 100,000–500,000 | Insensitive to L.E. roughness. | [80] |
| SG6043 | 10% | 59.4–125.1 | 1.37–1.10 | 1.52–1.70 | 100,000–500,000 | Insensitive to L.E. roughness. | [80] |
| E387 | 9.1% | 57–117 | 1.16–1.22 | 1.20–1.27 | 100,000–500,000 | Roughness Stall-insensitive. | [83,86] |
| T.Urban 10/193 | 17% | 18 | 1.44 | 1.76 | 60,000 | High lift, soft stall. | [87] |
| NACA 63-421 | 17.3% | 93 | 0.8 | 1.22 | 1,020,000 | Improved L/D, Reduced noise. | [88] |
| AF300 | 14% | 14.7–30.0 | 0.41–1.38 | 1.06–1.85 | 38,000–250,000 | Delayed flow separation | [97] |
| USPT2 | 10% | 72 | 1.2 | 1.72 | 200,000 | Soft stall & soiling insensitive. | [95] |
| WTS 1 | 17.95% | 112.79 | 1.28 | 1.42 | 750,000 | Designed as a root airfoil. | [98] |
| WTS 2 | 17.95% | 119.95 | 1.28 | 1.38 | 1,000,000 | Designed as a primary airfoil. | [98] |
| WTS 3 | 18.13% | 115.69 | 1.25 | 1.26 | 1,000,000 | Designed as a tip airfoil. | [98] |
| Mid321a | 8% | 35–82 | - | - | 50,000–250,000 | Acceptable performance at small . | [90] |
| Mid321b | 9.5% | 35–83 | - | - | 50,000–250,000 | Acceptable performance at small . | [90] |
| Mid321c | 10% | 30–84 | - | - | 50,000–250,000 | Acceptable performance at small . | [90] |
| Mid321d | 15% | 76 | - | - | 250,000 | Best performance at high . | [90] |
| Mid321e | 15% | 80 | - | - | 250,000 | Best performance at high . | [90] |
| Blade Length (m) | Blade Weight (kg) | Material | Manufacturing Process | Source |
|---|---|---|---|---|
| NR | 5.5 | E-glass/Polyester | NR | [127] |
| 0.24 | 4.8 | ABS | 3D printing | [124] |
| 1.9 | NR | Carbon fiber/Epoxy | VARI | [115] |
| 9.6 | NR | Composite materials | NR | [128] |
| 3.5 | NR | Flax/Polyester | LRTM | [126] |
| 3.5 | NR | E-glass/Polyester | LRTM | [126] |
| 2.5 | 7.8 | Glass fiber/Epoxy | Hand layup/vacuum bagging | [129] |
| NR | NR | PVC | NR | [101] |
| 3.2 | NR | Carbon and glass fiber | VARTM | [126] |
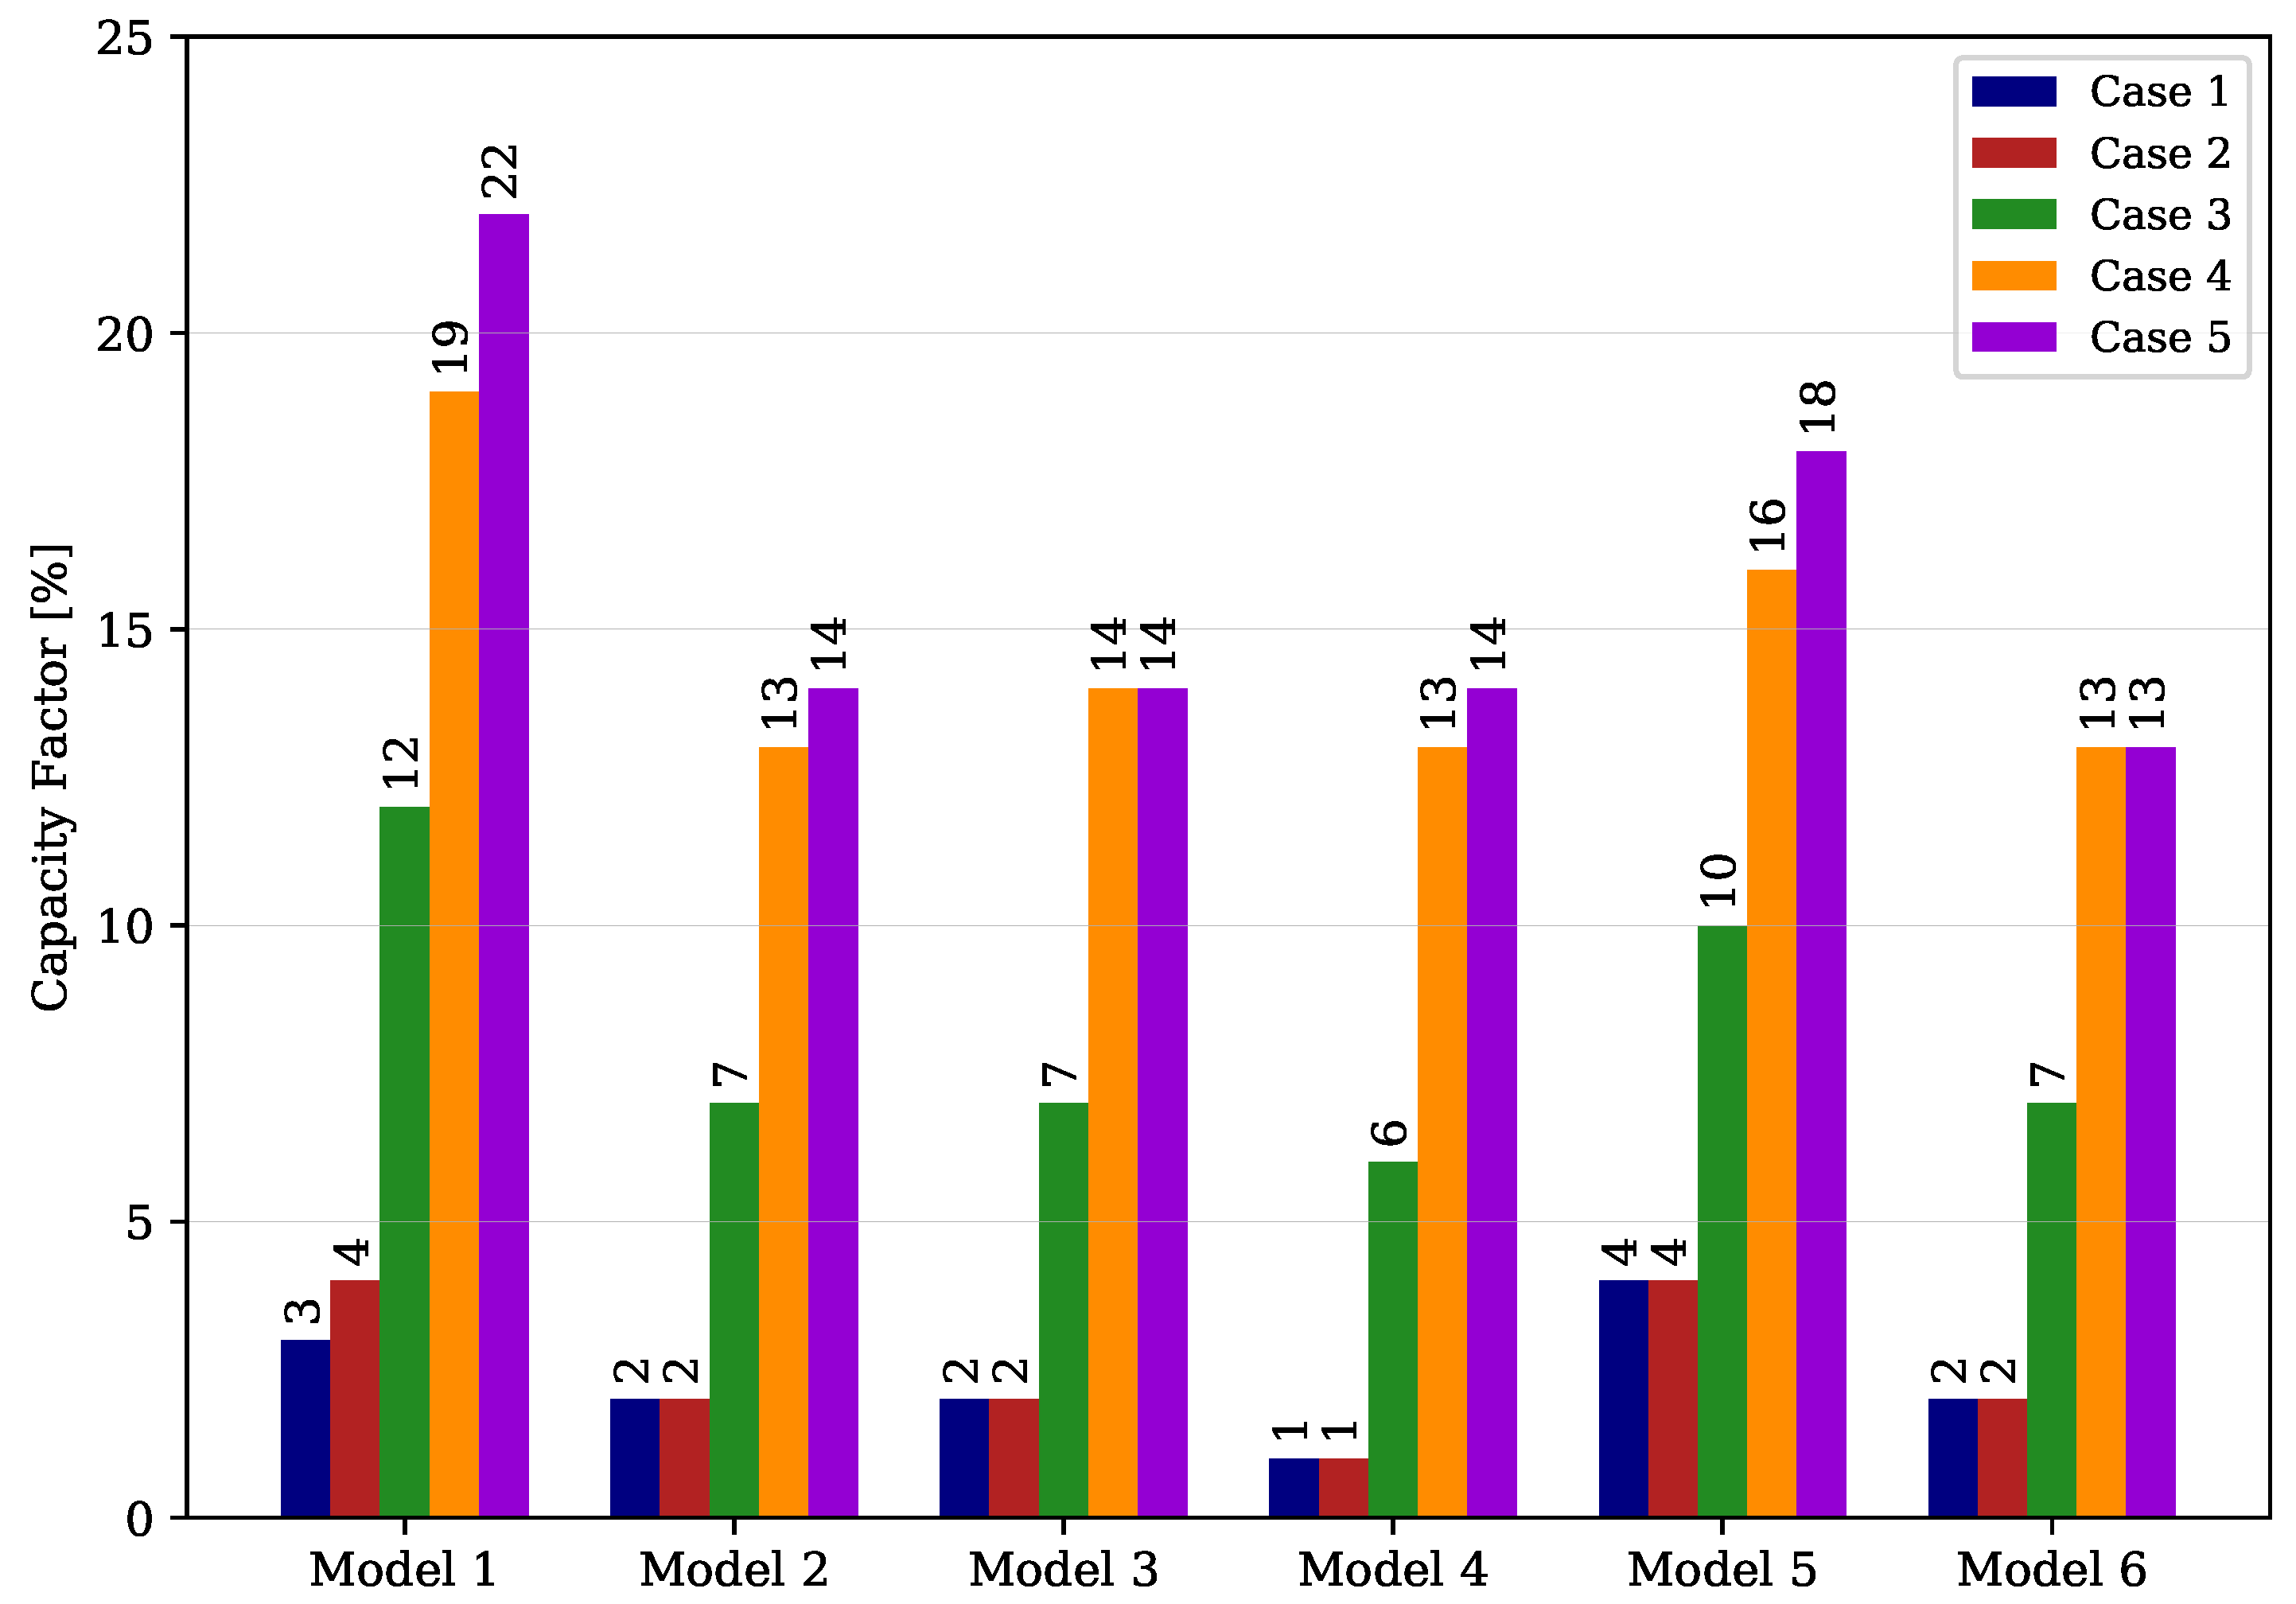
| Model | Manufacturer | Model Name | D | A | Yaw | Pitch | Brake | ||||
|---|---|---|---|---|---|---|---|---|---|---|---|
| [m] | [m2] | [kW] | [m/s] | [m/s] | [m/s] | Control | Control | Control | |||
| 1 | Latoufis et al. [102] | 2.4 m-HP | 2.4 | 4.5 | 0.53 | 10.5 | 3 | N/A | Passive | Fixed-pitch | N/A |
| 2 | Xzeres [180,181] | Skystream 3.7 | 3.7 | 10.9 | 2.1 | 11 | 3.5 | 16.5 | Passive | Fixed-pitch | Regulated rotor brake |
| 3 | Kingspan [182] | KW6 | 5.5 | 23.7 | 5.2 | 11 | 3.5 | N/A | Passive | Fixed-pitch | Over-speed protection |
| 4 | Endurance [183] | S343 | 6.4 | 31.9 | 5.4 | 11 | 4.1 | 17 | Passive | Fixed-pitch stall regulated | Rotor brake |
| 5 | Enair [184] | E200 | 9.8 | 75.4 | 18.0 | 11 | 1.85 | 30 | Passive | Active | Regulated rotor brake |
| 6 | Bergey [25,185] | Excel 10 | 7.0 | 38.5 | 8.9 | 11 | 2.5 | N/A | Passive | Fixed-pitch | Over-speed protection |
Publisher’s Note: MDPI stays neutral with regard to jurisdictional claims in published maps and institutional affiliations. |
© 2020 by the authors. Licensee MDPI, Basel, Switzerland. This article is an open access article distributed under the terms and conditions of the Creative Commons Attribution (CC BY) license (http://creativecommons.org/licenses/by/4.0/).
Share and Cite
Torres-Madroñero, J.L.; Alvarez-Montoya, J.; Restrepo-Montoya, D.; Tamayo-Avendaño, J.M.; Nieto-Londoño, C.; Sierra-Pérez, J. Technological and Operational Aspects That Limit Small Wind Turbines Performance. Energies 2020, 13, 6123. https://doi.org/10.3390/en13226123
Torres-Madroñero JL, Alvarez-Montoya J, Restrepo-Montoya D, Tamayo-Avendaño JM, Nieto-Londoño C, Sierra-Pérez J. Technological and Operational Aspects That Limit Small Wind Turbines Performance. Energies. 2020; 13(22):6123. https://doi.org/10.3390/en13226123
Chicago/Turabian StyleTorres-Madroñero, José Luis, Joham Alvarez-Montoya, Daniel Restrepo-Montoya, Jorge Mario Tamayo-Avendaño, César Nieto-Londoño, and Julián Sierra-Pérez. 2020. "Technological and Operational Aspects That Limit Small Wind Turbines Performance" Energies 13, no. 22: 6123. https://doi.org/10.3390/en13226123
APA StyleTorres-Madroñero, J. L., Alvarez-Montoya, J., Restrepo-Montoya, D., Tamayo-Avendaño, J. M., Nieto-Londoño, C., & Sierra-Pérez, J. (2020). Technological and Operational Aspects That Limit Small Wind Turbines Performance. Energies, 13(22), 6123. https://doi.org/10.3390/en13226123