1. Introduction
Accompanied and correlated by other crises (such as the demographic crisis, the economic-financial crisis, the cultural-spiritual crisis, and other crises more or less circumscribed or derived), the two major crises in the firmament—the resource crisis and global warming—generating climate catastrophes with great human and economic losses have affected absolutely all areas of social and economic life, causing society to begin a transition to another major stage of culture and civilization.
Today, from a political, moral, and cultural point of view, traditional civilization is still groping for viable solutions, with the evolutionary steps recorded being small and often random and even contradictory. The hope of the most conscious and responsible people that only the self-sacrifice of “missionaries of sustainability” and broad programs of sustainable development will succeed in “rekindling the light at the end of the tunnel” proved to be an ineffective approach. It thus becomes clear that all of mankind must participate in the acceleration of the digital revolution, in all possible fields, just as it is equally obvious that everyone must fight, as diligently as possible, for the implementation of sound ethical principles that will enable greater efficiency of sustainable transition.
The idea of a safer world means nothing more than building a world safer from natural disasters and social disasters (those disruptions that often require radical and even extreme measures to resolve fundamental crises).
Scientific research anticipated, more than half a century ago, these new contemporary crises [
1] and, through the available political levers, managed, to some extent, to impose several approaches and solutions, worldwide: publication of the Brundtland Commission’s “Our Common Future” Report (1987) [
2], the conclusion of several global conventions—at the UN Conference in Rio (1992) [
3], the legislation on clear CO
2 reduction targets—at the Kyoto Protocol (1997) [
4], the Declaration on Sustainable Development—at the Johannesburg Summit (2002) [
5], and the adoption of radical new measures to reduce global warming—at the UN Conference in Bonn (2017) [
6], to mention only the most important approaches of a richer series.
Unfortunately, many countries have not consented to global programs for the sustainable rationalization of resources and rehabilitation of the natural environment, and in many countries that have ratified appropriate programs, the practice of environmental remediation has not complied with planned or anticipated business plans. Therefore, it can be considered that humanity is still in the first phase of the transitional process towards the new major stage of culture and civilization.
Now that the greatest drama of the present is the degradation of the natural environment (through irrational exploitation and pollution), through increased urban traffic—which in turn generates climate change due to global warming (leading to ecological and climatic catastrophes resulting in great human and economic losses)—the most important concepts of the recovery of the “human–nature” balance were first focused on reducing the ecological footprint, especially on reducing carbon dioxide emissions [
7]. The general increased mobility has a negative impact on the environment. Even the upsizing of cars has a significant negative impact on environmental sustainability, due to the fact that big cars need more natural resources for their production and also generate more CO
2 emissions. Toxic emissions and the air pollution due to increased mobility are responsible for the deterioration of the public health of citizens [
8].
Among the proposed “revolutionary” programs in the transition to a world more responsible for its own destiny is the case of the mobility of people and goods.
From a technical point of view, (as a technology and management of all socio-economic activities) the digital solution—implemented for over three decades—is already fully accredited. In this context, the new world of digital life appears as a dense overcrowded system, which unites people, high-performance machines, and abundant data in a network of great complexity and finesse [
9]. In the new digital context, artificial intelligence systems surpass even humans, especially in translations from one language to another, in the recognition of faces or imitation of speech and have to play a more important role for the transition to a more sustainable environment. In this context, autonomous vehicles will increase, in a significant way, environmental sustainability if the self-driving technology is correlated with the proliferation of electrical cars. This will reduce the GHG emission and also the carbon footprint due to reduced mechanical systems. Therefore, such technologies promote sustainability through the full life of cars, not only in the operation phase.
However, the sustainable solutions put in place by the “2020 benchmark” have not been sufficient to reduce environmental pollution and its consequences on projected values, no matter how encouraging some one-off or regional results have been.
Remarkable, however, are initiatives such as:
Development of so-called “airway streets”—especially in Latin American countries (urban cable cars in Colombia, Bolivia, Brazil, Venezuela, and Mexico);
Infrastructure development—in India, for two- and three-wheeled means of transport (bicycles, cars, tricycles);
Subsidizing rail transport—trams in China; conditioning the purchase of a new car by owning a parking space—in Tokyo (Japan);
Reserving a lane only for so-called “collective cars” (with at least two occupants) in the United States [
10];
Banning the access of cars in city centers;
Imposing consistent fees for car access in large areas of pedestrian agglomerations;
Arranging bicycle lanes and encouraging travel by this means of locomotion;
Arranging utilities (especially parking lots on the outskirts of cities) to encourage multimodal travel (“parking and walking”);
Concrete encouragement of the successive use of several people (drivers) of a car (“car sharing”) every day [
11];
Encouraging the coupling of several people’s itineraries in a single travel formula (“ride sharing”) [
12];
Automation of machines (self-drive technologies and e-cars) [
8];
Promoting new technologies of data collection for traffic, such as floating car data [
13], Bluetooth/WiFi and magnetometers [
14], or even dedicated short-range communication [
15];
Intelligent mobility management (as centralized monitoring and management of traffic).
It turns out that changing the techniques, the technologies, and the economic and social structures and mentalities of users “overnight” is too difficult to meet the issue of mobility itself and the growing needs of a world that is constantly multiplying, but also the “proud and selfish” needs of politicians or tycoons to achieve traditional economic growth at both national levels and/or at large oil and carmaker levels.
Therefore, it makes sense for most of the economy to remain engaged in the continuation of global programs to sustain economic actions (especially as production and consumption management) and political and social actions (especially as ethics of natural environment rehabilitation). This is the context of research for more effective mobility, which is also the focus of this study.
In parallel with the transition to electric and autonomous mobility and intelligent traffic management, streamlining the occupancy of cars in urban traffic is becoming increasingly important.
Thus, starting from the empirical observation that most cars in traffic are not occupied at their maximum capacity, some inspired ideas have already been put forward—mentioned, in part, also in the list of initiatives introduced above: (1) the reduction in the number of seats in cars and, accordingly, the considerable reduction in the dimensions of cars; (2) the approach of multimodal transport (travel on an itinerary with several and different means—as is the case, among others, of the “park-and-ride” system); (3) the correlation of the self-travel interests of several people and their integration in a single concomitant formula (“ride-sharing” system); (4) alternative use of a car by several people (“car sharing system”); (5) car empowerment; and (6) intelligent mobility management (as individual rationalization and efficiency of traveling and as centralized traffic monitoring and management).
Within the limits of the methodology of data collection in economic statistics, a special empirical measurement of a specific index of the concept of traffic is now proposed: the degree of occupancy of people in cars moving inside cities.
Characterized by the concomitance (or “simultaneity”) of taking data from several points of direct observation and correlating the values obtained with the results of video recordings made at the same time and at the same observation points, the proposed method will increase the methodological accuracy of data collection in economic statistics. By advancing this method, this study aims to capture the occupancy rates of peoples in urban traffic, in different cities, using a combined method.
2. Review of Specialized Literature
Systemic concerns regarding multi-faceted car traffic research date back to the 1990s, when, for example, federal law on transportation planning and policy emerged in the United States [
16]. There are still many world regions—including Europe—that have not yet formally addressed thorough research on traffic characteristics. Instead, the concerns of some transporters interested in optimizing their specific activities, of some designers interested in the particularities of the use of means of transport, and of some urban planners interested in the adequate design of some local or zonal infrastructures were more frequently signaled in this sense.
Some studies deal with the traffic occupancy rates of several types of motorized means of transport: cars, buses, coaches, trams, subways, trains, planes, and ships for lakes, rivers, and streams, or for the sea [
17].
Over time, several methods of collecting data characteristic of human and goods trafficking have been developed. Thus, for traffic volumes (number of vehicles per day passing through a given point), inductive loops detectors are used—embedded in the asphalt of roads—and to measure the speed of vehicles, either inductive loops detector batteries or speed traps (such as those used by police to measure exceeding the legal speed) are used [
18].
Regarding the research of the occupancy rate of cars in traffic, five main methods of data collection have been established—both in the literature and in scientific practice [
19,
20].
- (1)
The windshield method;
- (2)
The carousel method;
- (3)
The filming method;
- (4)
The survey method;
- (5)
The method of collecting data from road accidents.
The windshield method, although known as a traditional method, is considered the most reliable method by which data are collected for most measurements of the occupancy of cars in traffic. The windshield method involves—as the first stage of work—observing cars passing through a given point of a traffic artery and the actual counting of car occupants by an operator located on the side of the road in question. The carousel method is similar to the windshield method, except that the operator is in a moving car, in the same direction as the cars he observes. The distance of the operator from the machines in motion is smaller and therefore the accuracy of the observation is higher. However, it is necessary for the operator’s car to go slower than the observed cars, in order to take advantage of as many units as possible, but unfortunately, as has been found from the practice of this method, the operator’s car thus makes traffic difficult on the considered road segment.
The filming method involves the existence of a fixed station, located on the side of a road—just like the windshield method—from which the operator photographs/films all cars passing through that point, in the same direction. Then follows a second stage—the studio—in which the operator views all photos or videos and records in tables the data taken (as a third stage of the method). Finally, the fourth stage will add up all the observed occupants and will relate the total occupants of the cars to the total number of observed cars—to calculate the characteristic average (practically the occupancy rate of the car). Today, the video-digital technique allows, with great ease, the stopping of the frames, the unfolding, frame by frame, of the recording, and the slowing down of the projection so that the observation of the occupancy of the cars is as accurate as possible. However, the method of photographing/filming is not very appreciated by researchers, due to the laborious technical operations in the field—the installation and the security of the cameras—the assembling of the equipment at the end of the work session, and the long viewing time of the recorded material.
The survey method involves interviewing passengers—especially drivers—at appropriate places and times, directly (face to face, by phone), by correspondence (classic letters, e-mail, WhatsApp, etc.), and by consulting travel journals. The larger the sample of interviewees, the more accurate the results of a survey. Therefore, the highest efficiency of surveys is possible at the headquarters of companies or organizations, due to the large number of employees who can become immediate respondents to the survey. In any case, the interview method is considered less reliable than the methods presented above, obviously due to the subjectivity of the respondents (especially as errors of memory).
Finally, the method of collecting data from road accidents is the latest method of collecting data on the occupancy rate of cars in traffic. It requires the operator or researcher to have access to a police-managed database. In the United States, for example, since 1992, police report forms for vehicles involved in traffic accidents also contain a field in which the number of occupants of the car in question is recorded.
However, other interesting methods for collecting data used in other fields, such as “
temporal data collection” [
21], or even other visual research methods [
20] could not be efficiently applied in analyzing the car occupancy of urban traffic.
Due to this reason, the method of taking data from road accidents is the least expensive, with data collection and processing at the office being an elegant way of working. Two of the limitations of the method are the idea that the potential of an accident increases with the number of occupants of the car and that the protagonists of accidents are more often drivers who drank alcohol or young drivers (lacking a rich driving experience).
While some indicators specific to, for example, public transport such as trains, planes, and buses have been calculated by the ratio “passenger-kilometer/vehicle-kilometer” based on the percentage of seats occupied, the occupancy rate of cars has been calculated as the average number of people occupying a car in traffic (including the driver) [
21].
Regardless of the method of collecting data on the occupancy rate of cars in traffic, the most common benchmark is the average vehicle occupancy (AVO) index, which means the average number of occupants of cars observed in a single meeting/stage of work. The formula for calculating the occupancy index of cars in traffic is
in which
AVOcars = average occupancy rate of vehicles;
“r” = the rate of a record;
“R” = total number of records;
Dr = travel distance;
Npr = number of people transported;
Gr = total weight transported.
For cars, in the United States, for example, the Federal Highway Administration (FHWA) has calculated, for 2017, an AVOcars index of 1.7 [
22]. This means that the average occupancy per car was of 1.7 people. However, no information could be accessed about the observers’ station points or the routes traveled by the drivers surveyed, and on the other hand, in the opinion of the authors of this research, by invoking in the above formula variables such as car weight and driving distance travel, the AVOcars index would rather express a factor in the overall efficiency of car mobility. The weight of the car (G) would thus sum up the nominal weight of the empty car + the weight of the occupants + the weight of the luggage, and this amount would also be related to the distance (D) traveled by the observed or declared cars. Undoubtedly, the AVOcars index, calculated as such by the FHWA, provides a complex piece of very useful information for synthetic interpretations but does not express, for example, the geometric volume or the projected surface of all cars involved in traffic—which is a very important aspect for designing the infrastructure related to mobility, especially of the urban road network.
3. Problematizing the Degree of Occupancy of Cars in Traffic with People
The main objective of the research is to capture, by a combined method, indices of occupancy of people in urban traffic, in different cities and, especially, on the same calendar date and at the same time interval (respecting the official hours of each city in part). The importance of such a method lies, in particular, in generating a provocative reality of interesting and useful scientific comparisons. On the other hand, the interpretation of the indices obtained (as average numbers), in terms of the affected geometric space and in terms of equivalent or alternative urban space, is intended to be a secondary objective of this research, with particular focus on local government decision-makers. The hypothetical development of some urban projects that would capitalize the space gained from reducing car volumes would be part of the sustainable transition, obviously oriented towards a less stressful urban life for the residents and the visitors of the cities. The major premise of the present research is, therefore, that the sustainability of transport has a positive impact both on the quality of the natural environment and on the development of the urban environment. It was found that the health of citizens suffers more from high pollution in cities in which traffic congestion and superstructures related to car mobility disrupt urban social life [
16].
The problem proposed for research was generated by three realities/aspects correlated or conjugated under the sign of personal mobility efficiency by cars in the urban environment. The first reality is that most cars do not travel inside cities with almost all the seats occupied, and this aspect is perceived from an economic-sustainable point of view as energy waste. More recently, as a second unsustainable reality, the occupation of roads and parking lots with unnecessary volumes (half the volume of a car, when it carries one or two people and almost nothing in the trunk, is transported parasitically) is seen by architects as a waste of urban space [
23]. The third reality contrary to sustainable harmony concerns the overcrowding of traffic in the urban environment, like slowdowns and even as traffic jams, implicitly as additional pollution also. In addition, the overcrowding of urban traffic increases the general stress and is incompatible, moreover, with the expansion of road infrastructure (roads and parking lots) over a dysfunctional share of the total area of cities.
Therefore, energy waste (more fuel consumed unreasonably), air pollution, and space waste (more unreasonably occupied volume), as cancers of an indifferent attitude towards natural and urban environments, must be overcome not only by electrification and automation of cars, and not only by applying new modes of transport (such as multimodal transport, the integrated correlation of the interests of self-movement of several people, the alternative use of a car by several people, and the intelligent management of mobility), but through intelligent transport systems too [
24] and by redesigning cars—especially those that can be used inside cities.
As in terms of design, the emergence of “short” cars (such as “mini” and “micro”) meant real technical and entrepreneurial revolutions at the time (see the case of Micro Smart) and in the same way, it becomes obvious that against the background of the new contemporary energy and urban crises, the reconsideration of this specific reason for the redesign can only be welcomed. However, it is surprising how the concepts of mini-cars and microcars have not been adopted more by large car manufacturers and, especially, by buyers. With this idea in mind, it is significant, for example, that micro-tourism sales decreased in 2018 compared to 2017 [
25]. It is also surprising how some administrations—especially the town halls of some cities or the prefectures of some regions—although they may have introduced some bans on polluting cars or at least some environmental taxes, have not yet imposed the obligation to drive shorter cars in cities.
An interesting paradox has been consumed in Japan. Out of real needs to deal with traffic congestion in major Japanese cities, governments have encouraged—through lower taxes and fees— sales for a class of mini-car called Kei (maximum length of approximately 3.41 m, maximum width of approximately 1.49 m, and maximum height of approximately = 2.01 m), since approximately half a century ago. The Kei class has become extremely popular in Japan, but after 2010, the government considered that these cars were not relevant for export and that they hindered the creativity of major Japanese manufacturers regarding ordinary cars around the world. As a result, the government increased taxes on the Kei car class, which has obviously attracted the dissatisfaction of most users [
26,
27]. Further, it is just as surprising how the urban architects, without a doubt aware of this state of affairs, did not get involved through specific precepts to their field in a decisive way.
4. Research Methodology
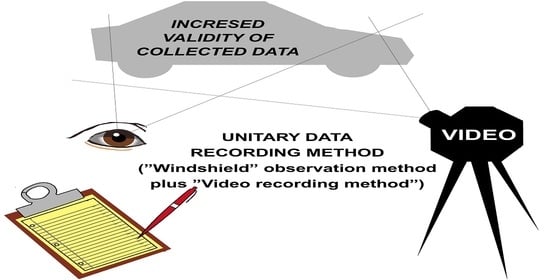
The method proposed here to collect the data needed to establish the indices of occupancy of people in urban traffic (indices characteristic to some cities) combines, in a first phase, the traditional method of windshield observation with video recording of the same sampling.
In the scientific literature, most of the experts analyzed only single methods for specific case studies. There are no standard methods of data collection that combine the local presence of observers with video technologies, which provides a more accurate calculation of efficiency related to personal mobility. Despite the focused research in car occupancy in urban traffic, this research is also important for data collection and estimation methods [
28].
However, the novelty of the method consists in the concomitant or simultaneous sampling of data at several similar points (close traffic and urban characteristics) as an X-ray likely to offer the opportunity for interesting comparisons and to give the research a unitary overview of the size of human mobility by personal cars (whether private, rented, or shared property).
The logic of doubling the observational method of the windshield with the observational method of video recording stems from the need for a verification that should increase the accuracy of the measurements. Video recording can be more accurate than direct observation, given that on video camera lenses polarizing filters can be fitted which “cut” the reflections of light falling on the windshield—thus parasitic on people’s visual perception.
The general framework of the methodology that describes the proposed combined method to establish the indices of occupancy of people in urban traffic is designed in
Figure 1.
Technically speaking, the data resulting from the video recording—which must be viewed and recorded in writing in a studio—will be compared with the data recorded analogically in the tables inscribed at the roadside and correlated—in the sense of adopting an average variant. After this phase of the method follows the calculation of the indices/degrees characteristic of each of the cities involved in the analysis.
The organization of each of the three simultaneous work sessions involves complex management. The work teams must be set up (two or three operators each—as the case may be—plus an available substitute at any time to change one of the team holders) and all material logistics must then be provided. Technical training of participating personnel and protection and safety training must be provided. It is good to foresee that authority may come at any time to verify the compliance of the action with the rules in force for work safety. Sometimes it is even advisable to obtain appropriate authorization from the bodies empowered with public order on the eve of the working meeting.
For the written registration of the data, form tables will be designed, in which acronyms or abbreviations will be used as in
Table 1.
The table form usable in the field (
Table 2) may contain only one column for each of the occupancy categories, corresponding to the windscreen method. At the same time, the already combined formula would be more useful, in which the columns corresponding to each category of occupation are specialized in the two methods that must finally be correlated.
Ideally, there should be as many observation points as possible (both within the limits of each city and as a number of similar cities in terms of traffic and urban density, in which measurements can be made). It would also be ideal to organize as many data collection sessions as possible during a year and, why not, even for several years or even permanently. However, such an undertaking would be particularly laborious and costly for individual researchers. For this reason, the method proposed here can be applied relatively narrowly for the time being, as a verification of an existing principle.
With this in mind, as an exercise in verifying the validity of the method, the authors of this article held a sampling meeting in the cities of Düsseldorf, Brussels, and Bucharest on 8 November 2017. The choice of the three cities was first due to the fact that they are characterized by a relatively close “number of cars/number of inhabitants” index, and then the fact that, for the time being (considered possible for all participants in the experiment), only in these three cities could the logistics necessary for the measurement sessions be carried out. The action involved the participation of six operators, three video cameras—with their reserves of recording media and power sources—three tripods, nine umbrellas (three for video cameras and six for operators), three folding chairs (for those who noted the values observed directly), some clip-boards, some backpacks with various other useful things (roulette, spare pens, sandwich packs, bottles of drinking water, etc.), etc. The six protagonists of the experiment were finally seven, given that one of the six “holders” could not afford to stay more than seven hours in the cold of Brussels.
It was agreed with the operators involved that they set their observation points on the edge of some roads (roads, boulevards, etc.) located at about 1/3 distance from the city center and, correspondingly, at 2/3 from the city edge, that the direction of the road must be as radial as possible on the map of the city considered, that the direction of movement of observable cars must be from the city center to the edge, that the working meeting must take place between 7.00 a.m. and 7.00 p.m., and that only the cars with three seats behind the front seats—5-seater cars—should be recorded. The driver had to be included in the number of occupants, and the number of records (cars observed) did not matter.
5. Results and Discussions
The arguments for approaching the section on “personal mobility by car in urban areas” relate, on the one hand, to the fact that—compared to public transport—this niche is more difficult to measure, more relatively assessable, and less approachable, and on the other hand, the fact that intra-urban mobility is more problematic than extra-urban mobility. Therefore, this study was focused on the efficiency of personal mobility by car in urban areas. The study also developed the methodology for collecting the data from urban traffic.
Current methodologies of data collection for vehicle occupancy range from manual methods to digital technologies with specific hybrid methods.
The method used in this research for data collection is the concomitant or simultaneous sampling of data at several similar points with close traffic and urban characteristics. Due to its combined character, this method integrates the advantages of the observational method of the windshield with the advantages of the observational method of video recording stems and increases the accuracy of the measurements.
For the collecting of data, Wednesday was chosen as the middle of the week—that is, with little risk compared to weekends and the days adjacent to them—and November was also chosen as the middle of the month—that is, farther away from holidays and extreme weather conditions (too hot or too cold).
The data collecting with the special combined method was organized in the same time on 8 November 2017 in three cities in the European Union. The sampling for observation is represented by three streets with comparable urban traffic: Kennedydamm in Düsseldorf (
Figure 2a), Quai de Willebroek street in Brussels (
Figure 2b), and Calea Dorobantilor Street in Bucharest (
Figure 2c).
All records for collecting the data needed to establish the indices of occupancy of people in urban traffic were centralized in Bucharest, where the authors of this study processed and interpreted the recorded data. If the data recorded by the windshield method were processed in five hours, viewing the footage took five days. From the comparison of the recordings by the windshield method with the recordings made by the video cameras, the discrepancy of 1.2% of the totals of the two types of recordings turned out to be very satisfactory. Note that, according to the tests that the authors of this article personally conducted in the field, the optimal height of the video cameras mounted on tripod stands must be 1.65 m from the ground, and the distance between the direct observer station and the video camera station, must be at approximately 6.5 m. The optical axis of the video camera must make an angle of approximately 75 sens with the direction of the car’s direction of movement.
The characteristic averages for the occupancy rates corresponding to the three European cities were then calculated. The following values resulted: Brussels = 1.36, Düsseldorf = 1.42, and Bucharest = 1.28. These values are in line with the European trends of decreasing occupancy rates of passengers in cars in traffic reported in some studies on the same topic [
29].
It has to be mentioned that the data collection process could have been disrupted or even interrupted by an unpredictable factor. This did not happen during the method verification meeting in November 2017. It is true that the operators were a bit shivery in Brussels (3–6 °C) and Düsseldorf (7–8 °C). In Bucharest, the temperature had a maximum of approximately 11 °C and the wind was light in the afternoon, while in Brussels a few drops of rain fell. These details are mentioned in order for potential researchers who would like to resume and refine the method proposed here to understand that the development of action in this area involves taking into account elements that, if anticipated, can no longer have unpredictable effects and be fateful.
In order to express, as eloquently as possible, the data and the percentages corresponding to the analyzed occupancy degrees, the graph from
Figure 3 was drafted.
In this study we provide a comparison with other methods of data collection used for vehicle occupancy in other countries [
29]. Compared to the 1.7 value advanced by the studies on the situation in the United States, the values of the indices calculated in this study for Brussels, Bucharest, and Düsseldorf are lower, but, on the other hand, they are higher than the value of the characteristic index of Australia that tends to be 1.00 [
30].
The results of this study are closer to the average occupancy rate for cars in Mexico City, which is 1.3 [
31].
Additionally, in the last four decades, an unfortunate trend of reducing the occupancy of cars in urban traffic has been observed [
32], and also the overall dimensions of the same type of car have increased continuously. For example, a 1981 VW Passat has a length of about 4.4 m. and a width of about 1.6 m., whereas a 2018 Passat is about 4.8 m long and about 1.8 m wide, and sales of small cars (mini- and micro-cars) have fallen in recent years. These aspects show that no concern has been given to the urban sprawl and, accordingly, to the efficiency of mobility. Unfortunately, the higher consumption trend of big cars increased the overall industry car footprint by 0.6 ft between 2008 and 2016 [
33].
It should be mentioned that the low percentage of large and medium-sized cars carrying more than two people with the driver included (5.81%) does not justify why, for some cities with approximately the same number of registrations (over one million), the approximately 950,000 cars occupied by only one or two people transport unnecessarily over a total area of approximately 3,350,000 m2. This inefficiently occupied area is equivalent to about nine “Wildpark in Grafenberger Wald” parks in Düsseldorf, about 11 “du Cinquantenaire” parks in Brussels, or almost two “Herastrau” parks in Bucharest (these are the known parks in these cities). If the same area is related to the current demographics characteristic to the three cities where the observations were conducted, it would result in residential areas for approximately 14,900 inhabitants in Brussels, 9080 inhabitants in Düsseldorf, or 27,850 inhabitants in Bucharest.
6. Conclusions
The combined method proposed and analyzed in this study benefits from the main advantages of the windshield method related to the minimal equipment required, the easy implementation and the high percentage of collected data for passing vehicles (usually 75–90% range [
20]), and the aim to reduce the disadvantages of the windshield method. The main disadvantage of the windshield method is focused on the short view time of the observer into the vehicles, especially at high speed, and the degradation of observer performance over time due to fatigue. However, the main disadvantage of this method is eliminated with the combined method that also adds, in this case, video technology.
The values revealed by the combined method promoted in this study are significantly lower than those of the statistics consulted and with which they were subsequently compared, which means either a slightly decreasing trend of the characteristic indices or differences resulting from the slightly random choice of measurement constraints. In any case, this aspect is not relevant here, nor is the differential comparison between the three cities according to other criteria, but rather the fact that large and medium-sized cars carrying more than two people (driver included) are not, on average, more than 5.81%.
The results of this study add to the scientific literature that shows there is a real need to increase the occupancy rates of cars in urban traffic, which were very low in the three observed cities in the European Union, for a more sustainable environment and a higher quality of life.
One of the limitations of the presented method could be considered the choice of the date from a whole year, given the probability that that day will not be the most representative for the measurement followed. Certainly, measurements made on another day of the year and in other places would have provided other data. However, it was appreciated that the accuracy of the measurement could be considered sufficiently high, with the location and moment criteria established.
The obtained results indicate a low difference between the values recorded by the windscreen method and those recorded by the video recording method. This verified, at the same time, the sufficiently high accuracy of the two methods, and the responsibility of the operators who recorded the measurements by the windshield method.
Future research in other cities may validate the advantages of this combined method for collecting data and calculating the occupancy rate of cars in urban traffic.
Finally, this experiment will be an important opportunity to develop a more accurate method for collecting data from urban traffic and to calculate more sustainable indicators that will help researchers, traffic experts, and decisions-makers to increase the efficiency of personal mobility. The results will allow them to have a better overview of specific solutions of data collection regarding car occupancy in urban traffic and to find the best option for the design of cars and also to promote new policies that may increase public acceptance for new sustainable standards.


