Performance Assessment of the Semiconductor Industry: Measured by DEA Environmental Assessment


Abstract

1. Introduction
2. Literature Review
2.1. Semiconductor Industry
2.2. Technological Innovation and Environmental Sustainability in the Industry
2.3. DEA Applications to the Semiconductor Industry
3. Method
3.1. Underlying Concepts
3.2. Two Formulations under Constant RTS and DTS
3.3. Two Formulations under Variable RTS and DTS
3.4. Methodical Strengths and Drawbacks
3.5. Applicability
4. Performance Assessment of Semiconductor Industry
4.1. Data
4.2. Efficiency Measures
4.3. Statistical Analysis
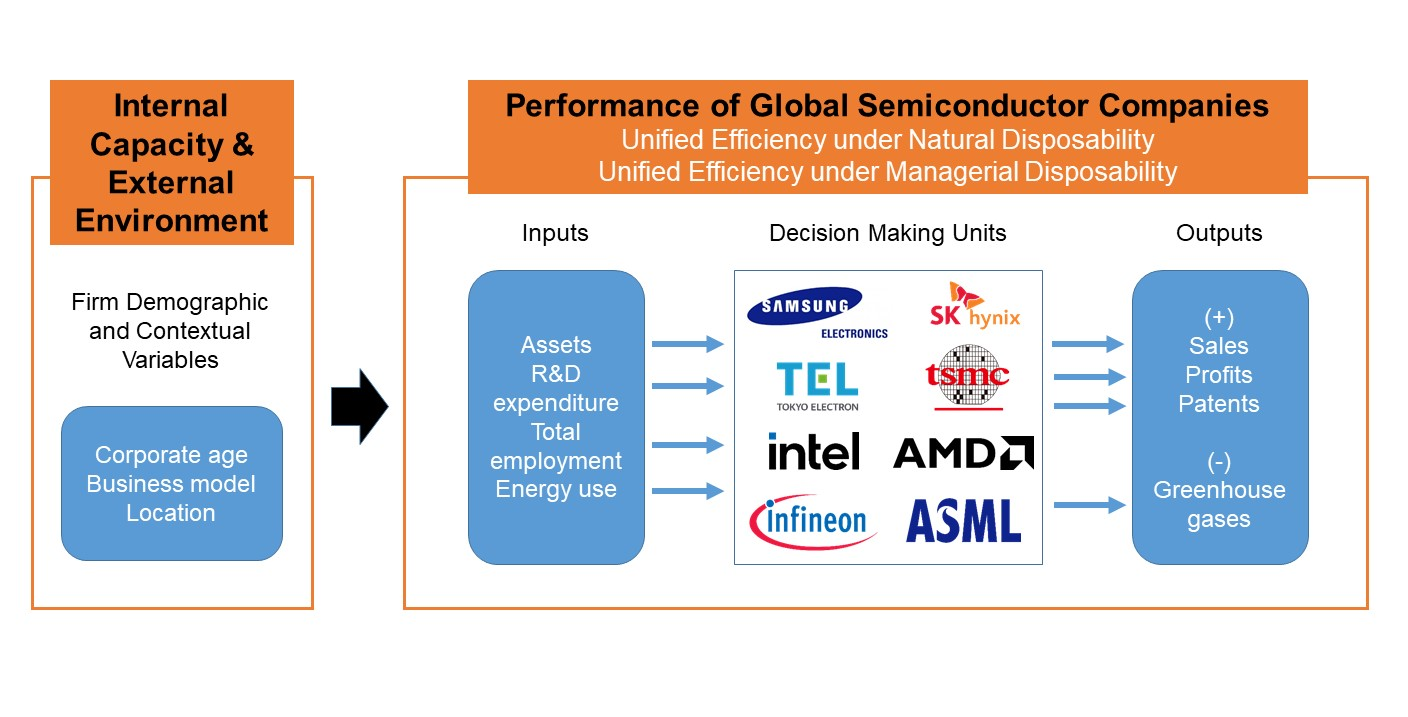
- (H1): Firm age is positively related to UEN alone, implying that firms’ learning effect resulting from long-standing survival influences their operational performance. The results support half of our first hypothesis. Although the coefficient of firm age in the UEM model is positive, it is not statistically significant. Thus, we cannot verify the relationship between firm age and environmental performance.
- (H2): Location is positively related to UEM, suggesting that Asian firms are more likely to have better environmental efficiency than non-Asian ones are. The results rebut our second hypothesis. Possible explanations are: (a) While Asian firms use more energies, they tend to emit less GHG, possibly because of Asian firms’ higher R&D expenditure and patent filings in the semiconductor manufacturing and climate change mitigation technologies, when compared to non-Asian firms (the analysis results confirm that R&D expenditure is positively related to UEM). (b) Voluntary agreements promoted by each country’s semiconductor industry association work in Asia. (c) As of 2018, Asian firms’ awareness of and attitude toward climate change were sufficiently mature, evidenced by their ambitious corporate social responsibility goals. On the other hand, location does not have a statistically significant relationship with UEN.
- (H3): A business model is negatively related to UEN alone, meaning that fabless firms are more likely to have better operational efficiency scores than fabrication firms. The results support the third hypothesis. There is no statistically significant difference in UEM between fabless and fabrication firms.
4.4. Policy Implications
5. Conclusions and Future Extensions
Author Contributions
Funding
Conflicts of Interest
Abbreviations
| ASE | advanced semiconductor engineering |
| CDS | constant damages to scale |
| CPC | cooperative patent classification |
| CSR | corporate social responsibility |
| DEA | data envelopment analysis |
| DMU | decision-making unit |
| DTS | damages to scale |
| FTE | full-time equivalent |
| GHG | greenhouse gas |
| GWP | global warming potential |
| GWh | gigawatt hours |
| IDM | integrated device manufacturer |
| RTS | returns to scale |
| M&A | merger and acquisition |
| R&D | research and development |
| SEM | scale efficiency under managerial disposability |
| SEN | scale efficiency under natural disposability |
| UEM | unified efficiency under managerial disposability |
| UEN | unified efficiency under natural disposability |
| URS | unrestricted |
| U.S. | United States |
Nomenclature
| an observed i th input of the j th DMU (i = 1,…, m and j = 1,..., n) | |
| an observed r th desirable output of the j th DMU (r = 1,..., s and j = 1,..., n) | |
| an observed f th undesirable output of the j th DMU (f = 1,..., h and j = 1,..., n) | |
| an unknown slack variable of the i th input | |
| an unknown slack variable of the r th desirable output | |
| an unknown slack variable of the f th undesirable output | |
| an unknown column vector of intensity (or structural) variables | |
| a prescribed very small number | |
| J | a set of all DMUs |
References
- Deloitte. Semiconductors—The Next Wave: Opportunities and Winning Strategies for Semiconductor Companies; Deloitte China: 2019. Available online: https://www2.deloitte.com/content/dam/Deloitte/cn/Documents/technology-media-telecommunications/deloitte-cn-tmt-semiconductors-the-next-wave-en-190422.pdf (accessed on 1 October 2020).
- Nathan Associates. Beyond Borders: The Global Semiconductor Value Chain; Semiconductor Industry Association: San Jose, CA, USA, 2016. [Google Scholar]
- Megna, P.; Klock, M. The impact of intangible capital on Tobin’s q in the semiconductor industry. Am. Econ. Rev. 1993, 83, 265–269. [Google Scholar]
- Hall, B.H.; Ziedonis, R.H. The patent paradox revisited: An empirical study of patenting in the US semiconductor industry, 1979–1995. RAND J. Econ. 2001, 32, 101–128. [Google Scholar] [CrossRef]
- Jiang, L.; Tan, J.; Thursby, M. Incumbent firm invention in emerging fields: Evidence from the semiconductor industry. Strateg. Manag. J. 2011, 32, 55–75. [Google Scholar] [CrossRef]
- Cheng, Y.H.; Kuan, F.Y.; Chuang, S.C.; Ken, Y. Profitability decided by patent quality? An empirical study of the US semiconductor industry. Scientometrics 2010, 82, 175–183. [Google Scholar] [CrossRef]
- Lou, C.C.; Lee, T.P.; Gong, S.C.; Lin, S.L. Effects of technical innovation on market value of the US semiconductor industry. Technol. Forecast. Soc. Chang. 2010, 77, 1322–1338. [Google Scholar] [CrossRef]
- Illuzzi, F.; Thewissen, H. Perfluorocompounds emission reduction by the semiconductor industry. J. Integr. Environ. Sci. 2010, 7, 201–210. [Google Scholar] [CrossRef]
- Lo, S.F. Global warming action of Taiwan’s semiconductor/TFT-LCD industries: How does voluntary agreement work in the IT industry? Technol. Soc. 2010, 32, 249–254. [Google Scholar] [CrossRef]
- Lee, K.H.; Kim, J.W. Integrating suppliers into green product innovation development: An empirical case study in the semiconductor industry. Bus. Strategy Environ. 2011, 20, 527–538. [Google Scholar] [CrossRef]
- Hsu, C.W.; Hu, A.H.; Chiou, C.Y.; Chen, T.C. Using the FDM and ANP to construct a sustainability balanced scorecard for the semiconductor industry. Expert Syst. Appl. 2011, 38, 12891–12899. [Google Scholar] [CrossRef]
- Appleyard, M.M.; Brown, C.; Sattler, L. An international investigation of problem-solving performance in the semiconductor industry. J. Prod. Innov. Manag. 2006, 23, 147–167. [Google Scholar] [CrossRef]
- Chen, Y.S.; Shih, C.Y.; Chang, C.H. The effects of related and unrelated technological diversification on innovation performance and corporate growth in the Taiwan’s semiconductor industry. Scientometrics 2012, 92, 117–134. [Google Scholar] [CrossRef]
- Tsai, C.J. High performance work systems and organizational performance: An empirical study of Taiwan’s semiconductor design firms. Int. J. Hum. Resour. Manag. 2006, 17, 1512–1530. [Google Scholar] [CrossRef]
- Cheng, S.L.; Chang, H.C. Performance implications of cognitive complexity: An empirical study of cognitive strategic groups in semiconductor industry. J. Bus. Res. 2009, 62, 1311–1320. [Google Scholar] [CrossRef]
- Cheng, C.H.; Chen, C.T.; Huang, S.F. Combining fuzzy integral with order weight average (OWA) method for evaluating financial performance in the semiconductor industry. Afr. J. Bus. Manag. 2012, 6, 6358–6368. [Google Scholar]
- Sattler, L.; Glassey, C.R.; Saeed, B.I. Benchmarking semiconductor manufacturing performance using a pairwise-comparison method. IEEE Trans. Semicond. Manuf. 1997, 10, 317–321. [Google Scholar] [CrossRef]
- Salomon, R.; Martin, X. Learning, knowledge transfer, and technology implementation performance: A study of time-to-build in the global semiconductor industry. Manag. Sci. 2008, 54, 1266–1280. [Google Scholar] [CrossRef]
- Chen, C.T.; Lin, M.H. Using DEA to evaluate R&D performance in the integrated semiconductor firms-case study of Taiwan. Int. J. Comput. Internet Manag. 2006, 14, 50–59. [Google Scholar]
- Chung, S.H.; Pearn, W.L.; Lee, A.H. Measuring production performance of different product mixes in semiconductor fabrication. Int. J. Ind. Eng. Theory Appl. Pract. 2006, 13, 5–17. [Google Scholar]
- Huang, C.Y.; Tzeng, G.H.; Chen, Y.T.; Chen, H. Performance evaluation of leading fabless integrated circuit design houses by using a multiple objective programming based data envelopment analysis approach. Int. J. Innov. Comput. Inf. Control 2012, 8, 5899–5916. [Google Scholar]
- Wen, H.C.; Huang, J.H.; Cheng, Y.L. What Japanese semiconductor enterprises can learn from the asset-light business model for sustainable competitive advantage. Asian Bus. Manag. 2012, 11, 615–649. [Google Scholar] [CrossRef]
- Lu, W.M.; Wang, W.K.; Lee, H.L. The relationship between corporate social responsibility and corporate performance: Evidence from the US semiconductor industry. Int. J. Prod. Res. 2013, 51, 5683–5695. [Google Scholar] [CrossRef]
- Wu, H.Y.; Chen, I.S.; Chen, J.K.; Chien, C.F. The R&D efficiency of the Taiwanese semiconductor industry. Measurement 2019, 137, 203–213. [Google Scholar]
- Hatami-Marbini, A.; Agrell, P.J.; Tavana, M.; Khoshnevis, P. A flexible cross-efficiency fuzzy data envelopment analysis model for sustainable sourcing. J. Clean. Prod. 2017, 142, 2761–2779. [Google Scholar] [CrossRef]
- Lin, F.; Lin, S.W.; Lu, W.M. Sustainability assessment of Taiwan’s semiconductor industry: A new hybrid model using combined analytic hierarchy process and two-stage additive network data envelopment analysis. Sustainability 2018, 10, 4070. [Google Scholar] [CrossRef]
- Mavi, R.K.; Saen, R.F.; Goh, M. Joint analysis of eco-efficiency and eco-innovation with common weights in two-stage network DEA: A big data approach. Technol. Forecast. Soc. Chang. 2019, 144, 553–562. [Google Scholar] [CrossRef]
- Sueyoshi, T.; Yuan, Y.; Goto, M. A literature study for DEA applied to energy and environment. Energy Econ. 2017, 62, 104–124. [Google Scholar] [CrossRef]
- Sueyoshi, T.; Goto, M. Environmental Assessment on Energy and Sustainability by Data Envelopment Analysis; John Wiley & Sons: London, UK, 2018; pp. 1–699. [Google Scholar]
- Sueyoshi, T.; Goto, M. Data envelopment analysis for environmental assessment: Comparison between public and private ownership in petroleum industry. Eur. J. Oper. Res. 2012, 216, 668–678. [Google Scholar] [CrossRef]
- Sueyoshi, T.; Goto, M. Environmental assessment by DEA radial measurement: U.S. coal-fired power plants in ISO (independent system operator) and RTO (regional transmission organization). Energy Econ. 2012, 34, 663–676. [Google Scholar] [CrossRef]
- Sueyoshi, T.; Yuan, Y. Social sustainability measured by intermediate approach for DEA environmental assessment: Chinese regional planning for economic development and pollution prevention. Energy Econ. 2017, 66, 154–166. [Google Scholar] [CrossRef]
- Sueyoshi, T.; Yuan, Y. Measuring energy usage and sustainability development in Asian nations by DEA intermediate approach. J. Econ. Struct. 2018, 7, 1–18. [Google Scholar] [CrossRef]
- Sueyoshi, T.; Yuan, Y.; Li, A.; Wang, D. Methodological comparison among radial, non-radial and intermediate approaches for DEA environmental assessment. Energy Econ. 2017, 67, 439–453. [Google Scholar] [CrossRef]
- Sueyoshi, T.; Li, A.; Gao, Y. Sector sustainability on fossil fuel power plants across Chinese provinces: Methodological comparison among radial, non-radial and intermediate approaches under group heterogeneity. J. Clean. Prod. 2018, 187, 819–829. [Google Scholar] [CrossRef]
- Sueyoshi, T.; Goto, M. Intermediate approach for sustainability enhancement and scale related measures in environmental assessment. Eur. J. Oper. Res. 2019, 276, 744–756. [Google Scholar] [CrossRef]
- Bi, K.; Huang, P.; Wang, X. Innovation performance and influencing factors of low-carbon technological innovation under the global value chain: A case of Chinese manufacturing industry. Technol. Forecast. Soc. Chang. 2016, 111, 275–284. [Google Scholar] [CrossRef]
- Sueyosh, T.; Goto, M. DEA environmental assessment in time horizon: Radial approach for Malmquist index measurement on petroleum companies. Energy Econ. 2015, 51, 329–345. [Google Scholar] [CrossRef]
- Sueyosh, T.; Goto, M.; Wang, D. In measurement on frontier shift for sustainability enhancement by Chinese provinces. Energy Econ. 2017, 67, 554–571. [Google Scholar] [CrossRef]


| Author(s) | Country | Method | Summary |
|---|---|---|---|
| Appleyard et al. [12] | Japan, South Korea, and U.S. | One-way analysis of variance (ANOVA) and hierarchical regression analysis | This study examined the effects of human resource and knowledge systems of semiconductor companies on their problem-solving performance. |
| Chen et al. [13] | Taiwan | Fixed-effect regression model | This study analyzed how related and unrelated technological diversifications affect semiconductor companies’ innovation performance and corporate growth. |
| Tsai [14] | Taiwan | Correlation and regression analysis | This study shed light on how high performance work systems are associated with organizational performance in semiconductor design companies. |
| Cheng & Chang [15] | Taiwan | Content analysis, cluster analysis, ANOVA, and multivariate analysis of variance (MANOVA) | This study explored how different types of cognitive strategic groups and different orientations toward operation, customer, and product influence the performance in the semiconductor industry. |
| Cheng et al. [16] | Taiwan | Fuzzy integral and order weight average method | This study assessed the financial performance of the semiconductor industry taking the interdependence of financial ratios into account. |
| Sattler et al. [17] | World | Paired-comparison method | This study compared the manufacturing performance of semiconductor plants. |
| Salomon & Martin [18] | World | Mixed-effect regression model | This study looked into the performance of productive knowledge deployment in new semiconductor manufacturing facilities with a focus on the time it takes for a company to operationalize their new facility. |
| Author(s) | Country | Model | Summary | Inputs | Outputs |
|---|---|---|---|---|---|
| Chen & Lin [19] | Taiwan | DEA | This study assessed the R&D performance of 52 Taiwanese semiconductor firms. | firm age, paid-in-capital, R&D expenditure, number of R&D employees | sales, number of patents |
| Chung et al. [20] | World | DEA (Cross-Efficiency) | This study analyzed global top 30 fabless semiconductor firms to calculate and compare their relative performance. | R&D Expenses, fixed assets, intangible assets, capital stock, cash, net working capital, long-term investments, debt ratios | revenue, EBT, net income after taxes, EPS, ROE, ROA, turnover ratios |
| Huang et al. [21] | World | DEA (MOP/EAM) | This study computed the efficiencies of global top 40 fabless semiconductor design firms. | cost of goods sold, R&D expenses | total revenue, ROI, profitability |
| Lu et al. [23] | United States | 2-stage approach: DEA (dynamic) and panel data regression | This study examined how CSR interplays with the performance of 89 U.S. semiconductor firms. | number of employees, owner’s equity, liability | gross income, market value, excess cost over equity |
| Hatami-Marbini et al. [25] | Middle East | DEA (cross efficiency and fuzzy data model) | This study demonstrated the application of cross efficiency fuzzy DEA to selecting sustainable suppliers along with a case study on 12 semiconductor suppliers in the Middle East. | normal inputs: total cost of products, energy consumption, etc.; desirable inputs: use of new technologies, eco-design requirements for energy using products, environmental regulatory compliance | desirable outputs: quality management system, economic performance, etc.; undesirable outputs: delivery lead time, pollution impact |
| Lin et al. [26] | Taiwan | 2-stage additive network DEA: business growth process and energy utilization process; and AHP | This study decomposed the semiconductor operations into business growth stage and energy utilization stage, and computed the sustainability performance of 15 Taiwanese semiconductor firms. | labor, operating expenses, net fixed assets | intermediates: sales, power consumption, water consumptionoutputs: effluent drainage, wastes, GHG gases |
| Wu et al. [24] | Taiwan | DEA (MPI) | This study measured the R&D efficiencies of 42 Taiwanese semiconductor firms and monitored their change over time. | total assets, staff numbers, R&D expenditure | ROA, EPS, number of patents |
| Category | Model (5) | Model (7) | Model (9) | Model (12) |
|---|---|---|---|---|
| Measures of Interest | UEN under constant RTS | UEM under constant DTS | UEN under variable RTS | UEM under variable DTS |
| Objective function | Inefficiency score under natural disposability & constant RTS | Inefficiency score under managerial disposability & constant DTS | Inefficiency score under natural disposability & variable RTS | Inefficiency score under natural disposability & variable DTS |
| Constraints | Input slack | Input surplus | Input slack & | Input surplus & |
| Firm Demographics | Inputs | Desirable Outputs | Undesirable Output | ||||||||
|---|---|---|---|---|---|---|---|---|---|---|---|
| Company | Country | Continent | Firm Age | Assets | R&D exp. | Total Empl. | Energy Use | Sales | Profits | Patents | GHG |
| (Yrs) | (US$ B) | (US$ M) | (FTE) | (GWh) | (US$ B) | ($US B) | (Appl.) | (KtCO2e) | |||
| Renesas Electronics | Japan | Asia | 17 | 9.6 | 1170.1 | 19,546 | 5391.67 | 7.1 | 0.83 | 668 | 994 |
| Tokyo Electron | 56 | 11.4 | 897.9 | 11,946 | 1128.59 | 10.2 | 1.80 | 2,025 | 152 | ||
| Samsung Electronics | South Korea | 50 | 293.2 | 15,833.3 | 309,630 | 26,028.00 | 224.6 | 41.00 | 1722 | 15,173 | |
| SK Hynix | 70 | 46.1 | 1906.0 | 33,190 | 23,327.43 | 29.3 | 10.70 | 241 | 5914 | ||
| ASE Technology Holding | Taiwan | 35 | 12.2 | 482.2 | 92,762 | 114.38 | 9.6 | 0.75 | 85 | 1643 | |
| MediaTek | 22 | 14.2 | 1854.7 | 17,058 | 75.86 † | 7.7 | 0.68 | 198 | 43 † | ||
| Nanya Technology | 24 | 5.4 | 157.5 | 3219 | 44.29 | 2.1 | 1.50 | 117 | 448 | ||
| Siliconware Precision Industries | 35 | 3.8 | 131.8 | 23,000 | 1095.38 | 2.8 | 0.25 | 44 | 581 | ||
| Taiwan Semiconductor | 32 | 70.3 | 2768.3 | 48,752 | 13,167.00 | 33.1 | 11.50 | 4592 | 8475 | ||
| Infineon Technologies | Germany | Europe | 20 | 10.1 | 915.3 | 40,098 | 1781.32 | 8.5 | 1.30 | 763 | 915 |
| ASML Holding | Netherlands | 35 | 22.9 | 1725.3 | 20,044 | 376.39 | 11.0 | 2.70 | 73 | 33 | |
| NXP Semiconductors | 13 | 24.1 | 1700.0 | 30,000 | 1450.00 | 9.3 | 0.97 | 201 | 1410 | ||
| STMicro electronics | Switzerland | 37 | 10.1 | 1398.0 | 45,953 | 2439.44 | 8.7 | 0.93 | 479 | 1435 | |
| Advanced Micro Devices | United States | North America | 50 | 3.8 | 1434.0 | 10,100 | 121.00 | 6.0 | 0.20 | 63 | 45 |
| Analog Devices | 54 | 20.9 | 1165.4 | 15,800 | 231.69† | 5.6 | 0.77 | 56 | 112 † | ||
| Applied Materials | 52 | 19.7 | 2019.0 | 21,000 | 570.92 | 15.5 | 2.90 | 1450 | 173 | ||
| Broadcom | 28 | 54.5 | 3768.0 | 15,000 | 119.28 † | 18.8 | 7.80 | 22 | 51 † | ||
| Intel | 51 | 128.6 | 13,543.0 | 107,400 | 8300.00 | 64.0 | 11.10 | 1205 | 2580 | ||
| KLA-Tencor | 44 | 5.6 | 608.5 | 6550 | 79.36 † | 3.9 | 0.71 | 306 | 30 † | ||
| Lam Research | 39 | 13.7 | 1189.5 | 10,900 | 200.00 † | 10.3 | 1.90 | 573 | 93 | ||
| Maxim Integrated Products | 36 | 4.6 | 450.9 | 7149 | 233.79 | 2.4 | 0.44 | 11 | 100 | ||
| Microchip Technology | 30 | 8.3 | 529.3 | 14,234 | 1024.23 | 4.0 | 0.26 | 90 | 858 | ||
| Micron Technology | 41 | 41.3 | 2141.0 | 36,000 | 7951.22 | 25.9 | 10.00 | 944 | 6100 | ||
| NVIDIA | 26 | 11.5 | 1797.0 | 11,528 | 154.02 | 11.0 | 3.80 | 5 | 59 | ||
| ON Semiconductor Corp. | 20 | 7.3 | 650.7 | 35,700 | 1344.64 | 5.5 | 0.87 | 10 | 585 | ||
| Qualcomm | 34 | 64.1 | 5619.0 | 35,400 | 691.61 | 22.6 | 2.47 | 838 | 195 | ||
| Skyworks Solutions | 57 | 4.7 | 404.5 | 9400 | 339.04 † | 3.9 | 0.87 | 85 | 39 † | ||
| Texas Instruments | 89 | 17.5 | 1559.0 | 29,888 | 3035.52 | 15.3 | 4.00 | 353 | 2268 | ||
| Xilinx | 35 | 5.1 | 639.8 | 4014 | 59.76 | 2.5 | 0.51 | 42 | 26 | ||
| Descriptive statistics | Mean | 43 | 25.7 | 2344.9 | 23,129 | 1528.50 | 13.6 | 3.04 | 378 | 832 | |
| Max | 89 | 128.6 | 13,543.0 | 107,400 | 8300.00 | 64.0 | 11.10 | 1450 | 6100 | ||
| Min | 20 | 3.8 | 404.5 | 4014 | 59.76 | 2.4 | 0.20 | 5 | 26 | ||
| S.D. | 16 | 33.1 | 3288.4 | 24,984 | 2682.44 | 15.4 | 3.54 | 478 | 1615 | ||
| Company | UEN | UEM | ||||
|---|---|---|---|---|---|---|
| Con. RTS | Var. RTS | SEN | Con. DTS | Var. DTS | SEM | |
| Advanced Micro Devices | 1.000 | 1.000 | 1.000 | 0.214 | 0.215 | 0.995 |
| Analog Devices | 0.226 | 0.237 | 0.955 | 0.080 | 0.080 | 0.999 |
| Applied Materials | 1.000 | 1.000 | 1.000 | 0.491 | 1.000 | 0.491 |
| ASE Technology Holding | 1.000 | 1.000 | 1.000 | 0.023 | 1.000 | 0.023 |
| ASML Holding | 1.000 | 1.000 | 1.000 | 1.000 | 1.000 | 1.000 |
| Broadcom | 1.000 | 1.000 | 1.000 | 1.000 | 1.000 | 1.000 |
| Infineon Technologies | 0.408 | 0.433 | 0.942 | 0.052 | 0.198 | 0.263 |
| Intel | 0.177 | 1.000 | 0.177 | 0.073 | 1.000 | 0.073 |
| KLA-Tencor | 1.000 | 1.000 | 1.000 | 1.000 | 1.000 | 1.000 |
| Lam Research | 1.000 | 1.000 | 1.000 | 0.473 | 0.512 | 0.923 |
| Maxim Integrated Products | 0.186 | 1.000 | 0.186 | 0.051 | 0.074 | 0.689 |
| MediaTek | 1.000 | 1.000 | 1.000 | 0.617 | 0.617 | 1.000 |
| Microchip Technology | 0.150 | 0.176 | 0.853 | 0.026 | 0.041 | 0.643 |
| Micron Technology | 1.000 | 1.000 | 1.000 | 0.029 | 0.315 | 0.091 |
| Nanya Technology | 1.000 | 1.000 | 1.000 | 0.020 | 0.021 | 0.934 |
| NVIDIA | 1.000 | 1.000 | 1.000 | 0.259 | 0.311 | 0.832 |
| NXP Semiconductors | 0.067 | 0.121 | 0.558 | 0.023 | 0.055 | 0.423 |
| ON Semiconductor Corp. | 0.324 | 0.326 | 0.991 | 0.050 | 0.143 | 0.352 |
| Qualcomm | 0.418 | 1.000 | 0.418 | 0.366 | 1.000 | 0.366 |
| Renesas Electronics | 0.204 | 0.207 | 0.982 | 0.121 | 1.000 | 0.121 |
| Samsung Electronics | 1.000 | 1.000 | 1.000 | 0.037 | 1.000 | 0.037 |
| SK Hynix | 1.000 | 1.000 | 1.000 | 0.086 | 1.000 | 0.086 |
| Skyworks Solutions | 1.000 | 1.000 | 1.000 | 0.211 | 0.229 | 0.924 |
| Siliconware Precision Industries | 1.000 | 1.000 | 1.000 | 0.041 | 0.082 | 0.502 |
| STMicroelectronics | 0.228 | 0.237 | 0.962 | 0.040 | 0.119 | 0.333 |
| Taiwan Semiconductor | 0.797 | 1.000 | 0.797 | 0.040 | 1.000 | 0.040 |
| Texas Instruments | 1.000 | 1.000 | 1.000 | 0.030 | 0.101 | 0.293 |
| Tokyo Electron | 1.000 | 1.000 | 1.000 | 1.000 | 1.000 | 1.000 |
| Xilinx | 0.344 | 1.000 | 0.344 | 0.176 | 1.000 | 0.176 |
| Production Type Items | UEN (Variable RTS) | UEM (Variable DTS) | |||||
|---|---|---|---|---|---|---|---|
| Mean | t-Statistic | Mean | t-Statistic | ||||
| Efficient Companies (No = 22) | Inefficient Companies (No = 7) | Efficient Companies (No = 13) | Inefficient Companies (No = 16) | ||||
| Inputs | Assets (US$ B) | 38.83 | 12.91 | 1.048 | 57.18 | 12.58 | 2.237 ** |
| R&D expenditure (US$ M) | 2769.57 | 1075.53 | 1.048 | 3921.57 | 1092.42 | 2.244 ** | |
| Employees (FTE) | 39,269.55 | 28,761.57 | 0.414 | 55,787.23 | 21,252.69 | 1.653 * | |
| Energy use (GWh) | 3964.22 | 1951.86 | 0.693 | 6104.18 | 1345.09 | 2.025 ** | |
| Desirable outputs | Sales (US$ B) | 24.21 | 6.96 | 0.960 | 34.78 | 8.06 | 1.798 ** |
| Profits (US$ B) | 5.02 | 0.85 | 1.200 | 6.75 | 1.80 | 1.694 * | |
| Patents (Applications) | 681.55 | 323.86 | 0.868 | 1020.69 | 249.50 | 2.356 ** | |
| Undesirable output | GHG emissions (KtCO2e) | 2010.05 | 901.41 | 0.764 | 2,726.10 | 943.22 | 1.468 * |
| Variables | UEN (Variable RTS) | UEM (Variable DTS) | ||||
|---|---|---|---|---|---|---|
| N1 | N2 | N3 | M1 | M2 | M3 | |
| Demographics: | ||||||
| Firm age | 0.0091 ** (2.19) | 0.0087 * (2.00) | 0.0083 ** (2.09) | 0.0036 (0.71) | 0.0017 (0.38) | 0.0006 (0.12) |
| Location | 0.1715 (1.12) | 0.2173 (1.20) | 0.1845 (1.06) | 0.3288 * (1.79) | 0.3850 * (2.07) | 0.2818 (1.42) |
| Business model | −0.4706 ** (−2.69) | −0.4500 ** (−2.48) | −0.4677 ** (−2.68) | −0.0338 (−0.18) | 0.0654 (0.35) | −0.0693 (−0.34) |
| Inputs: | ||||||
| Assets | - | - | - | - | ||
| R&D expenditure | 0.0000 (1.03) | 0.0000 (0.26) | 0.0002 ** (2.62) | 0.0001 (1.62) | ||
| Employees | −0.0000 (−0.19) | −0.0000 (−0.58) | −0.0000 (−0.16) | 0.0000 (0.03) | ||
| Energy use | −0.0000 (−0.32) | −0.0000 (−1.39) | 0.0000 (0.03) | −0.0000 (−0.09) | ||
| Outputs: | ||||||
| Sales | - | - | ||||
| Profits | 0.0395 (1.56) | 0.0112 (0.37) | ||||
| Patents | 0.0001 (1.22) | 0.0002 (1.31) | ||||
| GHG emissions | - | - | ||||
| Model fit: | ||||||
| R squared | 0.26 | 0.31 | 0.44 | 0.08 | 0.42 | 0.48 |
| AIC | 39.04 | 43.16 | 42.02 | 48.16 | 40.19 | 41.46 |
| BIC | 45.88 | 54.10 | 55.69 | 55.00 | 51.13 | 55.13 |
| Efficiency | Location | Business Model | ||||
|---|---|---|---|---|---|---|
| Mean | t-Statistic | Mean | t-Statistic | |||
| Asian Companies (No = 9) | Non-Asian Companies (No = 20) | Fabless Companies (No = 8) | Fabrication Companies (No = 21) | |||
| UEN (Variable RTS) | 0.91 | 0.78 | 1.020 | 1.00 | 0.75 | 1.907 ** |
| UEM (Variable DTS) | 0.75 | 0.47 | 1.669 * | 0.56 | 0.56 | 0.009 |
Publisher’s Note: MDPI stays neutral with regard to jurisdictional claims in published maps and institutional affiliations. |
© 2020 by the authors. Licensee MDPI, Basel, Switzerland. This article is an open access article distributed under the terms and conditions of the Creative Commons Attribution (CC BY) license (http://creativecommons.org/licenses/by/4.0/).
Share and Cite
Sueyoshi, T.; Ryu, Y. Performance Assessment of the Semiconductor Industry: Measured by DEA Environmental Assessment. Energies 2020, 13, 5998. https://doi.org/10.3390/en13225998
Sueyoshi T, Ryu Y. Performance Assessment of the Semiconductor Industry: Measured by DEA Environmental Assessment. Energies. 2020; 13(22):5998. https://doi.org/10.3390/en13225998
Chicago/Turabian StyleSueyoshi, Toshiyuki, and Youngbok Ryu. 2020. "Performance Assessment of the Semiconductor Industry: Measured by DEA Environmental Assessment" Energies 13, no. 22: 5998. https://doi.org/10.3390/en13225998
APA StyleSueyoshi, T., & Ryu, Y. (2020). Performance Assessment of the Semiconductor Industry: Measured by DEA Environmental Assessment. Energies, 13(22), 5998. https://doi.org/10.3390/en13225998