Abstract
A novel virtual prototyping algorithm has been developed to design one of the most critical lubricating interfaces in axial piston machines of the swash plate type—the piston–cylinder interface—for operation with water as the working fluid. Due to its low viscosity, the use of water as a lubricant can cause solid friction and wear in these machines at challenging operating conditions. The prototyping algorithm compensates for this by tailoring the shape of the bore surface that guides the motion of each piston in this type of positive displacement machine to conform with the piston surface, taking into account both the piston’s tilt and its deformation. Shaping these surfaces in this manner can render the interface more conducive to generating hydrodynamic pressure buildup that raises its load-carrying capacity. The present work first outlines the structure of the proposed algorithm, then presents a case study in which it is employed to design a bore surface shape for use with two prototypes, one virtual and one physical—both modified versions of a 444 cc commercial axial piston pump. Experimental testing of the physical prototype shows it to achieve a significantly higher maximum total efficiency than the stock unit.
1. Introduction
Axial piston machines of swash plate design (APMSPD) are often the pumps/motors of choice for hydraulic systems in applications from agriculture to aerospace and as key elements in reverse osmosis and firefighting equipment. They can be designed as variable displacement machines, can sustain high operating pressures (>300 bar), and, compared to other positive displacement machine designs, are highly efficient [1,2]. The present work aims to address some of the most prohibitive challenges that the use of water as a hydraulic fluid brings to the design of one of the most critical lubricating interfaces in such a unit. This interface is a substantial contributor to the machine’s overall performance, in terms of both efficiency and component life. At challenging (e.g., high pressure) operating conditions, the use of water as working fluid strains the machine’s ability to achieve an acceptable performance, because water’s low viscosity increases leakage across the interface, and, more dangerously, reduces the fluid film’s capacity to carry load, i.e., to prevent surface wear severe enough to have an unacceptable effect on pump efficiency and/or component life. However, water holds a number of concrete advantages over conventional hydraulic oils. It is a sustainable, environmentally friendly resource, more commonly available than oil (lower transportation cost), its disposal is cheaper, it is non-flammable and non-toxic, and its high thermal conductivity helps with cooling. Moreover, open-circuit systems running on water pose zero risk of oil contamination. Summaries of the advantages of water are available in [3,4,5].
For these reasons, the past three decades have seen a push for the development of APMSPD that can be used with water; a summary of the main progress can be found in the works of Trostmann [3,4] and in the review paper [5]. Current product lines feature water APMSPD capable of running at operating pressures up to 160 bar [6]—more for some of the smaller units [7]. Their present performance envelope, both in terms of the achievable operating conditions and the attainable efficiency, can be expanded by shaping the surfaces of the components that form their main lubricating interfaces. Giving these surfaces a shape changes the height of the fluid film between them, which then changes the pressure field of that film. By adjusting the height and pressure field of the fluid film, the load support and efficiency problems arising from water’s low viscosity can be overcome.
In order to design such shaping for an interface, it must be taken into account that the surfaces of the adjacent components deform, move, and tilt on the micrometer scale—the same order of magnitude as the height of the interface fluid film. As this behavior is difficult to examine experimentally and a physical trial-and-error approach to design is expensive, recent decades have seen the rise of a new strategy for the development of surface shaping: virtual prototyping. Using computer simulations as a design tool, a wide repertoire of micro surface shapes for the lubricating interfaces of APMSPD has been investigated. Examples include those in [8,9,10,11,12,13,14,15] for the piston–cylinder interface (details in Section 4), those in [16,17] for the slipper–swash plate interface, and those in [18,19] for the cylinder block–valve plate interface. As virtual models advance in their ability to capture the behavior of APMSPD lubricating interfaces (fluid film pressure and temperature fields, solid body deformation, leakage and friction losses, etc.), novel methods and algorithms can be conceived in order to optimize component surface shaping.
The original contribution to be presented in this work is such an algorithm. Entitled the Tailored Profile Generator Algorithm (TPGA), it is made to generate a suitable surface shape for a particularly challenging set of lubricating interfaces in APMSPD—the piston–cylinder interfaces—when the hydraulic fluid is water. What makes these interfaces so challenging, and therewith renders them subject of the present work, is the heavy side load exerted on the pistons of APMSPD. Carrying this side load can only be accomplished by piston–cylinder interfaces with a high load-carrying capacity. As already stated, the use of water poses a great problem here; its low viscosity deprives the fluid film of the ability to build enough hydrodynamic pressure to prevent contact between the pistons and their surrounding bores. By facilitating the design of surface shaping suitable for compensating the poor performance of water as a lubricant, the TPGA can enable the reduction—even elimination—of solid friction and wear in the piston–cylinder interface. The next section of this paper clarifies the origins of the piston side load that creates the need for surface shaping and covers the basic architecture of APMSPD to which that side load is inherent, for any reader who may be unfamiliar. In the section that follows, the design concept behind the surface shapes generated by the TPGA is introduced, such that it can be understood what type of surface shaping the algorithm produces, and why. The subsequent section provides an overview of the current state of the art in surface shaping pertinent to the interface of interest. The last piece of background information provided is an overview the piston–cylinder interface simulation tool that the TPGA uses to obtain information about the behavior of the fluid film vital to the design process. Then, a detailed description of the TPGA structure is provided. Finally, a case study is presented in which the TPGA is used to design a surface shape for a 444 cc APMSPD.
2. Axial Piston Machines and Their Piston–Cylinder Lubricating Interfaces
This section provides an overview of the fundamentals of APMSPD, and the forces acting on their pistons; for more information, please refer to the work in [1]. The basic architecture of these machines is shown in Figure 1a. Typically, to pump fluid, the drive shaft turns the cylinder block, causing the pistons to orbit the drive shaft centerline, and because the pistons are connected (with a ball joint) to slippers that glide over an angled swash plate, the orbiting is coupled with a linear motion into and out of the cylinder block that allows the piston to displace fluid. As the piston moves out of the block over one half of the drive shaft revolution (the low-pressure stroke), it draws fluid into the displacement chamber (DC) from the low-pressure port. Over the second half of the drive shaft revolution (the high-pressure stroke), as the piston moves back into the block, that fluid is pushed out into the high-pressure port. The flow into and out of the DCs, and the rise and fall in DC pressure, is regulated by the valve plate; an example of how DC pressure changes with drive shaft angle over the course of a full revolution is shown in Figure 1b, starting with the high-pressure (HP) stroke, followed by the low-pressure (LP) stroke.
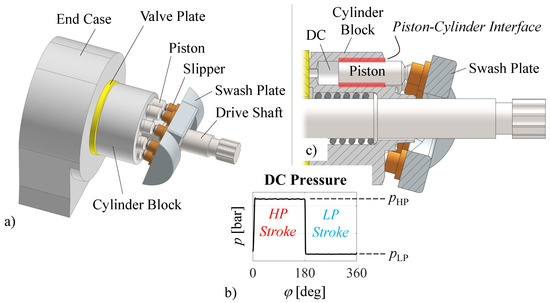
Figure 1.
Axial piston machine of swash plate design. (a) Components; (b) DC pressure; (c) Piston-cylinder interface.
The magnitude of this pressure and the fact that the swash plate is angled have a profound effect on the behavior of the interface under study in this work: the piston–cylinder interface. This is the lubricating interface between each piston and the cylinder block bore it sits in (marked in red in Figure 1c), or, if the block has bushings set into it, the interface between each piston and the corresponding bushing bore. In order to understand the problems the aforementioned two factors can cause for this interface, it is necessary to examine the forces acting on the pistons of APMSPD.
These are shown in Figure 2 [1] (see nomenclature for details). The forces due to fluid pressure within the interface are not shown, as they are highly dependent on the exact geometry of the fluid film. Of the forces depicted, , the force due to displacement chamber pressure pushing on the flat end of the piston, typically exceeds the others in magnitude, followed by , the force due to the centrifugal effect; they are the largest two contributors to the side load acting on the piston. This side load causes the micro motion of the piston, i.e., the tilting and shifting of the piston with respect to the center axis of the cylinder block bore. The contribution of to this movement is direct and obvious; , however, contributes indirectly. Together with the piston inertia and the interface viscous friction force , it pushes the piston towards the swash plate, generating a reaction force [1]:
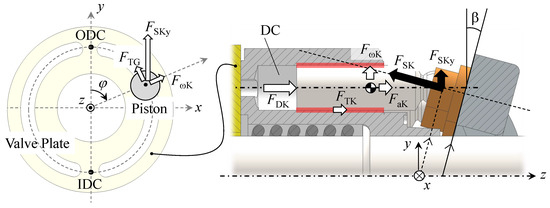
Figure 2.
Forces on piston (see in [1] for details).
This reaction force has a component that acts perpendicular to the cylinder bore center axis [1]:
Because the swash plate is angled, contributes to the piston micro-motion through its contribution to . This micro-motion plays a cardinal role, in that forcing the piston to translate and rotate relative to the bore can cause metal-to-metal contact and catastrophic wear. However, the forces acting on the piston not only cause micro-motion: and , along with the fluid pressure in the piston–cylinder interface, deform the piston and bore surfaces, the deviations from the nominal shape taking on the same order of magnitude as the fluid film. Both the micro-motion and the deformations alter the shape of the fluid film in the interface, and not in a manner favorable to all operating conditions an APMSPD may be expected to run. This is where microsurface shaping can help, by changing the form of the fluid film such as to deliver better load support, and/or a higher efficiency.
Of course, even a well-suited surface shape is a compromise: it performs exceptionally well over part of the shaft revolution, but will not be the ideal for all shaft angles. Which range of shaft angles to design for is tied closely to the magnitude of the described forces. Although those magnitudes vary with unit architecture and operating condition, there is commonality in terms of which forces tend to be the largest, and over which section of the shaft turn. Figure 3 illustrates by providing a qualitative example of how the forces acting on the piston in plane typically behave over the course of a shaft revolution. is the plane that passes through the cylinder bore centerline, and is parallel to the global y-z plane shown in Figure 2; it is the plane in which all forces shown in that figure act—except and , the latter of which is negligible.
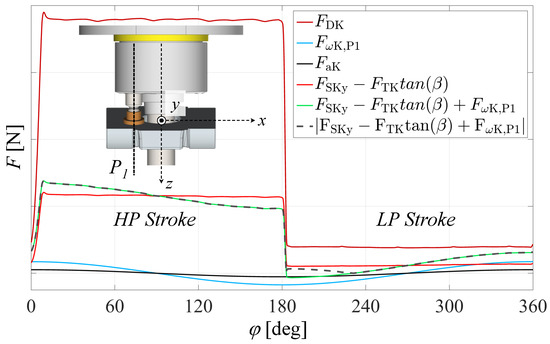
Figure 3.
Forces acting on the piston in plane .
As can be seen, is largest over the HP stroke, whereas the forces and are symmetric about ° ( is not shown, because it tends to be negligible compared to the other forces). According to Equations (1) and (2), when is large, is large; consequentially, is higher over the HP stroke. Figure 3 confirms this by plotting (minus the contribution of ) versus shaft angle. The sum of that force and the component of acting in ( − + ) is also shown; this sum demonstrates that, as acts in the same direction as over the first and last quarter of the shaft revolution, and as is largest over the HP stroke, the side load on the piston tends to be highest during the first quarter of the HP stroke. The design of surface shaping for challenging (especially high pressure) operating conditions therefore should give special attention to accommodating the needs of the fluid film over this part of the revolution.
Especially for high-pressure operating conditions, the side load on the pistons of APMSPD can easily reach a magnitude on the order of N. As stated earlier, because water’s viscosity is so low, it cannot carry as much of this side load as traditional hydraulic oil—unless effective design changes are made at the piston–cylinder interface. This is where surface shaping comes in: it compensates for the low load-carrying capacity of the working fluid water. The next section presents the surface shape design concept that is implemented by the TPGA.
3. Design Concept
As described, the HP stroke, in particular its first half, is of importance when designing a surface shape for the piston–cylinder interface. Over this part of the shaft revolution, two effects cause the piston and bore surfaces to suffer a non-conformity preventative of the achievement of their full load-carrying potential via the buildup of hydrodynamic pressure: piston tilt and piston deformation. These are illustrated in Figure 4a,b, respectively. Both are caused by the side load components and . The tilt of the piston allows DC pressure to enter the interface— this amplifies the piston deformation by pushing down on the piston in the region indicated by the arrow in Figure 4b.
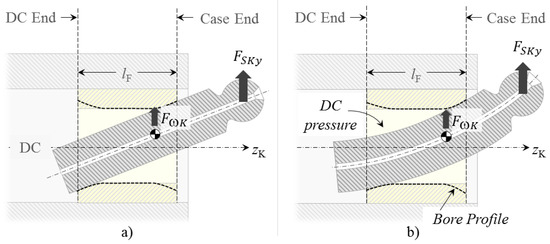
Figure 4.
Piston tilt (a) and deformation (b) over the first ° of the high-pressure stroke.
Sharp metal-to-metal contact at either end of the interface due to piston tilt/deformation can be avoided via microsurface shaping. The TPGA exclusively generates surface shaping for implementation on the bores through which the pistons move, as opposed to surface shaping on the piston itself; this is because if such shaping is implemented on the piston running surface, the segment of the shape that falls within the limits of the lubricating interface changes with shaft angle, making it more difficult to maintain favorable performance over the course of the full shaft revolution. In order to minimize manufacturing complexity and cost, each bore surface shape generated by the TPGA is radially symmetric about the bore centerline, and can be described using a 2-D profile that specifies the shape of the bore surface in a lengthwise cross section over the guide length of the interface, .
These profiles generated by the TPGA are designed for a fixed guide length; they can be used in APMSPD with cylinder block bushings, or with an undercut. An qualitative example of the type of profile generated by this algorithm can be seen in Figure 4b, where it has been overlaid onto the cross section of the bushing as a dashed line. Not only does this profile shape prevent the piston surface from scraping over a sharp 90° edge at the DC and case ends of the interface, but it also brings the piston and bore surfaces close enough together over a large enough lengthwise span to allow for a substantial buildup of contact-preventing hydrodynamic pressure between them. However, the purpose of the TPGA is not simply to generate profiles of this general form—its objective is to tailor the dimensions of such a profile according to the piston tilt and deformation of a given pump geometry, at a given operating condition. That is not to say the general form is not of importance—it is. In fact, much research has been done to conceive the most productive surface shaping. The next section gives a brief overview of what types of shaping have evolved for the piston–cylinder interface over the years.
4. State-of-the-Art in Surface Shaping at the Piston–Cylinder Interface
Surface shaping has been proposed for the piston and bore surfaces in the context of several different objectives. One of the most prominent is the diminution of power loss across the interface. This goal is directly relevant to the present work, in that it can be pursued by the TPGA: by producing surface shaping that improves load support, the TPGA can be employed to reduce mixed friction and eliminate solid friction, which are both sources of power loss for the interface. A considerable number of shape types have been developed to satisfy this objective for APMSPD operating with hydraulic oil. Specifically, a number of shape types have been proposed for the piston running surface: Lasaar and Ivantysynova advocate endowing it with a barrel-like form [9], Ivantysynova, Garrett, and Frederickson patented an axial sine wave contour [20], and the work of Wondergem explores having the axial sine wave contour following the arc of a barrel along the piston length, or giving the surface circumferential sine waves, or simply rounding off the edges at either end to give them the cross section of half a sine wave peak [12,13,14]. Gels and Murrenhoff [11] even proposed a combination of piston and bore shaping: the edges both surfaces are rounded off at either end, giving them the lengthwise cross section of a circular arc.
Pursuit of the interrelated objectives of reducing friction, improving load support, and preventing piston stick has also spawned the development of a variety of shaping design concepts: tapered pistons, as proposed by Yamaguchi [8]; tapered pistons with circumferential grooves, as proposed by Park [10]; circumferential grooves in the surfaces of the bores through which the pistons move, as they appear in the works of Berthold [21] and Bergmann [22]; bores with a lengthwise cross section composed of circular arcs as in the work of [15]; the aforementioned barrel-like piston shapes [9]; as well as the aforementioned rounding of both the piston and bore edges [11]. Adding to the list, a patent by Yoshimura et al. [23] proposes giving three of these edges—those at either end of the piston running surface and the edge of the bore surface at the case end of the interface—a crowning instead of the circular cross section proposed by Gels and Murrenhoff. The basic shape is similar to the design concept pursued by the TPGA; however, unlike that design concept, the patent does not include any shaping on the DC end of the bore; furthermore, it focuses on the case of a variable guide length, when the bore surface through which the piston moves extends beyond the flat end of the piston, and is a function of shaft angle.
To a certain extent, this shape, as well as those produced by the TPGA, mimic the shaping attained through a successful wear-in process, i.e., the process in which the pistons and bores shave material off each other and/or permanently deform each other during the initial runs of the pump until their shapes produce a pressure field that prevents further solid contact (typically, the bore surface is made of a softer material and therefore changes more in this process than the piston). However, the objective of the TPGA is not to predict wear. There are three main reasons for this. First, modeling the solid piston–bore friction that causes wear-in requires experimental data for every material pair of interest, which adds time and cost to the surface shaping design process—Brinkschulte et al., for example, employ an experimentally obtained solid friction coefficient in their model [24]. Second, the surface shape that develops during the wear-in process is not guaranteed to produce the lowest power loss achievable via surface shaping. As will be explained in later sections, the TPGA develops a set of surface shapes, varying in their key dimensions such as not to miss out on designs that score particularly well in terms of interface efficiency. Third and last, in reality, running cylindrical (unshaped) piston and bore surfaces at harsh operating conditions can cause the components to fail during wear-in. In this situation, a wear-predicting model is unlikely to offer a good design solution, and may even experience numerical instability. As will be seen later, the TPGA circumvents this problem by first developing an initial set of surface shapes, which already significantly increase load support, without simulating the physics in the lubricating interface, and then refining that set by taking the physics into account.
The piston–cylinder interface model used to conduct this refinement is such a large and fundamental building block of the TPGA that a brief overview of it will be given in the next section, prior to a detailed description of the TPGA itself.
5. Interface Model
As explained, the TPGA is equipped to generate a suitable bore profile tailored to piston tilt and deformation, but that of course requires a model of the piston–cylinder interface capable of calculating said tilt and deformation over the course of a full drive shaft revolution, and able to assess the performance of the interface in terms load support and power loss. The TPGA utilizes the Maha Fluid Power Research Center state-of-the-art multi-physics model, which simulates the behavior of the three most important APMSPD lubricating interfaces: the piston–cylinder interface, the slipper–swash plate interface, and the cylinder block–valve plate interface. The value of this model is demonstrated by Chacon and Ivantysynova [25], who utilize it as part of an APMSPD virtual prototyping algorithm, ultimately designing and testing an entire 24 cc unit. In avoiding the repeated physical prototyping and measuring associated with the traditional trial-and-error approach to design, the TPGA, using this interface model, is able to drastically cut down on what would otherwise be extremely high, if not prohibitive, development costs.
It should be noted that the TPGA does not make use of the entire interface model; rather, it makes use of the piston–cylinder interface module, developed by Pelosi [26,27], Mizell [28] and Shang [29]. This module simulates the behavior of one, single piston–cylinder interface on its journey around the drive shaft centerline over the course of one shaft revolution. The “behavior” simulated is comprised of the piston’s micro-motion within the fluid film, and the deformation of the adjacent solid bodies due to thermal and fluid pressure loading. Key simulation outputs include the gap height distribution of the fluid film, its pressure and temperature fields, the leakage across it, and the energy dissipation and torque loss that it incurs due to viscous flow. Furthermore, they include an indicator of metal-to-metal contact that can be used to assess the performance of a particular design in terms of its ability to support the required load at a given operating condition [28]. In short, this module supplies all the information required by the TPGA.
Its execution requires two main preprocessing steps. One of these is the computation of the DC pressure as a function of shaft angle. This is done in a separate module, which obtains the chamber pressure using a lumped parameter model, described in [30]. The other preprocessing step required is the generation of influence matrices that the piston–cylinder interface module uses to compute solid body deformation due to pressure loads during runtime [27]. Because calculating these deformations can be computationally expensive, prior to running the interface module, a point load with a certain reference magnitude is imposed on the solid body meshes, and their response to that point load at each possible mesh location is computed and stored in an influence matrix. When the simulation runs, the solid body deformations are obtained by superimposing and appropriately scaling the point loads to reflect the simulated pressure load.
With the DC pressure and influence matrices in hand, the piston–cylinder interface module can be executed. Figure 5 provides an overview of the model: it is comprised of two main loops, an outer loop that computes the solid body temperature distribution and deformations due to thermal loads, and an inner loop that calculates the remaining parameters definitive of the piston–cylinder interface (fluid film height, pressure field, temperature field, etc.) [27,28,29]. The outer loop is only completed once for the entire drive shaft revolution, under the assumption that the solid body temperatures and thermal deformations do not significantly change during that time interval; if needed, the revolution can be simulated repeatedly, until the solid body temperatures converge.
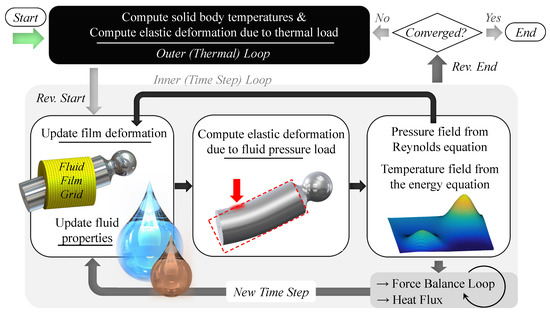
Figure 5.
Maha Fluid Power Research Center in-house fluid–structure–thermal interaction model.
The inner loop progresses through the shaft revolution according to discrete time steps; for each time step, the model updates the fluid film geometry and the fluid properties (the density, viscosity, and bulk modulus, which are functions of the temperature and pressure in the film), it calculates the elastic deformation of the solid bodies due to pressure load using the influence matrix method described earlier, and then it obtains the fluid pressure and temperature fields of the interface [27].
The pressure field is solved for using the Reynolds equation, in the following form [28,29],
The Poiseuille term describes flow driven by pressure gradients, the Couette term describes flow driven by the relative motion of the piston and bore surfaces, the expansion term captures the effect of fluid density changes over time, and the squeeze term expresses the response of the fluid to the piston surface moving towards the bore surface [31]. As the model is made to simulate and design for full film lubrication, it saturates the film thickness to a minimum film thickness of (0.1 m for the case of this work); if the film thickness falls below this, the Reynolds equation is adapted to simulate a parallel gap [28]. The temperature field in the interface is calculated from the energy equation. For the case study to be presented later, the energy equation has been turned off, i.e., the temperature is constant across the interface, in order to avoid numerical instabilities arising from complex pump geometry (the temperature field computed by the energy equation is much less important for water than it would be for oil, because water’s viscosity varies much less with temperature than that of oil [5]).
The described steps of the inner loop repeat until the pressure and temperature fields of the interface converge. Once that convergence is achieved, a force balance loop determines the squeeze motion of the piston, and the heat flux from the interface to the surrounding solid bodies is calculated. The entirety of the inner loop then repeats for the next time step, and the next, until the revolution is complete. Again, if needed, the outer loop can then be repeated. The piston–cylinder interface module assesses the fluid film’s ability to support the load imposed on it via the magnitude of correction forces that are imposed at two control points: and (see Figure 6), when the model detects the possibility of solid contact [28]. Specifically, when the film thickness falls below at any element on the fluid grid, the model assumes that metal-to-metal contact may be taking place, and imposes a contact stress on that element; the magnitude of that stress is proportional to the depth of the piston surface’s penetration into the surrounding bore beyond the separation mark. The correction forces are the forces at control points and resulting from the contact stress on all affected elements. and are both located on the piston centerline: at the DC end of the interface and at the case end. If the magnitude of these forces is high, the predicted solid contact is severe; if it is zero, the model predicts full-film lubrication (i.e., no wear). Component wear-in, which is not accounted for here, can of course diminish the correction forces; however, depending on how harsh the operating condition is, it may not suffice to eliminate them, i.e., prevent solid contact. Furthermore, the resulting surface form is not necessarily conducive to keeping power loss low, and is not necessarily consistent in shape or performance from one piston–cylinder interface to the next. The objective of a surface shape generated for use in a water-lubricated piston–cylinder interface is to eliminate the correction forces, such that the components at the interface will not experience significant wear-in, and in this way avoid the inconsistency, uncertainty, and potential excess power loss associated therewith.
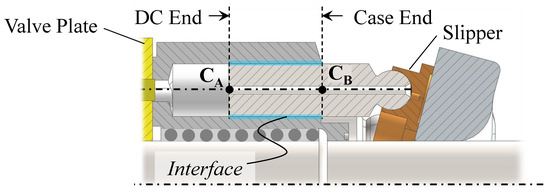
Figure 6.
Control points and .
6. The TPGA
6.1. Algorithm Overview
The TPGA pursues this objective by generating bore profiles according to the design concept explained earlier, bore profiles of the form shown in Figure 7. Fundamentally, this profile is an interpolation passing through a five-point skeleton. The basic idea is to design the profile sections between skeleton points 1 and 2, and between skeleton points 4 and 5, such as to encourage piston-bore conformity of a degree conducive to the buildup of hydrodynamic pressure, specifically over the most challenging part of the shaft revolution, and the section between skeleton points 2 and 4, to be conducive to favorable surface conformity with the piston over other parts of the shaft revolution, during which the tilt and deformation of that component may lessen.
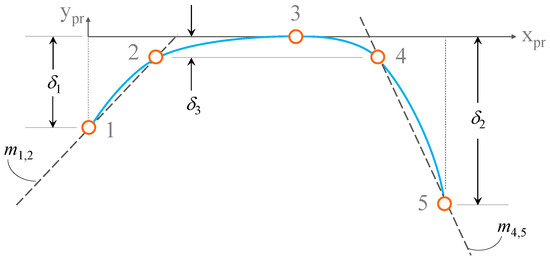
Figure 7.
Form of profiles generated by Tailored Profile Generator Algorithm (TPGA).
The profile shape is specific to a given pump geometry and given operating condition. Nine parameters determine its form: five to define the skeleton points (, , , , and ), and four required by the interpolation scheme (, , , and ). Given a pump geometry, operating condition, and values for seven of the nine parameters— , , , , , , and — the TPGA is able to compute the remaining two parameters: , the slope of the line passing through skeleton points 1 and 2, and , the slope of the line passing through points 4 and 5. These two slopes are critical to the performance of the piston–cylinder interface, especially in terms of load support. By tailoring them according to the simulation results from the model described in Section 5, the TPGA is able to significantly downsize the design space spanning the dimensional variations of this type of profile, thereby cutting the computational cost and time required to develop a suitable profile for a given pump.
However, the values of and —the most influential of the seven aforementioned parameters in terms of load support—must be given by the user as an input, because the described slopes depend on them. The TPGA also treats , and the interpolation parameters , , , and , as inputs. The user is asked to supply a set of value combinations for these seven parameters, and the TPGA will develop a profile for each; when the algorithm terminates, the user may choose the generated profile of best overall performance. The exploration of different value combinations is important because multiple combinations of and can yield full load support, but may differ significantly in terms of power loss. Here, it should be noted that and have been selected as inputs, rather than and , because it is more intuitive for the user to choose reasonable ranges of values to explore for how much should be added to the film thickness at either end of the interface, than for what the slope should be at these locations.
Figure 8 provides an overview of how the inputs are structured and their role in the algorithm. As can be seen, due to the approach taken, the TPGA requires two types of inputs: those common to all profiles to be developed (Table 1) and those unique to each profile (Table 2).
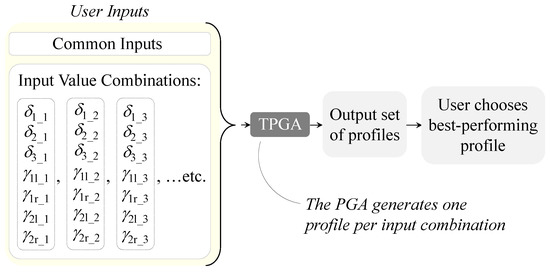
Figure 8.
TPGA input overview.

Table 1.
Most critical common inputs.

Table 2.
Inputs of each value combination.
With these inputs, the TPGA runs through two basic stages; a code overview of the TPGA outlining them is given in Figure 9. Stage 1 generates bore profiles—one profile per user-supplied value combination of the Table 2 parameters—tailored exclusively to piston tilt. That is, the piston is considered rigid, as in Figure 4a. The purpose of this step is to generate an initial set of profiles based solely on pump geometry, without the computational expense of running the piston–cylinder interface model, coming as close as possible to the final, converged set of profiles in order to cut the computational and temporal costs of the overall process. The second stage then “corrects” this initial set of profiles, adapting it to also suit the piston deformation, as in Figure 4b. Stage 1 consists of two steps, to be completed for each user-supplied value combination: first, a set of five skeleton points is set up (step 1.1), second, the bore profile is generated as an interpolation passing through each of those skeleton points (step 1.2). Stage 2 begins with the user simulating the behavior of the piston–cylinder interface with each of the bore profiles from Stage 1 (step 2.1), using the model described in Section 5. The results are employed to adjust the -coordinates of skeleton points 2 and 4, thereby altering the critical slopes of the lines through points 1 and 2, and through points 4 and 5 to better align with the shape of the deformed piston (step 2.2). The piston–cylinder interface is then re-simulated with the revised set of profiles (step 2.3). If the results show one of the profiles to deliver a satisfactory performance, the algorithm ends; otherwise, the user returns to step 2.2. The interpolation inputs (, , , and ) may be tuned along the way as the user sees fit.
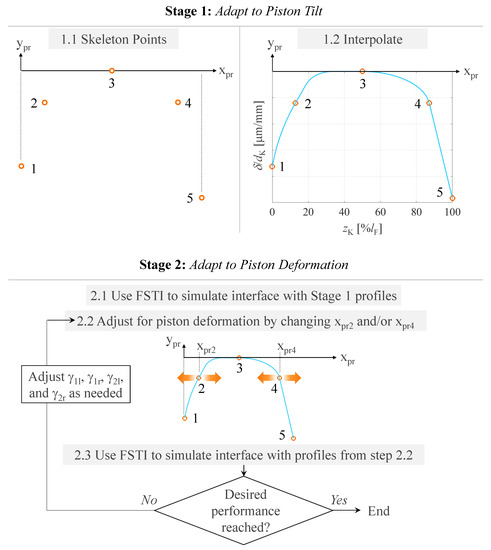
Figure 9.
Overview of the TPGA.
6.2. Stage 1, Step 1.1: Skeleton Points
The skeleton points are key to the development of a profile—they constitute its framework. As explained, in stage 1, that framework is designed to accommodate the tilt of a rigid piston. In order to achieve the desired piston-bore surface conformity at either end of the guide length for such a piston, the bore surface shaping should follow closely the lines describing the piston running surface, depicted as Line 1 and Line 2 in Figure 10. Let the profile be set up in the coordinate system, the former () axis passing from the DC end of the guide length to the case end along the bore surface, parallel to the bore’s centerline (the -axis), and the latter () axis pointing radially inwards towards that centerline. Within the plane spanned by the - and -axes, the stage 1 bore profile should follow Line 2 near the DC end of the fluid film, and Line 3 near the case end (the surface shape to be generated is symmetric about the bore center axis (the -axis), and Line 3 is simply Line 1, rotated 180° about the bore centerline).
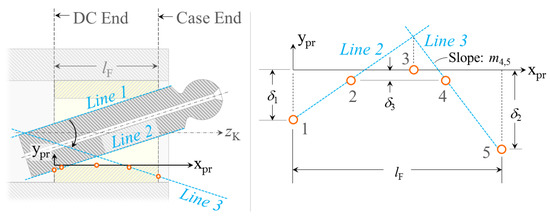
Figure 10.
Defining the skeleton point locations.
Knowing this, the profile skeleton can be set up. The two end points of the profile, at the DC and case ends of the guide length, respectively, are skeleton points 1 and 5. As explained earlier, their -coordinates ( and , respectively) are user inputs. Ensuring that the profile follows lines 2 and 3 at either end, skeleton points 1 and 2 lie on Line 2, and skeleton points 4 and 5 on Line 3. To keep the profile simple and effective, the -coordinates of points 2 and 4 are the same: ; , introduced earlier, is also a user input. This input modifies the vertical extent of the crown of the profile, which is devoted to promoting favorable surface convergence with the piston in operating conditions and/or parts of a shaft revolution that exhibit low piston tilt and/or deformation in comparison to the most extreme condition. In short, the -coordinates of points 2 and 4 are set by the user, while the -coordinates are set by the slopes of Line 2 and 3. Last, skeleton point 3 is the apex of the profile, and therefore situated directly on the -axis. Again, for the sake of simplicity, its -coordinate is the same as the -coordinate of the point where Line 2 intersects Line 3. A summary of the resulting skeleton point coordinates in the system is provided by Table 3.

Table 3.
Skeleton point coordinates.
However, three of these coordinates are a function of , the slope of Line 3. The value of this key parameter can be obtained from the piston–cylinder cross section depicted in Figure 11: shown is the rigid piston, tilting such as to penetrate the bore surface by the user specified values of and at the DC and case ends of the interface, respectively. The slope can be expressed in terms of the angle, , that Line 1 makes with the -axis shown (this axis is parallel to the bore centerline). , in turn, is the difference between two further angles: , the angle between a line through points P1 and P3 (the points where lines 1 and 2 intersect the case and DC ends of the interface, respectively), and the -axis, and , the angle between that same line intersecting P1 and P3, and Line 1. That is:
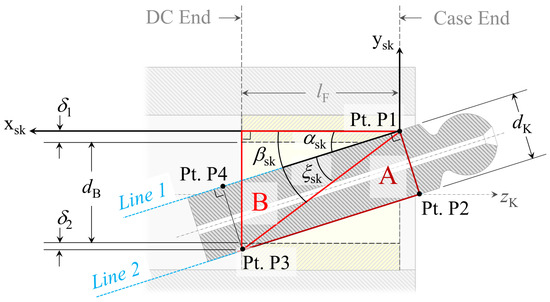
Figure 11.
Pump cross section for expressing in terms of known parameters.
Those two angles can be written in terms of the user inputs , , (piston diameter) and (bore diameter), as follows,
Here, is the line segment between Pt. P2 and Pt. P3, where Pt. P2 is a point on the piston surface circumferentially opposite Pt. P1. Let the line segment between Pt. P1 and Pt. P3 be denoted ; then can be solved for by expressing the square of in terms of the length of the sides of two right triangles, Triangle A and Triangle B:
In terms of known (i.e., user-supplied) parameters, the slope then becomes
6.3. Stage 1, Step 1.2: Interpolation Scheme
The interpolation scheme employed by the TPGA splits each profile into four sections, their borders marked by the five skeleton points—see Figure 12. The interpolation scheme for Sections 1 and 4 is the same, as is the scheme for Sections 2 and 3; for the former, the interpolation is constructed using a single circle, while for the latter, it is constructed using an ellipse, and two tangent lines, denoted Line A and Line B. The TPGA first evaluates the interpolation in Sections 1 and 2, then in Sections 4 and 3 (because the slope of Line A in Sections 2 and 3 depends on the interpolation in Sections 1 and 4, Section 2 must be evaluated after Section 1, and Section 3 after Section 4). Sections 1 and 2 of the profile will now be used as examples to describe the two distinct interpolation schemes in more detail.
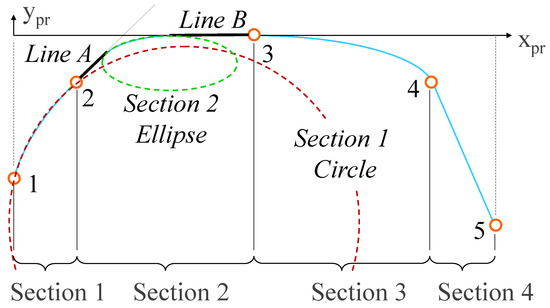
Figure 12.
Interpolation scheme sections.
6.3.1. Interpolation Scheme for Sections 1 and 4
The left-hand image of Figure 13 shows the circle employed to construct the Section 1 interpolation; it passes directly through skeleton points 1 and 2. The interpolation is more convenient to handle in the rotated, right-handed coordinate system, whose origin is set at skeleton point 1, with the -axis moving through skeleton point 2. Within this coordinate system (right-hand image of Figure 13), a subsystem of three points defines the circle: Pt. and Pt. are skeleton points 1 and 2 in the rotated coordinate system, respectively, located at (0,0) and (2L,0), and Pt. is the circle apex, located at (L, ). The geometric constraints defining this circle are given in Table 4, and its defining parameters, comprising its radius, and the - and -coordinates of its center point, are provided in Table 5.

Figure 13.
Constructing the interpolation for Section 1.

Table 4.
Circle constraints.

Table 5.
Defining parameters of the circle.
The circle-defining parameters in Table 5 are functions of the length L, and the -coordinate of the circle apex, . The former can be obtained directly from the coordinates of skeleton points 1 and 2. The latter is set by the user, via specification of the parameter . For interpolation Section 1, is denoted , and for Section 2, , that is, the parameter can be given a different value for those two interpolation sections. , is computed as its maximum allowable value, multiplied by . Thus, if is zero, the interpolation is simply a straight line between skeleton points 1 and 2. If it is one, the apex is at its highest allowable -value. This highest allowable value is set as the lowest of the maximum permissible values, denoted , that arise from three conditions:
- Set , where is the slope of the circle at skeleton point 2 in the coordinate system and is the slope of the straight line passing through skeleton points 2 and 3 (also in the in the coordinate system). This is done because the interpolation in Section 2 is tangent to that of Section 1, and so the set by the Section 1 interpolation scheme cannot be so low as to prevent the Section 2 interpolation from reaching skeleton point 3. is also set to this value in an effort eliminate designs with high leakage across the interface, as a low slope at skeleton point 2 (in the coordinate system) increases the deviation of the profile from the -axis over interpolation Section 2, which may raise the film thickness there.
- Set , where is the slope of the circle at skeleton point 1 in the coordinate system.
- Set (for in the coordinate system).
Once is known, the equation of the circular arc can be evaluated between skeleton points 1 and 2. The result is rotated back into the coordinate system. On a final note towards the Sections 1 and 4 interpolations, as the machining tolerances of points on the bore profile in the direction may not measure up to those of the direction, and as the interpolation in Sections 1 and 4 is prone to changing rapidly with , the circle can be stretched along the axis by the user via a scaling factor.
6.3.2. Interpolation Scheme for Sections 2 and 3
As described, the interpolation of Section 2 is constructed from an ellipse, and two tangent lines. It exhibits a certain similarity to the previous interpolation scheme in that the shape for this section is also defined using a subsystem of three points, and a user inputs. That subsystem is shown in Figure 14: Pt. and Pt. Pt. are skeleton points 2 and 3, respectively, and Pt. is the apex of the ellipse in the right-handed coordinate system, with its origin at skeleton point 2 and its positive -axis passing through skeleton point 3. The geometric constraints defining Line A, Line B, and the ellipse between them based on the coordinates of these points is given by Table 6.
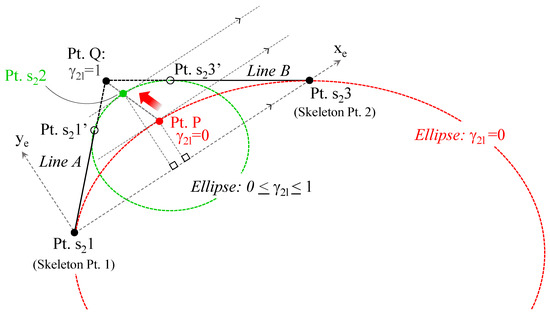
Figure 14.
Constructing the interpolation of Section 2.

Table 6.
Constraints on Line A, Line B, and the ellipse.
The locations of the two skeleton points, Pt. and Pt. , are known. The location of Pt. is set according to a user-specified parameter, (denoted for interpolation Section 2, and for Section 3). If = 0, the Section 2 interpolation consists solely of an ellipse (no tangent lines), see the red ellipse in Figure 14, and the leftmost image in Figure 15. That ellipse is defined as being tangent to the Section 1 interpolation at Pt. , and passing through Pt. , where it has a slope of zero. If = 1, the Section 2 interpolation consists solely of Line A and B (no ellipse), see the rightmost image in Figure 15. If 0 < < 1, the Section 2 interpolation is comprised of an ellipse and two lines, as shown in the middle image of Figure 15.

Figure 15.
Effect of and .
Let Pt. P be the apex of the ellipse in the coordinate system for the case when = 0, and Pt. Q be the point of intersection of Line A with Line B for the case when = 1. Then, for the cases of 0 < 1, Pt. is on the line from Pt. P to Pt. Q, located a distance from Pt. P. , where is the distance form Pt. P to Pt. Q. In essence, the parameter determines how sharp a corner the profile makes in Sections 2 and 3.
6.4. Stage 2, Step 2.2: Adjusting to Deformation
Once a set of profiles has been generated using the interpolation schemes described in the previous section, the behavior of the piston–cylinder interface with each of those profiles is simulated using the model from Section 5 (step 2.1 in the TPGA). Subsequently, the TPGA adjusts the -coordinates of skeleton points 2 and 4 for each profile in order to better tailor it to piston deformation (step 2.2 in the TPGA); Figure 16 gives an overview of how this is done. The five steps shown are repeated for each profile from the stage 1 set. In step 2.2.1, the shaft angle at which the profile being handled will be tailored to piston deformation is determined: it is set as the angle that, according to the corresponding simulation output from step 2.1, exhibits the highest correction force magnitude at either control point, or . Next, step 2.2.2 determines the circumferential location on the fluid film grid at which the bore profile is tailored to the piston shape: it is the circumferential location of the element in the film grid at which the model predicts a film thickness of or less, and on which it imposes the highest contact stress of the entire film at the shaft angle set in step 2.2.1. At the shaft angle and circumferential location set by these two first steps, step 2.2.3 then obtains the contour (shape) of the piston surface to which the bore profile should be tailored.
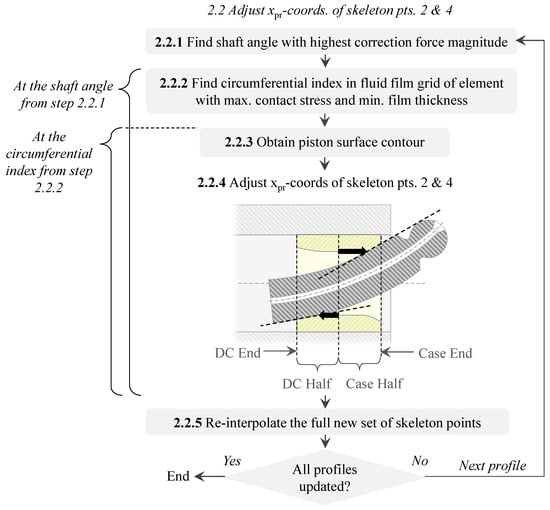
Figure 16.
Adjusting the -coordinates of skeleton points 2 and 4.
Figure 17 illustrates how this contour can be obtained from the simulation results of the piston–cylinder interface model, which include the interface film thickness, as well as the bore deformation due to thermal and pressure loads (step 2.2.3). The TPGA determines the piston contour, , as the vertical distance between the piston surface, and the stage 1 bore profile at the end of the guide length where its deviation from a cylindrical bore is greatest. That is, is the height of the piston surface measured along the axis shown in the figure. As can be seen from the case of the example value, , can be expressed as
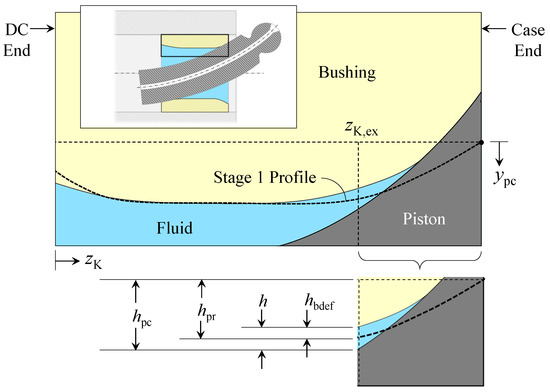
Figure 17.
Obtaining the contour of the deformed piston.
Here, for a given point along the -axis, is the film thickness, is the height of the stage 1 bore profile (measured along the axis), and and are the bore surface deformations due to pressure and thermal loads, respectively.
With the piston contour in hand, the bore profile can be adjusted accordingly, by moving the coordinates of skeleton points 2 and 4 such that the slope of the line through skeleton points 1 and 2, and through skeleton points 4 and 5, more closely follow the piston shape. This raises the question at which point along the -axis should the slopes of each line be made to follow the piston shape? For adjusting the coordinate of skeleton point 2, the TPGA determines this location by starting at the center of the guide length (see the image in Figure 17 under step 2.2.4), and moving along the -axis towards the DC end of the interface until , or .
That is, the TPGA determines at which point the surfaces either physically come together to within or less, or the point at which the surfaces come close enough to build hydrodynamic pressure—thereby introducing additional deformation that the bore profile should not be tailored to, as it may change for the new bore profile. In adjusting the coordinate of skeleton point 4, the TPGA undergoes the same process, except that it moves from the center of the guide length towards the case end of the interface, instead of the DC end. For both cases, the TPGA takes the slope of the piston contour as the slope of a line through two points on the piston contour: the first, at the location determined in step 2.2.4, and the second, a user-specified number of grid points from that location, toward the guide length center. For the simulation results shown in the next section, the user-specified number is set to five so that the slope will not be skewed by local fluctuations.
When the slopes are known, the -coordinates of skeleton points 2 and 4 are moved such that the slope of the line through skeleton points 1 and 2, and the slope of the line through skeleton points 4 and 5, match the computed piston contour slopes. The previously described interpolation scheme is then employed to create a new profile from the new set of skeleton points (step 2.2.5). As can be seen from Figure 17, this process of changing skeleton points 2 and 4 (steps 2.2.1–2.2.5) is completed for each profile generated in stage 1, in sequence. At the end of step 2.2, the Stage 2 profiles are tested in simulation, and, if needed, steps 2.2–2.3 are repeated until a satisfactory result is attained.
7. Case Study
In order to demonstrate what can be achieved via the TPGA, this section presents a case study, in which the algorithm is used to design a bore micro-surface shape for a virtual APMSPD prototype. The designed shape is then tested in a physical prototype. Both prototypes are modified versions of the 444 cc commercial unit described in Table 7. It should be noted that while this unit is a desalination pump, the use of seawater in the physical prototype would add numerous effects (e.g., wear due to sand particles) that makes it difficult to discern how much of the measured changes in the piston and bore surfaces come from solid friction between the components. For a more precise validation, the case study therefore uses only unsalted water that is as close to pure as possible for the prototypes.

Table 7.
Commercial unit: Danfoss APP 38-46 type pump, unit 180B3071 [32].
The virtual prototype will be referred to as Unit 1. It distinguishes itself from the commercial pump in several important points, listed in Table 8. First and foremost, unlike the stock unit, Unit 1 has the aforementioned micro-surface shaping on its cylinder block bushing bore surface, denoted Profile I (to be described in more detail shortly). Second, while the stock unit has a variable guide length ( changes with shaft angle), Unit 1 has a fixed guide length (constant ). This is done because a guide length that varies with shaft angle causes the piston tilt to vary strongly with shaft angle, which causes the manner in which the piston and bore surfaces converge to vary strongly as well. In that case, a surface shape that performs optimally at one shaft angle performs sub-optimally at another.

Table 8.
Key differences between the stock unit from Table 7, Unit 1, and Unit 2.
The third important difference between the stock unit and the prototype is that, in an effort to reduce leakage across the piston–cylinder interface, the minimum piston-bore diametrical clearance of Unit 1 is reduced from that of the stock unit: / = 1.6 m/mm, while /=1.1 m/mm. The fourth difference is that, in aim of enabling the use of harder bushings in the future, their material is set to brass for Unit 1. Fifth, the pistons of the stock unit can have a circumferential groove on them, but not those of Unit 1. Lastly, the swash plate angle of Unit 1 is over higher than that of the stock unit. Consequentially, Unit 1 has a higher piston side load. This makes designing a profile for Unit 1 especially challenging, and demonstrates well the potential of the TPGA.
As a proof-of-concept for the described design changes to the stock unit, a physical prototype has been manufactured and tested: Unit 2. For this purpose, Unit 2 is given a less aggressive swash plate angle: the same as the stock unit. The machine is tested with two rotating kits, RKA and RKB, whose key features are summarized in Table 8. Each rotating kit consists of one cylinder block, nine pistons, and their corresponding slippers and cylinder block bushings, and all rotating kits are tested with purified water as the hydraulic fluid.
RKA is the same as the rotating kit of the stock unit, except that the bushing material is changed to a polymer, and represents the baseline to be tested against. RKB, on the other hand, is the sum of the design changes to be tested. On its cylinder block bushing bores, a slightly modified version of the bore profile developed for Unit 1 is implemented, which will be denoted Profile II (see Figure 18). That is, in order to allow for some variation in the critical slopes at either end of the profile on account of machining tolerances, a small simulation study was conducted, simulating profiles whose slopes deviate a little from those of Profile I. As a result of this study, Profile I has been fine-tuned for manufacturing. The bushing length of RKB, however, is exactly the same as for Unit 1. The piston-bore diametrical clearance of this rotating kit is smaller than that of the stock unit. Specifically, piston and bore diameter measurements for five piston–cylinder interface pairs in the unit exhibit a maximum clearance of / = 1.2 m/mm. The measurement of RKA and RKB is intended to show the effects of the described key features: surface shaping, bushing length, and clearance. The remaining features in Table 8 are the same for RKB as for RKA.
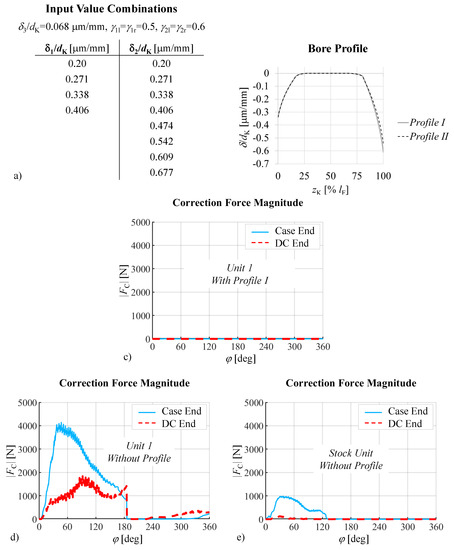
Figure 18.
(a) TPGA inputs; (b) TPGA bore profile; and (c–e) simulation results for = 2.5 bar, = 120 bar, a pump speed of 700 rpm, and an inlet temperature of 20 °C.
The design of the profile for Unit 1 will now be presented, followed by the corresponding simulation results, and, finally, the measurement results from testing the physical prototype Unit 2.
7.1. Simulation Results for Unit 1
As previously explained, the TPGA designs for a specified operating condition. In designing the bore profile for Unit 1, a “worst-case” operating condition is specified: a high outlet pressure and a low pump speed. At this operating condition, the piston side load is high, and the hydrodynamic pressure is diminished by the low speed. For this, the outlet pressure is set to 120 bar, and the pump speed to 700 rpm (the inlet pressure is 2.5 bar, and the inlet temperature, 20 °C). The hydraulic fluid used for the design process is pure .
The desired profiles at the described operating condition have been generated by feeding the TPGA a set of value combinations for , , , , , , and . In order to keep the size of the DOE as small as possible, , , , , and are each assigned one value, consistent across all combinations. Their values are listed at the top of Figure 18a. For the critical parameters of and , on the other hand, all possible combinations of the values listed in the table of Figure 18a are employed. As can be seen, the domain of is set to extend slightly past the nominal radial piston-bore clearance of / = 0.55 /mm. The list of values do not extend that far—this is because opening up the interface near the DC end of the guide length, where the DC pressure pushing on the piston already widens the piston-bore gap, can drastically increase the leakage.
From the set of values in Figure 18a, a set of profiles has been generated by the TPGA. One of the most successful of these, Profile I, is shown in Figure 18b, plotted in the coordinate system, with the -coordinates normalized with respect to piston diameter. The ability of this profile to support load can be assessed by simulating the behavior of the piston–cylinder interface in Unit 1, with the profile imposed on its bores, using the interface model from Section 5. Figure 18c shows the results, specifically, the magnitudes of the correction forces at control points and , plotted against shaft angle. In order for the load on the piston to be fully supported, these forces should be zero. As can be seen, the forces are negligible, indicating full film lubrication.
For comparison, Figure 18d shows the results for the same simulation run without any surface shaping imposed on the bushing bores and without wear-in: the piston and bore surfaces are assumed to be perfectly cylindrical. The correction force magnitudes are on the order of N, indicating the prediction of severe metal-to-metal contact. Simulating the stock unit without surface shaping (i.e., no piston grooves and no wear-in), yields correction forces on the same order of magnitude, but significantly lower, see Figure 18e. In the absence of surface shaping, the lower swash plate angle, longer guide length, and softer bushing material of the stock unit enable its piston–cylinder interfaces to experience less severe piston-bore contact than Unit 1. With the right surface shaping implemented, however, the tables turn, and Unit 1 is able to deliver the desired performance.
7.2. Experimental Results and Discussion
The measurement procedure for Unit 2 consists of three phases. In the first, all non-rotating kit components are run in, such that they will deliver the same performance for each rotating kit. The second phase comprises a series of measurements, performed by each rotating kit (RKA and RKB) at the operating conditions listed in Table 9. Measured parameters include the pump speed, n; the torque transferred through the axle ; the flow out of the pump ; and the inlet and outlet pressures and (see Appendix A for a schematic of the test rig setup and details on sensor accuracy). From these measured parameters, the volumetric, mechanical, and total efficiencies of the pump, respectively, , and , are obtained.

Table 9.
Operating conditions measured ( = 2.5 bar, = 20 °C).
Phase II of the testing procedure also includes taking surface measurements that capture the wear-in process at the piston–cylinder interface. For this, the cylinder block bore and piston surfaces of four such interfaces are measured prior to running the pump, and after each operating condition being tested. Finally, Phase III tests the long-term performance of RKB by retaking the measurements from Phase II after 500 h of run time at OC6.
The first operating condition tested in Phase II is OC1. Figure 19 shows the volumetric, mechanical, and total pump efficiencies obtained from the measured data at this operating condition; a -degree polynomial fit serves to highlight the overall trend of the data. From this, it can be seen that RKB is able to achieve a clearly higher volumetric efficiency than the baseline rotating kit, RKA. For the mechanical efficiency, RKA initially performs better. Over the course of the measurement, however, the efficiencies rise: RKB faster than RKA, until the data of the two begins to overlap. This change in mechanical efficiency is most likely due to wear-in.
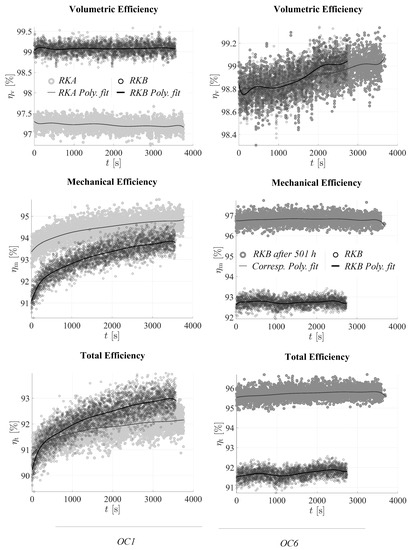
Figure 19.
Measured efficiency for OC1 and OC6.
The resulting total efficiency of RKA and RKB is close. A rigorous comparison of the total efficiency is given in Figure 20, which plots the average of the total efficiency calculated from the last five minutes of measured data for each operating condition tested (outliers outside (70–100%] are omitted), along with error bars indicating one and two standard deviations. Results from Phase II of the measurement procedure are shown in the left section of the plot, while the right section shows a comparison of the results from Phase II to those from Phase III. The normality of the data used to establish the shown averages and standard deviations has been confirmed via Shapiro–Wilk test. From this plot, it can be seen that at OC1 in Phase II, the core of the data, within one standard deviation of the average, is higher for RKB, but if two standard deviations are taken into account (95% of the data), the error bars overlap.
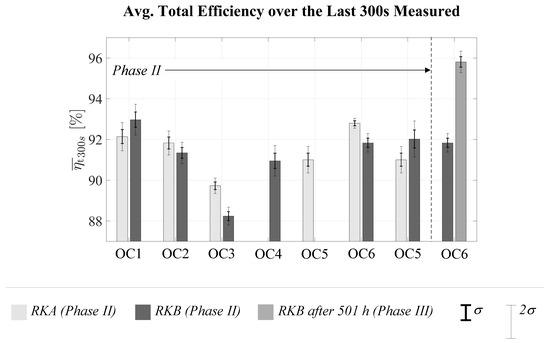
Figure 20.
Average total efficiency over the last 5 min measured.
The next two operating conditions tested, OC2 and OC3, differ from OC1 only in terms of pump speed: 700 rpm for OC1, 1100 rpm for OC2, and 1500 rpm for OC3. As can be seen in Figure 20, with increasing speed, RKA increasingly outperforms RKB in terms of total efficiency. The volumetric efficiency of RKB (see Appendix B) is consistently higher than that of RKA—but RKB is experiencing significant wear-in, most likely due to the piston groove scraping over the edge of the bushing near the DC. This wear can be seen in Figure 21, which shows measurement traces taken lengthwise along the surface of one of the measured bores in RKA, and one in RKB. The traces correspond to two representative circumferential locations (one for RKA and one for RKB). These traces were taken using industry grade 3k measurement equipment that records the (x,y,z) coordinates of the center of a zirconia sphere moving over surface to be mapped along a predefined path, with force feedback sensors ensuring contact between the sphere and surface. The 3-D global calibration tolerance of the machine is ±2 m; however, it should be noted that the local point-to-point tolerance is lower than this.
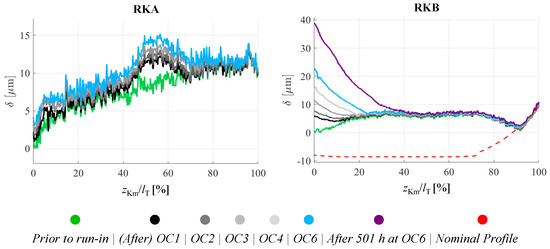
Figure 21.
Surface measurement traces for the bushing bores of RKA and RKB.
For each rotating kit, the traces have been aligned via cross-correlation and stacked in order of measurement, such that the change in shape of the bore surface along each trace over time may be observed. For RKB, in order to show how the manufactured surface profile compares to the the theoretical bore shape, the nominal profile (Profile II) has been aligned with the case end of the measured profile. It should be noted that, as is evident from the section of the nominal profile shown, the measurements do not reach fully to the DC end of the bushing. It can nevertheless be seen that at the circumferential location the RKB plot corresponds to, heavy wear-in occurs on the end of the measurements nearest the DC ( = 0%), while at the other end (the “case end” at = 100%), the profile remains consistent. Although the wear-in is not circumferentially symmetric and wear does occur at the case end for other circumferential locations, the slope of the surface in that region remains relatively consistent with that of the nominal profile. These results suggest that elimination of the piston grooves could drastically improve the mechanical and total efficiencies of RKB. Furthermore, while the case end of the measured traces captures the slope of the nominal profile fairly well, improvements in the manufacturing technique, allowing the measured profile to come closer to the nominal profile, could also make a significant difference the performance of the piston–cylinder interface.
However, RKB does already offer an advantage over RKA in terms of wear. As can be seen from Figure 21, RKA also experiences wear, in the form of a deep pit carved into the bushing surface. This pit can be detrimental to the operation of the interface, because the pump is intended for use with seawater: even with filtering, this will bring small hard particles into the interface, which are likely to catch in the pit. The buildup of such particles can turn the soft bore surface into hard sandpaper, which then wears away at the piston. Piston wear, in turn, increases the thickness of the piston–cylinder interface fluid film, thereby driving up the leakage rate. For RKB, with its fixed guide length on the other hand, the piston can only brush up against the slopes at either end of the bore, which show no such pits.
Moreover, while RKB was able to run at the subsequently tested high-pressure operating condition, OC4, RKA had to be shut down part-way through the measurement in order to prevent large-scale damage to the pump, and was then tested at OC5 instead. Although the measurement results of these two operating conditions cannot be compared directly, notably, the total efficiency measured for RKA at OC4 is on par with that measured for RKB at the lower operating pressure. On account of the failure of RKA to run at =100 bar, the next operating condition, OC6, is of lower pressure, and higher speed. Figure 20 shows that as before, the higher speed effects a higher total efficiency for RKA. As the last step of measurement Phase II, RKB is tested at OC5, showing the total efficiency of RKB to be on par with that of RKA.
Overall, in Phase II, the best performance of RKB is delivered at low-speed operating conditions; however, Phase III demonstrates that running the unit over a longer stretch of time can effect drastic improvements through higher pump operating speed. The right column of Figure 19 shows this by plotting the efficiency measurements taken at OC6 both during Phase II, and after 501 h of run time (at the end of Phase III). As can be seen, the volumetric efficiency does not change significantly from Phase II to the end of Phase III. The mechanical efficiency, however, increases significantly. This suggests that by the end of Phase III, the wear-in process has eliminated a significant percentage of the piston-bore friction that was present in Phase II.
Over the last five minutes of measurement, an average total efficiency of 95.8%, with a standard deviation of 0.26%, is achieved by RKB at OC6. The stock unit, tested in a comparable setup, typically attains a total efficiency of up to 92% [33]. While individual units may reach 1–2% higher than this, still, a noteworthy improvement is achieved with RKB.
8. Conclusions
A novel algorithm for designing the piston–cylinder lubricating interfaces in axial piston machines of swash plate design has been presented. Shaping the bore surfaces through which the pistons of these machines move changes the pressure field of the fluid films between these components. This can be used to raise the load support capacity and efficiency of these films—an approach that is especially powerful for pumps running on low-viscosity fluids, e.g., water. The Tailored Profile Generator Algorithm (TPGA) facilitates speedy development of effective bore shapes by adapting this surface to conform with the that of the corresponding piston in a manner conducive to hydrodynamic pressure buildup. Stage one of the TPGA designs the bore surface based exclusively on piston tilt; this can be done using the nominal pump geometry, and brings the surface shaping close to its final form with minimal computational time/expense. Stage two then corrects the shape to also account for piston deformation, which is obtained using the multi-physics piston–cylinder interface model of the Maha Fluid Power Research Center.
In order to demonstrate the potential of the TPGA, a case study has been presented, comprising the design of a bore surface shape for a virtual prototype, and the measurement of its performance on a physical prototype. Both prototypes are modified versions of a 444 cc stock unit for reverse osmosis applications. Testing of the physical prototype over a range of different operating conditions showed significant wear on the bores, indicating that the grooves in the pistons of this unit, which are likely to be responsible for much of this wear, should be removed. However, despite this challenge, the redesign of the piston–cylinder interface, entailing the shortening of the piston–cylinder interface guide length, the reduction of the piston-bore clearance, and the imposition of the TPGA surface shaping, is able to achieve a total efficiency of 95.8%, with a standard deviation of 0.26%, which is significantly higher than the 92% typically achieved by machines in the stock unit product line [33]. The use of more advanced machining techniques in the future, which allow TPGA surface shaping to be machined to a greater degree of accuracy than in the proof-of-concept case study presented here, could potentially enable further improvement.
Author Contributions
The algorithm presented was developed by M.E., under the guidance of M.I. The testing of the virtual prototype (Unit 1) in simulation was also completed by M.E., under the guidance of M.I. The measurement procedure for testing the physical prototype (Unit 2) was developed by M.E., G.E., and A.V. The production and measurement of Unit 2 was facilitated by G.E., who communicated with the manufacturers of the needed components, organized when and where the measurements should take place, and coordinated with the personnel conducting the measurements in order to ensure that they would run according to plan. The original draft preparation was completed by M.E., with review and edits by A.V. and G.E. All authors have read and agreed to the published version of the manuscript.
Funding
This research was supported by internal funding of Purdue University available at the Maha Fluid Power Research Center.
Acknowledgments
The authors would like to thank Kolb and the entire Danfoss high pressure pump division in Norborg for conducting the measurements of Unit 2. Special thanks also goes to Altair Hyperworks for their software Hypermesh, which was used to generate solid body meshes required to simulate the piston-cylinder interface.
Conflicts of Interest
G.E. is employed at the R&D department of the company whose commercial unit was tested as a baseline against which the performance of the physical prototype Unit 1 can be compared.
Abbreviations
The following abbreviations are used in this manuscript.
| APMSPD | Axial piston machine of swash plate design |
| DC | Displacement chamber |
| HP | High pressure |
| IDC | Inner dead center |
| LP | Low pressure |
| OC | Operating condition |
| ODC | Outer dead center |
| RKA | Rotating kit A |
| RKB | Rotating kit B |
| TPGA | Tailored profile generator algorithm |
Nomenclature
| Symbols | Description | Units |
| Center point of the circular arc describing Sections 1 and 4 of the TPGA profile | m | |
| Control point at the DC end of the piston-cylinder interface | N | |
| Control point at the case end of the piston-cylinder interface | N | |
| Piston diameter | m | |
| Bore diameter | m | |
| F | Force | N |
| Force on piston due to acceleration in axial direction | N | |
| Force on piston end due to DC pressure | N | |
| Reaction force from the swash plate to the slipper pushing on it | N | |
| y-component of | N | |
| Force on piston due to slipper-swash plate friction | N | |
| Force on piston due to viscous friction in interface | N | |
| Force on piston due to centrifugal effect | N | |
| Component of acting in | N | |
| h | Film thickness | m |
| Film thickness in current time step | m | |
| Piston-bore diametrical clearance | m | |
| Film thickness below which the piston and bore surfaces are considered to engage in mixed or solid friction | m | |
| Film thickness in previous time step | m | |
| L | Half the distance between the skeleton points bordering Section 1 (or Section 4) | m |
| Bushing length | m | |
| Guide length | m | |
| Trace length | m | |
| Slope of the TPGA profile at skeleton point 1 | - | |
| Slope of the straight line between skeleton points 1 and 2 | - | |
| Slope of the TPGA profile at skeleton point 2 | - | |
| Slope of the straight line between skeleton points 2 and 3 | - | |
| Slope of the straight line between skeleton points 4 and 5 | - | |
| n | Pump speed | rpm |
| p | Pressure | Pa |
| , | Pressure in low-pressure port, pressure in high-pressure port | Pa |
| , | Inlet pressure, outlet pressure | Pa |
| Flow out of the pump | L/min | |
| Radius of the circular arc describing Sections 1 and 4 of the TPGA profile | m | |
| , | Velocity of bottom surface abutting the lubricating interface, velocity of top surface abutting the interface | m/s |
| -coord. of the apex of the circular arc describing Sections 1 and 4 of the TPGA profile | m | |
| Max. value of permitted by the geometric constraints specified in Section 6.3.1 | m | |
| Pump inlet temperature | °C | |
| Swash plate angle | rad | |
| , | Deviation of TPGA profile from flat at the DC end of the guide length, deviation at the case end of the guide length | m |
| Height of TPGA profile crown between skeleton points 2,3, and 4 | m | |
| , , | Volumetric pump efficiency, mechanical pump efficiency, total pump efficiency | - |
| , | User input setting how pronounced the curvature between in TPGA Sections 1 and 4 is | - |
| , | User input setting how much the corner of TPGA Sections 2 and 3 is rounded off | - |
| Drive shaft angle | deg | |
| Density | kg/ | |
| Dynamic viscosity | Pa·s | |
| Torque transferred through axle | Nm |
Appendix A
Figure A1 provides a schematic of the hydraulic circuit used to test the 444 cc unit. The basic principle behind this efficiency test setup is that the pump under test is attached to an electric motor with a variable frequency drive controlling the pump speed. There are pressure transmitters measuring the inlet and outlet pressures. The pressurized water is throttled back to atmospheric pressure, and the flow is measured using two flow meters, which have different flow ranges in order to enable accurate testing for a variety of pumps. The water being circulated is connected to a tank with heat exchanger and particle filtration technologies.
The total efficiency of the pump is calculated as:
where is calculated as the product of the geometric displacement of the pump, multiplied by its speed. Table A1 lists the sensor accuracy for the measured parameters. However, it should be noted that decades of testing pump efficiency and validating with actual power consumption with customers by Danfoss HPP has shown that, at the flow and pressure ranges relevant to this work, the described test setup captures the total pump efficiency to an accuracy of under ±1%. Furthermore, it is important to distinguish between absolute accuracy and “local accuracy”, i.e., variation in accuracy of measurements taken with the same sensors within a relatively short time span (so that sensor offset and drift can be neglected), as was done in the experiments conducted for the case study presented in this work.
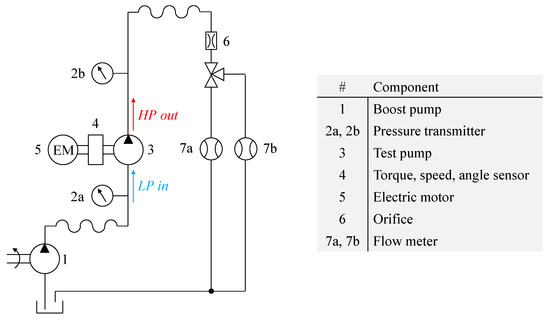
Figure A1.
Test rig schematic.

Table A1.
Sensor accuracy.
Table A1.
Sensor accuracy.
| Measured Parameter | Sensor Accuracy |
|---|---|
| n | ±1.5 rpm |
| ±0.15 bar | |
| ±0.15 bar | |
| ±0.2 Nm | |
| ±40 L/h |
Appendix B
The following two plots show the average of the volumetric and mechanical efficiencies calculated from the last five minutes of measured data for each operating condition tested, along with error bars indicating one and two standard deviations. Both plots are of the same format as Figure 20.
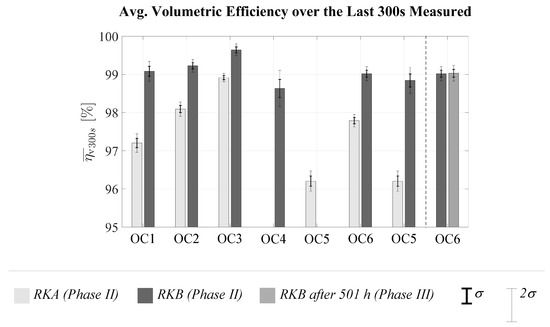
Figure A2.
Average volumetric efficiency over the last 5 min measured.
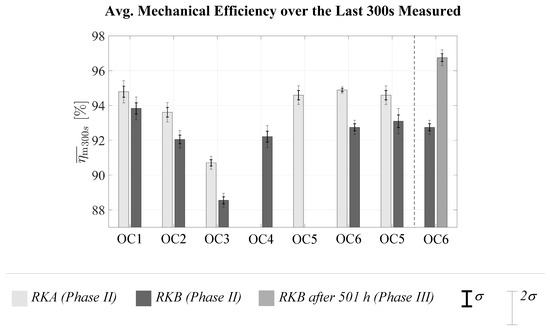
Figure A3.
Average mechanical efficiency over the last 5 min measured.
References
- Ivantysyn, J.; Ivantysynova, M. Hydrostatic Pumps and Motors, Principles, Designs, Performance, Modeling, Analysis, Control and Testing; Academia Books International: New Delhi, India, 2001. [Google Scholar]
- Parr, A. Chapter | two—Hydraulic Pumps and Pressure Regulation. In Hydraulics and Pneumatics, 3rd ed.; Parr, A., Ed.; Butterworth-Heinemann: Oxford, UK, 2011; pp. 31–49. [Google Scholar]
- Trostmann, E. Water Hydraulics Control Technology; Marcel Dekker, Inc.: New York, NY, USA, 1996; pp. 32–58. [Google Scholar]
- Trostmann, E.; Frolund, B.; Olesen, B.H.; Hilbrecht, B. Tap Water as a Hydraulic Pressure Medium; Marcel Dekker, Inc.: New York, NY, USA, 2001; pp. 32–58. [Google Scholar]
- Krutz, G.W.; Chua, P.S.K. Hydraulic Fluid Power—A Historical Timeline. In Proceedings of the Workshop on Water Hydraulics, Agricultural Equipment Technology Conference 9AETC ’04, Louisville, KY, USA, 8–10 February 2004. [Google Scholar]
- Rokala, M. Analysis of Slipper Structures in Water Hydraulic Axial Piston Pumps. Ph.D. Thesis, Tampere University of Technology, Tampere, Finland, 2012. [Google Scholar]
- He, X.; Zhu, B.; Liu, Y.; Jiang, Z. Study on a Seawater Hydraulic Piston Pump with Check Valves for Underwater Tools. Proc. Inst. Mech. Eng. Part J. Power Energy 2012, 226, 151–160. [Google Scholar] [CrossRef]
- Yamaguchi, A. Motion of Pistons in Piston-Type Hydraulic Machines: 3rd Report, Exponential Function-Type Piston. Trans. Jpn. Soc. Mech. Eng. 1976, 19, 413–419. [Google Scholar] [CrossRef]
- Lasaar, R.; Ivantysynova, M. An Investigation into Micro- and Macro Geometric Design of Piston/Cylinder Assembly of Swash Plate Machines. Int. J. Fluid Power 2004, 5, 23–36. [Google Scholar]
- Park, T. Lubrication Analysis Between Piston and Cylinder in High Pressure Piston Pump Considering Circumferential Grooves and Viscosity Variation with Pressure. In Proceedings of the 9th Biennial ASME Conference on Engineering Systems Design and Analysis, Haifa, Israel, 7–9 July 2008. [Google Scholar]
- Gels, S.; Murrenhoff, H. Simulation of the Lubricating Film between Contoured Piston and Cylinder. Int. J. Fluid Power 2010, 11, 15–24. [Google Scholar] [CrossRef]
- Wondergem, A.; Ivantysynova, M. The Impact of the Surface Shape of the Piston on Power Losses. In Proceedings of the 8th FPNI PhD Symposium, Lappeenranta, Finland, 11–13 June 2014. [Google Scholar]
- Wondergem, A.; Ivantysynova, M. The Impact of Micro-Surface Shaping on the Piston/Cylinder Interface of Swash Plate Type Machines. In Proceedings of the ASME/Bath 2015 Symposium on Fluid Power and Motion Control, Chicago, IL, USA, 12–14 October 2015. [Google Scholar]
- Wondergem, A.; Ivantysynova, M. The Impact of Micro-Surface Shaping of the Piston on the Piston/Cylinder Interface of an Axial Piston Machine. In Proceedings of the 10th IFK International Conference on Fluid Power, Dresden, Germany, 8–10 March 2016. [Google Scholar]
- Ernst, M.; Ivantysynova, M. Axial Piston Machine Cylinder Block Bore Surface Profile for High-Pressure Operating Conditions with Water as Working Fluid. In Proceedings of the Global Fluid Power Society PhD Symposium 2018 (GFPS 2018), Samara, Russia, 18–20 July 2018. [Google Scholar]
- Hooke, C.J.; Kakoullis, Y.P. The Effects of Non-Flatness on the Performance of Slippers in Axial Piston Pumps. Proc. Inst. Mech. Eng. Part J. Mech. Eng. Sci. 1983, 197, 239–247. [Google Scholar] [CrossRef]
- Darbani, A.A.; Shang, L.; Beale, J.; Ivantysynova, M. Slipper Surface Geometry Optimization of the Slipper/Swashplate Interface of Swashplate-Type Axial Piston Machines. Int. J. Fluid Power 2019, 16, 35–51. [Google Scholar] [CrossRef]
- Zecchi, M.; Ivantysynova, M. An Investigation of the Impact of Micro Surface Shaping on the Cylinder Block/Valve Plate Inter-face Performance through a Novel Thermo-Elasto-Hydrodynamic Model. In Proceedings of the 7th FPNI PhD Symposium, Reggio Emilia, Italy, 27–30 June 2012; pp. 589–610. [Google Scholar]
- Shin, J.; Kim, K. Effect of Surface Non-Flatness on the Lubrication Characteristics in the Valve Part of a Swash-Plate Type Axial Piston Pump. Meccanica 2014, 49, 1275–1295. [Google Scholar] [CrossRef]
- Ivantysynova, M.; Garrett, R.A.; Frederickson, A.A. Positive Displacement Machine Piston with Wavy Surface Form. U.S. Patent No 20120079936 A1, 5 April 2012. [Google Scholar]
- Berthold, H. Axial Piston Machine Having a Cooling Circuit for the Cylinders and Pistons. U.S. Patent No 5971717 A, 26 October 1999. [Google Scholar]
- Bergmann, M. Axial Piston Machine Utilizing a Swashplate Design. U.S. Patent No 8,104,398 B2, 31 January 2012. [Google Scholar]
- Yoshimura, I.; Nomura, R.; Wada, H.; Sakai, R. Piston of Axial Piston Pump Motor, Cylinder Block of Axial Piston Pump Motor, and Axial Piston Pump Motor. U.S. Patent No 2015/0219215 A1, 6 August 2015. [Google Scholar]
- Brinkschulte, L.; Mattes, J.; Geimer, M. An Approach to Wear Simulation of Hydrostatic Drives to Improve the Availability of Mobile Machines. In Proceedings of the 11th IFK Conference, Aachen, Germany, 19–21 March 2018. [Google Scholar]
- Chacon, R.; Ivantysynova, M. Virtual Prototyping of Axial Piston Machines: Numerical Method and Experimental Validation. Energies 2019, 12, 1674. [Google Scholar] [CrossRef]
- Pelosi, M.; Ivantysynova, M. A novel fluid-structure interaction model for lubricating gaps of piston machines. WIT Trans. Built Environ. 2009, 105, 13–24. [Google Scholar]
- Pelosi, M. An Investigation on the Fluid-Structure Interaction of Piston/Cylinder Interface. Ph.D. Thesis, Purdue University, West Lafayette, IN, USA, 2012. [Google Scholar]
- Mizell, D. A Study of the Piston Cylinder Interface of Axial Piston Machines. Ph.D. Thesis, Purdue University, West Lafayette, IN, USA, 2018. [Google Scholar]
- Shang, L. A Path Toward an Effective Scaling Approach for Axial Piston Machines. Ph.D. Thesis, Purdue University, West Lafayette, IN, USA, 2018. [Google Scholar]
- Kim, T.; Kalbfleisch, P.; Ivantysynova, M. The Effect of Cross Porting on Derived Displacement Volume. Int. J. Fluid Power 2014, 15, 77–85. [Google Scholar] [CrossRef]
- Hamrock, B.J.; Schmid, S.R.; Jacobson, B.O. Fundamentals of Fluid Film Lubrication; Marcel Dekker, Inc.: New York, NY, USA, 2004. [Google Scholar]
- Danfoss. Pump, APP 38 180B3071. Available online: https://store.danfoss.com/en/High-Pressure-Pumps/\Pumps/Pumps-for-Sea-Water/Pump%2C-APP-38/p/180B3071 (accessed on 11 November 2020).
- Danfoss. Making Fresh Water Possible in a Sustainable and Energy-Efficient Way. Available online: https://assets.danfoss.com/documents/DOC298456256052/DOC298456256052.pdf (accessed on 11 November 2020).
Publisher’s Note: MDPI stays neutral with regard to jurisdictional claims in published maps and institutional affiliations. |
© 2020 by the authors. Licensee MDPI, Basel, Switzerland. This article is an open access article distributed under the terms and conditions of the Creative Commons Attribution (CC BY) license (http://creativecommons.org/licenses/by/4.0/).