Abstract
Complex relations exist between issues of poverty, responsibility and just transitions toward reduced household energy use. One proposed transitional instrument is Personal Carbon Accounts (PCAs) which provide equal per capita carbon allowances and increase costs for additional usage. Previously modelled PCAs show that a third of households in poverty must curtail usage or pay more for some of their fuel, hitherto making PCAs ethically and politically untenable. Using the UK’s “Understanding Society” database, average per capita carbon allowances and—using occupancy data—the hypothetical allowance each household would receive within a PCA scheme are calculated. Occupancy levels, equivalised incomes and conversion of expenditure to carbon emissions permit analysis of households emitting more or less carbon compared to their allocation. We demonstrate that households emitting greater than average levels of CO2 do so mainly for lifestyle reasons, irrespective of income. Any calculation of legitimate social and environmental cost of CO2, even for households in poverty, must consider questions of choice and capacity to act. This suggests that even if certain low income, high emitting households are disadvantaged by the transition associated with personal carbon allowances this may still be a just transition.
1. Introduction: Poverty, Climate Justice and Personal Carbon Accounts
1.1. Background
It is clear that if action on climate change is going to be effective, then reducing household energy consumption must be a policy priority. Currently, some 42% of UK emissions come from households through home heating, appliance usage and personal transport (principally road vehicles, public transport and flying, but excluding emissions made when creating produce or products imported from overseas (“embedded carbon”) [1]. Thus, household actions are key to meeting the government’s intention to reduce net carbon emissions in the UK by 100% from the 1990 level by 2050 ([2]; 80% target, amended to 100% in 2019). Between 1990 and 2013, household emissions in the UK were reduced by 20% [3]), a compound rate of 0.7% pa, which leaves a required rate of 3.8% pa from 2013 to 2050 to meet even the original 80% reduction, demonstrating that a change in approach is required.
Hitherto, successive governments worldwide have focused almost entirely on industry to reduce emissions, for example, through the Emissions Trading Scheme in Europe and the retirement of coal fired electricity generation with its replacement by gas fired or renewables. Arguably, this reliance on drivers through regulation, market-based price signals or “economic efficiency” focus attention on total emissions and away from any duty of individual emitters—industrial or households—to mitigate any emissions problem caused by their own behaviours [4]. In the EU, regulatory changes such as the banning of incandescent lightbulbs and increased thermal efficiency of new homes and replacement boilers have not necessitated citizens making any changes of habit or behaviour. Other initiatives such as mandatory energy efficiency ratings for homes for sale or rent invite citizens to make judgements and take action but their significance in behaviour change is unproven. Where energy taxation has been implemented in attempts to change behaviour, it has proved more or less unpopular: carbon and energy taxes have been repealed in Australia and France, respectively, while they continue but are the subject of much debate in Canada ([4,5,6], respectively). In the UK, framing of emissions reduction is still remote from ordinary people [7], and so successive governments, perhaps recognising that change occurs through social path dependency [8], have been reluctant to place responsibility on individuals and have been content to implement European regulation without additional measures. The most ubiquitous environmental behaviour change policy has been the highly successful single-use bag levy. Although this policy is not a climate change focused initiative, the fact that it has been implemented from Italy to Australia and Bangladesh to South Africa demonstrates the potential reach of successful behaviour change initiatives.
Personal Carbon Accounts (PCAs) are one such behaviour change policy, developed almost entirely in the UK primarily before 2012. There are a number of different PCA schemes that vary in their depth of development and their complexity [9,10,11,12], but all contain the same basic features, with carbon points being allocated free to individuals on a regular basis (weekly or monthly), such points then being spent (or “surrendered”) each time fossil fuels are purchased (gas, petrol, diesel, heating oil, coal, electricity) using a debit card system. If the free points are exhausted, additional points must be purchased with each fuel purchase, increasing the effective price of fuel. Allocations are based on an identical full allowance for all adults and a third of an allowance for children, and the sum total of all allowances would initially equal the total domestic consumption in the economy. Thus, the free adult allowance represents an average usage, which is the key relevance for this paper. A key concern with previous feasibility studies of PCA schemes is their likely impact on those in poverty. Concerns have been raised that while the most affluent could easily buy their way out of the constraints of PCAs, poor households would find it more challenging to purchase additional carbon points. Earlier work to address the potentially detrimental impact of PCAs on households in poverty focused on granting additional allowances or additional benefit monies in compensation to those losing out—the over-emitters. A 2009 study calculated the effects of granting extra allocations for housing type, children, age, rural or urban location and being on or off the gas network [13]. This changed allocations for the majority of people, but the overall impact on numbers of over- and under-emitters amongst low-income groups was small, and the amount of information (and cost) required, plus potential for fraud, was large. Attempting to alleviate perceived losses for low-income over-emitters through cash compensation delivered via the benefits system is also complex, as around one million low-income over-emitters do not receive benefits (ibid). Thumim and White calculated that giving children one-third of an adult allowance would minimise the number of over-emitters (over-emitters being losers) [14]: this is an allocation utilised in this paper. By 2010, it was generally understood that a PCA scheme would create low-income losers and that this mitigated against its introduction [15,16], and perhaps as a result we are unaware of any later published research on the social impacts of a PCA implementation either in the UK or elsewhere.
Ten years later in conditions of heightened awareness of climate change coupled with limited progress in CO2 emissions reduction, it is perhaps inadequate to maintain a simple position that schemes to reduce society’s household emissions cannot be introduced because some low-income households have high emissions. The question of how the political difficulties of implementation could be eased leads directly to the key research question underlying this work, which is “Given the wide range of energy usage by households at every income level, and given that high energy usage is regarded as a choice at medium to high levels of income, is there objective evidence to show whether high energy usage can be regarded as a choice at low-income levels, or is there evidence to show that this occurs through lack of choice and force of circumstance?” This approach, and the results generated, are the novelty of the paper.
The concern about low-income households connects to broader debates about fuel poverty and questions of social justice and responsibility that infuse discussions of a just transition towards a more sustainable future (see [17,18]). We do not dispute that most UK housing needs significant energy efficiency improvement: however, UK government figures indicate that only 9.1% of households in the bottom fifth of the income scale are in very energy inefficient housing [19]. If over-emission in low-income households is (in most cases) not a product of poor housing (and thus not an unavoidable aspect of a lower income), it is important to unpack the make-up of low-income over-emitters and consider their capacity to reduce emissions. This paper utilises concerns over the potential impact of PCAs on those in poverty as a context to think through questions of ethics, choice, and justice in the context of action on climate change.
Focusing on the example of PCAs, it is our contention that while the impacts of climate change policies on those in poverty is an important concern, greater nuance is required in understanding the role of poverty as a condition when firstly determining the extent to which people can/should take action on climate change; and secondly when assessing potentially unjust impacts of climate change policy. Through a consideration of a hypothetical PCA system in the UK, this paper offers an analysis of poverty relevant considerations for the implementation of this policy regime. Ultimately, we argue that the potential impacts of a PCA scheme on those in poverty should not prevent its implementation, if these impacts result from high-emissions lifestyle choices. In making this argument we do reflect on the complex relationships between choice, capacity to act and social and environmental justice which it raises.
The first section of this paper begins with a review of relevant literatures related to climate and energy justice, poverty and choice. The second section outlines the data sets and statistical methods that were used to support the analysis presented here. The third section presents the results of our analysis and outlines the socio-demographic characteristics of those in poverty who are most likely to be adversely affected by the introduction of a PCA scheme, and the extent to which the imposed limitations of poverty can be statistically isolated from lifestyle choices. Ultimately, analysis contributes to debates about the practical feasibility of PCAs and broader concerns about the balancing of social need and environmental protection within policies for sustainability.
1.2. Just Transitions to a Low Carbon Future: Responsibility, Choice, Poverty
1.2.1. Respective Capacities and Just Transitions
Questions of equity and justice are important considerations within plans to instigate transitions to low carbon futures. There is an ongoing concern that effective action on climate change should not place an unjust burden on more vulnerable members of society [20], both nationally and internationally. The notion of Common but Differentiated Responsibilities and Respective Capacities (CBDR-RC) is an established principle within the United Nations Framework Convention on Climate Change (1992). Less economically developed countries successfully argued that their contribution to global efforts to tackle the climate crisis should be differentiated from those of more economically developed countries.
Whether nationally or internationally, it is clear that the scale of the climate crisis requires collective action. However, it is widely accepted that climate action should be attributed in proportion to both responsibility for the problem, respective capacity to act on the problem, and the potential impact that action could have on social justice and the right to future development. Internationally, CBDR-RC upholds the principles that climate action does not impede justified development or perpetuate poverty and social injustice. At a national level (at least in the UK), the principles of CBDR-RC appear to work in more implicit and slightly different ways. In the UK, for example, questions of poverty and disadvantage enter climate change deliberations in relation to issues of respective capabilities and their socio-economic conditions. In this sense while there is recognition that collective household action on climate change may ultimately be needed, it is acknowledged that certain households may have greater capabilities to take that action, while others, due to their relative socio-economic position, may be more adversely affected by climate change policies if these are financially based [2]. In understanding the ethical issues that a PCA system could generate, it is necessary to reflect on the relationship between questions of poverty, climate justice, choice, and respective capacities to act.
The notion of just transition [21] contextualises these issues against the political and economic implications of constructing low carbon societies (for an overview see [20]), and seeking to shift analysis away from technical and managerial questions around delivery of a low carbon future to consider the socio-economic impacts of transitions. Work within the field of just transitions considers the distributional issues that are likely to arise from both the negative and positive effects of low carbon transitions. A just transition is thus seen as one in which the unavoidable consequences of moving away from carbon-based fuels (particularly in relation to job losses in the fossil fuel sector, possible increases in energy prices, or uncertainties of energy supply), and the positive effects of change (perhaps access to new revenues in the renewable energy sector, or lower air pollution levels) are evenly distributed throughout society. Our concern in this paper is one that tends to be overlooked within existing work on just transition in that it considers the distributional issues associated with setting allowances for carbon emissions at a personal level. As such we are interested in the potential effects of behavioural incentives to lower carbon emissions on disadvantaged groups, and the extent to which a concern for these groups should qualify and inhibit the policies. This paper does not offer a philosophical reflection on how best to frame and assess the socio-environmental ethics of PCAs (whether it be utilitarian, libertarian, or communitarian). Instead we empirically identify those in poverty who are likely to be (financially) adversely affected by PCAs, and analyse the conditions of poverty that these groups find themselves in.
We develop a statistical approach: data is extracted, derived and summarised from the “Understanding Society” database, which is described in more detail in the Methods section. We are particularly interested in the extent to which the introduction of a PCA would result in disadvantaged groups: 1. having to buy more carbon points (something which could produce or deepen fuel poverty); 2. having to reduce their carbon emissions to a greater extent than wealthier groups (because they cannot buy their way up to their previous consumption level); 3. making necessary lifestyle changes (perhaps driving less or occupying a smaller property). The third scenario would appear to be the least ethically problematic, and unjust outcome, of the introduction of a PCA. However, understanding the capacity to act on climate change requires a careful consideration of the notion of choice within lifestyle, particularly for those in disadvantaged groups. We frame analyses of just transitions in the context of a capabilities approach (see [22]). A capabilities approach challenges narrowly defined utilitarian approaches to ethics and welfare which assess just outcomes in relation to narrowly defined accounts of income and financial redistribution. From a utilitarian point of view, if the over-emission of greenhouse gases by lower income groups is a product of lifestyles choices, then changes in lifestyle can counteract unjust financial penalties and rebalance utilitarian ethical concerns. However, the capabilities approach defines an “evaluative space” within which the impacts of policies are assessed less by fungible financial calculation, and more by their impact on what people are actually able to do (income is not, after all, the only determinant on actions) (ibid). While a capabilities approach would normally focus on the capacity enhancing or diminishing impacts of given interventions, in the context of PCAs it is possible to deploy it to consider what lifestyle changes may, or may not, be possible to achieve for disadvantaged groups. A capabilities approach facilitates a consideration of the social constraints that may inflect so-called lifestyle choices and can help us to avoid overly simplistic accounts of utility exchanges within low carbon transitions. On these terms, a capabilities approach considers questions of poverty and injustice in relation to the material conditions which people find themselves in, such as dwelling type, household appliance ownership and ease of access to public transport.
1.2.2. Poverty, Choice and Decision-Making
The social constraints on action induced by poverty can take many different forms. Few people, high or low income, realise how much of their behaviour is socially controlled, commonly called the fundamental attribution error [23]. Since most people simply want to conform to the social norms, this causes few visible problems, although for policy makers and researchers, it makes understanding the amount of personal volition contained in any decision difficult [24,25]. Purchase decisions are not made purely for utility: every choice has a context of social symbols and meanings and consumers are normally buying items about which they are not expert: they do not think or act like experts [26]. Additionally, an individual’s social and informational interactions with their environment are complicated and unique; attempts by policymakers or analysts to treat them generically will always be problematic [27]. In the energy context, individual perceptions and expectations of comfort influence heating levels, and these are further swayed by habit and perhaps by attitudes to the environment [28]. Financial constraints and practices are also key: such practices are standard fare in household discussions and can be passed down through generations [29]. Future expectations and aspirations play a significant role in determining actions, but actions are not formulated according to economic ideas of homo economicus, but rather they are emotional and socially negotiated (ibid). Financially, “making do” with a less-than-perfect outcome is normal practice [30], particularly if households are short of cash before payday [31]; most people spend most of their money most of the time, irrespective of absolute income level. As societal pressures are tilted towards immediate gratification and the home is seen as an extension of the self [24], it is unsurprising that the data examined in this paper shows that, irrespective of income, many households choose to live in homes with excess rooms, according to the UK Government welfare definitions (discussed in Section 2 below).
Autonomy levels vary with social position: wealthier households have the luxury of more choice [24]. At the other end of the scale, low-income households encountering scarcity have lower capabilities to make good long-term decisions, heightened impulsivity and neglect of long-term consequences, which leads to confusion of causes and consequences of poverty [32]. Research also argues that poverty causes psychological stresses leading to risk aversion which edges those affected towards behaviours which are likely to maintain their poverty [31]. There are considerable forces at work which act on the vulnerable and those on low incomes to mitigate against positive change in their energy consumption. They are less likely to access helpful schemes such as grants [33] or fuel overuse alerts [34] and even simple relationships such as hot water use, impacting primarily their gas bill rather than their water bill can be difficult to absorb [35]. Poverty has coercive effects [36], making optimal long-term planning difficult; lab research shows that exposure to poverty cues causes subjects to choose smaller and closer rewards over larger and more distant [37]. Low-income households are less likely to “shop around” for better fuel deals and switch suppliers [38] and more prone to rapidly changing household circumstances [39], which is more likely to cause problems with unpaid bills; stable households are less likely to experience fuel poverty [40]. There is recognition that environments condition choice [41] and individual agency is not supreme; for example, urban planners’ apparent fixation with the idea that everyone has access to a car creates issues with living close to work, particularly with poorer households congregating in cheaper residential areas [42]. All this is additional to the factors affecting populations across the income scale, such as the symbolisms attached to all purchases referred to above and the underlying persistence of habit in choice [43,44]. Given these social dimensions of decision making, it is perhaps unsurprising that statistical analysis of energy consumption in this study shows little variation in behavioural patterns between low- and high-income households—merely differences of degree.
2. Materials and Methods: Unpacking Justice in UK Carbon Emissions
This section outlines the statistical sources and methods we used in this analysis. A graphical representation of the research approach is given in Figure 1 at the end of this section.
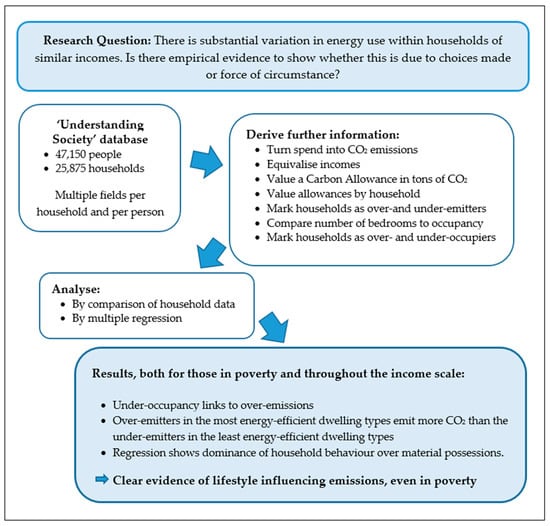
Figure 1.
A Summary of the research approach.
Unfortunately, there is no national UK database explicitly containing CO2 emissions for households (see for example [14,45,46]). Earlier studies of household CO2 emissions have largely been based on the income and expenditure surveys produced by the ONS in combination with detailed data about carbon emissions of different classes of expenditure from bread to clothing. The basis of this study is the Understanding Society database (more correctly, the “UK Household Longitudinal Study”) which has run since 2009; we benefit from better data than available to earlier researchers. It contains annual data on the same households for many items (such as income, housing size and occupants, schooling, expenditure and car use) and triennial data on a range of less central areas (such as transport spend, environmental beliefs), covering both objective and subjective areas. In particular, money spent on fuels is asked every three or four years; in this case, 2012/13 was used as the latest available. The study uses the main survey containing around 47,150 individual records from 25,875 households weighted to the UK population using the 2001 and 2011 Censuses. All results are given on weighted observations. The level of emissions in each household and the total level in the sample population was established by applying standard factors for conversion of spend on electricity, gas, oil and coal to tons of CO2 throughout. Road fuel emissions were calculated by applying standard factors to the car mileages collected in the survey. The conversion factors were taken from an earlier paper [45]. PCAs only consider fuel emissions, not embedded carbon in other purchases, and, therefore, only fuel spend values were converted to emissions.
The value of an individual’s total annual carbon allowance (as anticipated in a hypothetical PCA scheme) is produced from the sum of database emissions divided by the total number of qualifying individuals in the sample, using information on household composition (numbers of adults and ages of children) in the database. Each adult is allocated an allowance and each child a one-third allowance (as above, [14]). Each household’s entitlement is then the value of this allowance multiplied by the qualifying adults and children in that household alone. This allows comparison of emissions to allowances on a household by household basis: households emitting above their allowances are classified as “over-emitters” who would have to purchase additional allowances, and the households emitting below their allowances are classified as “under-emitters” who would have surplus allowances to sell. In relation to our concerns with questions of just transitions, poverty and capacities to act, we are primarily interested in disadvantaged groups who, under this methodology, are identified as over-emitters, and would have to either change their carbon practices, or lifestyles, or purchase more carbon points.
In searching for links to over-emissions, the analysis studied associations between a large number of factors such as housing tenure, car ownership, benefit claiming, employment and environmental attitudes and self-reported environmental behaviours. Home ownership is associated with higher emissions [14]; ownership is a choice, and those homeowners have future choices about fuel usage, insulation levels and/or moving home, though the concept of the elderly “aging in place” is discussed in Section 4.2.
For those renting, choice is also prevalent at all income levels. It is generally considered that poverty measures are best calculated on incomes before housing costs rather than after housing costs [47], the reason being that households exercise significant choice over the cost and nature of housing, particularly over the long term [48]. On a more practical level, for those renting privately, is it reasonable to assume that they can rent properties appropriately sized (i.e., with the “correct” number of bedrooms) or might it be that (say) in certain areas there are no one-bedroom flats available? Consider that in the UK housing benefit restrictions apply to private renters with spare bedrooms, extra rooms cost money and tenants can relocate by a few miles relatively easily. These all suggest that under-occupancy by private renters is a choice. For those renting social housing, the position is more nuanced: whilst the authorities are likely to match the household size to the property offered initially, this will not always be the case and prospective tenants may have limited or no ability to refuse any property being offered to them. Over time occupancy may change with limited flexibility of the tenants to relocate. Vociferous opposition from housing charities [49], political parties [50] and sections of the media highlight examples where they consider the ability to relocate to smaller properties is a mirage: an investigation by one quality newspaper claimed that up to 96% of tenants were unable to do so [51]. Consequently, it is considered in this paper that under-occupancy is a choice for owners and private renters but renters in social housing will be regarded as fully occupying.
Household net incomes (after taxes and including benefits) were equivalised using the modified OECD factors, being 1 for the first adult, 0.5 for second and subsequent adults and 0.3 for children under 14. Equivalisation approximates how well-off households of different incomes and sizes are, for example, a single person household earning GBP 15,000 a year is considered to be as well off as a couple with two children earning GBP 31,500 a year—15 divided by 1 equals 31.5 divided by 2.1. The sample was ranked by equivalised incomes and divided into two parts: those above and below the relative income poverty line calculated according to the “widely accepted” rule in the UK, being 60% of median net income before housing costs [47]. This is straightforward to calculate but ignores household assets or measures of material deprivation. The majority of further analysis took place on those in designated poverty (the smaller sub-sample, about 14.0% of households, 2852 records). However, we also consider carbon injustice in relation to more qualitative capacities to act. Note that Understanding Society data relies on individual recall at one point in the year to produce data for the whole year, which is immediately approximate, though there is no apparent reason for it to skew the data in any direction.
A number of variables were constructed: in particular, a yardstick for occupancy is required to determine the number of bedrooms required by the household (and hence over- or under-occupancy). The recognised yardstick which exists is that set out in the Welfare Reform Act 2012 which requires one bedroom for each person aged 16 or over not cohabiting, one bedroom for different sex children aged 11–16 and a maximum of two children under 10 or two same-sex children aged 11–16 per bedroom. In this study, the definition was relaxed somewhat to allow one bedroom for each child over 11 irrespective of gender. Given the apparent widespread under-occupancy of social housing under this definition (36.6% in the database), it demonstrates the aim of the legislation, being to persuade social housing under-occupiers to move to accommodation which the government regards as appropriately sized in order to make better use of the social housing stock, but it is widely suggested that this is not possible. For example, at November 2013, the Scottish Government reported that 52,000 households were required to downsize to one-bedroom properties; that 20,000 became available each year; and that 22,000 homeless people needed to be housed each year and so were in competition for the same properties [52]. The definition imposes what is widely referred to as the “bedroom tax” on under-occupancy by social housing tenants who cannot or will not move. Tenants are penalised 14% of their housing benefit for one spare bedroom and 25% for two or more. The policy has been much maligned, in particular because those who lose out include a disproportionate number of registered disabled—an estimated 80% of affected households in Scotland contained a disabled adult [53] or “almost ⅔” overall [54]. There are also issues about cultural differences in the use of rooms not being taken account of [55]. Importantly, and given the concern about the impact of the definition on social housing, none of the key results presented here are dependent on occupancy levels of social housing. The discussion in this paper is not about whether the Welfare Reform Act works in terms of persuading people to relocate or whether it causes future social housing tenancies to be appropriately sized at their outset, or whether it is blunt, cruel and inappropriate-but about whether it is a broadly sensible yardstick for analysing the population as a whole. In overall numbers of households, the social housing sector is relatively small (whole population, 16.5% [56]: of those in poverty, 31.8% are in social housing (authors)), and there is a much larger issue of under-occupancy in the private renting and house-owning population; for example, in this database, 55% of those in poverty own their homes, and 64% under-occupy on the definition used (67% and 70% in the database as a whole). At a time of a fuel emissions crisis, as a yardstick to divide the population as a whole into over- and under-occupied dwellings to enable analysis of patterns in the data, we believe it is not unreasonable.
Initially, general analysis was undertaken to understand the composition of households: Section 3.1,Section 3.2,Section 3.3 and Section 3.4, Figure 2, Figure 3, Figure 4 and Figure 5, Table 1 and Table 2. This was followed by principal component analysis and rotated factor analysis to try to establish key variables. For principal component analysis, 14 factors were required to explain 50% of the data variance—not a helpful result. A better result was obtained for rotated factor analysis, 4 factors explained 50% of the data in each of the individual cases (Appendix A). Two understandings were gained: firstly, that only one of the components (“consumers”), linking wages, adult numbers, cars, employment, rooms, home ownership and consumer goods, was significantly related to emissions, and, secondly, as a corollary of this, environmental beliefs and habits were virtually unrelated to emissions.
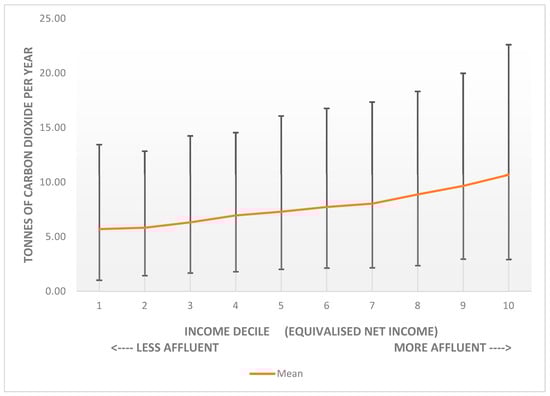
Figure 2.
Emissions in tons of CO2 by income decile. Annual CO2 emissions from homes and vehicles by equivalised household disposable income decile showing means and the ranges in which 95% of households lie. The deciles are ten equal-sized groups ranked by equivalised incomes. Income before housing costs. Those in poverty are the lowest decile and 40% of the second decile. (Source: author, after [60]).
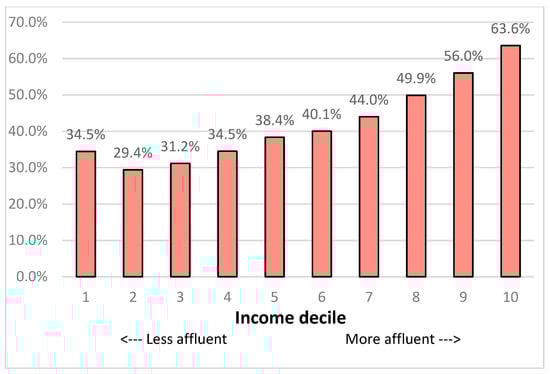
Figure 3.
Over-emitters as a percentage of income deciles (the deciles are ten equal-sized groups ranked by equivalised incomes). Those in poverty are the lowest decile and 40% of the second decile. The practical interpretation of this chart is that (for example) 44.0% of households in Decile 7 would pay for more allowances, but only on the proportion of their fuel spend above the free allowance.
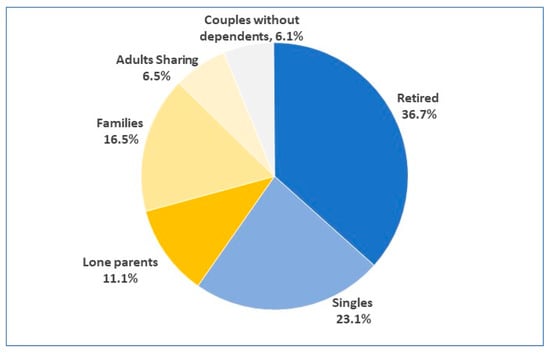
Figure 4.
Proportions of different household types in the relative income poverty band.
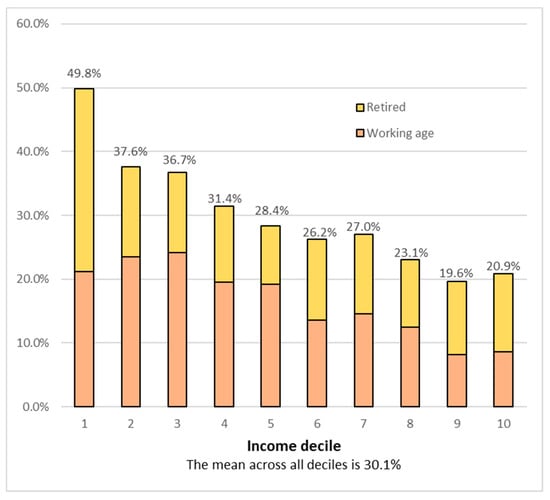
Figure 5.
Percentage of single person households by income decile. Using household equivalent net income before housing costs.

Table 1.
Mean total household emissions (home and road fuel in tons CO2) by household type: those in poverty.
Table 2.
Analysis of housing type and emissions (including transport) for those in poverty.
To determine any underlying relationships, a very large number of least-squares multivariate regressions were then performed on the database, split into under- and over-emitting households. There is a huge choice of data fields to use including household specific data such as household income, dwelling tenure type, size, ages and gender of occupants, fuel type(s) and expenditure(s), numbers of cars and types of household appliance used. It also includes personal data and opinions of the occupants, such as types of benefits received and multiple questions on feelings about health, lifestyle and the environment. Stepwise elimination of factors was undertaken to reduce the number of factors to the main indicators shown in Table 3 and Table 4 by eliminating factors with β-values of less than 0.05 in both under- and over-emitter models and then re-running the model. With such low β-values, the factor eliminated changed the adjusted r2 figure minimally, typically at the 3rd or 4th decimal place. The final results are shown in Section 3.6, before being placed in the context of “just transitions”, poverty and capacity to act.
Table 3.
Simple regression model of total household emissions by under- and over-emitters: those in poverty only.
Table 4.
Simple regression model of total household emissions by under- and over-emitters: whole population, all incomes.
3. Results: Unpacking the Social Impact of a Personal Carbon Allowance Scheme in the UK
3.1. Emissions Levels and Income
Analysis of government expenditure and food surveys indicated that 58% of households in the UK would emit less than their allowances and so would be financially better off under PCAs [57], a figure supported by the data underlying this study. Thus, this outcome from a PCA implementation would provide a progressive act of redistributional social justice, for some, alongside the environmental gains produced by the proposed PCA scheme. However, analysis also shows that around a third of low-income households would emit more than their allowances and be worse off if they did not change their lifestyles. Any significant number of households in poverty losing out under a policy would be likely to eliminate that policy as a political option [58].
Mean household emissions rise with income [14,59,60] and previous transnational work has established wide variation, up to two or three times, in emissions from identical homes occupied by different users (e.g., [61,62]). A consequence is that households at all income levels under- or over-consume compared to the allowances they would receive under a PCA scheme. Emissions variation is demonstrated graphically by the error bars in Figure 2, drawn from the Understanding Society database used in this study.
Mean emissions level rises with income decile, but the spread of emissions for each decile is great; there are many households in poverty emitting more than many households in the highest income decile. As mentioned in the Introduction, only 9.1% of households in the bottom fifth of the income scale are in very energy inefficient homes [19]: figures for other quintiles are not dissimilar; the chart is prima facie evidence of lifestyle impacting emissions more than economic circumstance. Examination of the underlying data, particularly in terms of emissions by dwelling type, occupancy and regression analysis (regressing emissions against household characteristics) underlines this more conclusively (Table 2 and Section 3.4 and Section 3.6).
3.2. Proportion of High Emitters
Figure 2 shows the spread of emissions in each household income decile but not the proportions of under- and over-emitters. To visualise this, data for over-emissions by income decile was calculated (Figure 3). It shows that 32.4% of households in poverty emit more than their carbon allowances. The proportion of each decile over-emitting varies from 29% to 64% in the dataset.
3.3. Relative Income Poverty: Composition and Emissions of Households
In trying to visualise the underlying issues with fuel use in households in the relative income poverty band, analysing them by the type and number of occupants is instructive. Firstly, the analysis shows that in the database 14.0% of households are in relative income poverty as these are analysed by household type in Figure 4. Of these, only 28% are lone parents and families.
Mean household size increases sharply through the lowest income deciles due to the proportions of single-person households (both retired and working age) declining, as shown in Figure 5. In particular, the number of retired single person households in the lowest income decile is very significant—pensioner poverty in evidence.
In terms of CO2 emissions, this shows that the poorest also have the lowest number of carbon allowances per household on average, and they lack the economies of scale for home heating gained by larger households [14,46,63,64]. Prima facie, it strengthens an argument for uncontrollable “circumstances” (principally being old and/or alone) being a larger cause of over-emissions than controllable “lifestyle” (heating, lighting and driving practices) for those in poverty.
However, suggestions that “circumstances” may be the dominant factor in over-emissions are rebutted by statistical analysis. Firstly, there is a significant statistical difference between mean emissions of under-emitters and over-emitters, significant at 99.9% for all household types (Table 1). The over-emitters emit more than twice the under-emitters for all household types, except lone parents (only 1.9× differential).
This table further demonstrates the huge spread of emissions. It is an indicator that lifestyle is relevant to over-emissions independent of household composition, but it disguises mix effects due to housing type, income and many other variables.
Secondly, analysing by dwelling type shows clearly that detached and semi-detached homes are more likely to have higher emissions than others (Table 2). However, it also shows that the mean emissions of a typical over-emitting household in a flat (on average the most fuel efficient dwellings) are greater than those of a typical under-emitting detached household (on average the least fuel efficient dwellings). On an individual basis, this might reflect circumstances, but when considered in aggregate, this would appear to offer conclusive numerical proof that emissions are very dependent on lifestyle in its broadest sense (heating, driving, appliance usage), even for those at the lowest earning end of the income spectrum.
The data in Table 2 demonstrates that choice of dwelling type influences emissions but that other factors (both measurable and lifestyle) affect emissions more than the simple choice of dwelling. Numbers of rooms in the home are known to be positively correlated to emissions [14].
3.4. Relative Income Poverty by Tenure and Occupancy Levels
Section 3.1 highlights that household type and size are important to relative emissions; tenure and occupancy levels were examined further. When considering tenure of homes, 55% of those in poverty are homeowners, compared to a nationally quoted whole population average of 64% [65] and a weighted average in this database of 67%. Of those over-emitters in poverty, 68% are homeowners, reiterating that home ownership is associated with higher emissions [14,66]. Owned homes are on average more than one room (total number of rooms excluding kitchen and bathroom) larger than rented homes (means: owned = 4.58 rooms, rented = 3.44, n = 2796, sig. at 99.9%). For working age households, household size for owned homes are larger than rented homes by only 0.26 of a person on average (means: owned = 2.61, rented = 2.35, n = 1852, sig at 95%). For retired households, the same is also true, although the household sizes are very much smaller (room means: owned = 4.35, rented = 3.14 n = 944, sig. at 99.9%; household size—means: owned = 1.36, rented = 1.26, n = 944, not significant). Importantly, both sets of figures support the idea that under-occupancy amongst homeowners is a choice. A total of 64% of those in poverty under-occupy their homes, and for over-emitters in poverty, the figure is a remarkable 82%. It is known that only 28% of households under-occupying their homes reduce heating in the unoccupied bedrooms [67].
Closely related to under-occupancy is the predominance of single person households (of all ages) in the over-emitters. Whilst single person households make up 30% of the UK population sample, they represent 47.5% of those in poverty and of these close to half (45%) over-emit compared to their allowances, making up 65% of all over-emitters in poverty. Further analysis indicates that within the poverty band, emitting over the household’s allocated allowances is more related to occupant numbers than household income.
Retired households make up 42% of the over-emitters in poverty; 89% of these own their own homes. A total of 96% of the retired, home-owning over-emitters under-occupy their properties, and they may be defined as being in relative income poverty, but they have assets and hence longer-term choices about lifestyle.
3.5. Fuel Poverty
The study shows that over-emissions and fuel poverty are related and may have the same root causes. Overall, 46% of those in poverty are also in fuel poverty (using the 10% test—households in fuel poverty need to spend over 10% of their income to maintain an adequate heating regime [68]. This underestimates fuel poverty as some will underspend and be underheated.), but 81% of over-emitters in poverty are in fuel poverty; that is to say that they have a household income less than 60% of the median and spend more than 10% of their income on fuel. Of particular note because of the concern over whether social housing tenants have a choice about under-occupying their homes is that 20% of social housing tenants are over-emitters, but 82% of these are in fuel poverty and 53% under-occupy. For the 80% of social housing tenants who under-emit, only 25% are in fuel poverty and only 34% under-occupy. These are stark differences. Over the whole UK population, some 64% of those in fuel poverty own their own homes, and 80% under-occupy them.
3.6. Regression Analysis
In trying to find connections and explanations between household emissions levels and elements of the data, a large number of regressions were run on the data, regressing emissions against predictor variables. Two tables of results of “simple” regressions are shown in Table 3 and Table 4. More complex regressions with larger numbers of factors improve the fit (as measured by adjusted r-squared values) marginally, but the standardised beta factors for these additional variables (the beta being a measure of the impact of that factor on the total result) are tiny, and these tables are not presented to preserve clarity. In particular, and as expected given the results from the rotated factor analysis (referred to in the Methodology, Section 2), the environmental variables (beliefs and habits) do not feature as good predictors of emissions.
Table 3 and Table 4 show that the under- and over-emitters in poverty and in the whole population can be described as two pairs of statistically different populations with high regression coefficients in excess of 0.55.
Determination of statistical difference is given by the z coefficient on the right hand side of the table. It compares the beta values of the same variable between the two populations: if over 1.96 then the coefficients (and hence the populations) are different with 95% certainty (z > 2.58 for 99% significance). Those z values over 1.96 are highlighted. For the whole population regression (Table 4), eight of the nine variables have statistically different coefficients at the 99% certainty level.
The two key results are that (a) the populations of under- and over-emitting households can be shown to be statistically different and (b) independent of all other variables, in over-emitting households, the emissions associated with people are over twice those in under-emitting households and a key determinant of overall emissions—a clear statement of lifestyle choices impacting emissions. This is derived from the regression results by consideration of two factors—the coefficients and the beta factors. For the whole population (Table 4), for adults in over-emitting households, the coefficient of 2.97 is 2.3× the coefficient of 1.27 for the under-emitters. Additionally, the beta factors of 0.37 and 0.41 are the highest of any of the variables in the model, demonstrating the importance of adults in the model. The coefficient differences (z-scores) for adults in the models in Table 3 (households in poverty) and Table 4 (all households) are also the most significant in either model.
For the households in poverty, the difference in the coefficients for adults and children between over-emitters and under-emitters is more than a factor of three. Such a result suggests that lifestyle choices are even more relevant to those in poverty than for households in the general population.
For convenience, the key results are drawn together in Table 5.
Table 5.
Summary of key findings from data analysis.
4. Discussion
4.1. Capacity to Act
Previous policy discussions of PCAs in the UK have resulted in them being dismissed due (in part) to their adverse impacts on those in poverty and their association with an unjust transition to a low carbon future [14]. The analysis presented in this paper recognises the relationship between the introduction of a PCA scheme and potential injustice in low carbon transition. The statistical analysis presented here, however, suggests that the likely causes of over-emission among household in poverty in the UK behoves us to consider more carefully the questions of respective capacities to act. The results of this analysis also have implications for how we think about the broader relations between poverty, choice and just transitions.
Our results indicate that “lifestyle” in its broadest sense is the major contributor to over-average emissions by households, though it cannot determine from the data whether these are conscious or unconscious actions (or “choices”?), important in relation to questions of capacity to act. For example, a study of electrically heated homes with poor Energy Performance Certificates of E-G reported that few householders understand their heating controls or have a mental vision of energy and that the negotiation of energy use across the household was problematic [69], a result replicated elsewhere [70]. Accordingly, a recent study found that almost a third of benefits of reduced energy use came from tenant education and practice changes [71], and another suggested that only 40% of variation in energy use is explained by physical and economic factors [72], findings that sit well with the results of this paper. Thus, the capabilities of households appear to play a very significant role in their emissions level.
Our analysis reveals that in the UK, the primary determining factor leading to over-emissions for households in poverty is the under-occupancy of property (see Table 5). This has particular relevance for single occupants, because arguably giving the first occupant of a property a single carbon allowance for fuel is insufficient to reflect the reality of fuel required; alternatively, the figures reflect the inefficiency of heating single person households and makes a case for their discouragement by only allocating them a single carbon allowance. Pragmatically, if a government introduced a PCA scheme then it is unlikely to encourage individuals to live alone by allocating them additional allowances, a measure which would not only counteract the principle of one allowance per adult underlying PCAs but also introduce continuous administrative complications for monitoring the ever-changing picture of who is living alone. There are also health implications of living alone: a further disincentive for government support for single occupation is that loneliness is becoming regarded as a major cause of premature deaths [73].
Given that under-occupying a property is not a defining characteristic of being in poverty, and is, in part, a lifestyle choice, it is important to consider the capacities to act on that choice (and how these capacities may be influenced by poverty). As a lifestyle choice, it is clear that addressing under-occupancy is at the more burdensome end of the choice spectrum. Of course, for some in social housing, or those who have inherited a property, the original choice to occupy the particular property they dwell in may ultimately have been made by others. For others, dwelling decisions may have been made many years ago under very different demographic and economic circumstances (what is now under-occupancy in poverty may once have been full occupancy above the poverty line, particularly for retirees). Choice here is about the decision to stay or move from a property—it is in this context that questions of capacities to act become important. The costs of changing property may mean that those in poverty have less opportunity to move than those who are wealthier. Beyond financial considerations, the capacity to move dwelling is also conditioned by attachment to a particular house and geographical location (which may afford its own capacities on its inhabitants, see [74]), age, physical capacity and any reduction in mental capacity caused by poverty itself [31,32,37].
4.2. Choice Limitation: Old Age
When considering older under-occupiers, it is often claimed that people prefer to “age in place” rather than relocate (e.g., [75]) as it is known that attachments to local environments, neighbourhoods and communities preserve emotional wellbeing [76]). This feeds into a notion that people should remain in place for as long as possible to enable them to stay independent and limit the cost to the state [77]). Furthermore, guiding or incentivising households to move to smaller accommodation creates issues of freedom and liberty [78]. Emotional issues are important: research indicates a desire not to move into a residential home because of perceived loss of autonomy [79]. However, focus group work shows a significant difference between people’s attitudes to remaining in the locality and their remaining in the same home, in contrast to much of the literature that conflates the two; people are attached to a community, not simply to a single property (ibid). This suggests that the reasons for older people preferring to remain in larger homes are complicated and may be a simple as lack of suitable alternatives or lack of mental or physical capability to discard possessions and clear rooms [80]. In the UK, a complex mortgage market exists which enables financially distressed homeowners to drawdown equity or relocate to a smaller property [81]. The same work correlates two different sources showing that homeowners rarely become renters late in life, which would be a very logical choice for many of the less mobile elderly (ibid). So, the reasons for under-occupation by the elderly may be unrelated to finance, and are complex; many could be loosely grouped into a category labelled “emotional inertia” (however understandable) and very few into a category labelled “force of circumstance”. Arguably, reasons other than “force of circumstance” are conscious or unconscious choices.
4.3. Choice Limitation: Social Norms
Social practice research is important in any discussion of unconscious actions. Many researchers have held that complying with social norms is a key driver of energy usage, particularly in hygiene—the avoidance of any potential to emit odours from body or clothing—[82], and car choice [26]. Both these—and many other papers—suggest that compliance with social norms trump any considerations of energy saving. However, given the range of emission levels at any income level (Figure 2), in aggregate, households appear to choose, at least in energy terms, how they comply with social norms.
4.4. Responsibility and Justice
At one level, it is clear that the over-emissions caused by living in an under-occupied dwelling generate a responsibility to act on those emissions (even those in poverty are disproportionately contributing to a collective socio-environment problem) (see Table 5). However, if under-occupancy is a result of being forced to occupy a given property by housing authorities, then clearly responsibility is partially abrogated. Potentially this implies that allowances may need to be made within any PCA scheme for those who do not have choice over the property they inhabit. For those in poverty under-occupying their homes, under a PCA scheme they will either need to change their everyday lifestyles to reduce emissions, pay more for the over-emissions they produce, invest in energy efficiency or low carbon energy, or move property. While each of these options may be deemed a legitimate expectation and choice for over-emitters in poverty, they do raise broader justice issues. Is it fair, for example, that only wealthy people should be allowed to under-occupy their properties, or indeed buy their way into unsustainable energy use patterns? But from an alternative perspective, generating a moderate financial incentive for those in poverty who are under-occupying their homes to move, could reduce fuel poverty in the long-term and generate new lifestyle choices and capacities. Our analysis indicates that a sensitively administered PCA scheme (acknowledging the constrained choices of those in the social housing sector, and support for those wishing to downsize their dwelling) could help to address the problems of climate change without generating unethical forms of social injustice.
4.5. Limitations, Literature and Further Work
The most obvious limitation of the research is geographical: the data is based only on a single economy in the global north. However, since multiple global north researchers report wide variation in use between households in the same economy (e.g., [83,84]), applicability may be more general. It would be of great interest to know if the findings reported here are replicated in advanced and developing worlds where cultures, occupancy levels and average emission levels are very different, such as China, the USA and Japan. The variation in human nature across all societies suggests that energy behaviours in low-income sectors of other cultures will also vary, and that the results could be applicable internationally.
A second limitation concerns measures of material deprivation—other than relative income poverty—and their links to fuel usage: low levels of data completion for these fields hindered our ability to research this. Lastly, while there is no indication that environmental beliefs link to energy usage, and the existence of the “value-action gap” is well known, we would perhaps use alternative questions if we wished to design a specific test for this.
We believe this paper extends the wider literature in carbon emissions reduction, much of which is concerned with global emission trends and comparisons between countries (e.g., [85]), emissions trading schemes on both large and small scales (e.g., [86,87,88]) and carbon taxes (being a sales tax in nature) [4,89]. Some discuss equity distribution questions (e.g., [90]) but do not study variations of emissions between households of similar incomes, an issue which has been known for many years [91] but which was difficult to study statistically until recently due to the lack of comprehensive databases in many geographies. As such, we are not aware of any directly comparable papers.
It would be interesting to position these findings in relation to Environmental Kuznets Curve (EKC). The EKC suggests that while environmental harm tends to initially increase with economic development, such development and wealth generation ultimately results in declining levels of environmental pollution. While the EKC is generally applied at aggregate social levels, our analysis suggests that there may be value in considering how different economic groups within a nation occupy different points of the curve simultaneously. Understanding the capacity to act on climate change, and related questions of social justice, within the dynamics of the EKC could provide a fruitful area of future research and open up interesting perspectives on over-emissions within low-income groups.
Amongst further research necessary before any personal carbon scheme could be implemented is an investigation into how capabilities to understand home heating systems could be increased, as this is an issue highlighted by several studies. Moreover, work to study comparative consumption through a social practice framework could highlight which practices cause most consumption variation, and therefore be ripe for intervention.
5. Conclusions
Given that about one-third of households in poverty would emit more than the allowances they would be given under a PCA scheme, it would be conventional to conclude that twin goals of social and environmental justice cannot be achieved under such a scheme. Whilst this research grappled with the complex relationships between poverty, lifestyle attributes, choice and emissions levels, it produced key results by comparing average individual carbon usage across society to actual consumption on a household-by-household basis.
The first result is that over-emissions are predominantly made by those households who under-occupy their dwellings, using a definition broadly in line with the UK government welfare system and treating those in social housing as fully occupying. This is true of those in poverty and those above the poverty line, and implies a significant element of housing choice driving emissions levels.
Secondly, for households in poverty, the average emissions from an over-emitting purpose built flat, theoretically the most energy-efficient dwelling type, are greater than those for under-emitting detached houses, theoretically the least energy efficient housing type. In isolated examples, this might be explicable by construction methods, but in aggregate, this is a very clear statement that lifestyle is a key driver of emissions, even for those in poverty. This result is also true for the population as a whole.
Thirdly, regression analysis shows that emissions related to adults and children are the key drivers of emissions for households in poverty (as opposed to being driven purely by housing or material possessions), and that these vary by more than a factor of three between average under-emitters and average over-emitters. Again, a very clear statement that lifestyle is the main driver of emissions, even for households in poverty, and it is also true across the income spectrum.
Based on this research, advocates of PCAs would suggest that worries about impacts on households in poverty are overemphasised, since emission levels are driven more by lifestyle than any other single factor, and ultimately the only aim of PCAs is to change high-emitting lifestyles. Avoiding all household emission reduction policies because some high emitters have low incomes is not a credible strategy. Instead, perhaps more research should be undertaken into resolving the political and presentational problems of introducing PCAs, and how high emitters can be persuaded and educated to reduce consumption, than to a preoccupation with compensation for current behaviours.
Author Contributions
M.B.: Conceptualisation, methodology, software, data curation, analysis, investigation, writing—original draft, review and editing. M.W.: Supervision, writing—significant original additions, review and editing. All authors have read and agreed to the published version of the manuscript.
Funding
The work was ultimately funded by the Economic and Social Research Council (ESRC) via the Welsh Institute of Social & Economic Research, Data & Methods (WISERD) under grant ES/L009099/1.
Conflicts of Interest
The authors declare no conflict of interest. The funders had no role in the design of the study; in the collection, analyses, or interpretation of data; in the writing of the manuscript, or in the decision to publish the results.
Appendix A. Principal Component Analysis and Rotated Factor Analysis
The entire database was first examined using principal component analysis across all of the variables to see if the variance could be readily classified into a few components in the hope that this would lead quickly to the key variables. However, the contrary was discovered: the principal component accounted for a mere 11%/9% of the variance in the under-emitter/over-emitter cases respectively, and in each case it took 14 components to explain 50% of the variance.
Repeating the exercise using rotated factor analysis produced significantly different answers. In both under-emitting and over-emitting cases, 50% of the variance could be explained by four factors—still not a great result but a step forward.
Table A1.
Rotated factor analysis: percent of variation explained in the whole population.
Table A1.
Rotated factor analysis: percent of variation explained in the whole population.
| Percent of Variance Explained | Under-Emitters | Over-Emitters |
|---|---|---|
| Factor 1 | 22.0% | 18.9% |
| Factor 2 | 12.3% | 13.4% |
| Factor 3 | 10.3% | 10.5% |
| Factor 4 | 9.3% | 8.9% |
| Total | 53.8% | 51.8% |
The data associations were very similar for the first three factors in both the under-emitters/over-emitters cases.
| Factor 1: | “Consumers”: relates total household emissions, salary, adult numbers, cars, employment, rooms, home ownership and consumer goods. |
| Factor 2: | “Climate concerned”: relates the environmental beliefs and very mildly the environmental habits. However, the coefficient of the emissions variable is under ±0.1; environmental beliefs are almost completely unconnected to emissions. |
| Factor 3: | Relates children, employment, tax credits, council tax and housing benefits. |
Factor 4 varied markedly. For the under-emitters, it scores insignificantly in almost every domain, but moderately relates environmental habits (but not environmental views).
For the over-emitters, Factor 4 is very different and can be characterised as “rural dwellers”, relating emissions, high incidences of oil and coal central heating and significantly higher numbers of adults then children.
It should be noted that relatively few of the factor loading values for Factors 2 and 4 are higher than the 0.4 generally taken in the statistical literature as being indicative of a reliable relationship. Even for factors 1 and 3, only one of the factor loading values is greater than the 0.7 suggested as a statistically significant relationship between the component and the derived factor. Therefore, transforming the data by the factor loadings (to derive a matrix with smaller numbers of components) and regressing emissions against this was not undertaken as no statistically significant results could have been produced.
Looking at those in poverty in isolation, principal component analysis again requires multiple components to explain half the variance (13) and is of little use whether rotated or unrotated. Rotated factor analysis is more useful here also. The composition of the factors is quite different.
Table A2.
Rotated factor analysis: percent of variation explained for those in poverty.
Table A2.
Rotated factor analysis: percent of variation explained for those in poverty.
| Percent of Variance Explained | Under-Emitters | Over-Emitters |
|---|---|---|
| Factor 1 | 13.6% | 14.3% |
| Factor 2 | 13.6% | 13.2% |
| Factor 3 | 13.1% | 11.7% |
| Factor 4 | 10.9% | 10.3% |
| Total | 51.2% | 49.5% |
For the under-emitters:
| Factor 1: | “Working poor”: links wages, children, income support, housing benefit or council tax benefit and excludes home ownership and pensioners. |
| Factor 2: | Strongly varies with numbers of appliances (coefficient = 0.90) and moderate variance in emissions and little else. |
| Factor 3: | “Consumers”: excludes home ownership but otherwise as Factor 1 for the whole (richer) database. Emissions coefficient high at 0.61. |
| Factor 4: | “Climate concerned” as Factor 2 for the whole (richer) database. Emissions coefficient minimal at 0.02. |
For the over-emitters: two pairs of Factors 1/2 and 3/4 are reversed compared to the under-emitters.
| Factor 1: | Strongly varies with numbers of appliances (coefficient = 0.95) and moderate variance in emissions and little else. |
| Factor 2: | “Working poor”: links wages, children, income support, housing benefit or council tax benefit and excludes home ownership and pensioners. |
| Factor 3: | “Climate concerned” as Factor 2 for the whole (richer) database. Emissions coefficient minimal at 0.02. |
| Factor 4: | “Consumers”: links emissions, adult numbers, rooms, oil or other heating, cars and rurality. Excludes wages (these vary relatively little across the poverty band), numbers employed and home ownership but otherwise similar Factor 1 for the whole (richer) database. Emissions coefficient high at 0.58. |
In terms of lessons that can be drawn from these results, it is clear that there are no dominant factors that can be drawn out of the database, and only a small proportion of the variance in the data can be explained. It is also clear that only one of the factors (“consumers”) is linked closely to emissions, and that it links less significantly for households in poverty. Given this scenario, it is not surprising that when regressions analysis was performed (see Section 3.6), none of the environmental beliefs or behaviours were significant, and perhaps more of a surprise is that a good regression model could be constructed with relatively few variables.
References
- Department for Communities and Local Government (DLG). 2010 to 2015 Government Policy: Energy Efficiency in Buildings. 2015. Available online: https://www.gov.uk/government/publications/2010-to-2015-government-policy-energy-efficiency-in-buildings/2010-to-2015-government-policy-energy-efficiency-in-buildings (accessed on 17 March 2020).
- Climate Change Act (CCA). Modified by Standing Order, 2050 Target Amendment, 2019. Available online: https://www.legislation.gov.uk/ukpga/2008/27/pdfs/ukpga_20080027_en.pdf (accessed on 21 August 2020).
- DECC. Annual Fuel Poverty Statistics Report: 2015; Department of Energy and Climate Change: London, UK, 2015.
- Lachapelle, E. Communicating about Carbon Taxes and Emissions Trading Programs. In Oxford Research Encyclopaedia of Climate Science; Oxford University Press: Oxford, UK, 2017. [Google Scholar] [CrossRef]
- The Guardian Newspaper. Australia Kills off Carbon Tax. 2014. Available online: https://www.theguardian.com/environment/2014/jul/17/australia-kills-off-carbon-tax (accessed on 27 September 2020).
- BBC. France Protests: PM Philippe Suspends Fuel Tax Rises. 2018. Available online: https://www.bbc.co.uk/news/world-europe-46437904 (accessed on 27 September 2020).
- Parag, Y.; Eyre, N. Barriers to personal carbon trading in the policy arena. Clim. Policy 2010, 10, 353–368. [Google Scholar] [CrossRef]
- Howarth, N.; Rosenow, J. Banning the bulb: Institutional evolution and the phased ban of incandescent lighting in Germany. Energy Policy 2014, 67, 737–746. [Google Scholar] [CrossRef]
- Ayres, R. Environmental Market Failures: Local Market-Based Corrective Mechanisms for Global Problems. Mitig. Adapt. Strateg. Glob. Chang. 1997, 1, 289–309. [Google Scholar] [CrossRef]
- Fleming, D. Tradable Quotas: Using information technology to cap national carbon emissions. Eur. Environ. 1997, 7, 139–148. [Google Scholar] [CrossRef]
- Hillman, M. Carbon budget watchers. Town Ctry. Plan. Oct. 1998, 67, 305. [Google Scholar]
- Starkey, R.; Anderson, K. Domestic Tradable Quotas: A Policy Instrument for the Reduction of Greenhouse Gas Emissions; Tyndall Centre for Climate Change Research: Norwich, UK, 2005. [Google Scholar]
- Bird, J.; Lockwood, M. Plan B: The Prospects for Personal Carbon Trading; IPPR: London, UK, 2009. [Google Scholar]
- Thumim, J.; White, V. Distributional Impacts of Personal Carbon Trading; Centre for Sustainable Energy: Bristol, UK, 2008. [Google Scholar]
- Jagers, S.C.; Lofgren, A.; Stripple, J. Attitudes to PCAs: Political trust, fairness and ideology. Clim. Policy 2010, 10, 410–431. [Google Scholar] [CrossRef]
- Lockwood, M. The economics of personal carbon trading. Clim. Policy 2010, 10, 447–461. [Google Scholar] [CrossRef]
- Caney, S. Two Kinds of Climate Justice: Avoiding Harm and Sharing Burdens. J. Political Philos. 2014, 22, 125–149. [Google Scholar] [CrossRef]
- Jenkins, K. Setting energy justice apart from the crowd: Lessons from environmental and climate justice. Energy Res. Soc. Sci. 2018, 39, 117–121. [Google Scholar] [CrossRef]
- Office of National Statistics. Housing. Soc. Trends 2011, 41, 13. [Google Scholar]
- Newell, P.; Mulvaney, D. The Political Economy of the “just transition”. Geogr. J. 2013, 179, 132–140. [Google Scholar] [CrossRef]
- Jasanoff, S. Just transitions: A humble approach to global energy futures. Energy Res. Soc. Sci. 2018, 35, 11–14. [Google Scholar] [CrossRef]
- Robeyns, I. The Capabilities Approach: A theoretical survey. J. Hum. Dev. 2005, 6, 93–117. [Google Scholar] [CrossRef]
- Gilovich, T.; Ross, L. The Wisest One in the Room; Oneworld Publications: London, UK, 2016. [Google Scholar]
- Salecl, R. The Tyranny of Choice; Profile Books: London, UK, 2010. [Google Scholar]
- John, P.; Smith, G.; Stoker, G. Nudge, Nudge, Think, Think: Two Strategies for Changing Civic Behaviour. Political Q. 2019, 80, 3. [Google Scholar] [CrossRef]
- Turrentine, T.; Karani, K. Car buyers and fuel economy? Energy Policy 2007, 35, 1213–1223. [Google Scholar] [CrossRef]
- Møller, B. Travel Mode Choice as Habitual Behaviour: A Review of LiteratureI; Aarhus School of Business: Aarhus, Denmark, 2003. [Google Scholar]
- De Dear, R.; Brager, G.S. Developing an Adaptive Model of Thermal Comfort and Preference; ASHRAE Transactions: Peachtree Corners, GA, USA, 1998; Volume 104, Available online: https://escholarship.org/uc/item/4qq2p9c6 (accessed on 1 January 2020).
- Hall, S.M. Everyday family experiences of the financial crisis: Getting by in the recent economic recession. J. Econ. Geogr. 2016, 16, 305–330. [Google Scholar] [CrossRef]
- Hall, S.M.; Holmes, H. Making do and Getting By? Beyond a romantic politics of Austerity and Crisis. Article in Discover Society. 2017. Available online: https://discoversociety.org/2017/05/02/making-do-and-getting-by-beyond-a-romantic-politics-of-austerity-and-crisis/ (accessed on 29 December 2019).
- Haushofer, J.; Fehr, E. On the psychology of poverty. Science 2014, 344, 862. [Google Scholar] [CrossRef]
- Mullainathan, S.; Shafir, E. Scarcity: Why Having Too Little Means So Much; Time Books, Henry Holt & Company LLC: New York, NY, USA, 2013. [Google Scholar]
- Snell, C. Policy pathways to justice in energy efficiency. In Proceedings of the Presentation to Food Poverty Research Network, Newcastle, UK, 7 November 2017. [Google Scholar]
- Houghton, T. Energy Poverty in Western Australia. In Proceedings of the Presentation to Food Poverty Research Network, Newcastle, UK, 7 November 2017. [Google Scholar]
- Sherriff, G. Socio-Technical Concepts. In Proceedings of the Presentation to Food Poverty Research Network, Newcastle, UK, 6 November 2017. [Google Scholar]
- Sandel, M.J. What Money Can’t Buy: The Moral Limits of Markets. Presented at the Lecture Delivered at Brasenose College, Oxford, UK, 11–12 May 1998. Available online: academia.edu (accessed on 17 April 2019).
- Liu, L.; Feng, T.; Suo, T.; Lee, K.; Li, H. Adapting to the Destitute Situations: Poverty Cues Lead to Short-Term Choice. PLoS ONE 2012, 7, e33950. [Google Scholar] [CrossRef]
- Hogan, P. Paying More to Be Poor: The Poverty Premium in Energy, Telecommunications and Finance; Citizens Advice Scotland: Edinburgh, UK, 2016. [Google Scholar]
- Belaïd, F. Exposure and risk to fuel poverty in France: Examining the extent of the fuel precariousness and its salient determinants. Energy Policy 2018, 114, 189–200. [Google Scholar] [CrossRef]
- Kearns, A.; Whitley, E.; Curl, A. Occupant behaviour as a fourth driver of fuel poverty (aka warmth & energy deprivation). Energy Policy 2019, 129, 1143–1155. [Google Scholar] [CrossRef]
- Jones, R.; Pykett, J.; Whitehead, M. Governing temptation: Changing behaviour in an age of libertarian paternalism. Prog. Hum. Geogr. 2010, 35, 483–501. [Google Scholar] [CrossRef]
- Barr, S.W.; Prillwitz, J. A smarter choice? Exploring the behaviour change agenda for environmentally sustainable mobility. Environ. Plan. C Gov. Policy 2014, 32, 1–19. [Google Scholar] [CrossRef]
- Verplanken, B.; Aarts, H. Habit, Attitude, and Planned Behaviour: Is Habit an Empty Construct or an Interesting Case of Goal directed Automaticity? Eur. Rev. Soc. Psychol. 1999, 10, 101–134. [Google Scholar] [CrossRef]
- Verplanken, B.; Walker, I.; Davis, A.; Jurasek, M. Context change and travel mode choice: Combining the habit discontinuity and self-activation hypotheses. J. Environ. Psychol. 2008, 28, 121–127. [Google Scholar] [CrossRef]
- Burgess, M. Personal Carbon Allowances: A revised model to alleviate distributional issues. Ecol. Econ. 2016, 130, 316–327. [Google Scholar] [CrossRef]
- Büsch, M.; Schnepf, S. Who emits most? Associations between socio-economic factors and UK households’ home energy, transport, indirect and total CO2 emissions. Ecol. Econ. 2013, 90, 114–123. [Google Scholar]
- Demos. Poverty in Perspective; Magdalen House: London, UK, 2012; p. 62. [Google Scholar]
- Institute of Fiscal Studies. Living Standards, Poverty and Inequality in the UK: 2015; Institute of Fiscal Studies: London, UK, 2015; p. 92. [Google Scholar]
- Shelter. Bedroom Tax Ruling “Devastating News” for Disabled Families’. 2013. Available online: http://england.shelter.org.uk/news/july_2013/bedroom_tax_ruling_devastating_news_for_disabled_families (accessed on 29 March 2017).
- Green Party Manifesto. The Green Party of England and Wales, Development House, 56–64 Leonard Street, London EC2A 4LT. 2015, p. 44. Available online: https://www.greenparty.org.uk/assets/files/Elections/Green%20Party%20Manifesto%202019.pdf (accessed on 15 November 2017).
- The Independent Newspaper. 2013. Available online: http://www.independent.co.uk/news/uk/politics/big-lie-behind-the-bedroom-tax-families-trapped-with-nowhere-to-move-face-penalty-for-having-spare-8745597.html (accessed on 14 February 2017).
- Gibb, K. The multiple policy failures of the UK bedroom tax. Int. J. Hous. Policy 2015, 15, 148–166. [Google Scholar] [CrossRef]
- Gibb, K. The Bedroom Tax in Scotland. Report to the Welfare Reform Committee; Scottish Parliament: Edinburgh, UK, 2013. [Google Scholar]
- Moffatt, S.; Lawson, S.; Patterson, R.; Holding, E.; Dennison, A.; Sowden, S.; Brown, J. A qualitative study of the impact of the UK “bedroom tax”. J. Public Health 2015, 38, 197–205. [Google Scholar] [CrossRef]
- Thomson, H.; Bouzarovski, S.; Snell, C. Rethinking the measurement of energy poverty in Europe: A critical analysis of indicators and data. Indoor Built Environ. 2017, 26, 879–901. [Google Scholar] [CrossRef]
- UK Housing Statistics at 31.3.18. Ministry of Housing, Communities and Local Government. Housing Statistical Release 24.5.19. Available online: https://assets.publishing.service.gov.uk/government/uploads/system/uploads/attachment_data/file/803958/Dwelling_Stock_Estimates_31_March_2018__England.pdf (accessed on 31 March 2019).
- Elderkin, S. Defra. An Assessment of the Potential Effectiveness and Strategic Fit of Personal Carbon Trading; Defra: London, UK, 2008.
- Giddens, A. The Politics of Climate Change: National Responses to the Challenge of Global Warming; Policy Network: London, UK, 2008. [Google Scholar]
- Gough, I.; Abdallah, S.; Johnson, V. The Distribution of Total Greenhouse Gas Emissions by Households in the UK; Centre for Analysis of Social Exclusion: London, UK, 2011. [Google Scholar]
- Preston, I.; White, V.; Thumim, J.; Bridgeman, T. Distribution of Carbon Emissions in the UK: Implications for Domestic Energy Policy; Joseph Rowntree Foundation: York, UK, 2013. [Google Scholar]
- Darby, S. The Effectiveness of Feedback on Energy Consumption; Oxford Environmental Institute: Oxford, UK, 2006. [Google Scholar]
- Wood, G.; Newborough, M. Dynamic energy-consumption indicators for domestic appliances: Environment, behaviour and design. Energy Build. 2003, 35, 821–841. [Google Scholar] [CrossRef]
- Gill, B.; Moeller, S. GHG Emissions and the Rural-Urban Divide. A Carbon Footprint Analysis Based on the German Official Income and Expenditure Survey. Ecol. Econ. 2018, 145, 160–169. [Google Scholar] [CrossRef]
- Underwood, A.; Zahran, S. The carbon implications of declining household scale economies. Ecol. Econ. 2015, 116, 182–190. [Google Scholar] [CrossRef]
- Office of National Statistics. 2013. Available online: http://www.ons.gov.uk/ons/rel/census/2011-census/detailed-characteristics-on-housing-for-local-authorities-in-england-and-wales/short-story-on-detailed-characteristics.html (accessed on 29 March 2017).
- Druckman, A.; Jackson, T. Household energy consumption in the UK: A highly geographically and socio-economically disaggregated model. Energy Policy 2008, 36, 3177–3192. [Google Scholar] [CrossRef]
- Scottish Government. Low Carbon Behaviours Framework; Scottish Government: Edinburgh, UK, 2016; p. 17.
- Boardman, B. Fuel Poverty: From Cold Homes to Affordable Warmth; Wiley & Sons: London, UK, 1991. [Google Scholar]
- Jacques, R.; Lilley, R.; Cass, J. Behaviour Change and Home Energy Coaching; Ceredigion County Council; Aberystwyth University: Wales, UK, 2016. [Google Scholar]
- Mills, S. Changeworks’ charity. In Proceedings of the Presentation to Food Poverty Research Network Meeting, Newcastle-upon-Tyne, UK, 7 November 2017. [Google Scholar]
- Sustainable Homes. Quoted in Inside Housing. 2015. Available online: http://www.insidehousing.co.uk/energy-efficiency-progress-on-social-homes-stalls/7010051.article (accessed on 20 March 2017).
- DECC. National Energy Efficiency Data Framework: Annex E, Table A 3.1.; Department of Energy & Climate Change: London, UK, 2012.
- The Guardian Newspaper. Loneliness as Bad for Health as Long-Term Illness, Says GPs’ Chief. 2017. Available online: https://www.theguardian.com/society/2017/oct/12/loneliness-as-bad-for-health-as-long-term-illness-says-gps-chief (accessed on 12 December 2017).
- Whitehead, M. The wood for the trees: Ordinary environmental injustice and the everyday right to urban nature. Int. J. Urban Reg. Res. 2009, 33, 662–681. [Google Scholar] [CrossRef]
- Frank, J.B. The Paradox of Aging in Place in Assisted Living; Bergin & Garvey: London, UK, 2002. [Google Scholar]
- Taylor, S.A.P. Place identification and positive realities of aging. J. Cross Cult. Gerontol. 2001, 16, 5–20. [Google Scholar] [CrossRef]
- World Health Organization. Global Age-Friendly Cities Project. 2007. Available online: https://www.who.int/ageing/publications/Global_age_friendly_cities_Guide_English.pdf (accessed on 13 October 2019).
- Mill, J.S. On Liberty; John W Parker & Son: London, UK, 1859. [Google Scholar]
- Wiles, J.; Leibing, A.; Guberman, N.; Reeve, J.; Allen, R. The Meaning of “Aging in Place” to Older People. Gerontologist 2011, 52, 357–366. [Google Scholar] [CrossRef]
- Annual Report 2010–2011; Behavioural Insights Team, Cabinet Office: London, UK, 2011; p. 13.
- Angelini, V.; Brugiavini, A.; Weber, G. Does Downsizing of housing equity alleviate financial distress in old age? In The Individual and the Welfare State; Springer: Berlin/Heidelberg, Germany, 2011. [Google Scholar]
- Gram-Hanssen, K. Teenage consumption of cleanliness: How to make it sustainable? Sustain. Sci. Pract. Policy 2007, 3, 15–23. [Google Scholar] [CrossRef]
- Heberlein, T. Navigating Environmental Attitudes; Oxford University Press: Oxford, UK, 2012. [Google Scholar]
- Van den Brom, P.; Hansen, A.; Gram-Hanssen, K.; Meijer, A.; Visscher, H. Variances in residential heating consumption-Importance of building characteristics and occupants analysed by movers and stayers. Appl. Energy 2019, 250, 713–728. [Google Scholar] [CrossRef]
- Maraseni, T.N.; Qu, J.; Zeng, J. A comparison of trends and magnitudes of household carbon emissions between China, Canada and UK. Environ. Dev. 2015, 15, 103–119. [Google Scholar] [CrossRef]
- Chang, H.; Chang, K. Cutting CO2 intensity targets of interprovincial emissions trading in China. Appl. Energy 2016, 163, 211–221. [Google Scholar] [CrossRef]
- Liu, Y.; Han, L.; Yin, Z.; Luo, K. A competitive carbon emissions scheme with hybrid fiscal incentives: The evidence from a taxi industry. Energy Policy 2017, 102, 414–422. [Google Scholar] [CrossRef]
- Zhang, D.; Karplus, V.; Cassisa, C.; Zhang, X. Emissions trading in China: Progress and prospects. Energy Policy 2014, 75, 9–16. [Google Scholar] [CrossRef]
- Guzman, L.; Clapp, A. Applying Personal Carbon Trading: A proposed ‘Carbon, Health & Savings system’ for British Columbia. Clim. Policy 2017, 17, 616–633. [Google Scholar] [CrossRef]
- Qu, J.; Maraseni, T.N.; Liu, L.; Zhang, Z.; Yusuf, T. A Comparison of Household Carbon Emission Patterns of Urban and Rural China over the 17 Year Period (1995–2011). Energies 2015, 8, 10537–10557. [Google Scholar] [CrossRef]
- Dresner, S.; Ekins, P. Economic Instruments to Improve UK Home Energy Efficiency without Negative Social Impacts. Fisc. Stud. 2006, 27, 47–74. [Google Scholar] [CrossRef]


Publisher’s Note: MDPI stays neutral with regard to jurisdictional claims in published maps and institutional affiliations. |
© 2020 by the authors. Licensee MDPI, Basel, Switzerland. This article is an open access article distributed under the terms and conditions of the Creative Commons Attribution (CC BY) license (http://creativecommons.org/licenses/by/4.0/).