Abstract
The demand for carbon capture is increasing over time due to rising CO levels in the atmosphere. Even though fossil emission could be decreased or even eliminated, there is a need to start removing CO from the atmosphere. The removed CO could be either stored permanently to a reservoir (CCS, Carbon Capture and Storage) or utilized as a raw material in a long-lasting product (CCU, Carbon Capture and Utilization). The capture of CO could be done by direct air capture, or capturing CO from biogenic sources. Amine absorption is the state-of-the-art method to capture CO, but it has some drawbacks: toxicity, high heat demand, and sorbent sensitivity towards impurities such as sulfur compounds and degradation in cyclic operation. Another potential solvent for CO could be water, which is easily available and safe to use in many applications. The problem with water is the poorer solubility of CO, compared with amines, which leads to larger required flow rates. This study analyzed the technical feasibility of water absorption in a counterflow bubble column reactor. A dynamic, one-dimensional multiphase model was developed. The gas phase was modeled with plug flow assumption, and the liquid phase was treated as axially dispersed plug flow. CO capture efficiency, produced CO mass flow rate, and the product gas CO content were estimated as a function of inlet gas and liquid flow rate. In addition, the energy consumption per produced CO-tonne was calculated. The CO capture efficiency was improved by increasing the liquid flow rate, while the CO content in product gas was decreased. For some of the studied liquid flow rates, an optimum gas flow rate was found to minimize the specific energy consumption. Further research is required to study the integration and dynamical operation of the system in a realistic operation environment.
1. Introduction
Carbon dioxide capture technologies have received increasing attention especially in sectors that are difficult to decarbonize (cement, steel, aviation, and shipping) and also as a source of carbon for different CO Capture and Utilization (CCU) routes [1]. In CCU, CO is used as a raw material to synthesize or construct new long-lasting products, so that CO emissions are avoided. Carbon capture technologies are also an essential part of negative emission technologies, namely Direct Air Capture (DAC) of CO[2] and bioenergy combined with CO Capture and Storage (BECCS) [3]. Chemical absorption with amine-based solutions is one of the most mature solutions for CO capture, which has been applied e.g., in the first large-scale Carbon Capture and Storage (CSS) plant in Boundary Dam coal power station [4]; however, amine-based CO capture has several challenges like the toxicity of sorbent, high heat demand for sorbent regeneration, sensitivity towards impurities, and degradation [5]. In addition, production of monoethanolamine (MEA) sorbents from ammonia causes CO emissions, if ammonia is based on natural gas as the case is mainly today [6].
An alternative solvent for amines is water, which is cheaper, non-toxic, and more tolerant to impurities. Water scrubbing is well known and largely used technology for removing CO and HS from biogas (biogas upgrading) [7,8], but in these solutions CO is not traditionally captured but vented to the atmosphere along the stripping air. Additional capture step must be added in order to utilize or store CO. One proposed CO capture technology concept using water as a sorbent was pre-evaluated by Teir et al., in the Finnish national CCSP (Carbon Capture and Storage Program) project [9]. The energy consumption of the process was reported to be roughly similar to standard MEA-process from literature, 0.4 kWh/kg, while the capture efficiency reached 90%, and the purity of product gas was over 90%. Pressure swing was used to regenerate the water and obtain high purity CO. In comparison, a temperature swing was used for regeneration in typical amine-based process, which requires heat. Pressure swing could be an advantage in future, as it requires only electricity instead of heat, which could enhance electrification (and decarbonization) in future renewable energy based systems. In addition, public acceptance could be achieved easier with water based process, as it does not require any chemicals. The major drawback in physisorption of CO in water compared to chemisorption in amine solutions is lower solubility of CO in water, which decreases the capture capacity, thus increases the size of the capture plant. Also, heat generation by pumping must be removed from the circulating water.
To the author’s knowledge, there is no other published literature regarding carbon capture with pure water as a solvent, except the work by Teir et al. [10]. As a laboratory scale study, Al-Hindi and Azizi [11] have measured the absorption and desorption coefficients for CO in a water bubble column, finding that the absorption coefficient was always larger than the desorption coefficient.
However, there are many studies concerning biogas upgrading by pressure swing absorption, with water as an absorbent. A comprehensive review was done by Ullah Khan et al. [12]. The absorption process in rather similar to this paper, as CO is absorbed into water in a column with counter current flow, so similar modeling procedures can be used. The desorption process is different, thus the same models do not apply.
Event though the water scrubbing is the most common method for biogas upgrading in the world [13], the number of published numerical models are very limited, as stated by Wylock and Budzianowski [14]. Many published studies utilize Aspen for modeling [13,15,16], or some simplified zero-dimensional mass balance model [17]. The most comprehensive one-dimensional model is presented by Wylock and Budzianowski [14], and it was successfully utilized to estimate proper sizing for the components and the performance in steady state. This paper contributes to the research by initiating the development of dynamic model that could be utilized for performance estimation in intermittent operating conditions of CCU processes.
In this paper, the suitability of a bubble column reactor for capturing CO was studied, with water as a solvent. The objective of the study was to develop a simple model that can predict the basic trends of hydrodynamics and gas–liquid mass transfer in a bubble column reactor. The prediction of the model was compared to experimental values from the literature. In addition, a scale-up analysis was carried out. Further on, the proposed model could be extended and utilized to design and study the dynamic operation of the whole process, and the integration to other related processes.
2. Materials and Methods
The bubble column reactor concept consists of countercurrent gas and water flows. The gas inlet is at the bottom of the reactor, and the liquid inlet is at the top. Part of CO from the inlet gas is absorbed into water. The solubility of CO is increased with increasing pressure and decreasing temperature of the water. From the bubble column reactor, water and absorbed gas components are fed to the regeneration step, after which the water is recycled back to the bubble column.
Regeneration separates part of the absorbed gases to the product gas, and the rest of the absorbed gases are circulated back to the reactor. The regeneration is done by lowering the solubility of CO by decreasing water pressure and/or increasing water temperature. The efficiency of the regeneration is a function of temperature and pressure of the regeneration step. However, in this study, the regeneration step was modeled only with one parameter, regeneration efficiency. A pressure swing was assumed to be used as a regeneration method, while the temperature of the water was kept constant.
The energy consumption of the system consists of power demand of pumping of water from lower pressure of regeneration to higher pressure of reactor, compression of gases to bubble column reactor, and cooling of circulating water. The heat produced by the pump must be removed in order to keep water temperature constant. It was assumed that enough cold water was available from lake, river, or sea, so that the energy demand for cooling can be neglected.
It was assumed that the liquid level was maintained constant. The liquid phase consists of pure water and absorbed gas components. It was assumed that there was no water loss in the system. The gas phase was a composition of carbon dioxide (CO), oxygen (O), and nitrogen (N). These components were chosen as they can represent many potential sources that contain CO, like air or flue gases. The illustration of the reactor is presented in Figure 1.
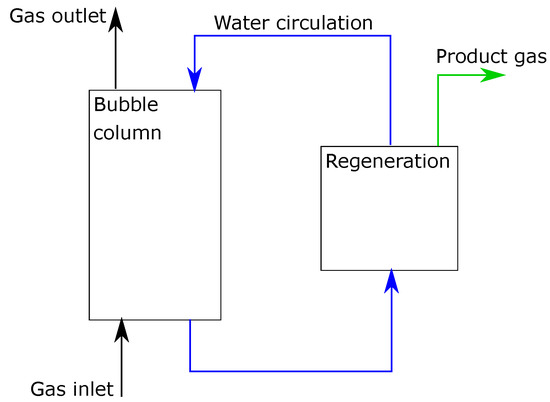
Figure 1.
Illustration of the studied bubble column reactor.
Concentration differences in the radial direction are neglected. Therefore, a one-dimensional model was used, which enables estimation of concentration profiles along the reactor length, with varying hydrostatic pressure. A plug flow was assumed for the gas phase. In the liquid phase, mixing in the axial direction was modeled with an axial dispersion coefficient.
The interaction between the phases was modeled with local gas volume fraction, which was obtained from semi-empirical correlations. As a result, the velocities of the phases were also defined by the volume fraction. As a summary, the main model assumptions were: no radial gradients, only convective transport for gas phase (plug flow), convective and dispersive transport in the liquid phase, constant temperature, variable gas volume fraction along with the reactor height, and variable gas density (effect of hydrostatic pressure).
2.1. Mass Balance
The reactor was modeled as in the work of Li et al. [18], as plug flow with axial dispersion in the liquid phase and plug flow in the gas phase. Time-dependent mass balances were calculated separately for each gas and liquid components (CO, O and N) with Equations (1) and (2), where and are the concentrations of each component in gas and liquid phases, and are volume fractions of gas and liquid phases, is the axial dispersion coefficient, and S is the absorption term. The equations are discretized to a one-dimensional domain with a finite difference method. The number of nodes was ten. The first order upwind method was used for convection terms. The second order central difference method was used for dispersion term. The product of concentrations C and volume fraction determines the concentration in respect to the reactor volume. Danckwert’s boundary conditions were used for the liquid phase at the inlet, and mass flow inlet was used for the gas phase. At the outlet, a zero gradient was used for both phases.
The physical nature of the gas–liquid mass transfer is complicated; therefore empirical or semi-empirical correlations are often used for modeling. Correlations are typically valid for certain geometries and limited operating conditions. In this study, the source term for absorption (and desorption) was calculated by volumetric mass transfer coefficient , and the concentration difference to the saturation concentration of each component, as in earlier work by Inkeri et al. [19]. The saturation concentration was defined by Henry’s coefficients as a function of pressure and temperature, while the coefficients were obtained from the work of Sander [20]. The effect of partial pressure was taken into account by multiplying the saturation concentration with the molar fraction of each component , as presented in Equation (3).
2.2. Gas Hold-Up
The essential part of multiphase systems is the volume fraction of each phase. A local value was calculated for each node. Volume fraction also defines the velocities of the phases, as the phase-related cross-sectional area is determined by the volume fraction. A simple correlation by Joshi and Sharma [21] was used, in the form of
2.3. Bubble Diameter
2.4. Mass Transfer Coefficient
2.5. Volumetric Mass Transfer Coefficient
2.6. Hydrodynamics
The hydrodynamics of the system were modeled with the gas and liquid velocities and , and dispersion coefficient for the liquid phase. The velocity of each phase is calculated with volume flow rate , hold-up and cross-sectional area A, as in Equation (10).
The backmixing in the liquid phase was modeled with axial dispersion. The local dispersion coefficient was calculated by correlation from study of Kawase and Moo-Young [22], with Equation (11), where is the diameter of the reactor, g is gravitational constant and is the superficial velocity of the gas phase.
As the hydrostatic pressure of the water column might be significant compared to overhead pressure, the local total pressure was calculated with Equation (12), where p is the overhead pressure of the reactor, is water density, z is the local depth of the water column and is the gas hold-up. Gas density was calculated by the total pressure .
2.7. Energy Consumption
An important part of the process design is the energy consumption of the system. In this case, power was required for pumping the liquid in the system and compressing gas into the reactor. It was assumed that the pressure of the liquid flow was decreased to 1.0 bar at the regeneration step. Therefore, the liquid must be pumped to the reactor overhead pressure, 5.0 bar. Pumping power was calculated as
where is the volume flow rate of water, and is the pressure increase over the pump.
Inlet gas must be compressed at the same pressure as the liquid at the bottom of the reactor, which is the overhead pressure and hydrostatic pressure combined. Compression power was calculated as
where is the mass flow rate of gas, is the specific heat capacity of the gas, and is the temperature of the gas.
The compressor outlet temperature was obtained from polytropic compression. The efficiency of the compression was assumed to be 85%. The outlet temperature was calculated as
where is the gas constant, is the pressure at the bottom of the reactor and is the inlet pressure, 1 bar.
In addition, pumping heats the liquid, which should be removed. It was assumed that enough cold water was available from a lake, sea, river, or air, so that the cost of cooling can be neglected. Otherwise, a refridgeration cycle must be added, which increases the power demand of the system.
2.8. Regeneration
The captured gas components were transported with the circulating water to the regeneration. In this study, the regeneration mass transfer was not modeled in detail, but constant regeneration efficiency was used, defined in Equation (16). The efficiency of 50% was utilized for all gas components.
where is the mass flow rate of the product gas, is the water velocity at reactor inlet, A is the cross-sectional area of the reactor, and is the concentration of the absorbed gas component at the regeneration inlet.
2.9. Numerical Method
The time-dependent equations for the mass balances were written in the Matlab software. Upwind discretization was utilized for convective terms and central discretization was used for dispersion terms. An explicit scheme with Matlab ode15s-solver was utilized to solve the equations.
A variable time step was used to achieve good accuracy and fast performance. For steady-state analysis, simulations were run long enough with constant input in order to achieve steady-state operation.
The model is rather stiff and requires well-defined initial conditions for concentrations and phase velocities to avoid divergence. If the initial conditions were not stable enough, the simulation would diverge. Only small changes could be done for the initial conditions at once, for example for the dilution rate. Larger changes were done incrementally, by using the obtained steady state result as the new initial condition for other parameters.
3. Results
3.1. Validation
In order to make a simple validation of the model, model predictions were compared to the experimental data. Measured values of gas hold-up and volumetric mass transfer coefficients were obtained from the experiments done by Zednikova et al. [23], Vandu et al. [24], Manjekar et al. [25], McClure et al. [26], Gourish et al. [27], and Jasim et al. [28]. Liquid flow rate was set to 1 × 10 m/s and there was no liquid recycling. The resulting gas hold-up and volumetric mass transfer coefficient were compared to the measured values in Figure 2. The simulated gas hold-up fits well with the measured values, but there is more variation in values of .
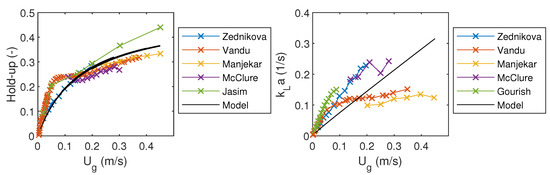
Figure 2.
Comparison of the model results to the experimental results from literature.
3.2. Scale-Up Analysis
In order to study system suitability for applications of CCS and CCU, the operation of a larger reactor was studied. Higher column height will increase the effect of hydrostatic pressure, which enhances the absorption as Henry’s constant will increase with pressure. Increasing reactor height should also increase the time that it takes for the gas phase to travel through it, which should improve absorption. Another parameter affecting the value of Henry’s constant is the liquid temperature, as the solubility of CO is higher in cold water.
Increasing pressure and decreasing temperature are not introduced without cost. The input gas stream has to be compressed at least into the same pressure as at the reactor bottom, which consumes power. As the water system is closed, the heat generation from pumping will accumulate to the system, thus cooling is required to maintain the reactor in constant temperature. If lower temperatures are used, even more cooling power is needed. Therefore, it would be finally an optimization task to select the best operation pressure and temperature.
The analysis presents the trending effect of different parameters to the reactor performance: reactor pressure, liquid temperature, liquid flow rate, gas flow rate, and regeneration efficiency. The reactor performance is presented in terms of captured CO mass flow rate, CO content of product gas, and CO capture efficiency. The values for the scaled-up bubble column were chosen based on the VTT study [10] and after initial simulations. The parameters of the model are presented in Table 1. The gas flow rate at the inlet is determined with superficial velocity . The liquid flow rate is defined by dilution rate .

Table 1.
Parameters of the scale-up study.
3.3. CO Capture Efficiency
The CO capture efficiency is determined by the difference between bubble column input and output gas mass flow rates. The resulting efficiency is presented as a function of gas and liquid flow rates in Figure 3. With the highest liquid flow rate, D = 0.1 1/s, over 95% capture efficiency was achieved with almost all gas flow rates. Decreasing of liquid flow rate decreased also capture efficiency. When the gas flow rate was decreased towards zero, the capture efficiency approached 100%.
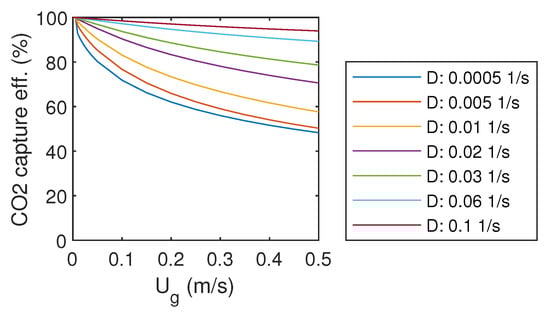
Figure 3.
CO capture efficiency.
3.4. Product Gas CO Content
For the purpose of CCS, and especially for CCU, it might be important to have pure CO as the final product. Therefore, it would be beneficial if the regeneration part of the systems would be selective for CO, and not for other gas components. However, as the regeneration is not modeled in detail in this study, regeneration efficiency is the same for all gas components. The resulting product gas quality is presented in Figure 4.
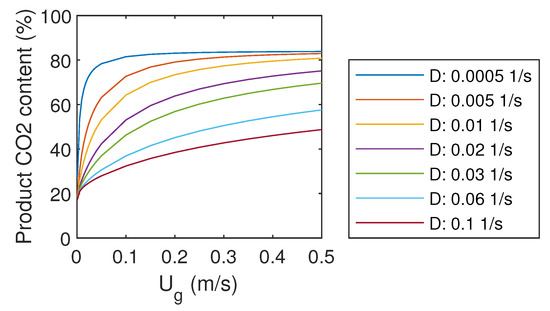
Figure 4.
Product gas CO content.
For very low gas flow rates, product gas CO content approached 20%. The maximum obtained CO content was about 82%, which could be reached already with U of 0.1 m/s. For higher CO content, a more advanced system should be designed. In contrast to capture efficiency, which increases with increasing liquid flow rate, high CO content requires low liquid flow rates. Therefore, it seems to be a compromise between capture efficiency and product gas CO content.
3.5. Produced CO
The mass flow rate of product gas CO is presented in Figure 5. It can be seen that increasing of inlet gas flow rate does not linearly increase the production of CO, as the capture efficiency decreases with high gas flow rates. However, increasing of liquid flow rate enhances the production rate of CO, which was already observed in Figure 3.
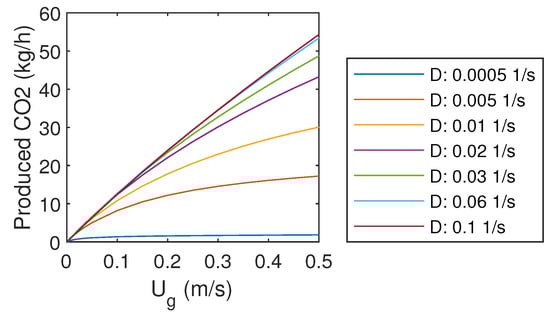
Figure 5.
Product gas CO mass flow rate.
With the highest liquid flow rate, the product gas CO mass flow rate increases almost linearly with the inlet gas flow rate. However, it does not seem realistic that this trend could continue far above the studied gas flow rates, as the mass transfer should be limited at some point if the reactor is flooded with gas. It might be that the simple correlations used to predict gas–liquid mass transfer cannot predict that. Other problems might arise from the increasing frictional losses, pumping demand, and compression demand with larger flow rates.
3.6. Energy Consumption
The estimated specific energy consumption per captured tonne of CO is presented in Figure 6. For the smallest liquid flow rates, an optimum gas flow rate can be found within the studied range. For these cases, energy consumption tends to increase with very low and very high gas flow rates. With larger liquid flow rates, the minimum was found at the largest gas flow rate. For those cases, it seems that the optimum would be achieved with even higher gas flow rates.
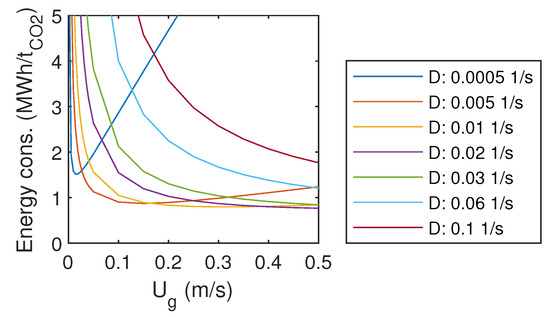
Figure 6.
Specific energy consumption.
Energy demand for the conventional amine absorption in a coal-fired power plant is 0.9–1.2 MWh/t [29], which is the same order of magnitude as the energy consumption of the studied system at the optimum.
3.7. Parameter Analysis
As a sensitivity analysis, some of the main parameters are varied. The results for CO capture efficiency and specific energy consumption were compared to the base case values: overhead pressure of 5 bar, liquid temperature 25 C, regeneration efficiency 50%. Results are presented in Figure 7 and Figure 8.
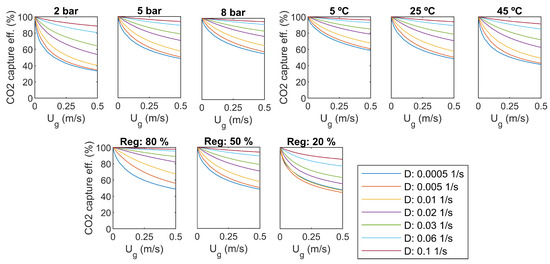
Figure 7.
CO capture efficiency, sensitivity to pressure, temperature, and regeneration efficiency.
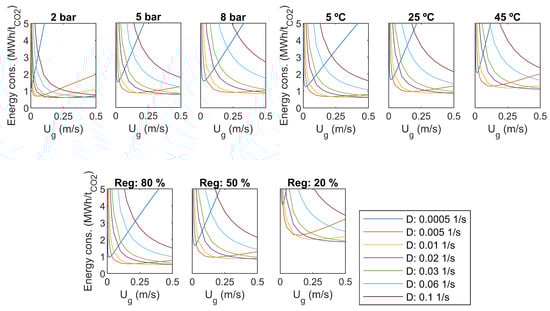
Figure 8.
Specific energy consumption, sensitivity to pressure, temperature, and regeneration efficiency.
As seen in Figure 7, the regeneration efficiency approaches 100% in all cases when the inlet gas flow rate () approaches zero. However, it is not practical, as the production of CO also approaches zero.
Increasing of the dilution rate increases capture efficiency in all cases, as seen in Figure 7. It comes with a cost in pumping power, as presented in Figure 8. With the smaller dilution rates, a minimum value can be found for the specific energy consumption with a certain gas flow rate. For the high dilution rates, the specific energy consumption decreases with increasing gas flow rate, but the optimum is supposed to be out of the studied range of gas flow rate.
An increase of reactor overhead pressure increases capture efficiency significantly, as seen in Figure 7. The minimum capture efficiency is over 60% with a pressure of 8 bar. However, higher pressure yields more pumping and compression power, as presented in Figure 8. It seems that increasing of pressure shifts the minimum specific energy consumption to higher gas flow rates, which is desirable.
The temperature of the water has not as large impact on the capture efficiency as the overhead pressure. As presented in Figure 7, capture efficiency gets lower with high temperatures, and the change is rather small for higher dilution rates. Increasing temperature increases the specific energy consumption slightly, and shifts the optimum towards lower gas flow rates, as seen in Figure 8.
The efficiency of the regeneration step has a clear effect on both capture efficiency and specific energy consumption. The level of energy consumption increases with decreasing regeneration efficiency. The optimum gas flow rate is not changed.
4. Discussion
Carbon capture with water as solvent seems a prominent technology for CCS and CCU in future energy systems with a high level of electrification, as the process does not require combustion or high temperatures, but only electricity for pumping, compression, and cooling. The technology for the absorption of CO to water is already commercialized in the field of biogas upgrading, but the capture of CO (desorption from water) to the final use is not yet a mature technology. However, the initial design has been already published.
The technology could be accepted easier compared to standard amine-based capture process, as no toxic chemicals are used. This benefit could stand out more in decentralized systems if the capture process is located near settlements.
Even though the state-of-the-art process design is rather efficient, it could be improved with future research. In addition, integration of the capture plant to other components in the energy system should be studied. There might be possible benefits for example in heat integration. Also, the dynamical capabilities should be addressed for a fluent integration, as the operation might be varying by the production of renewable electricity. The proposed model could be improved and extended to include the dynamics of CO source, synthesis or other carbon utilization process, and process that could utilize the removed low-temperature heat.
5. Conclusions
The technical feasibility of a bubble column was investigated for the application of CO capture. A one-dimensional model was developed. Three gas components were modeled: CO, O and N. The gas phase was treated as plug flow, and the liquid phase as axially dispersed plug flow.
The resulting CO capture efficiency, CO content in product gas and produced CO mass flow were strongly related to both gas and liquid inflow rates. High CO content could be achieved in the product gas with low gas inflow rates, but the energy consumption becomes high. The increase of liquid flow rate increased the CO capture efficiency, but decreased the CO content in the product gas. The total CO production rate tends to increase with increasing inlet gas and liquid flow rates.
For lower liquid flow rates, optimum conditions were found regarding energy consumption. Further studies would be needed for more detailed modeling of the regeneration step. Also, the maximum CO content in the product gas was now only about 82%, which should be increased with better system design.
Author Contributions
T.T., conceptualization, supervision, and editing; E.I., conceptualization, methodology, software, figures, validation, and writing—original draft. All authors have read and agreed to the published version of the manuscript.
Funding
This research received no external funding.
Conflicts of Interest
The authors declare no conflict of interest. The funders had no role in the design of the study; in the collection, analyses, or interpretation of data; in the writing of the manuscript, or in the decision to publish the results.
Abbreviations and Symbols
| Symbols | |
| A | Cross-sectional area (m) |
| a | Interfacial area (1/m) |
| Component concentration in gas (kg/m) | |
| Component concentration in liquid (kg/m) | |
| Saturation concentration in liquid (kg/m) | |
| Heat capacity (kJ/kgK) | |
| Liquid dispersion coefficient (m/s) | |
| D | Liquid dilution rate (1/s) |
| Gas diffusivity in liquid (m/s) | |
| Reactor diameter (m) | |
| Bubble diameter (m) | |
| Reactor height (m) | |
| Mass transfer coefficient (m/s) | |
| Volumetric mass transfer coefficient (1/s) | |
| p | Overhead pressure (Pa) |
| Hydrostatic pressure (Pa) | |
| Total pressure (Pa) | |
| Gassed power (W) | |
| Pump power (W) | |
| Compressor power (W) | |
| Mass flow rate (kg/s) | |
| Volume flow rate (m/s) | |
| S | Absorption/desorption source term (kg/ms) |
| T | Temperature (C) |
| t | Time (s) |
| Bubble contact time (s) | |
| Superficial velocity of gas phase (m/s) | |
| Velocity of gas phase (m/s) | |
| Velocity of liquid phase (m/s) | |
| Molar fraction of gas component (-) | |
| z | Cartesian axis direction (m) |
| Greek letters | |
| Volume fraction (-) | |
| Polytropic compression efficiency (-) | |
| Regeneration efficiency (-) | |
| Subscripts | |
| G | Gas phase |
| g | Gas component in gas phase |
| L | Liquid phase |
| l | Gas component absorbed to liquid |
References
- Hepburn, C.; Adlen, E.; Beddington, J.; Carter, E.A.; Fuss, S.; Mac Dowell, N.; Minx, J.C.; Smith, P.; Williams, C.K. The technological and economic prospects for CO2 utilization and removal. Nature 2019, 575, 87–97. [Google Scholar] [CrossRef]
- Breyer, C.; Fasihi, M.; Bajamundi, C.; Creutzig, F. Direct Air Capture of CO2: A Key Technology for Ambitious Climate Change Mitigation. Joule 2019, 3, 2053–2057. [Google Scholar] [CrossRef]
- Olsson, O.; Bang, C.; Borchers, M.; Hahn, A.; Karjunen, H.; Thrän, D.; Tynjälä, T. Deployment of BECCS/U Value Chains Technological Pathways, Policy Options and Business Models; IEA Bioenergy 2020. Available online: https://www.ieabioenergy.com/publications/new-publication-deployment-of-beccs-u-value-chains-technological-pathways-policy-options-and-business-models/ (accessed on 4 November 2020).
- Vega, F.; Baena-Moreno, F.; Fernández, L.M.G.; Portillo, E.; Navarrete, B.; Zhang, Z. Current status of CO2 chemical absorption research applied to CCS: Towards full deployment at industrial scale. Appl. Energy 2020, 260, 114313. [Google Scholar] [CrossRef]
- Fytianos, G.; Grimstvedt, A.; Knuutila, H.; Svendsen, H.F. Effect of MEA’s Degradation Products on Corrosion at CO2 Capture Plants. Energy Procedia 2014, 63, 1869–1875. [Google Scholar] [CrossRef]
- Luis, P. Use of monoethanolamine (MEA) for CO2 capture in a global scenario: Consequences and alternatives. Desalination 2016, 93–99. [Google Scholar] [CrossRef]
- Nock, W.J.; Walker, M.; Kapoor, R.; Heaven, S. Modeling the Water Scrubbing Process and Energy Requirements for CO2 Capture to Upgrade Biogas to Biomethane. Ind. Eng. Chem. Res. 2014, 53, 12783–12792. [Google Scholar] [CrossRef]
- Svensk Gastekniskt Center AB. Available online: http://www.sgc.se/ckfinder/userfiles/files/SGC270.pdf (accessed on 2 October 2020).
- Carbon Capture and Storage Program (CCSP). Available online: http://ccspfinalreport.fi/ (accessed on 10 September 2020).
- Teir, S.; Suomalainen, M.; Onarheim, K. Pre-Evaluation of a New Process for Capture of CO2 Using Water; VTT: Espoo, Finland, 2014; Available online: https://www.vttresearch.com/sites/default/files/julkaisut/muut/2014/VTT-R-04035-14.pdf (accessed on 2 October 2020).
- Al-Hindi, M.; Azizi, F. The effect of water type on the absorption and desorption of carbon dioxide in bubble columns. Chem. Eng. Commun. 2020, 207, 339–349. [Google Scholar] [CrossRef]
- Ullah Khan, I.; Hafiz Dzarfan Othman, M.; Hashim, H.; Matsuura, T.; Ismail, A.; Rezaei-DashtArzhandi, M.; Wan Azelee, I. Biogas as a renewable energy fuel—A review of biogas upgrading, utilisation and storage. Energy Convers. Manag. 2017, 150, 277–294. [Google Scholar] [CrossRef]
- Magli, F.; Capra, F.; Gatti, M.; Martelli, E. Process selection, modelling and optimization of a water scrubbing process for energy-self-sufficient biogas upgrading plants. Sustain. Energy Technol. Assess. 2018, 27, 63–73. [Google Scholar] [CrossRef]
- Wylock, C.E.; Budzianowski, W.M. Performance evaluation of biogas upgrading by pressurized water scrubbing via modelling and simulation. Chem. Eng. Sci. 2017, 170, 639–652. [Google Scholar] [CrossRef]
- Barbera, E.; Menegon, S.; Banzato, D.; D’Alpaos, C.; Bertucco, A. From biogas to biomethane: A process simulation-based techno-economic comparison of different upgrading technologies in the Italian context. Renew. Energy 2019, 135, 663–673. [Google Scholar] [CrossRef]
- Wang, H.; Ma, C.; Yang, Z.; Lu, X.; Ji, X. Improving high-pressure water scrubbing through process integration and solvent selection for biogas upgrading. Appl. Energy 2020, 276, 115462. [Google Scholar] [CrossRef]
- Benizri, D.; Dietrich, N.; Labeyrie, P.; Hébrard, G. A compact, economic scrubber to improve farm biogas upgrading systems. Sep. Purif. Technol. 2019, 219, 169–179. [Google Scholar] [CrossRef]
- Li, X.; Griffin, D.; Li, X.; Henson, M.A. Incorporating hydrodynamics into spatiotemporal metabolic models of bubble column gas fermentation. Biotechnol. Bioeng. 2019, 116, 28–40. [Google Scholar] [CrossRef]
- Inkeri, E.; Tynjälä, T.; Laari, A.; Hyppänen, T. Dynamic one-dimensional model for biological methanation in a stirred tank reactor. Appl. Energy 2018, 209, 95–107. [Google Scholar] [CrossRef]
- Sander, R. Compilation of Henry’s law constants (version 4.0) for water as solvent. Atmos. Chem. Phys. 2015, 15, 4399–4981. [Google Scholar] [CrossRef]
- Dudley, J. Mass transfer in bubble columns: A comparison of correlations. Water Res. 1995, 29, 1129–1138. [Google Scholar] [CrossRef]
- Kawase, Y.; Moo-Young, M. Liquid phase mixing in bubble columns with Newtonian and non-Newtonian fluids. Chem. Eng. Sci. 1986, 41, 1969–1977. [Google Scholar] [CrossRef]
- Zedníková, M.; Orvalho, S.; Fialová, M.; Ruzicka, M.C. Measurement of Volumetric Mass Transfer Coefficient in Bubble Columns. ChemEngineering 2018, 2, 19. [Google Scholar] [CrossRef]
- Vandu, C.; Krishna, R. Influence of scale on the volumetric mass transfer coefficients in bubble columns. Chem. Eng. Process. Process Intensif. 2004, 43, 575–579. [Google Scholar] [CrossRef]
- Manjrekar, O.N.; Hamed, M.; Dudukovic, M.P. Gas hold-up and mass transfer in a pilot scale bubble column with and without internals. Chem. Eng. Res. Des. 2018, 135, 166–174. [Google Scholar] [CrossRef]
- McClure, D.D.; Kavanagh, J.M.; Fletcher, D.F.; Barton, G.W. Oxygen transfer in bubble columns at industrially relevant superficial velocities: Experimental work and CFD modelling. Chem. Eng. J. 2015, 280, 138–146. [Google Scholar] [CrossRef]
- Gourich, B.; Vial, C.; Azher, N.E.; Soulami, M.B.; Ziyad, M. Improvement of oxygen mass transfer estimation from oxygen concentration measurements in bubble column reactors. Chem. Eng. Sci. 2006, 61, 6218–6222. [Google Scholar] [CrossRef]
- Jasim, A.A.; Sultan, A.J.; Al-Dahhan, M.H. Impact of heat exchanging internals configurations on the gas holdup and bubble properties in a bubble column. Int. J. Multiph. Flow 2019, 112, 63–82. [Google Scholar] [CrossRef]
- Yu, C.H.; Huang, C.H.; Tan, C.S. A Review of CO2 Capture by Absorption and Adsorption. Aerosol Air Qual. Res. 2012, 12, 745–769. [Google Scholar] [CrossRef]


Publisher’s Note: MDPI stays neutral with regard to jurisdictional claims in published maps and institutional affiliations. |
© 2020 by the authors. Licensee MDPI, Basel, Switzerland. This article is an open access article distributed under the terms and conditions of the Creative Commons Attribution (CC BY) license (http://creativecommons.org/licenses/by/4.0/).