1. Introduction
The object of this research is the airflow through the axisymmetric mini gap (clearance) for given heights of the clearance, which are a fragment of the non-contact labyrinth seal. These types of seals are used in fluid-flow machines to minimize leakage. Leakage in the labyrinth seal has a direct impact on the flow machine efficiency. Such seals are also used in free-piston engines [
1], piston compressors [
2] and nuclear reactor assemblies [
3].
Analyses presented in this paper were inspired by research on the flow coefficient, which has been partly described in [
4]. During this research, we observed the step character of the flow coefficient change. The flow coefficient investigated in this paper is defined as the ratio of the real mass flow to the theoretical mass flow resulting from the Saint-Venant equation. The discussed coefficient concerns the flow through one clearance. There are many calculation models presented in the scientific literature [
5,
6,
7,
8,
9,
10] that include correction factors allowing for precise determination of the leakage. The coefficient discussed in this paper is sometimes described in the literature as the discharge coefficient c
D. It is used to determine the relative leakage amount [
11].
The above-mentioned classic models are often modified to adjust them to the specific geometry of the seal to determine the leakage amount more precisely. A modified Stodola method was used to determine gas and liquid leakage in groove seals; its results were discussed in [
12]. There is also a group of calculation models based on friction factors. In [
13], the modified Neumann method and Moody’s friction-factor model were discussed. The authors of that paper determined the leakage amount, distribution of the pressure and the gas velocity in chambers of the straight-through seal. The friction factor, determined experimentally, was used in the model for determining the leakage in a short labyrinth seal [
14]. In [
15], the gas flow in the straight-through and stepped seals was described by the friction factor. This factor was also used to describe the gas flow in the slot seal [
16]. The model presented therein was based on the enthalpy balance equation. It included the dissipations of kinetic energy, and the gas friction was described by the modified Blasius coefficient.
Leakage in the labyrinth seal depends on various geometric parameters, such as the chamber shape [
17,
18], tooth thickness [
19] and the angle of teeth inclination [
20].
This paper presents the relation between the height of the seal clearance and the change of the gas flow described by the flow coefficient and the leakage amount. This was done based on experimental data and CFD calculations.
2. Stand for Experimental Research
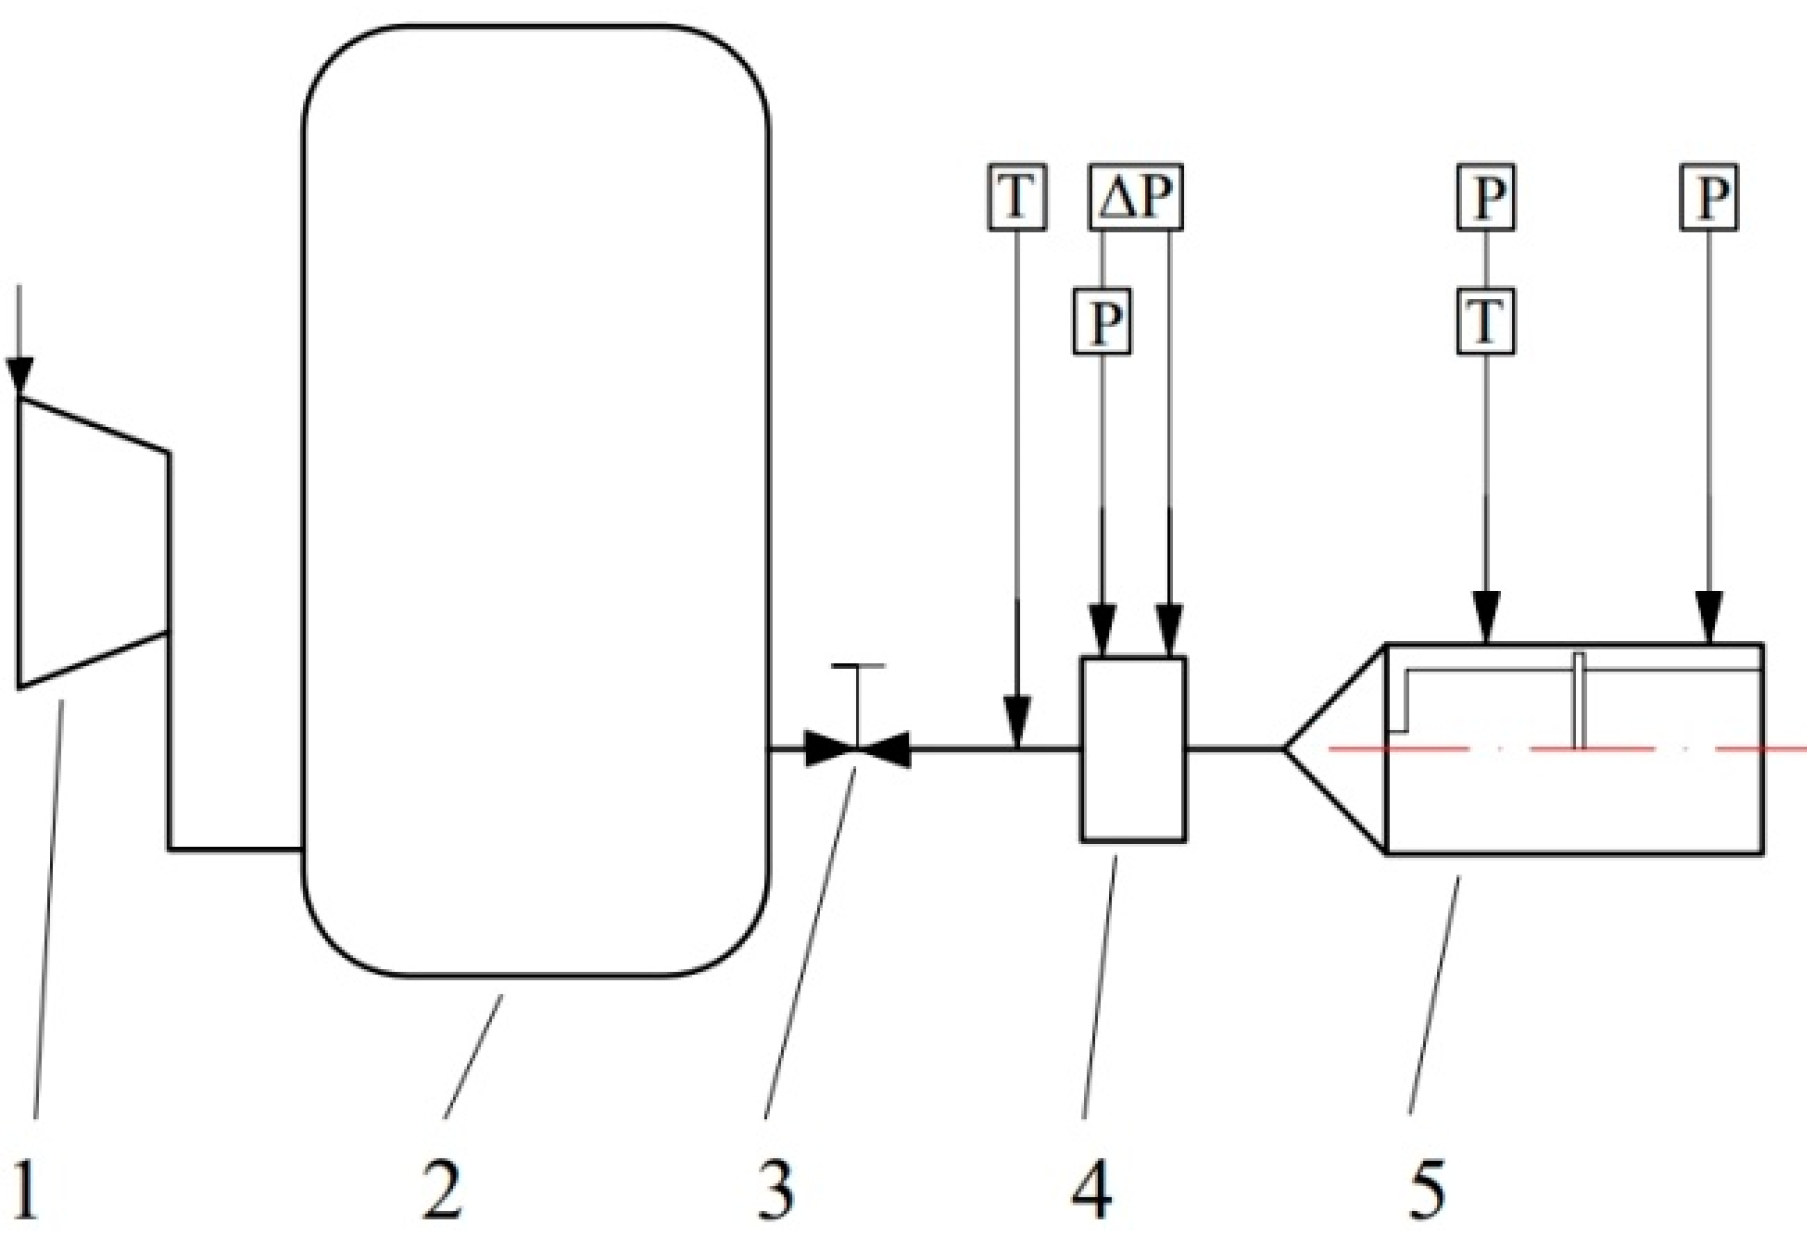
Experimental research was conducted on the test stand built of the compressor, tank, regulation valve and the sealing model (
Figure 1). The seal model incorporates the body and the internal part placed centrically in the body on which the investigated geometry is located.
The measurement of the mass flow was performed with an orifice flow meter. The measuring stand was equipped with an absolute pressure transmitter with a measuring range of 0–5 × 10
5 Pa and a measuring accuracy of ±0.25%, as well as with the pressure difference transmitters in a measuring range of 0–0.25 × 10
5 Pa and a measuring accuracy of ±0.2%. Gas temperature was measured with Type T thermocouples. This research stand was described in detail in [
21]. Detailed data concerning the accuracy of parameters being measured are summarized in
Table 1, and the arrangement of sensors is shown in
Figure 1 (according to
Table 1).
For the geometry being analyzed, the mass flow was measured, and the analysis of errors was performed. The precision of teeth manufacturing—(thickness B and of the dimension of clearance RC) is +/− 0.02 mm. The range of the mass flow measurement accuracy was determined in such a way that two extreme possible measurements of the mass flow resulting from overlapping errors in separate measured values, summarized in
Table 1, were assumed.
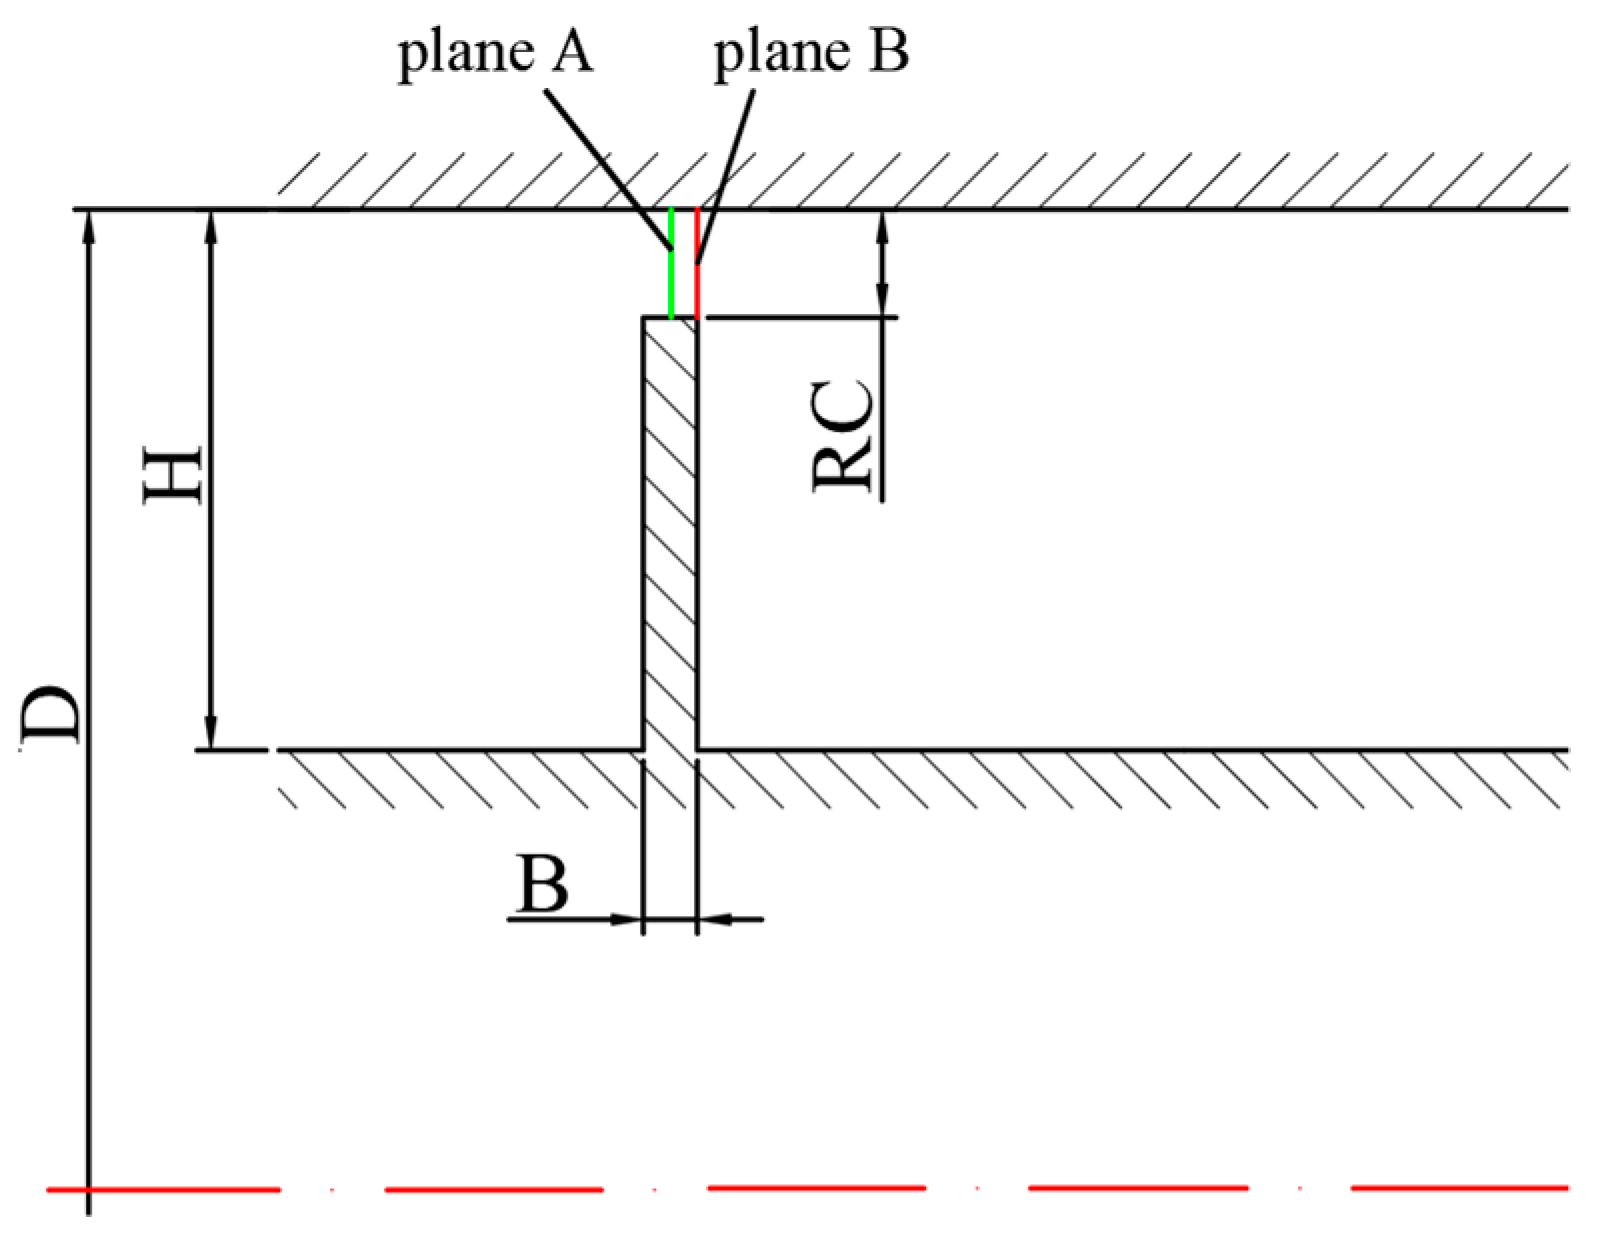
The object of research is the fragment of the straight-through seal consisting of a single tooth. The examined geometry is shown in
Figure 2. Data concerning the seal geometry are summarized in
Table 2. Experimental research and CFD analysis were performed for non-rotating shaft and tooth.
3. Analysis of Data from Experimental Research
The mass flow flowing through the radial clearance depends on gas total parameters upstream from the clearance p
01, T
0 and the static pressure p
2 downstream from the clearance. One of the parameters describing the mass flow is the ratio of the said pressures upstream and downstream from the clearance, noted as:
Theoretical mass flow is defined by the Saint-Venant equation [
22]
where the flow area in the clearance is noted as
Equation (2) includes the flow number Ψ, which depends on the gas type. Gas is defined by the isentropic exponent κ and gas constant R. For the subcritical air flow β > 0.5283, this flow number is in the following form [
22]
For the supercritical flow characterized by the critical pressure ratio β < 0.5283, the flow number takes the following form
The flow coefficient was defined based on the Saint-Venant equation as
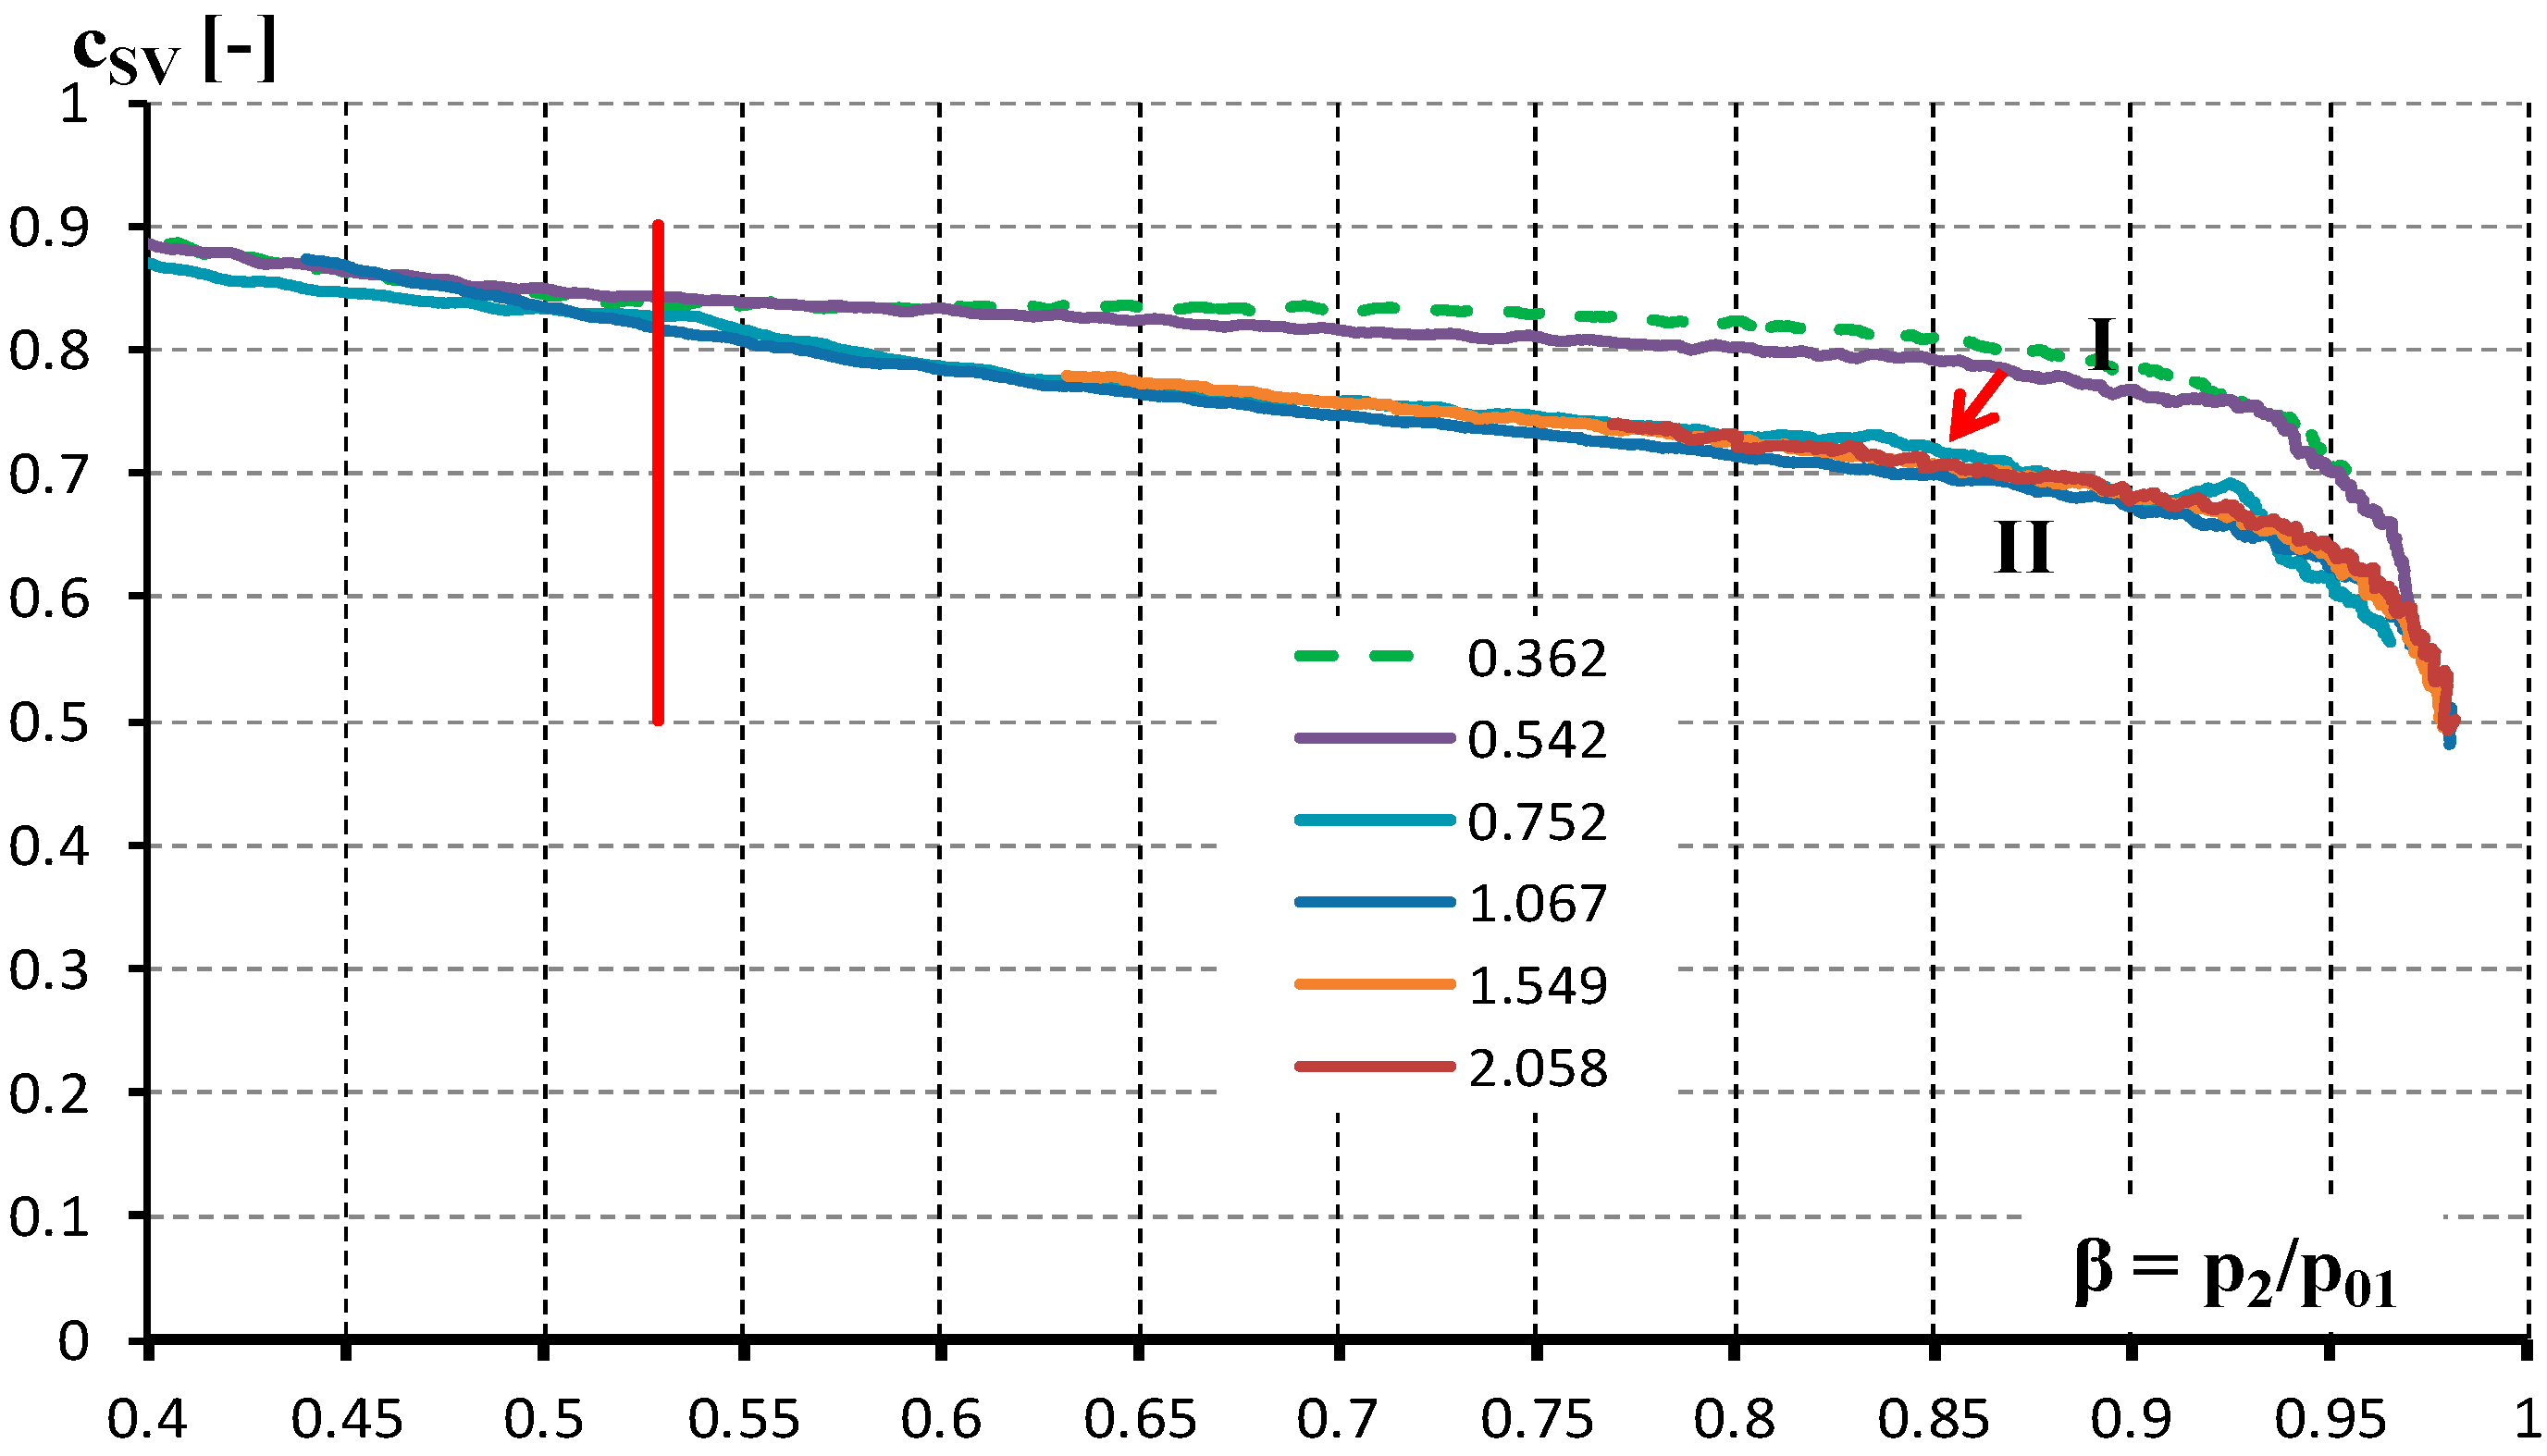
Based on data collected from experiments, we determined the variability of the coefficient c
SV versus the pressure ratio β in the range from 0.528 to 0.96 (
Figure 3). Tests were conducted for the geometry of clearance RC heights ranging from 0.362 to 2.058 mm (
Table 1).
Figure 3 shows that we have obtained two trends in changes of the coefficient c
SV, between which the value changed steeply: the first trend of larger values of the coefficient for clearance heights from 0.362 to 0.542 mm and the second one for clearance heights from 0.752 to 2.058 mm.
The first trend is characterized by considerably larger values of the coefficient c
SV in the whole range of the pressure ratio β being investigated (
Figure 3).
Figure 3 shows that between clearances from the first group (I group: 0.362, 0.542 mm) and clearances from the second group (II group: 0.752, 1.067, 1.549, 2.058, 1.5, 2 mm), there is a steep change of the flow coefficient. Therefore, we can expect a rapid change in integrity between I and II groups of clearance heights.
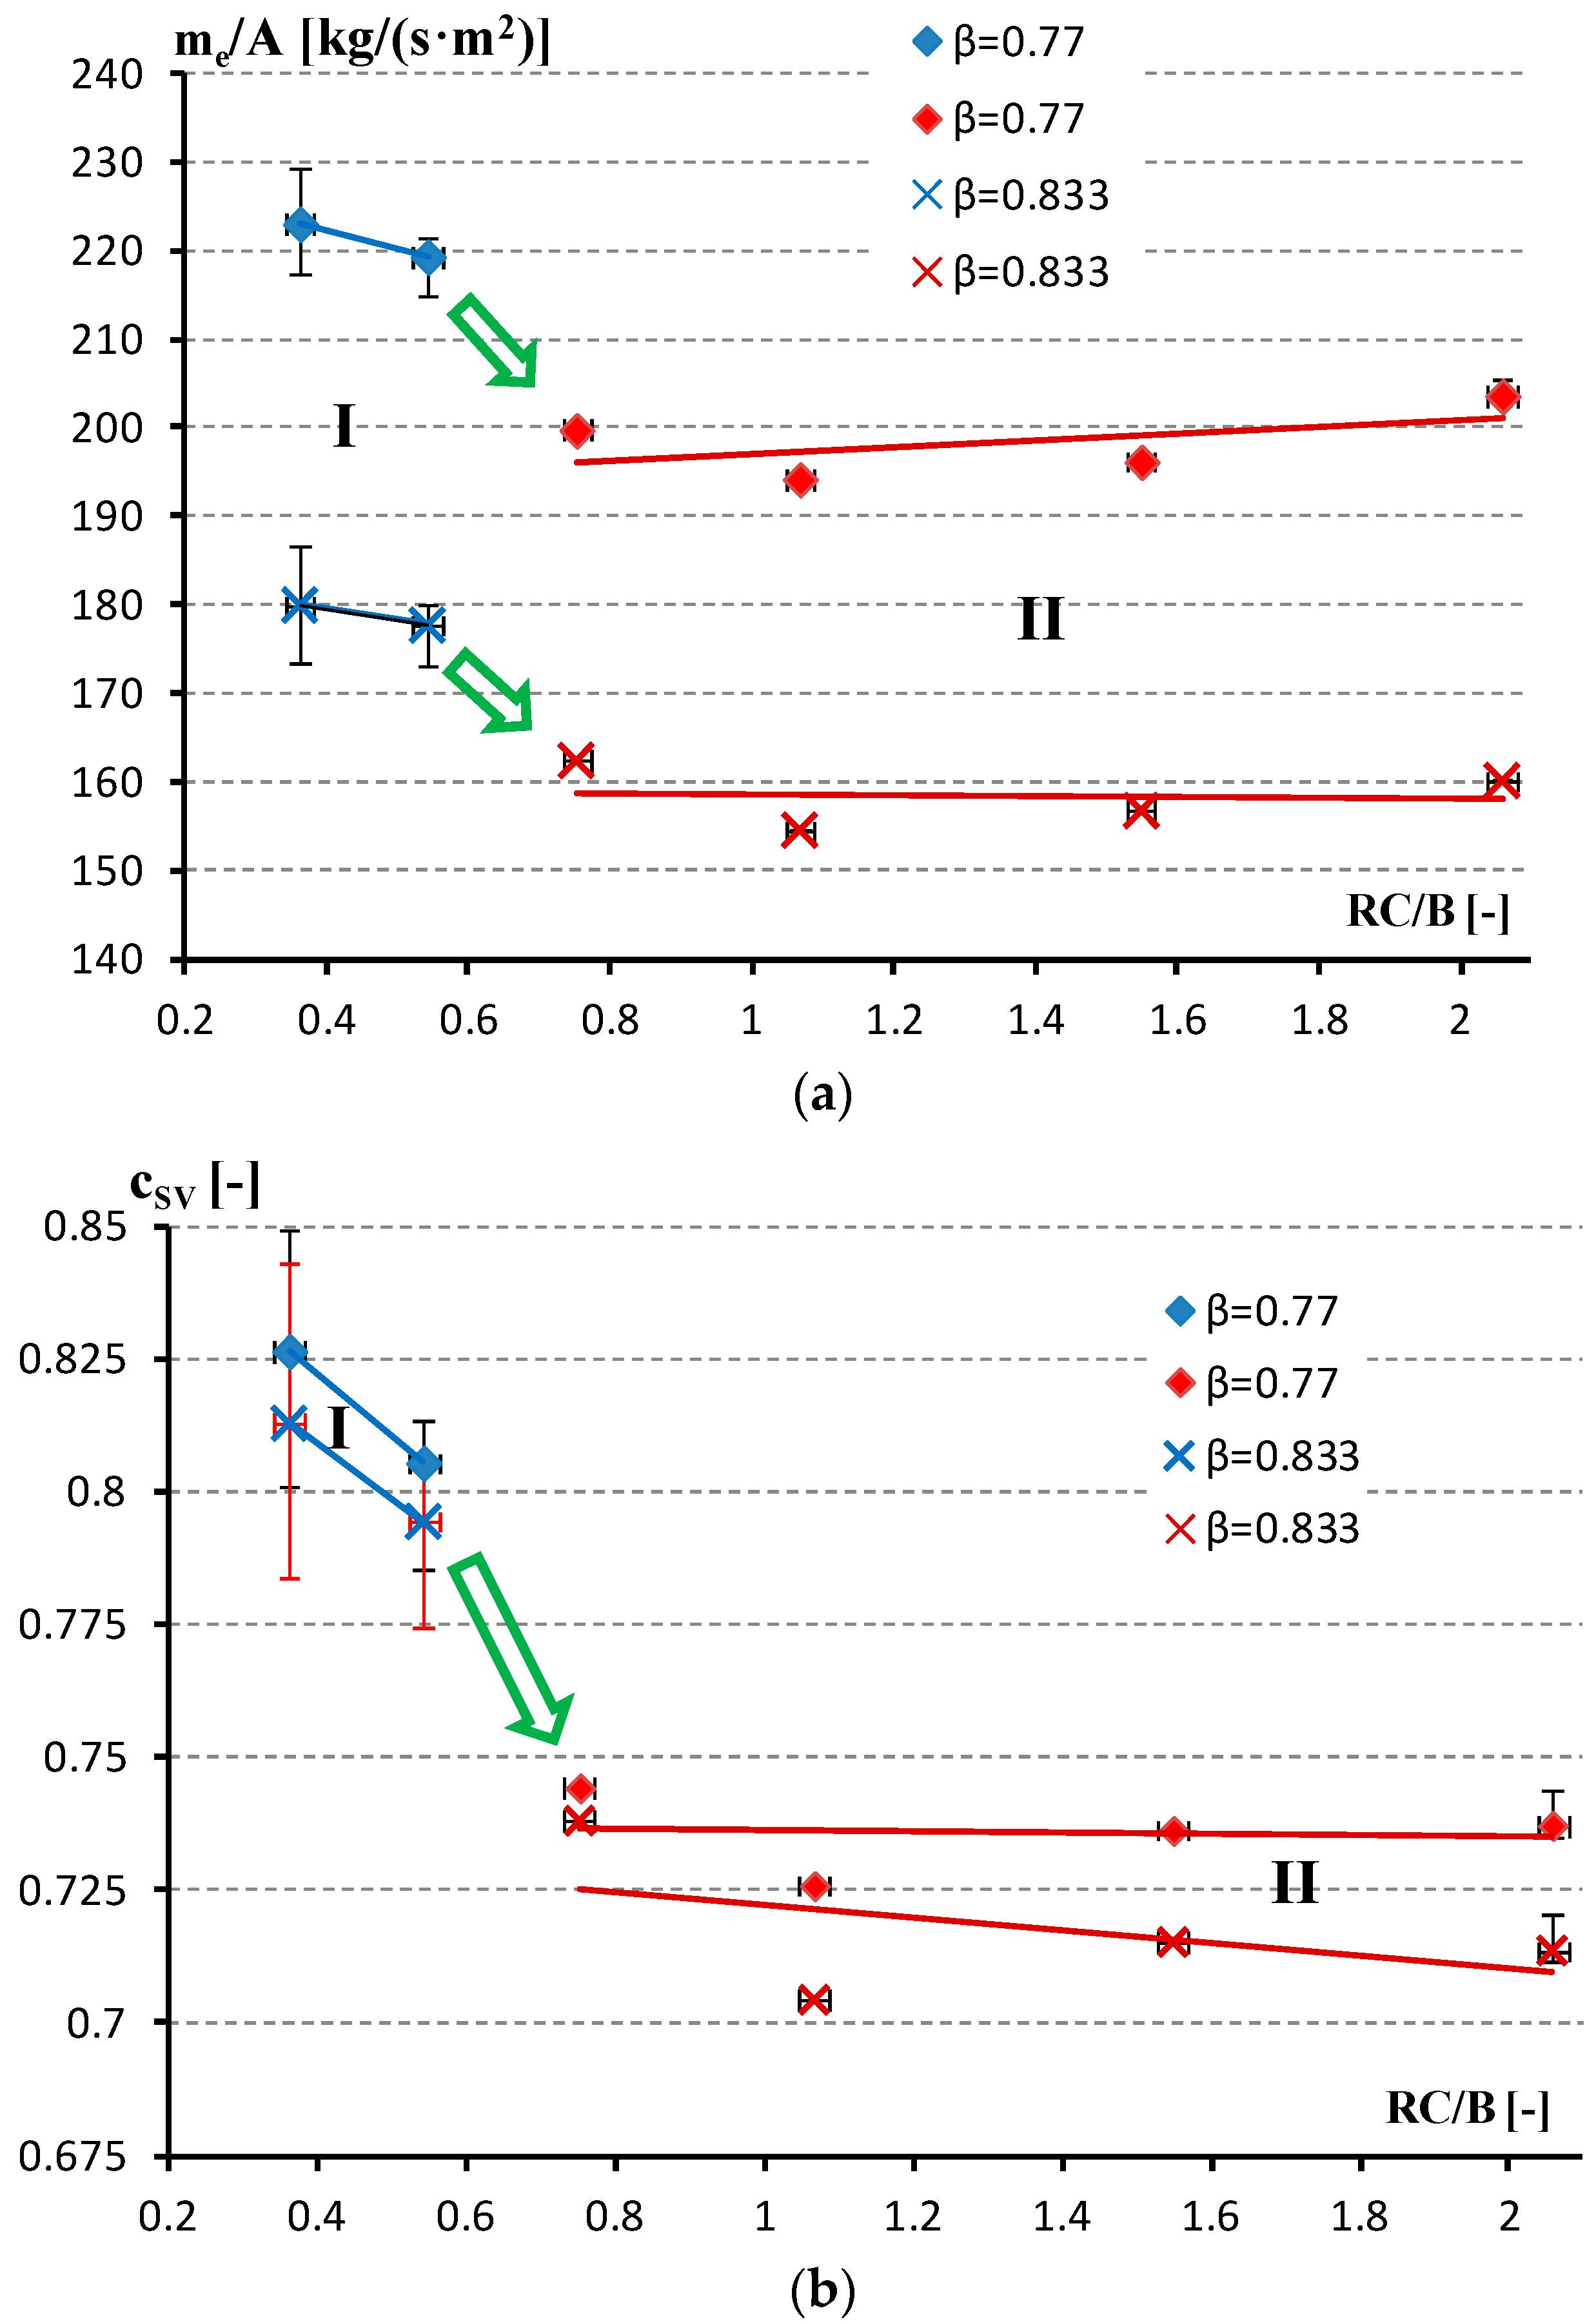
To check this phenomenon,
Figure 4 compares the change of the mass flow to the flow field
ratio and of the coefficient c
SV versus the ratio of the clearance height to the tooth thickness RC/B for two pressure ratios β = 0.77 and 0.833.
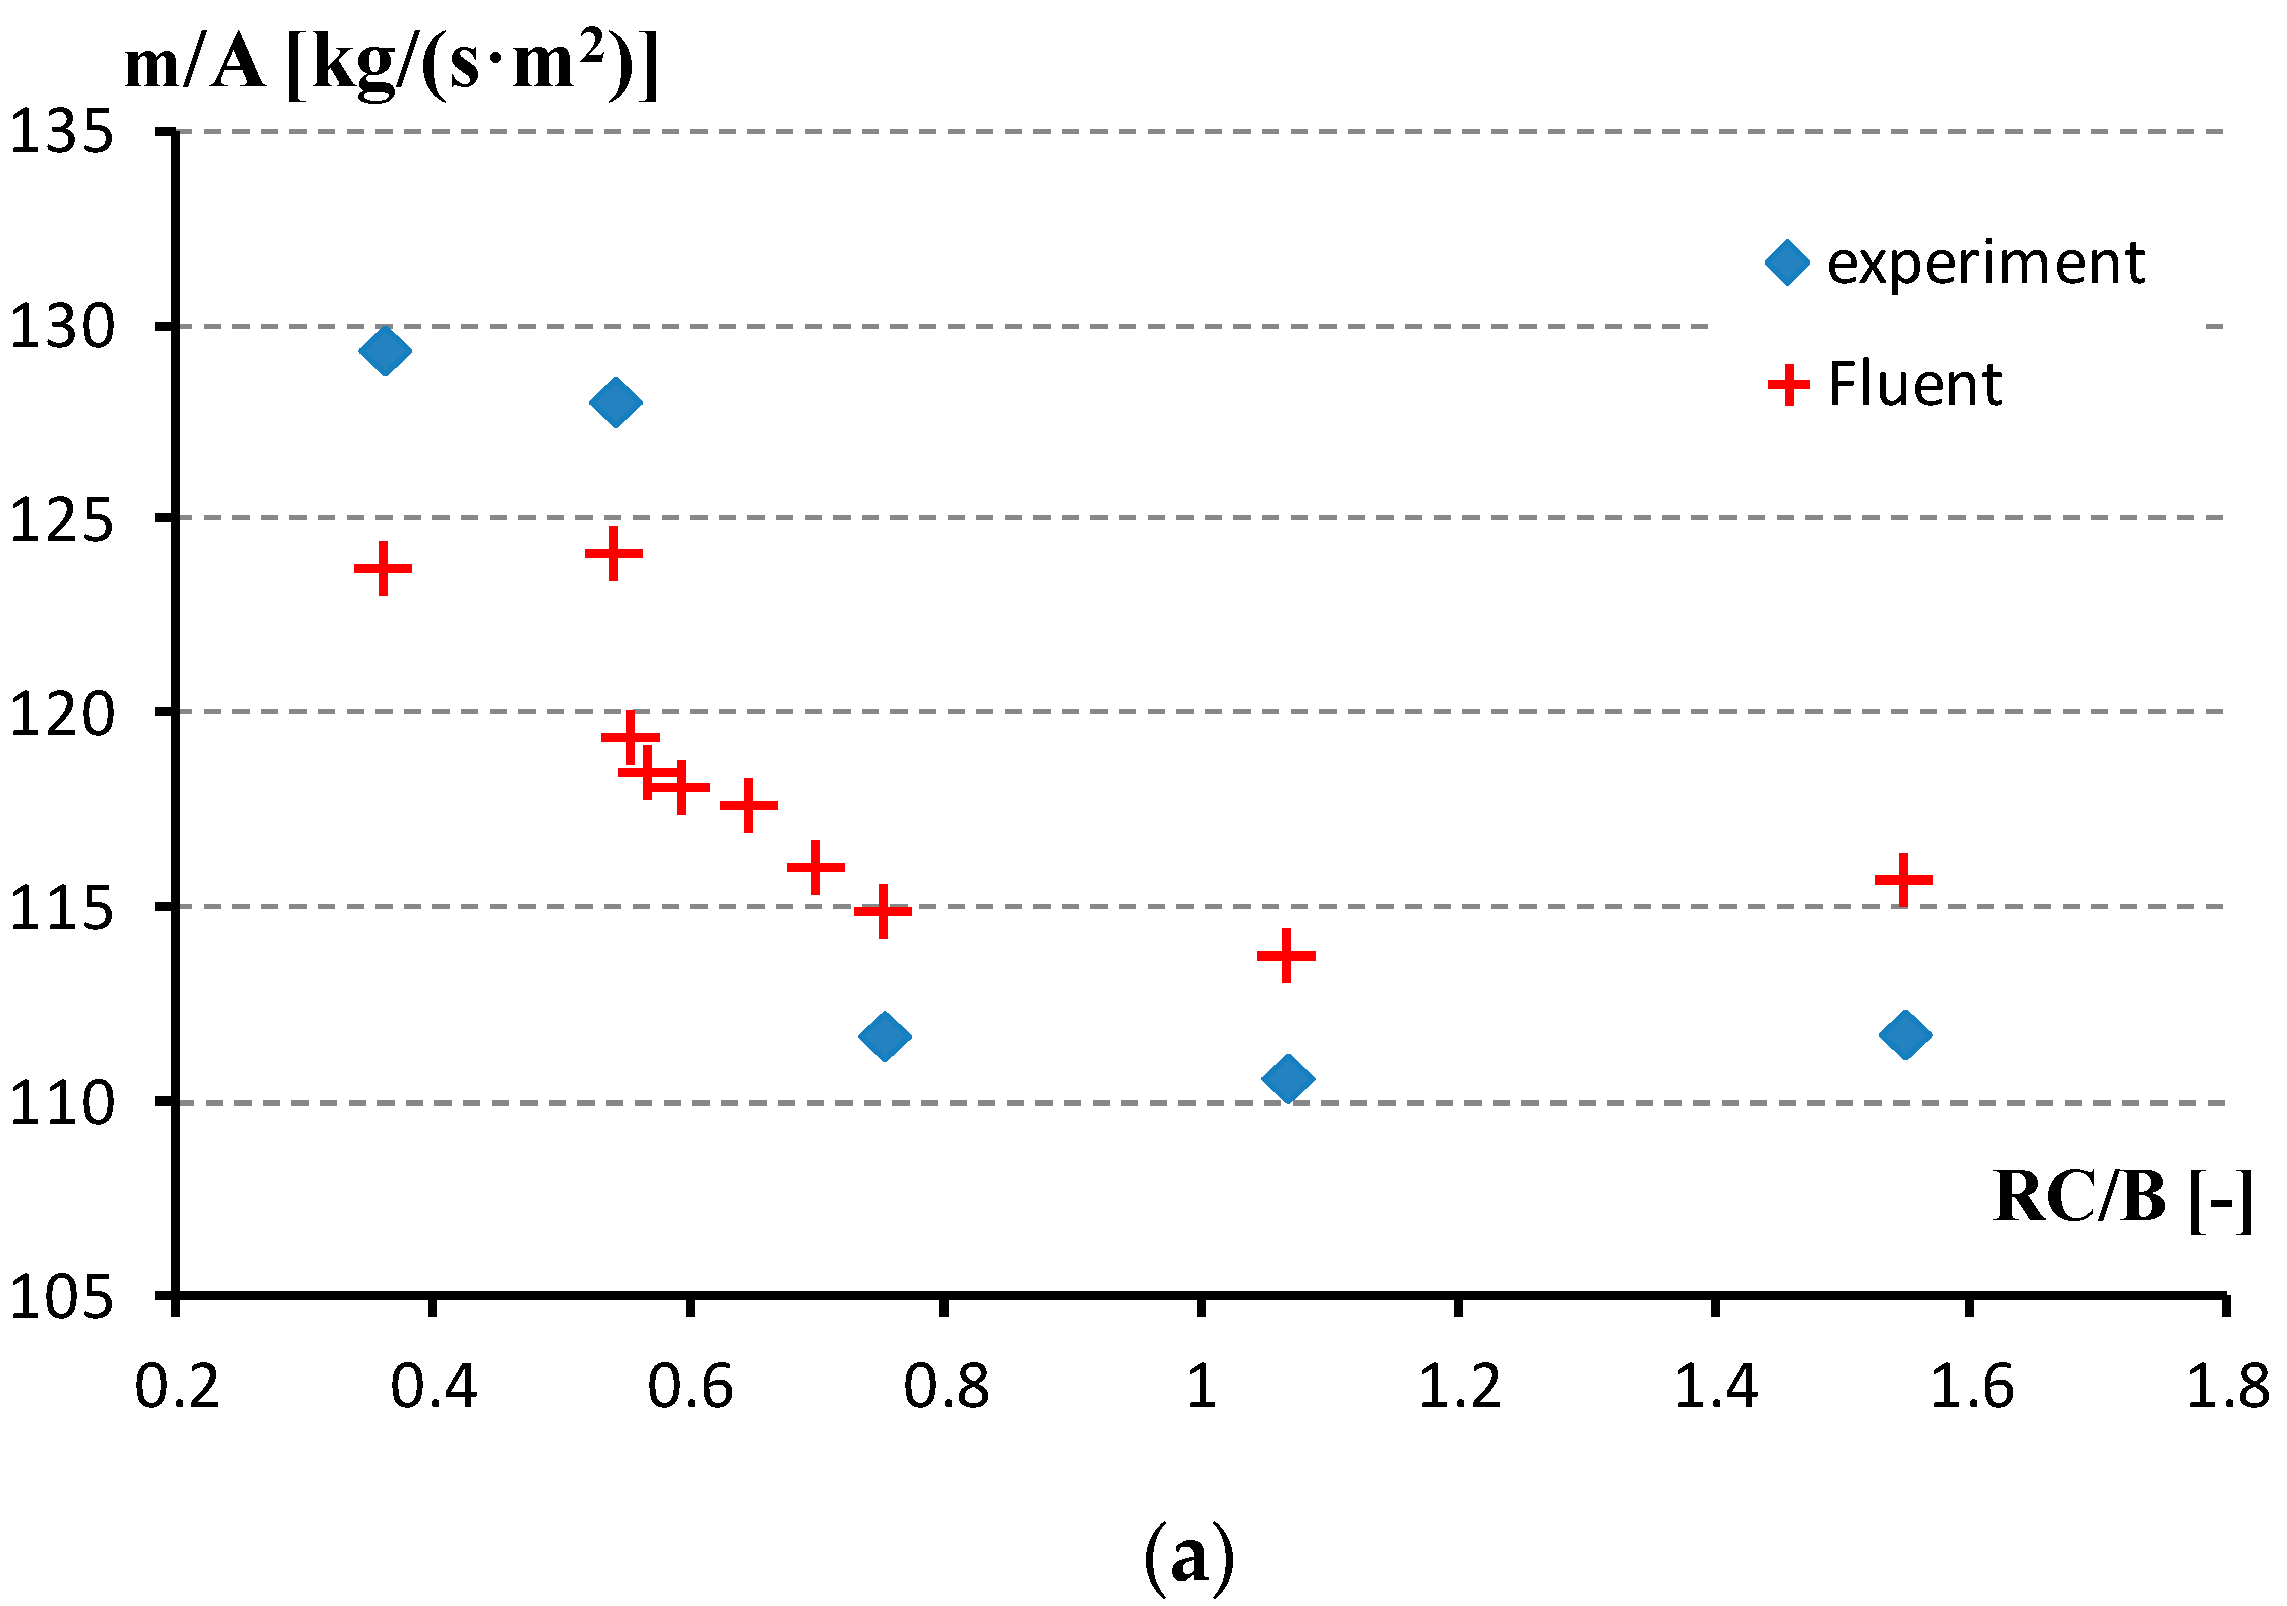
In
Figure 4a, we can observe a change of the mass flow to flow area ratio
for β from 0.77 to 0.833. However, for the first data group (I) (marked in blue on the graph), when the ratio RC/B increases, the ratio
decreases slightly, and for the second data group (II) (marked in red on the graph), the value
is almost constant for the range RC/B from 0.752 to 2.058.
Data presented in
Figure 4b confirm the change of the coefficient c
SV value. The change of the coefficient c
SV is greater than the maximum range of the error in measurement. The lowest value of the coefficient c
SV was obtained for the parameter RC/B = 1.067 mm.
The next part of this paper will be focused on explaining this phenomenon.
4. Results of CFD Calculations
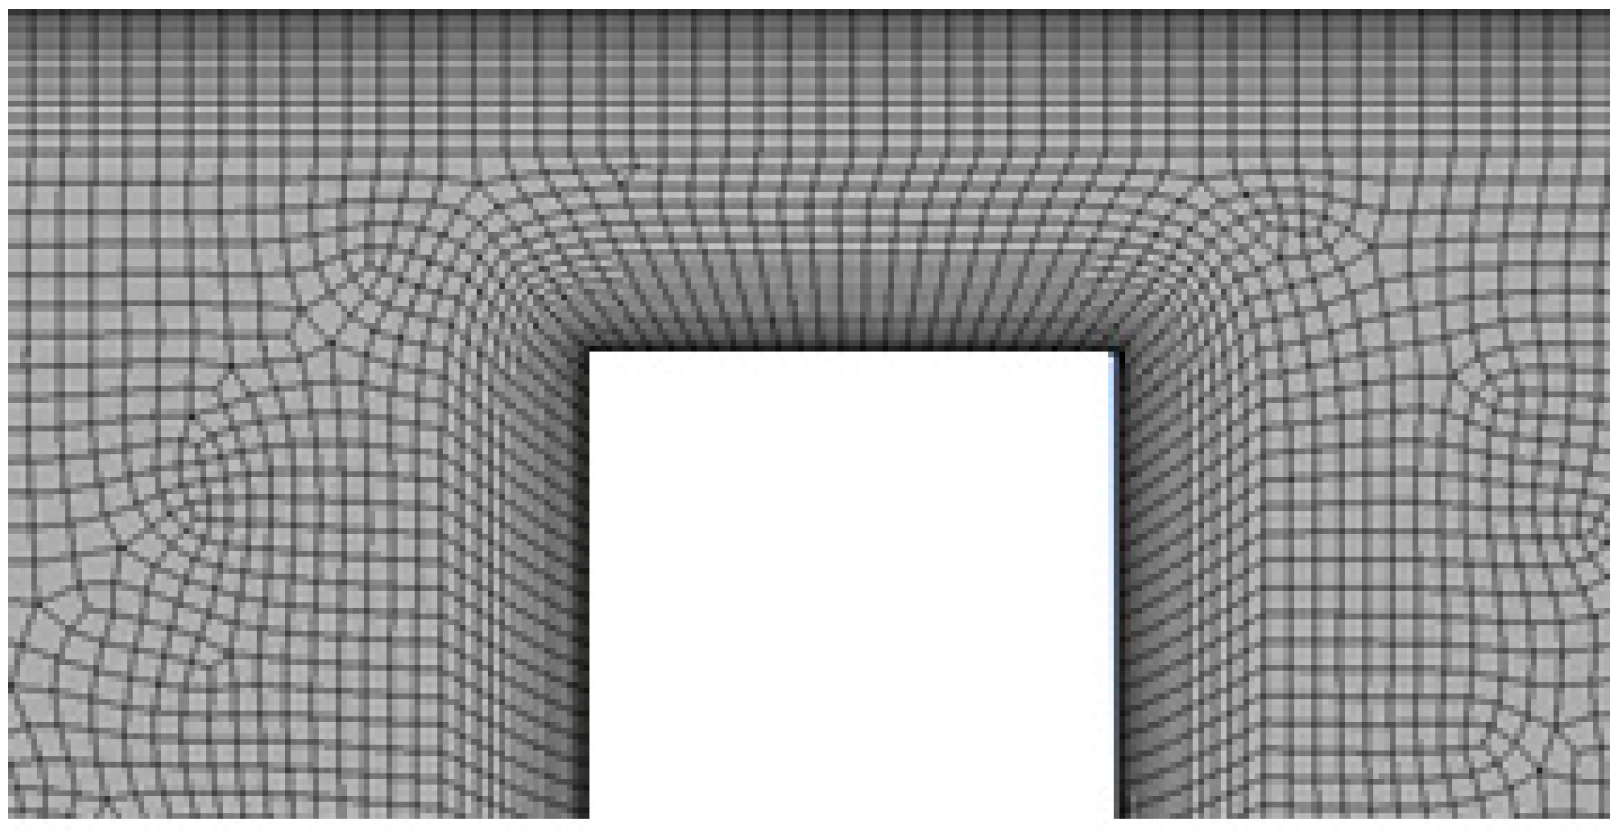
To explain the change of integrity of the examined geometry we simulated the gas flow in the clearance using the Fluent software. The analyzed geometry is the 2D axisymmetric geometry. In the boundary layer, we establish 20 grid cells. To perform detailed analysis of the gas flow in the clearance, we used the k-ω SST turbulence model. We included the condition y+ < 2 in the boundary layer. A sample grid is shown in
Figure 5.
Calculations were performed for the air treated as a compressible ideal gas. The stationary calculations were performed using the Pressure Based Coupled Solver (PBCS). In the calculations, the Convergence Tolerance of 10
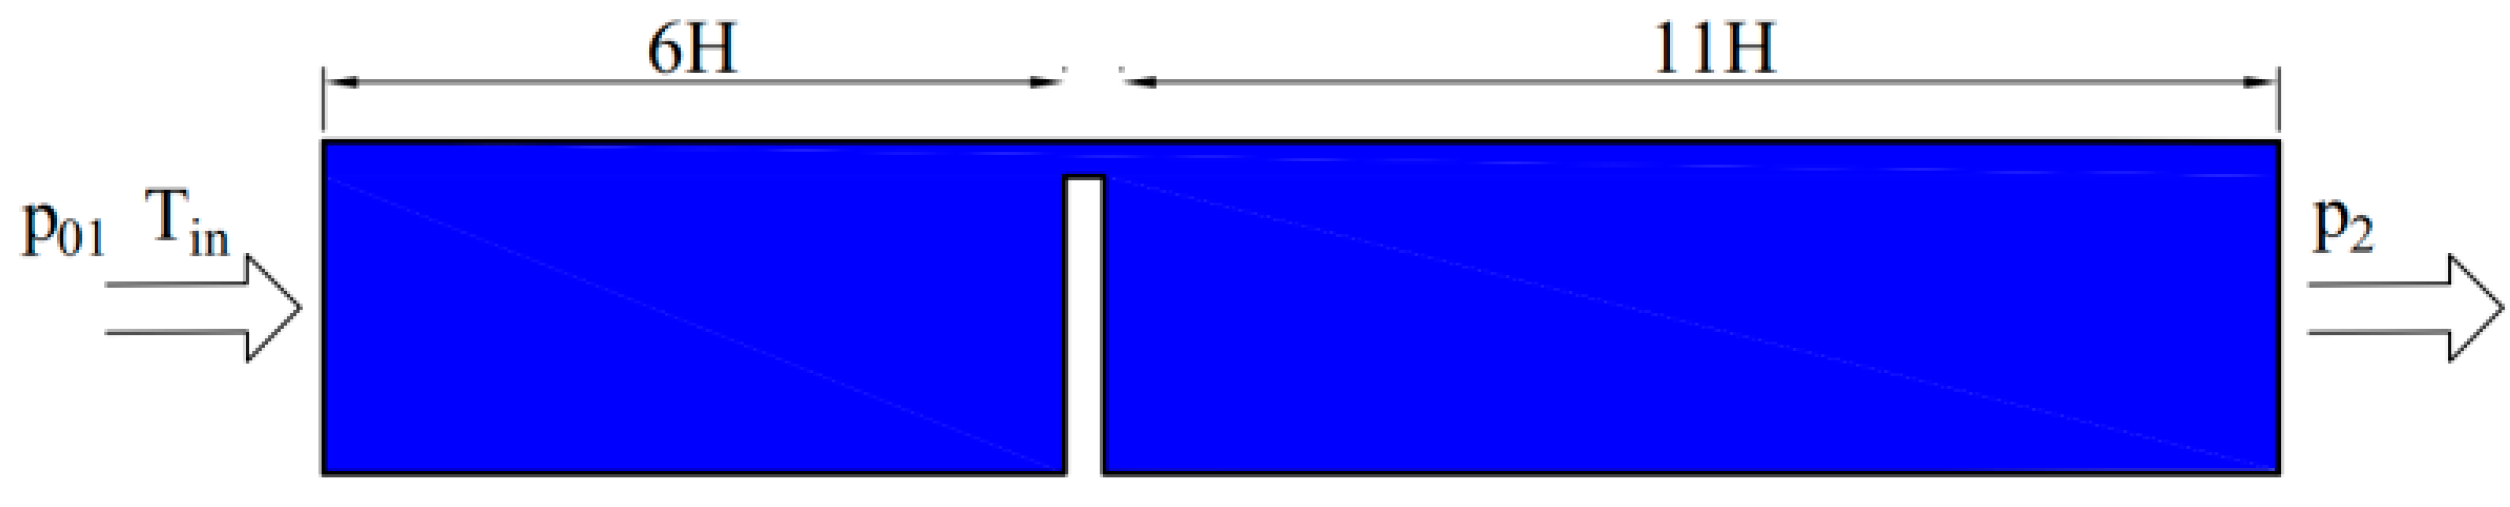
−6 was assumed. Based on the experimental data, in the inlet plane, the total pressure and temperature of the gas were assumed, while in the outlet plane, the static pressure was assumed (
Figure 6).
CFD calculations for the gas flow through the ring clearance of the geometry described in
Table 1 were performed for the pressure ratio
0.9. The values of the mass flow obtained from the experiment and from the CFD calculations are summarized in
Table 3. To determine the relative error of the mass flow, we used the following relationship:
Data collected in the above table indicate that the maximum relative difference of the mass flow obtained from the experiment and from CFD calculations is ±4%. Comparison of the quotient
and c
SV is shown in
Figure 7. To explain the character of parameters
and c
SV change from RC/B = 0.542 to 0.752, additional CFD calculations were performed.
Figure 7 shows results of these calculations for geometry RC/B ranging from 0.542 to 0.752, of the values equal to 1/16, 1/8, 1/4, 1/2 and 3/4 of this range, which correspond to the RC/B values of 0.555, 0.568, 0.595, 0.647 and 0.67, respectively.
Data in
Figure 7, obtained using the Fluent software, show a slight change of
and c
SV between RC/B = 0.542 and 0.555. For higher values of RC/B, from 0.555 to 0.752, we can observe smooth changes, but at a steep gradient.
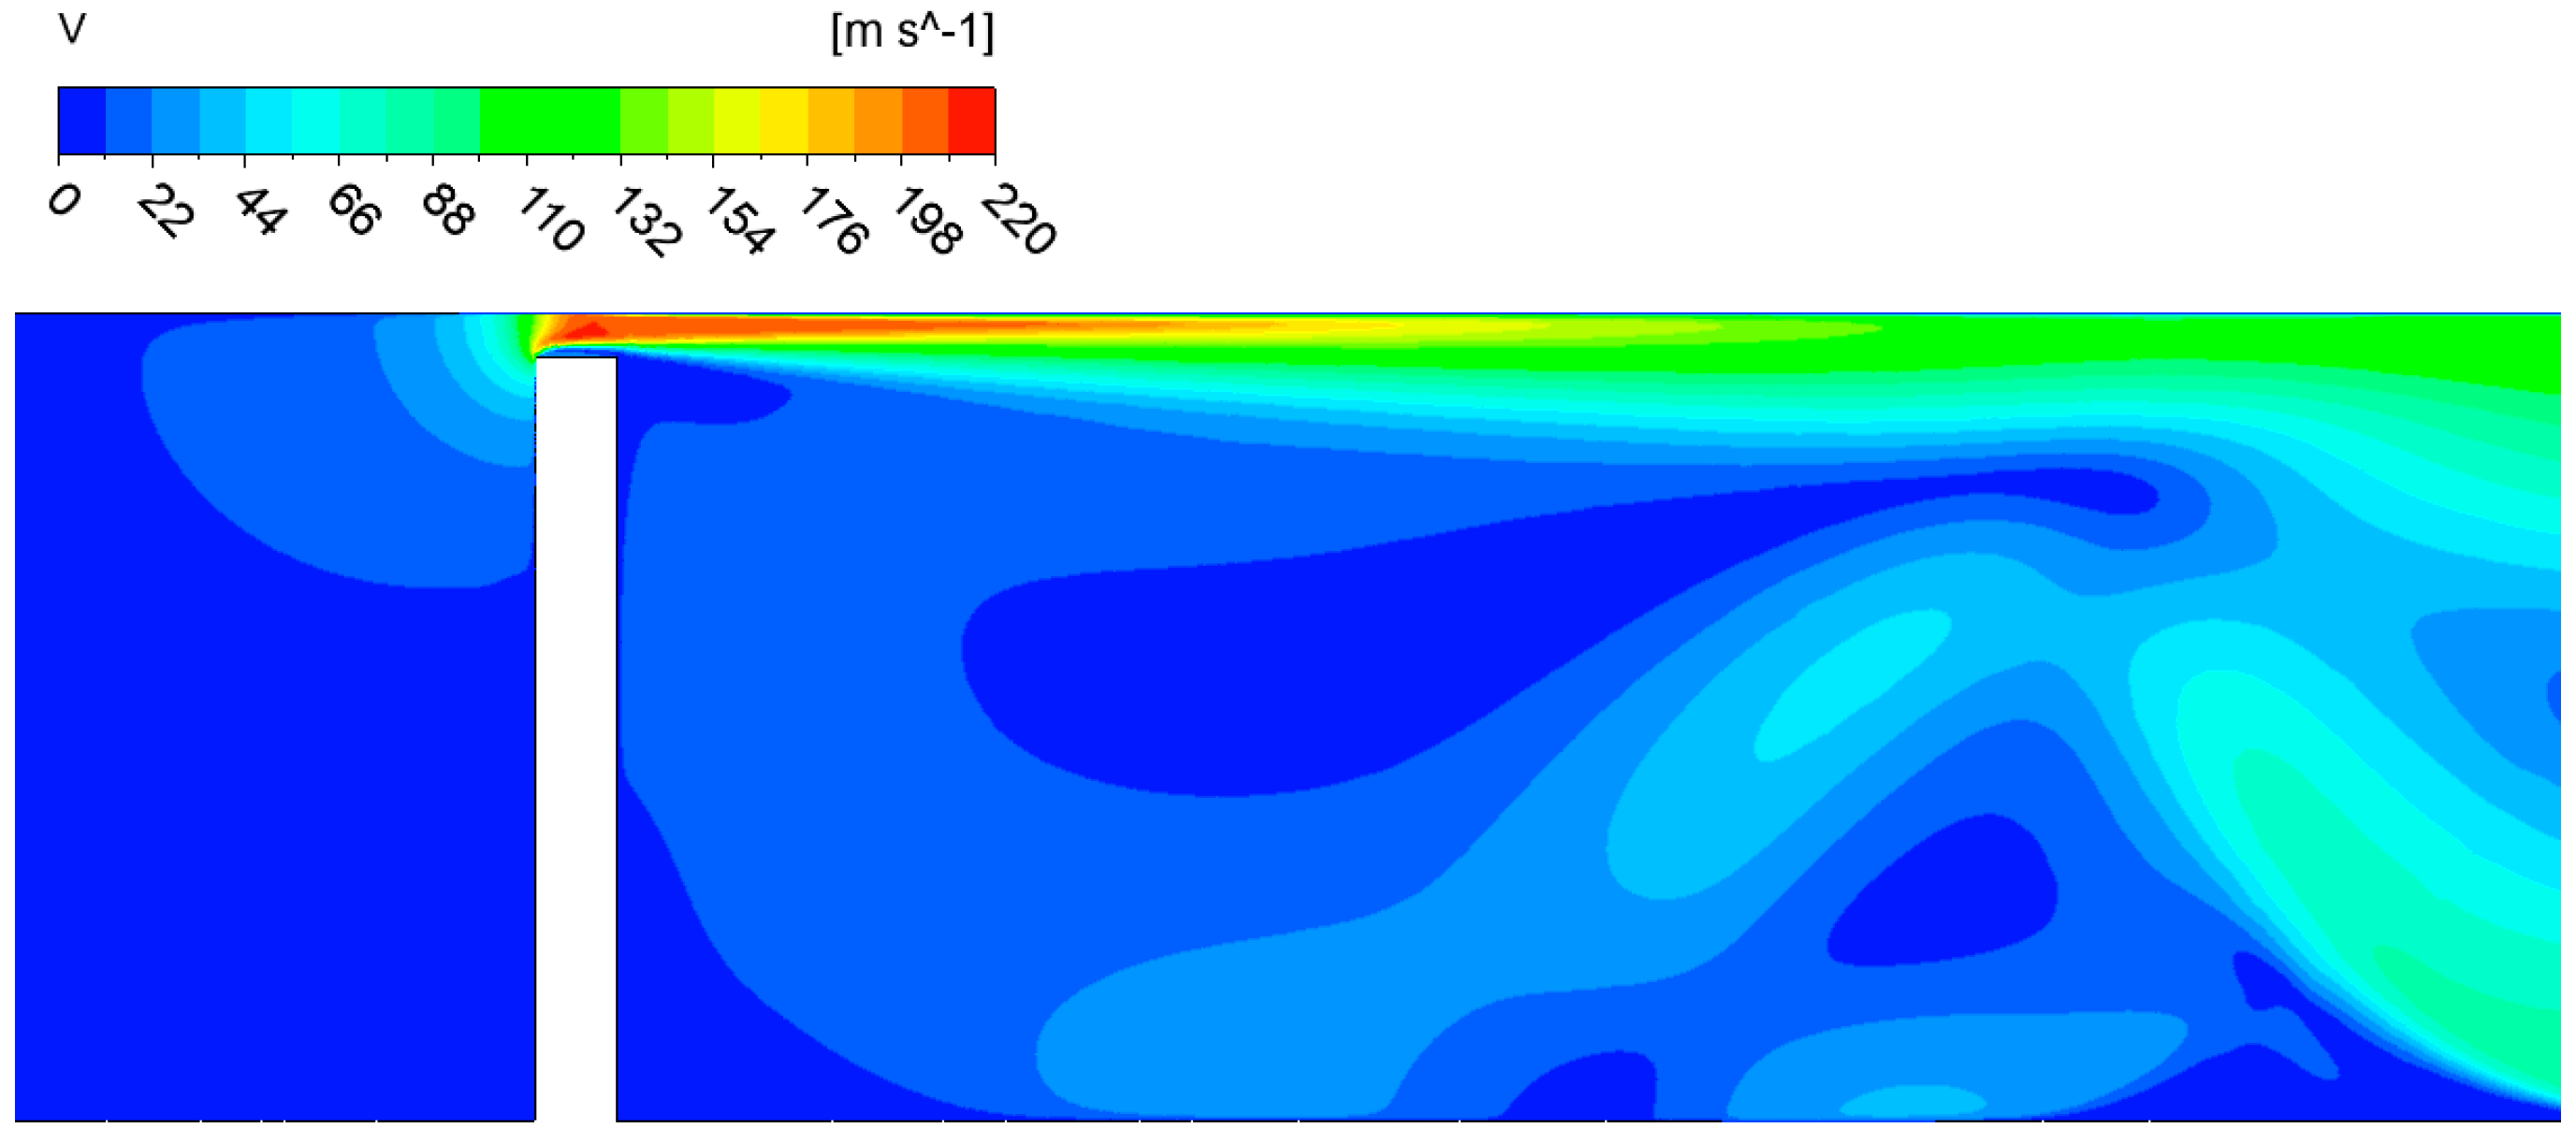
The maximum gas velocity was achieved in the central part of the clearance at approx. 220 m/s (
Figure 8). Downstream the clearance, a “jet” is created. Due to the gas vortex behind the back wall of the tooth and the presence of the body wall above the clearance, the gas velocity in the “jet” is reduced sharply.
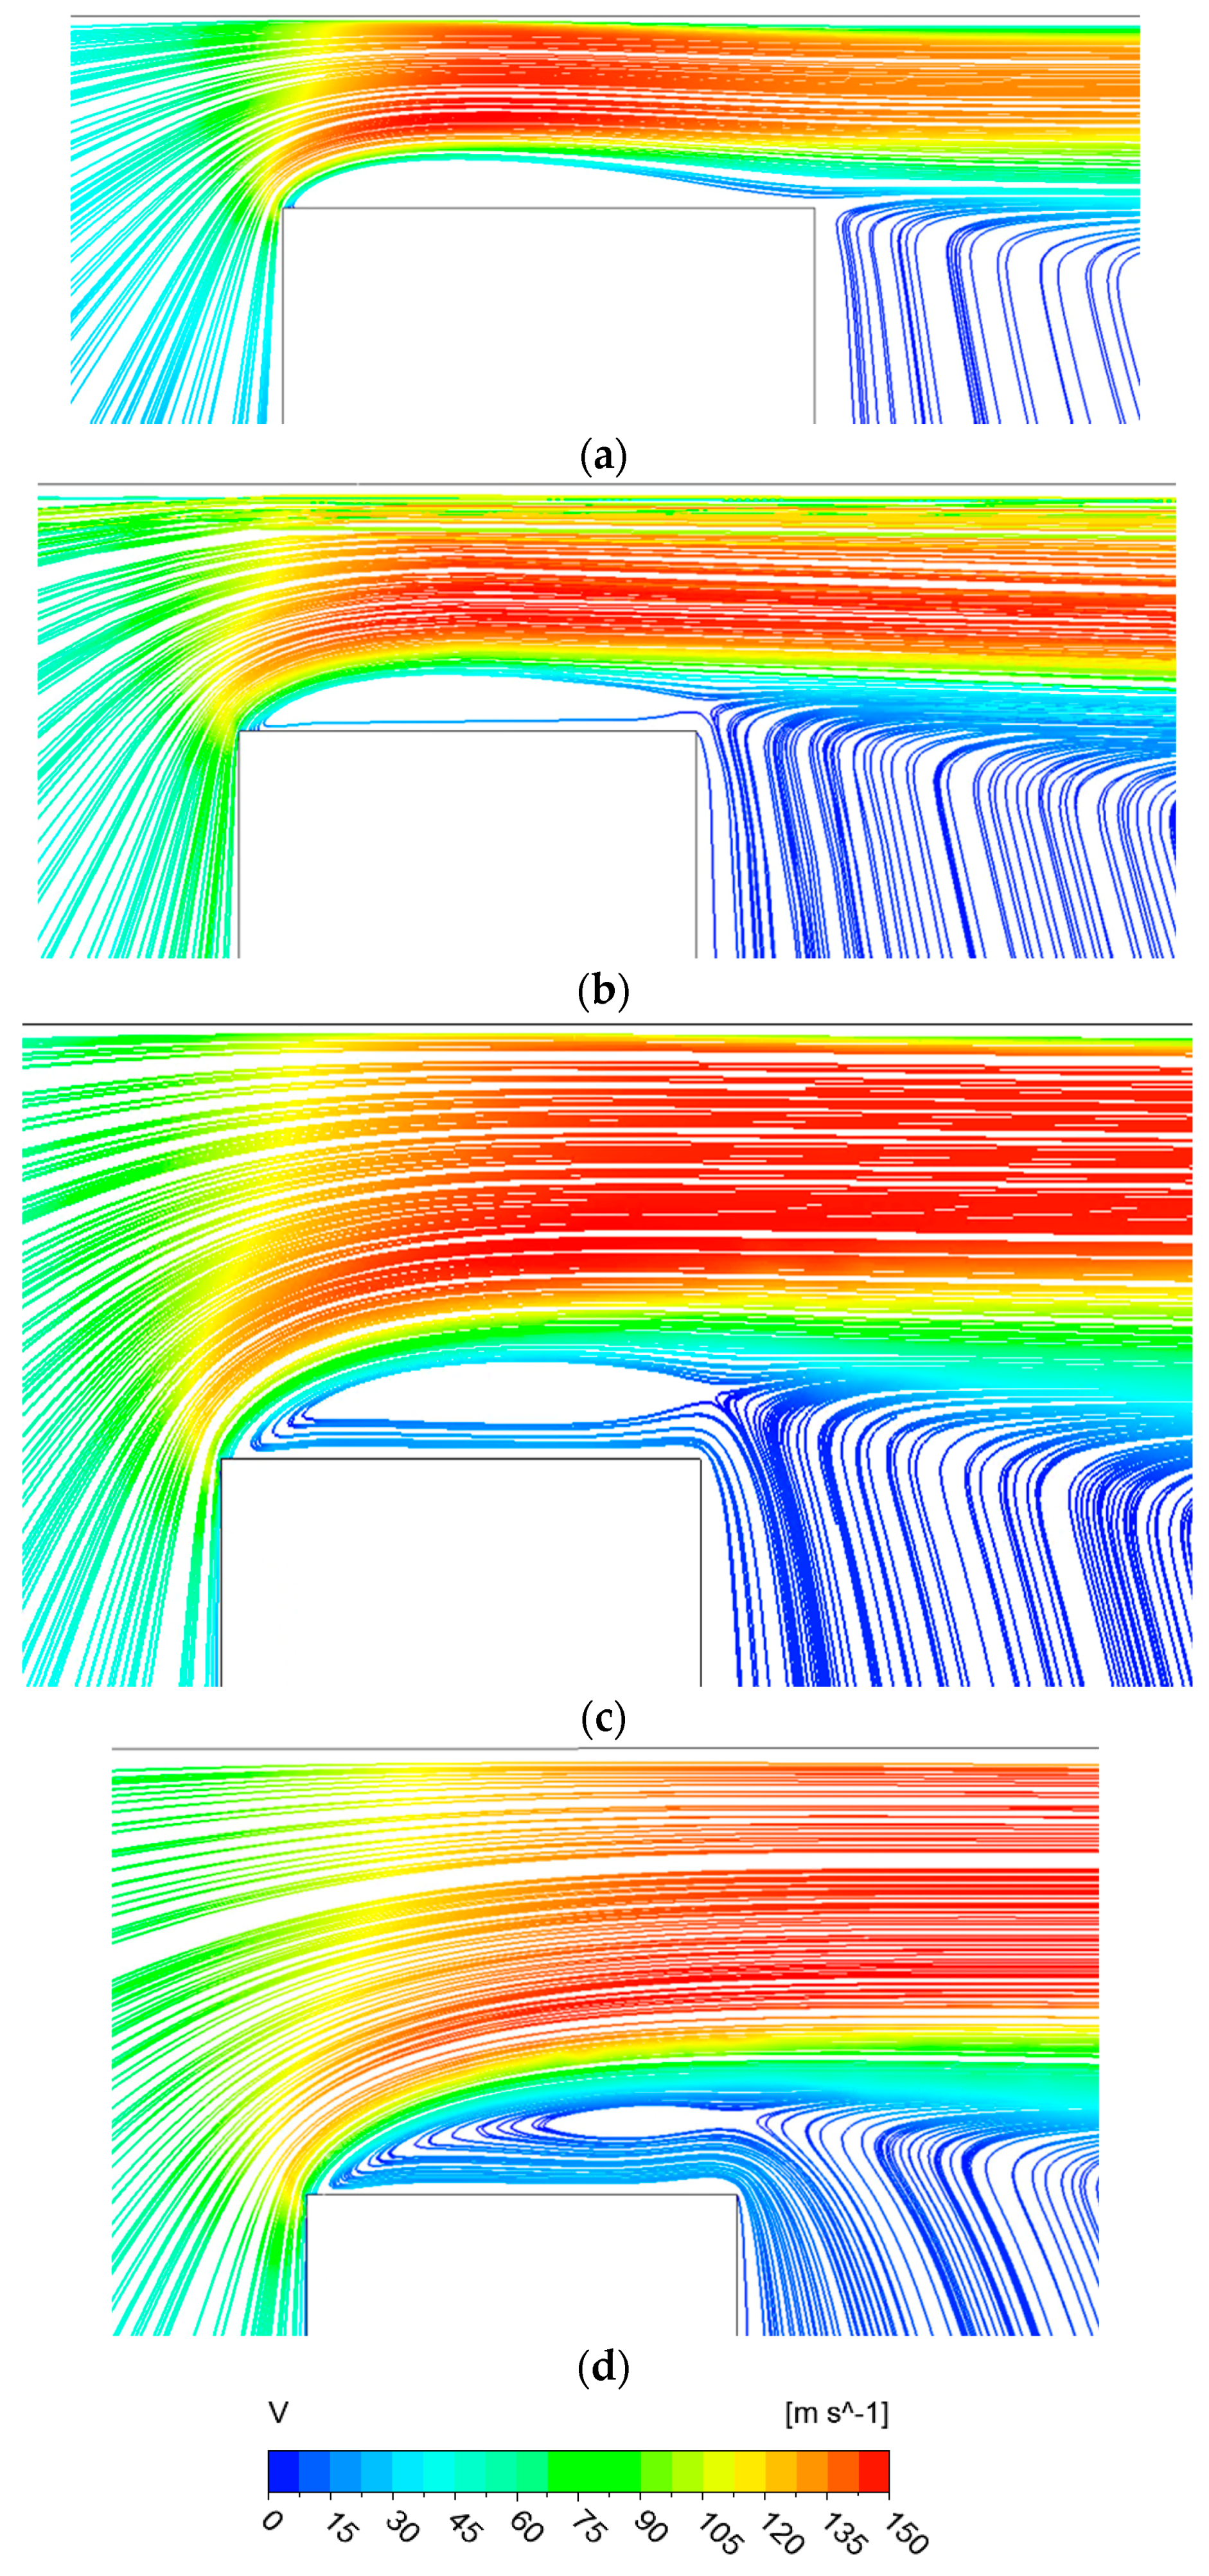
To analyze phenomena occurring in the clearance in detail, the courses of streamlines for four clearances, the lowest of those being investigated, that is, of 0.362, 0.542, 0.752 and 1.067 mm, are presented in
Figure 9.
The results from the course of streamlines (
Figure 9a) show that the smallest clearance, on the tooth top, forms a vortex, which restricts the flow in such a way that the flow takes the shape of an asymmetric convergent–divergent nozzle (asymmetric since in the upper part of the clearance, the flow is limited by flat body wall). It is worth noting that the flow area over the front and back (plane B) tooth edge is very nearly equal to the geometric area. For the clearance, RC = 0.542 mm; when compared with RC = 0.362 mm, the flow area decreases over the back edge of the tooth (plane B), where the reverse flow appears. From the clearance RC = 0.752 mm, the “jet” has a significantly different shape when compared with RC = 0.542, which does not resemble the convergent–divergent duct. The flow area along the clearance length decreases steadily. In the end part of the clearance, the recirculation zone intensifies greatly. Phenomena responsible for the flow contraction intensify for the geometry RC = 1.067 mm (
Figure 9d), which can be confirmed by data presented in
Figure 4 and
Figure 7.
Figure 10 presents distributions of axial velocities in two planes. Non-dimensional clearance height is defined as
The first plane was placed in the middle of the tooth thickness, and the second one was placed on the outflow from the clearance (plane A and plane B,
Figure 2).
Figure 10 shows that for the gas flow through clearances of increased heights (0.542, 0.752, 1.067 mm) in plane A, the value of the maximum product of the velocity in the axial direction and the density
decreases gradually, and velocity profiles flattens gradually.
The distribution in the bottom part of the clearance below y’ = 0.2 indicates that there is reverse flow of the velocity, achieving 25 kg/(s·m2), which is similar for the clearance heights being analyzed.
In plane B, the maximum
does not change significantly but occurs in an increasingly greater part of the section. In the bottom part of section B, for increasing clearances, the airflow intensifies in the direction opposite to the main flow.
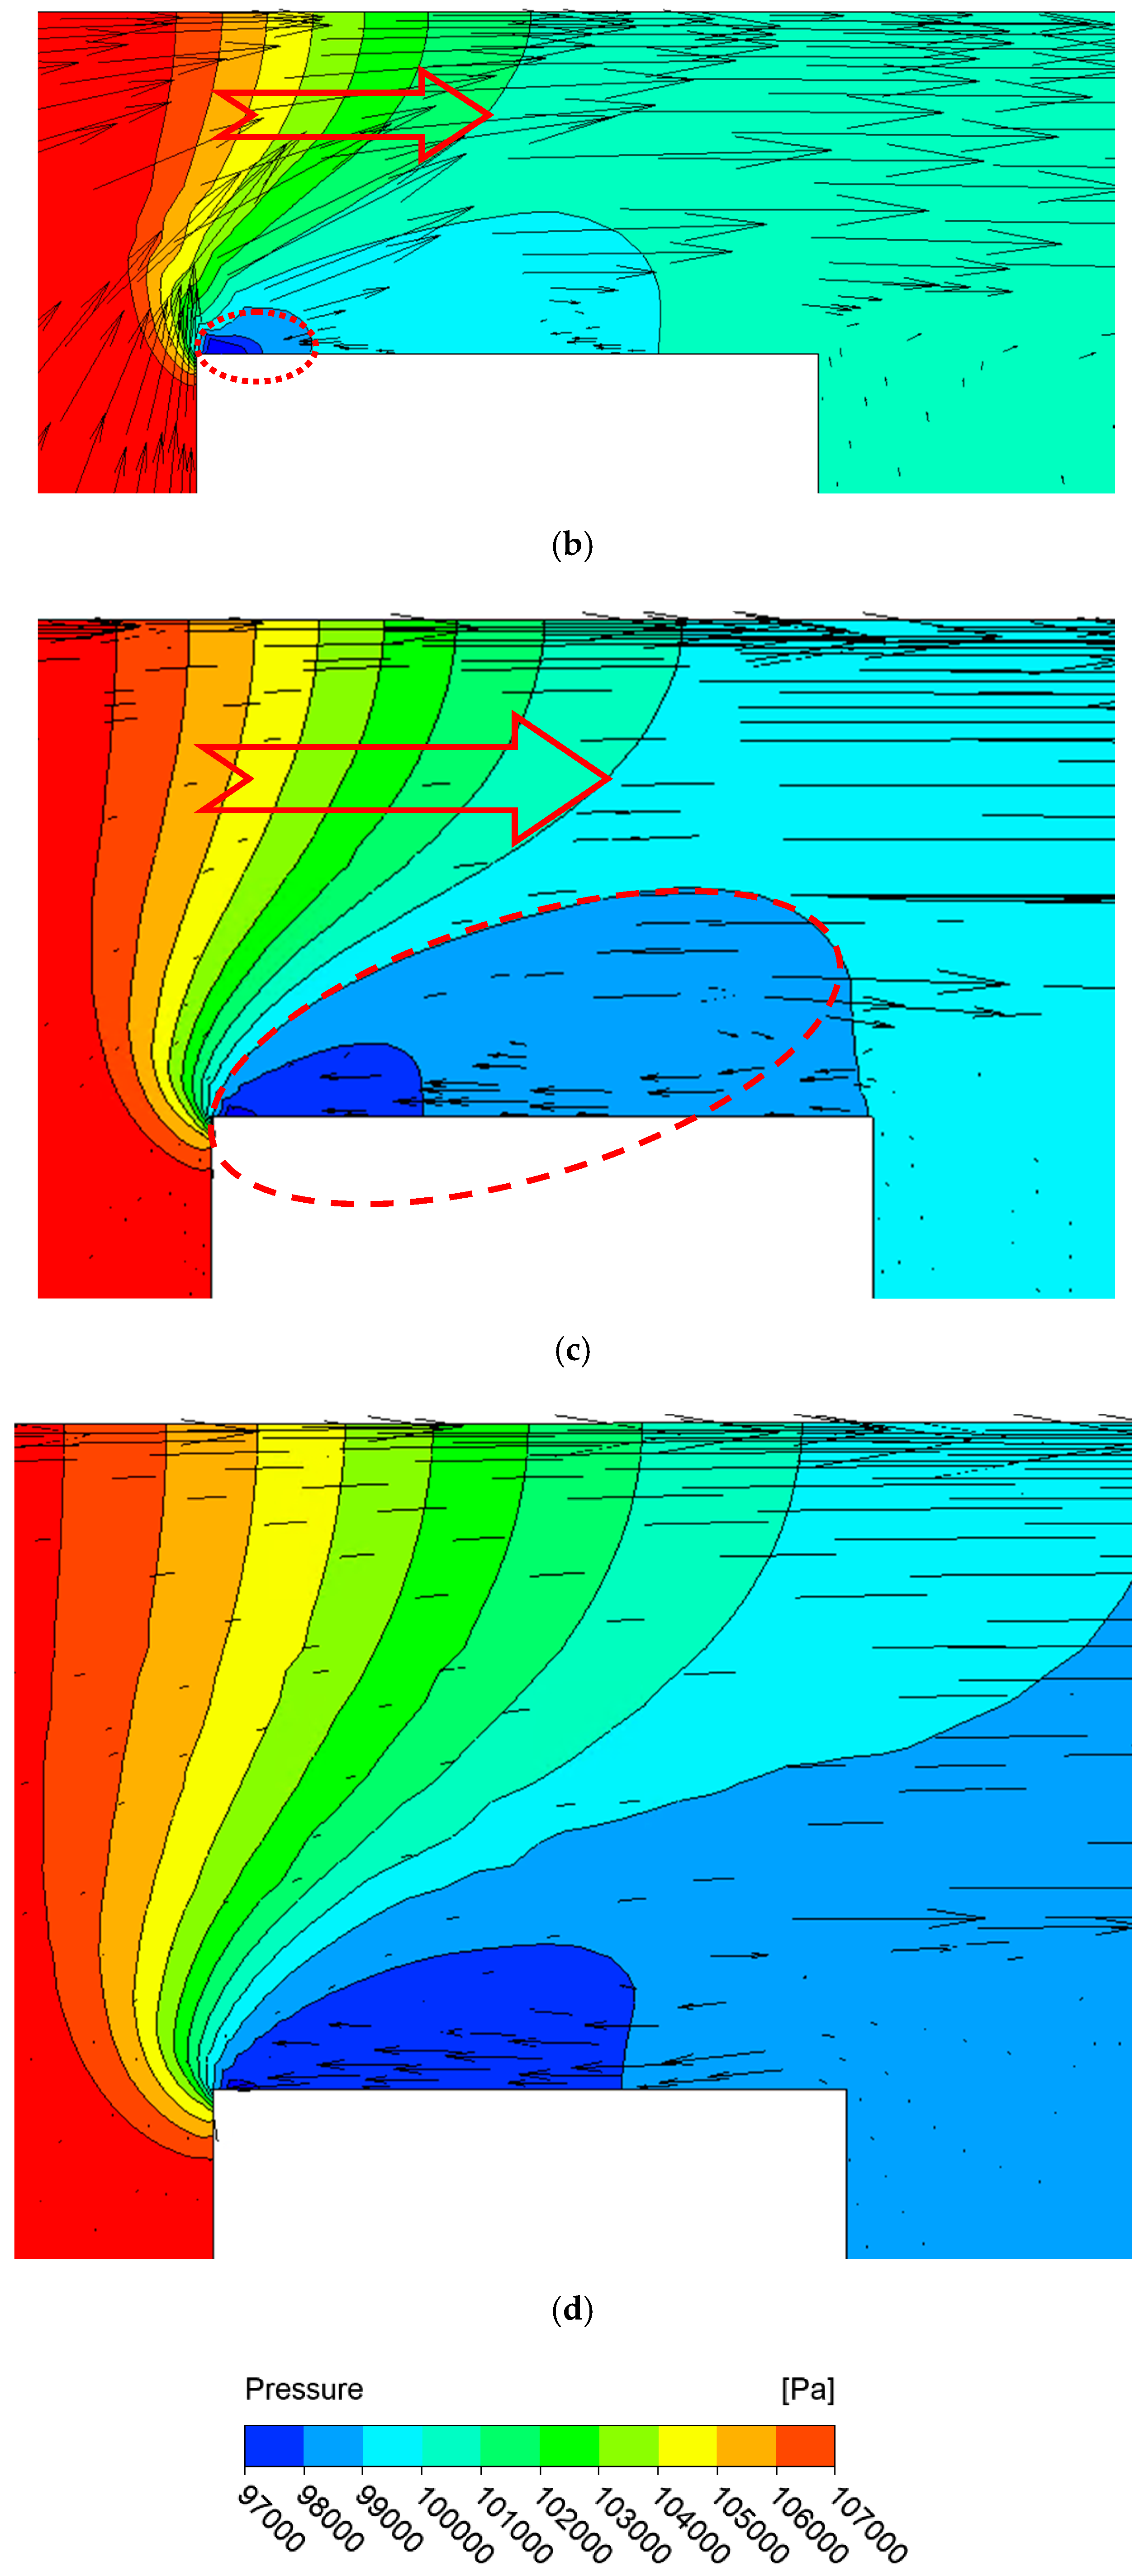
Figure 11 presents the distribution of the static pressure with velocity vectors in clearances under consideration.
The results from the analysis of
Figure 11 show that for the lowest clearance (0.362 mm), there is a great pressure gradient over the front edge of the tooth. For increasing clearances, we can observe an extension of the pressure change area (gradient) towards the back edge of the tooth (plane B). On the tooth top just behind the front edge appears the area of the low pressure, which intensifies the reverse flow.
From the geometry RC/B exceeding 0.542, a systematic increase in the low-pressure area over the tooth edge is observed (
Figure 11b–d); however, the geometry RC/B = 0.362 differs from this trend. This is caused by the considerable dimension of the tooth length in comparison with its height.
There is a significant increase in the low static pressure area between clearance of RC/B 0.542 and 0.752 (area marked with red dashed line), while the shape of the pressure drop field is similar (area marked with red arrow).
A steep increase of the low-pressure area intensifies the strong recirculation zone over the tooth edge (
Figure 10a). As a result, the reverse flow increases, which in turn causes the growth of the flow contraction phenomenon, which can be observed in
Figure 9c,d.
This paper presents a method for determining the flow coefficient in such conditions where gas inflowing to the clearance has a low velocity. In this situation, the gas velocity in the clearance results from the pressure gradient. Such conditions of the gas flow are observed in staggered and stepped seals.
5. Conclusions
Distribution fields of the velocity, pressure and density are dependent on each other and cause a significant change in flow parameters for relatively small changes in the clearance geometry.
The value of the flow coefficient obtained from tests is included in the range from 0.6 for the small pressure drop to 0.85 for the pressure ratio close to the critical one.
An interesting result of the experimental research is the fact that values of the flow coefficient drop in the function of the pressure for six heights of the clearance, creating two groups of curves. The first group comprises clearances of 0.362 and 0.542 mm, and the second group comprises clearances of 0.752, 1.067, 1.549 and 2.058 mm.
Results from the experiment indicate that between ratios of the clearance height to the tooth thickness RC/B of 0.542 and of 0.752, the value of the ratio of the mass flow to the flow field and the flow coefficient change.
The results of CFD calculations for geometries RC/B from 0.542 to 0.752 show that
- -
between RC/B of 0.542 and 0.555, there occurs a progressive decrease in and cSV;
- -
between RC/B of 0.555 and 0.752, and cSV change smoothly but at a steep gradient.
Change in the flow coefficient results from the increase of the strong recirculation zone on the tooth top in the end part of the clearance. There, the thickness of the recirculation zone differs significantly for clearances of heights RC = 0.542 and 0.752 mm. Significant growth of the recirculation zone is caused by a considerable extension of the low-pressure area in the vicinity of the front edge of the tooth. In the clearance 0.752 mm high, the reverse flow is clearly noticeable.
Based on data presented in this paper, we may state that for small clearances, the recirculation zone grows slightly and limits the flow by creating the convergent–divergent nozzle, and for large clearances, it grows considerably.
The problem discussed in this paper is crucial for staggered and stepped seals where the effect of kinetic energy carryover does not occur. There are conditions of the gas flow similar to these in the clearance investigated in this paper. Seals are applied to minimize the leakage. To achieve this purpose, we should obtain values of the flow coefficient as low as possible.


