Abstract
This study documents the results of economic assessment concerning four variants of coal gasification to hydrogen in a shell reactor. That assessment has been made using discounting methods (NPV: net present value, IRR: internal rate of return), as well as indicators based on a free cash flow to firm (FCFF) approach. Additionally, sensitivity analysis has been carried out, along with scenario analysis in current market conditions concerning prices of hard coal, lignite, hydrogen and CO2 allowances, as well as capital expenditures and costs related to carbon capture and storage (CCS) systems. Based on NPV results, a negative economic assessment has been obtained for all the analyzed variants varying within the range of EUR −903 to −142 million, although the variants based on hard coal achieved a positive IRR (5.1–5.7%) but lower than the assumed discount rates. In Polish conditions, the gasification of lignite seems to be unprofitable, in the assumed scale of total investment outlays and the current price of coal feedstock. The sensitivity analyses indicate that at least a 20% increase of hydrogen price would be required, or a similar reduction of capital expenditures (CAPEX) and costs of operation, for the best variant to make NPV positive. Analyses have also indicated that on the economic basis, only the prices of CO2 allowances exceeding EUR 40/Mg (EUR 52/Mg for lignite) would generate savings due to the availability of CCS systems.
1. Introduction
Hydrogen has been used in various forms of human activity for over 200 years. Originally, it was used in steam engines and also for lifting balloons and airships in the 18th and 19th centuries. It is often said that hydrogen is the “fuel of the future”. This sentence seems to be justified. The physical properties of hydrogen make it interesting and attractive in comparison to other fuels and energy sources. For example, hydrogen density is one tenth (1:10) of natural gas, its energy per unit of mass (Lower Heating Value—LHV) is three times higher than that of gasoline, flame velocity is eight times higher than that for methane and its autoignition temperature is 585 °C (ignition energy is 1/10 of methane). This makes hydrogen light, storable and reactive, with high energy content per unit mass; it can be readily produced at an industrial scale. In recent times, there have been some other reasons enforcing the popularity and development of the hydrogen market, such as: steadily falling cost of hydrogen supply, the observed shift in attention and interest from the automobile industry to other hydrogen applications (aviation, shipping, heating) and, finally, hydrogen is considered a clean, ecological fuel, especially when it is produced from renewables [1]. It should also be added that at present the development of the hydrogen sector is strongly supported by government programs amounting to hundreds of millions of dollars yearly [2].
A dynamically increasing demand for hydrogen has been observed since the 1970s. The demand for pure H2 reached 75 MM g in 2019 (a further 45 MM g of hydrogen by-products are used as an input for fuels or feedstock without prior separation). Hydrogen can be used in its pure form or can be converted to hydrogen-based fuels such as synthetic methane, liquid fuels, ammonia or methanol. The pure form of hydrogen is used mostly for oil refining and ammonia manufacturing for fertilizers. Hydrogen gas mixtures are also used in the chemical sector, steel production, heating, electricity production and the transport sector [2].
The majority of hydrogen is produced from fossil fuels, where the dominating role is that of natural gas at 75% (20–25% comes from coal-to-hydrogen facilities, the rest is a primary product of oil and electricity production installations; electrolysis accounts for only 2% of global H2 production). This means that over 200 Bm3 of natural gas and 105 MM g of coal are consumed every year to meet the global demand for hydrogen.
There are many expert opinions indicating that hydrogen technologies will also be developed in the future for achieving better overall effectiveness [3,4]. New technological solutions are expected to have high efficiency of energy conversion into products to minimize the negative impact on the environment or to demonstrate high operational flexibility, and in the use of various types of raw materials. Recently, political factors have also played an important role in defining energy security and environmental standards, whose role seems to be increasing [5,6]. Among the relatively new technologies (in development since the 1990s), methane splitting is potentially a new way to produce hydrogen from natural gas (it requires high-temperature plasma, methane as feedstock and electricity, and offers pure hydrogen and solid carbon with no CO2 emissions) [7,8,9]. On the other hand, interesting up-to-date Polish studies have also emerged, which discuss efficient production of pure hydrogen using photovoltaic panels [10]. Yet, from the economic point of view, new technologies based on fossil fuels are more efficient [11]. For example, the electrolysis of methanol to hydrogen can have up to 65% lower energy consumption than the electrolysis of water [12,13]. However, taking into account the environmental aspects and the regulatory changes following them, supporting fully renewable technologies, it is understandable that the interest in solutions based on the electrolysis of water will not decrease [11]. The main reason for this is that the electrolysis of water is the only renewable and feasible technology for large-scale hydrogen production to date [14].
International Renewable Energy Agency (IRENA) road map indicates that the use of hydrogen in the economy will have a 6% share in total energy consumption by 2050 [1], while the Hydrogen Council estimates an 18% share to be achieved in the next 30 years [15], which is quite challenging. In Poland, the demand for natural gas in the hydrogen and ammonia production segment is estimated at 2.1 Bm3 per year [16]. In addition to the use of hydrogen as a feedstock in the chemical industry, its use is widely analyzed for the production of energy in fuel cells or for the automotive sector [17]. The potential for hydrogen use, the perspective of its development and applications [18,19] are, considering the present state of technology advancement, limited by the economic efficiency, storage and transport restrictions.
Hydrogen from Coal and Its Perspectives
Following the European Union (EU) Green Policy, carbon dioxide is mostly considered a waste material and in order to meet global CO2 reduction limits, it should be captured and then chemically sequestrated or stored underground. The rapid increase in the number of carbon capture and storage (CCS) demonstrations and industrial installations was identified as a necessary condition for green policy implementation [20]. “Blue hydrogen” is commonly used to refer to the hydrogen extracted from fossil fuels in installations equipped with carbon capture, utilization and storage (CCUS) infrastructure. This process is also cost intensive. According to Muradov [21], a relatively low hydrogen-to-carbon ratio (of 0.1:1) from coal (vs. 4:1 from methane) makes it very attractive, although the gasification process is mostly associated with a high level of impurities in the feedstock that must be eliminated afterwards.
However, CCS technologies have not been widely implemented. At present, there are only 19 operating installations globally. The International Energy Agency (IEA) estimations, outlined by 2030, assume that CCS will reach a level of 750 MM g CO2 stored annually (currently only 5% of that amount has been achieved) [22]. That seems to be an optimistic scenario. Currently, two of the operating CCS projects are dedicated to hydrogen production [1]. As mentioned by Rock et al. [23], achieving a capture rate of 80% is still a challenge. It is also crucial to ensure CO2 retention after injection, which largely depends on the formation type [24]. Currently, there are no CCS installations in Poland. Although there are geological formations where CO2 could be stored, all efforts in this respect are still at the conceptual stage [25,26,27]. On the other hand, there are technological and economic reasons for the gasification of coal to hydrogen, especially where the costs of feedstock are relatively low. Coal gasification technologies for hydrogen production are among the most advanced and well established in the world. They seem to be the cheapest alternative for hydrogen production. Based on IEA [2], the total production cost (involving capital expenditures; CAPEX) is five times lower than in the case of grid electricity technologies, three times lower than in electricity generation from renewables and 2–2.5 lower than in steam methane reforming processes (hereinafter SMR). In China, the expected hydrogen production cost is about USD 1/kg of H2. In relation to those facts, the production of every 1 Mg of H2 causes the release into the atmosphere of nearly 20 Mg of CO2 (without CCS systems), two times more than from natural gas, but 1.5 times less than in grid electricity systems. Yet, the amount of CO2 produced from coal may also raise some concerns.
The technological and economic efficiency of coal gasification was discussed by Gnanapragasam et al. [4], who analyzed the effectiveness of the coal gasification process with the application of a CCS unit in classical integrated gasification combined cycle (IGCC) solutions and in syngas-to-hydrogen systems. According to the authors of that study, syngas-to-hydrogen systems are more effective then IGCC systems. An interesting comparison of technologies focused on hydrogen production, for all primary fuels, has been made by Muritala et al. [28], who pointed out the advantage of SMR over coal gasification (operating at industrial scale),which strongly depends upon the availability of cheap gas. Similar conclusions have been made by Xuet al. [29]. Additionally, Guban et al. [30] have agreed with that conclusion, adding that the development of an effective CCS system shall enhance the development of hydrogen production technologies based on gas and other fossil fuels. Similar aspects have also been discussed by Ren et al. [31], who commented that in the regions with access to cheap coal, efficient CCS systems may reveal the advantage of coal gasification over SMR technologies. This opinion was also supported by Cloete and Hirh [32] and Collodi et al. [33]. The abovementioned studies can be summarized by the statement that the final success of hydrogen production based on fossil fuels depends on the production scale and fuel price, the latter being the most important cost component. Thus, the key problem is to answer the question concerning the level at which these factors should be for fully commercial applications of these technologies. An attempt to answer this question for clean hydrogen technologies in Polish conditions is provided in the work of Ceren [10], which is a multi-criteria analysis of these solutions. In turn, the work of Bartel et al. [34] discusses the economic factors behind the development of CCS technology in combination with combined heat and power (CHP) installations. An interesting work analyzing the gasification of coal to hydrogen and the transit of the Polish economy towards a hydrogen economy is given in the study by Murray et al. [35]. The authors discuss various possible technological solutions, analyzing their impact on the Polish economy. However, none of the mentioned studies answers the question: for which economic conditions is it possible to commercially use the coal gasification technology with CSS for hydrogen production?
A literature review shows that the interest in the topic has not declined over the years, with ever more modern technological solutions emerging which improve the efficiency of both coal gasification [36] as well as CCS systems [4,37]. Some of the advanced, new and ecological energy technologies are very promising indeed, but because of the limited scale, they cannot be developed to a mass production scale very quickly. They need technological advancement but can be applied locally. The research conducted also indicates that the direction of the development of hydrogen generation technologies depends on the criteria assumed. Kwaśniewski et al. [36] point out that meeting the country’s energy needs should be, first of all, based on the domestic resource base, assuming that local resources are the cheapest ones. On the other hand, highly developed countries are focused on producing hydrogen based on renewables. At the same time, EU law clearly promotes clean coal technologies, hence the question arises as to whether the economic efficiency of coal gasification to hydrogen in Polish conditions (taking into account environmental aspects and the quality of end products) may favor coal gasification technologies sufficiently enough. The importance of the coal gasification scenario in Poland is also supported by the availability of coal reserves (hard coal and lignite), amounting to 5.77 billion Mg [38]. Additionally, having in mind the current problems encountered by the mining sector (reduced output, loss of profitability, depletion of resources), the analyses provided make a contribution to the ongoing discussion concerning the future of coal in Poland and in the European Union.
Based on a literature review, our research objectives comprise several important issues and problems connected with the assessment of the economic efficiency of hard coal and lignite gasification to hydrogen in Polish conditions. The studies documented in this paper attempt to answer several fundamental questions, namely:
- First research objective. What is the economic efficiency of hard coal and lignite gasification with and without CCS units at the current level of hydrogen prices, the cost of its production and investment outlays for specific technologies?
- Second research objective. At which levels of hydrogen price and coal feedstock is the economic efficiency of the best systems positive?
- Third research objective. At which price of CO2 emission allowances is the investment in a CCS system for both hard coal and lignite more profitable?
- Fourth research objective. In which market conditions is it possible to use CCS systems efficiently when gasifying coal to hydrogen?
The formulation of an opinion concerning the economic efficiency of hard coal and lignite gasification to hydrogen, identification of the key factors influencing the results and discussion concerning the balance between the level of CSS capital expenditures and the price of CO2 emission allowances are the research goals.
2. Methodology and Scope of Work
Because coal gasification technologies, operating at a large scale, are complicated investments (cost-intensive processes with high risk related to their implementation, relatively long investment cycle, long time of project operation [39]), the research process was divided into a few steps:
- data preparation;
- literature research aiming to reduce the number of analyzed coal gasification variants;
- for selected coal gasification processes, mass and energy balances were calculated allowing for identification of the amount of final product, wastes and energy flows;
- building a professional economic assessment model for selected variants and calculating the value and risk measures;
- conducting the sensitivity analyses for selected economic inputs, as well as value and risk measures;
- providing scenario analyses for the mutual impact of hydrogen price, the cost of building and operating the CSS units and the price of CO2 emission allowances.
An economic efficiency assessment supported by preliminary analyses and data collecting played a fundamental role. The descriptive part, which comprised other analyses and comments on the obtained results, following the order of established research objectives, supplemented the basic analyses.
Based on preliminary research, we decided to analyze only four variants of coal gasification technologies (hard coal and lignite gasification with and without CCS units), based on a shell reactor and developed on an industrial scale, which is stable and proven. There is also a sufficient amount of reliable data in the literature for these technologies (the main source of data is the project entitled "Development of coal gasification technology for high production of fuels and electricity" funded by the National Center for Research and Development, documented in [40]).
Economic Assessment
In our research, we use the most popular methods of assessing economic efficiency [40]. The values of the analyses carried out are their comprehensiveness and the broad spectrum of the answers provided. According to Murillo-Zamorano, the economic efficiency of an investment project may be understood as the relation between the project’s outcomes and inputs (capital, financial and operating costs) related to its execution, expressed in financial terms [41]. Economic efficiency was evaluated by analyzing a set of financial measures and indicators, determined for each technology separately. Economic analyses were prepared in a professional assessment model. In this model, the following methods and indicators were considered to be crucial:
- LCOH2: levelized cost of hydrogen production; (pe 1000 EUR)
- Profit measures, such as: 00 (earnings before deducting interest and taxes), net income; (per 1000 EUR);
- Value of aggregated free cash flow to firm (FCFF); (per 1000 EUR)
- Net Present Value—NPV; (per 1000 EUR)
- Net present value ratio (NPVR); (%)
- Internal Rate of Return—IRR; (%).
Those methods belong to the group of discount techniques [42]. The discounting process anticipates the future cash flows and returns their present values, thus enabling the comparison of capital expenditures to be made at the beginning with the cashflow expected in future. The process of discounting is directly related to the effect of “the time value of money” [43]. In our calculations, FCFF represents the free cash flow to firm corrected for depreciation expenses, taxes, working capital and investment outlays.
The levelized cost of energy/hydrogen production (LCOE/LCOH2) is a widely accepted standard for assessing and comparing energy technologies. LCOH2 is a sum of total capital expenditures and operational costs divided by an amount of a final product. LCOE/LCOH2 is in fact the price of the main product which guarantees the return of capital expenditures, costs of operation and cost of debt throughout the technology lifespan. The costs also comprise the required return of capital suppliers, expressed as the percentage of the revenue assigned for that purpose [5,39].
In the calculations, we used only the cash costs (operating costs without amortization and depreciation), including the cost of feedstock (coal) and capital expenditures. The risk premium comprised the discount rate r in Equation (1):
where:
- LCOH2: levelized cost of hydrogen production;
- n: period of cost averaging (economic lifespan of the project);
- CAPEXt: capital expenditures in year t;
- OPEXt: operating costs (excluding the cost of coal) in year t;
- CCt: cost of coal in year t;
- Pt: production of hydrogen in year t;
- r: discount rate;
- t: year (time).
The assessment of the economic efficiency of the analyzed technologies focused upon the expenditures and costs of key technological processes and income components corresponding to hydrogen sale. Capital expenditures were calculated at the level of total plant cost (TPC), and after taking into account other overheads and provisions (demand for working capital and materials and chemicals in the start-up phase, as well as provisioning, amounting to 15% of TPC as total capital expenditures; TASC).
3. Description of Coal Gasification Process
As mentioned before, the gasification process in a shell reactor was chosen for analysis (Figure 1). To the best of our knowledge, the selected technology is among the most popular worldwide; it is characterized by high efficiency and technological maturity. In shell technology, coal is initially dried by tail gas (remaining after hydrogen separation from syngas) to 5% in the case of hard coal or 12% in the case of lignite. Dried coal is fed into the dispersive reactor, with a supply of fuel in dry conditions in which, at a temperature of 1430 °C and pressure of 4.2 MPa, the gasification process takes place. Purified synthesis gas (syngas), from which 99.9% of solid particles, 90% of chlorides and all the alkaline compounds have been removed, goes to a water gas shift (WGS) reactor (in that process, carbon monoxide, in reaction with steam generated in the gas cooling process, is converted to CO2). After conversion, the synthesis gas is cooled to about 35 °C and purified in a Selexol unit from coal oxysulfide, mercury and acid gases, including hydrogen sulfide, with an efficiency of 99.9%, and from carbon dioxide, with an efficiency of 90%. In the case of installations provided with a CCS system, the separated carbon dioxide is compressed and subsequently pumped underground via a pipeline system and ultimately stored. The remaining gas is combusted in a boiler, providing the heat necessary to generate steam. The steam is used for driving the turbine coupled with a generator of electric energy, and it is entirely used for internal consumption, which amounts to 33.1 MW in the case of the gasification of hard coal and 34.6 MW for lignite (higher energy consumption is associated with the coal handling process). In the case of installations equipped with a CCS system, the electricity consumption for both coals amounts to 51.6 MW and 53.4 MW, respectively) [44].
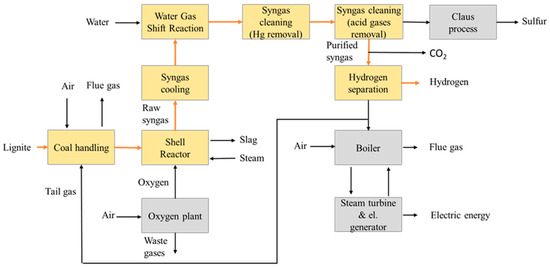
Figure 1.
Block diagram of hydrogen production in gasification process with use of a shell reactor. Source: Reproduced from [5]. The name of the publisher: The Publishing House of the Mineral and Energy Economy Research Institute of the Polish Academy of Sciences.
To compare the effectiveness of the technologies discussed, we assumed the same amount of chemical energy of about 1935 GJ/h in coal feedstock (at the beginning of the gasification process). In the analyses, we used steam coal with a calorific value (HHV) of 21.3 GJ/Mg and lignite with a calorific value of 12.4 GJ/Mg (typical in the Polish mining sector). The availability of the plant was assumed to be 0.9, resulting in on-stream times of 7 884 h/y. Based on that, mass and energy balances were calculated for all variants. Because it was assumed that some of the chemical energy will be used for internal consumption, the yearly net production capacity varied between 63–73 thousand Mg of H2 for lignite consumption of about 1.59 million Mg and was in the range of 74–81 thousand Mg of H2 for hard coal consumption of about 0.84 million Mg.
It was also assumed that technologies without CCS emit CO2 to the atmosphere in amounts typical for chemical and thermal reactions, as well as the energy conversion characteristics for a given technology with respect to the analyzed coals. For installations with a CCS system, 90% of CO2 would be captured and stored geologically. The basic information for the analyzed technologies with values of average yearly emissions of carbon dioxide is presented in Table 1.

Table 1.
Key variables that describe the analyzed variants of hydrogen production.
4. Description of Key Economic Assumptions
4.1. Revenues
When calculating the price of hydrogen, data concerning the cost of its production in various technologies, available, among others, in [1,45,46], were analyzed. Both costs and prices are subject to considerable regional fluctuations. In Europe and in Russia, they are in the range between USD 1.1 and 2.35/kg of H2 produced from natural gas. In the case of coal gasification, the benchmark is the Chinese market, where the cost varies in the range of USD 1.0–2.45/kg of H2 for technologies with a CCS unit in use. For economic analyses, the price of hydrogen was assumed at the level of EUR 2.28/kg of H2. It should be added that the sales of by-products have not been considered in the calculations.
4.2. Capital Expenditures
The total capital expenditures comprise:
- expenditures on infrastructure
- construction works
- other expenses
- spending for working capital
- reserves for incidentals.
Among capital expenditures, the widely understood outlays on technological infrastructure were identified, along with those on auxiliary infrastructure, construction works, project documentation or reconstruction. Capital expenditures were calculated at the level of TPC, as well as after taking into account other overheads and provisions (demand for working capital and materials and chemicals in the start-up phase, as well as reserves and provisions amounting to 15% of TPC), as well as total as spent costs (TASC).
For the technological variants which are provided with CCS units, the transport of compressed and liquid CO2 was to the distance of 100 km. Expenditures related to durable infrastructure were selected, taking into account the scale of tasks related to the capturing, compressing, transporting and storing of CO2. The variants provided with CCS units additionally comprised expenditures connected with (Table 2):
Table 2.
The structure of CAPEX for CCS.
- preparing technical documentation
- permits, including purchase of land, fees for excluding land from use, compensations, etc.
- expenditures related to durable infrastructure (preparation station, pipeline, pumping station)
- cost of monitoring and operation.
The total values of CAPEX for specific technological variants are presented in Table 3.
Table 3.
Total CAPEX for analyzed variants.
4.3. Operating Costs
For each technology, the following operational costs were included in the calculation:
- feedstock (coal)
- consumption of materials and chemicals (Table 4)
Table 4. Costs of chemicals.
- cost of electricity
- consumption of other utilities
- external services (repairs, servicing and overhauls)
- taxes and charges
- remunerations with derivatives
- other operating costs.
The calculation of total operating costs also comprised the cost of management and administration support, which accounted for 30% of wage costs. Taxes and fees were calculated as a surcharge of TPC, amounting to 0.7%, and the assumed cost of insurance amounted to 0.5% of TPC. Costs of repairs, servicing and overhauls were calculated on an individual basis.
The costs related to site monitoring, discounted for the last year of analysis, were a part of the total operating costs in the case of variants with CCS units (Table 5).
Table 5.
The structure of CCS OPEX.
In the calculations, the following assumptions were made concerning the initial values of costs of feedstock and emission allowances:
- lignite: EUR 40/Mg
- hard coal: EUR 55/Mg
- CO2 allowances: EUR 25/Mg of CO2.
As a result of the assumptions made, for the analyzed technologies, the following structure of the operating costs was obtained (Table 6).
Table 6.
Operating costs for analyzed technologies in the first year of operation.
4.4. Risk and Discount Rate Calculation
Risks were assessed separately for each technological variant. Total risk comprised the cost of own and borrowed capital (debt), as well as the premium for specific risks for a given technology. The share of equity and borrowed capital in the evaluation model amounted to 100%. Moreover, for each technological variant, the premium for specific (technological) risks was determined. The share and actual cost of borrowing capital was calculated as a function of actual (in a given accounting period) cost of interest and capital (debt) payments. Thus, the effective cost of debt was in the range of 2.8% to 3.8%. The premium for the specific risks of the analyzed technologies varied between 6% and 14%. Finally, the assessment process allowed for different values of the discount rate influenced by the change in financial structure and technological maturity of the installation. The average effective discount rates for the analyzed technological variants are presented in Table 7.
Table 7.
Discount rates assumed in the calculation for analyzed gasification technologies.
The calculation was prepared for the beginning of 2021 and the expenditures for the construction period for all variants were prepared in a three-year perspective, whereas the entire calculation horizon comprised 33 years. The calculations were made in nominal prices, assuming a yearly inflation rate of 2.25%.
5. Results
Table 8.
The results for the basic scenario.
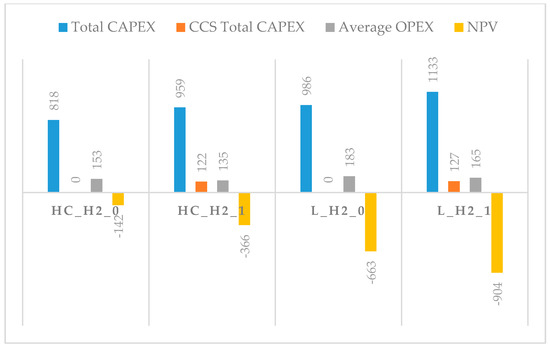
Figure 2.
Summary of key economic parameters. Source: own study.
On the basis of the table provided, taking into account the NPV criterion, it can be noted that the gasification of hard coal, and subsequently of lignite for the production of hydrogen, is not economically efficient for the basic values of the assumptions.
The best result was achieved in the case of the hard coal gasification without CCS (HC_H2_0), resulting in an NPV value of EUR −142 million and an approximate IRR at the level of 5.7%. Negative NPV and IRR, lower than the discount rate assumed, indicate, however, the existence of economic efficiency for the assumed input variables. The most promising result applies to the variant characterized by the lowest capital expenditures (EUR 818 million) and highest revenues (EUR 193 million yearly). The second best result was achieved in the case of hard coal gasification technology with CCS units (HC_H2_1). That variant has an NPV of EUR −366 million due to the internal consumption of energy in the CCS unit (here we noticed an increase in CAPEX for CCS of EUR 122 million, as well as lower revenues, amounting to EUR 176 million). The approximated IRR for this variant equaled 5.1% and was lower than the discount rate assumed.
For the lignite gasification without CCS (L_H2_0), the NPV achieved was EUR −662 million, which was caused by higher capital expenditures (EUR 985 million) and a simultaneous increase in costs, resulting from the unfavorable price relation between lignite and hard coal. For the fourth technology analyzed, lignite gasification with a CCS system (L_H2_1), the NPV amounted to EUR −904 million, which was due to a higher level of capital expenditures (EUR 1133 million), an expensive CCS system and a lower efficiency of lignite conversion to syngas. For both of those technological variants, a negative IRR was determined. It can be noted that for all four variants, the increase in expenditures related to CCS was relatively greater that the influence of the prices of CO2 allowances (the variants with CCS systems demonstrated less economic efficiency in each case).
6. Discussion
Here, we extend our studies, providing sensitivity and scenario analyses.
6.1. NPV Sensitivity to Change of Key Market Factors
In this chapter, we document the results of sensitivity analyses, answering the second research question about the input values affecting the analyzed technologies most significantly. Here, we also identify the levels of key inputs that would make the considered variants profitable.
The DCF (Discounted Cash Flow) analysis assumes that the input (expected) values are constant in time, thus the discount rate is the only parameter reflecting the risk level. Thus, we examined and documented the influence on NPV exerted by the most crucial input variables, such as:
- price of hydrogen
- coal price
- price of CO2 emission allowances
- CAPEX
- variable costs
- discount rate.
A ±40% range of changes affecting the above variables was assumed, with a step in analysis of 10 percentage points. It should be added that the conducted sensitivity analysis examined the influence of only one input variable each time. The results are presented in Table 9, Table 10, Table 11 and Table 12 and in Figure 3, Figure 4, Figure 5 and Figure 6.
Table 9.
Sensitivity analysis for hard coal gasification w/o CCS (HC_H2_0).
Table 10.
Sensitivity analysis for hard coal gasification w/ CCS (HC_H2_1).
Table 11.
Sensitivity analysis for lignite gasification w/o CCS (L_H2_0).
Table 12.
Sensitivity analysis for lignite gasification w/ CCS (L_H2_1).
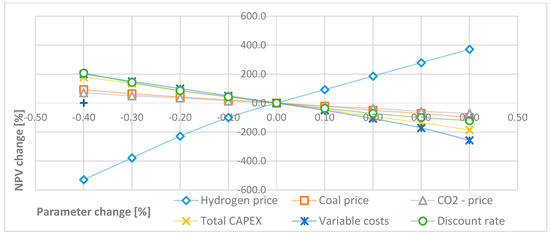
Figure 3.
Sensitivity analysis for coal gasification w/o CCS unit (HC_H2_0). Source: own study.
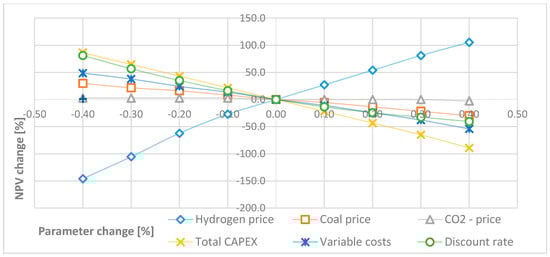
Figure 4.
Sensitivity analysis for coal gasification w/ CCS unit (HC_H2_1). Source: own study.
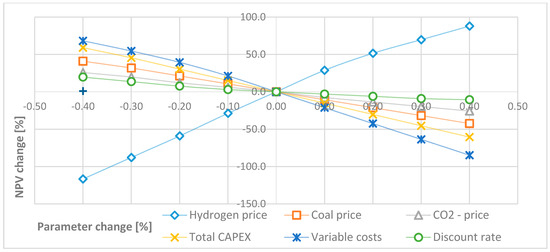
Figure 5.
Sensitivity analysis for lignite gasification w/o CCS unit (L_H2_0). Source: own study.
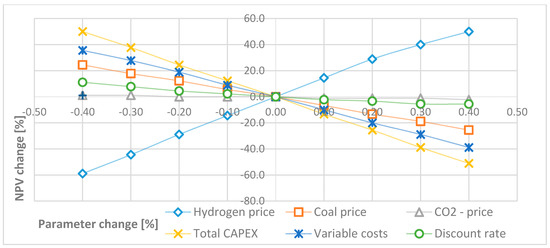
Figure 6.
Sensitivity analysis for lignite gasification w/ CCS unit (L_H2_1). Source: own study.
All the analyzed technologies are most sensitive to the price of hydrogen, which in turn is followed by discount rate, level of variable costs and capital expenditures (in that order), as well as the price of coal and CO2 allowances. On the basis of Table 9, it can be stated that the most promising variant (hard coal gasification without a CCS system) would achieve a positive NPV after assuming a 20% increase in hydrogen prices or a 30% reduction of capital expenditures. The positive NPV value would also occur when the variable costs drop by 20–30% or after a 30% reduction of the discount rate.
Table 10, in turn, presents the sensitivity analysis concerning the variant of hard coal gasification with CCS systems. The discussed technology would achieve a positive NPV only if the prices of hydrogen increase by at least 40%. A change of other input variables in the range of ±40% would not result in the NPV turning positive. In the case of variants concerning the gasification of lignite (Table 11 and Table 12), the NPV is negative in the entire range of input values, which entails that a change of any of the parameters analyzed would not improve their negative economic evaluation.
6.2. Efficiency of Analyzed Coal Gasification Technologies in the Condition of Assumed Prices of CO2 Allowances and Expenditures Related to CCS
This part of the study provides answers to the question concerning the market conditions which enable efficient use of the CCS systems in coal gasification to hydrogen (here, we do not assume, though, that such conditions necessarily exist). In order to answer that question, a multi-dimensional scenario was carried out for the following input parameters:
- price of CO2 allowances
- prices of hard coal and lignite
- CAPEX and OPEX of CCS.
In this case, the value of LCOH2 was assumed to be the main decisive parameter. In the first place, analysis was carried out to assess the influence of the yearly OPEX of CCS and total CAPEX of CCS. The results of this analysis for hard coal are presented in Table 13 and for lignite in Table 14. For example, in the case of CAPEX for CCS amounting to EUR 100 million and the average yearly OPEX of the CCS unit amounting to about EUR 6 million, LCOH2 for the hard coal variant is EUR 3.05/kg while for lignite it is EUR 4.02/kg of H2 produced. As can be noted, the levelized cost of hydrogen production for variants based on hard coal is lower in the entire range of analysis than for the lignite gasification. Moreover, for both hard coal and lignite, the LCOH2 does not drop below the assumed market price of EUR 2.28/kg of H2 (the lowest cost amounts to EUR 2.96/kg of H2, with the CAPEX for CCS amounting to EUR 62 million and yearly OPEX for the installation amounting to EUR 4.6 million). In the case of lignite, the limit value is EUR 3.93/kg of H2 (for the analyzed scope of fluctuations of CAPEX for CCS and OPEX related to its functioning).
Table 13.
LCOH2 for hard coal gasification with CCS system (per 1000 EUR).
Table 14.
LCOH2 for lignite gasification with CCS system (per 1000 EUR)
The key issue for CCS development is the availability and price of CO2 allowances. Thus, further in the study, an answer was provided to the question concerning the price level of CO2 allowances at which the profitability of CCS systems applied for the production of hydrogen from coal can be achieved. The results of analysis for variants based on hard coal are presented in Table 15, whereas Table 16 contains a similar analysis for lignite.
Table 15.
Limit price of CO2 allowances for CCS profitability (EUR)—hard coal gasification.
Table 16.
Limit price of CO2 allowances for CCS profitability (EUR)—lignite gasification.
To provide an example, for the production of hydrogen from hard coal (for the CCS CAPEX of EUR 100 million and the average CCS OPEX of about EUR 6 million), the reference price of CO2 allowances amounts to EUR 45/Mg. For every higher price of CO2 allowance, the construction of a CCS system would be justified. In the case of variants based on lignite, for the investment in CCS of about EUR 100 million and an average operating cost of such a system of about EUR 6.3 million, the minimum price of CO2 allowances which would justify the decision concerning building such an installation is a mere EUR 56/Mg. To generalize, CCS provided to hydrogen production from hard coal would be worthwhile only if the CO2 allowance price is EUR 40/Mg (or higher), while in the case of lignite gasification, the price of CO2 allowances would have to exceed EUR 52/Mg. Will that limit be exceeded permanently? There are strong indications that this may be the case, in a definite perspective.
7. Conclusions
The study provides the results of an economic assessment concerning four variants of coal gasification to hydrogen in a shell reactor (two each for both types of coal). In the widely conceived analyses, we provide the answers to several crucial questions and research objectives.
Based on conducted analyses, we formulate the following conclusion:
- concerning prices of hard coal, lignite, hydrogen and CO2 allowances, as well as capital expenditures and costs related to CCS systems, a negative economic evaluation, based on NPV and IRR, was obtained for all analyzed variants of coal gasification:
- ○
- NPV varied between EUR −903 and −142 million
- ○
- variants based on hard coal gasification generated a positive approximate IRR, although slightly lower than the discount rates assumed for those technologies
- ○
- for hard coal gasification, IRR was in the range of 5.1–5.7% (for lignite variants, IRR was negative).
- Gasification of lignite in Polish conditions appears to be unprofitable, having in mind the scale of total capital expenditures and the current price of coals used as feedstock.
- ○
- at least a 20% increase in hydrogen price, or a similar reduction of CAPEX of installations and costs would be required to make hydrogen production profitable (a different combination of several factors occurring simultaneously is also possible, yet it was not the subject of the analyses).
- Analyses have also indicated that the prices of CO2 allowances exceeding EUR 40/Mg would generate savings due to the availability of CCS systems, while in the case of lignite gasification, the price of CO2 allowances would have to exceed EUR 52/Mg.
The achieved results have practical significance. They may be helpful in formulating an energy strategy for Poland. Unfortunately, at the present level of prices, there seems to be no place for economically effective and clean hydrogen production based on coal gasification without suitable national supporting mechanisms. It is also very important in relation to the policy of the European Union that is strongly focused on providing support for energy production technologies (including hydrogen) from renewables.
The novelty of this paper is mostly expressed in the complexity of the analyses conducted. The research revives the discussion carried out in the literature about the prosperity and future of coal gasification to hydrogen in Poland. The added value is therefore a multidimensional answer to the question both about the efficiency of the coal gasification and the conditions of its occurrence. In the literature on the subject, especially for Poland, there are no current studies and results in this field. Hence, we believe that such a discussion is important, taking into account the zero-emission policy of the European Union. Because of the negative economic effectiveness of all the analyzed variants in the present business conditions, this attempt seems to provide sufficient arguments to end our research efforts in this field.
Author Contributions
Conceptualization—R.K. and M.K., methodology—M.K., software and computation—R.K., model validation—R.K., formal analysis—M.K., writing and original draft preparation—R.K. and M.K., writing—review and editing—M.K., visualization—R.K., supervision—M.K. Both authors have read and agreed to the published version of the manuscript.
Funding
The publication has been financed using a subsidy for maintenance and development of research potential and received no external funding.
Conflicts of Interest
The authors declare no conflict of interest. The funders had no role in the design of the study; in the collection, analyses, or interpretation of data; in the writing of the manuscript, or in the decision to publish the results.
References
- IRENA. Global Energy Transformation: A Roadmap to 2050; The International Renewable Energy Agency: Abu Dhabi, UAE, 2019; ISBN 978-92-9260-059-4. [Google Scholar]
- IEA. The Future of Hydrogen. Available online: https://www.iea.org/reports/the-future-of-hydrogen (accessed on 13 September 2020).
- Bell, D.; Towler, B. Coal Gasification and Its Applications; Elsevier: Amsterdam, The Netherlands, 2011; ISBN 9780815520498. [Google Scholar]
- Gnanapragasam, N.V.; Reddy, B.V.; Rosen, M.A. Hydrogen production from coal gasification for effective downstream CO2 capture. Int. J. Hydrog. Energy 2010, 35, 4933–4943. [Google Scholar] [CrossRef]
- Kopacz, M.; Kaplan, R.; Kwasniewski, K. Evaluation of the economic efficiency of hydrogen production by lignite gasification. Polityka Energ. 2019, 22, 21–35. [Google Scholar] [CrossRef]
- Kaliski, M.; Siemek, J.; Sikora, A.; Szurlej, A. Możliwe scenariusze polityki energetycznej unii europejskiej w zakresie zapewnienia stabilnych dostaw gazu ziemnego do europy środkowej i wschodniej w kontekście polityki energety cznej rosji. Rynek Energii 2009, 3, 1. [Google Scholar]
- Fulcheri, L. Direct decarbonization of methane by thermal plasma for the co-production of hydrogen and carbon nanostructures. In Proceedings of the 15th International High-Tech Plasma Processes Conference, Toulouse, France, 2–6 July 2018. [Google Scholar]
- Dagle, R.A.; Dagle, V.; Bearden, M.D.; Holladay, J.D.; Krause, T.R.; Ahmed, S. An Overview of Natural Gas Conversion Technologies for Co-Production of Hydrogen and Value-Added Solid Carbon Products. (No. PNNL-26726; ANL-17/11); Pacific Northwest Natl. Lab. (PNNL): Richland, WA, USA; Argonne Natl. Lab. (ANL): Lemont, IL, USA, 2017. [Google Scholar] [CrossRef]
- Bazzanella, A.M.; Ausfelder, F. DECHEMA Low Carbon Energy and Feedstock for the European Chemical Industry; The European Chemical Industry Council: Brussels, Belgium, 2017. [Google Scholar]
- Ceran, B. Multi-Criteria Comparative Analysis of Clean Hydrogen Production Scenarios. Energies 2020, 13, 4180. [Google Scholar] [CrossRef]
- d’Amore-Domenech, R.; Santiago, Ó.; Leo, T.J. Multicriteria analysis of seawater electrolysis technologies for green hydrogen production at sea. Renew. Sustain. Energy Rev. 2020, 133, 110166. [Google Scholar] [CrossRef]
- Fang, X.W.; Wang, L.; Cai, W.F.; Jing, D.W.; Chen, Q.Y.; Wang, Y.H. Simultaneous production of electricity and hydrogen from methanol solution with a new electrochemical technology. Int. J. Hydrog. Energy 2019, 44, 15766–15770. [Google Scholar] [CrossRef]
- Khzouz, M.; Gkanas, E.I.; Shao, J.; Sher, F.; Beherskyi, D.; El-Kharouf, A.; Qubeissi, M. Al Life Cycle Costing Analysis: Tools and Applications for Determining Hydrogen Production Cost for Fuel Cell Vehicle Technology. Energies 2020, 13, 3783. [Google Scholar] [CrossRef]
- Touili, S.; Alami Merrouni, A.; El Hassouani, Y.; Amrani, A.-i.; Rachidi, S. Analysis of the yield and production cost of large-scale electrolytic hydrogen from different solar technologies and under several Moroccan climate zones. Int. J. Hydrog. Energy 2020. Available online: https://www.sciencedirect.com/science/article/abs/pii/S0360319920326938?via%3Dihub (accessed on 12. September 2020). [CrossRef]
- Hydrogen Council Hydrogen Scaling Up: A Sustainable Pathway for the Global Energy Transition. Available online: https://hydrogencouncil.com/wp-content/uploads/2017/11/Hydrogen-scaling-up-Hydrogen-Council.pdf (accessed on 13 September 2020).
- BP, p.l.c. BP Energy Outlook 2019 Edition. Available online: https://www.bp.com/content/dam/bp/business-sites/en/global/corporate/pdfs/energy-economics/energy-outlook/bp-energy-outlook-2019.pdf (accessed on 13 September 2020).
- Wiącek, D. Wodór jako paliwo przyszłości. AUTOBUSY 2011, 12, 446–452. [Google Scholar]
- Chmielniak, T.; Lepszy, S.; Monka, P. Hydrogen energy—Main problems. Polityka Energ. 2017, 20, 55–65. [Google Scholar]
- Luque, R.; Speight, J.G. Gasification for Synthetic Fuel Production: Fundamentals, Processes and Applications; Elsevier: Amsterdam, The Netherlands, 2014; ISBN 9780857098085. [Google Scholar]
- IEA. IEA Study: Prospects for CO2 Capture and Storage. Available online: https://ccs-info.org/onewebmedia/iea_oecd_ccs_prospects.pdf (accessed on 13 September 2020).
- Muradov, N. Low to near-zero CO2 production of hydrogen from fossil fuels: Status and perspectives. Int. J. Hydrog. Energy 2017, 42, 14058–14088. [Google Scholar] [CrossRef]
- IEA CCUS Tracking in Power Sector. Available online: https://www.iea.org/reports/ccus-in-power (accessed on 13 September 2020).
- Rock, L.; O’Brien, S.; Tessarolo, S.; Duer, J.; Bacci, V.O.; Hirst, B.; Randell, D.; Helmy, M.; Blackmore, J.; Duong, C.; et al. The Quest CCS Project: 1st Year Review Post Start of Injection. Energy Procedia 2017, 114, 5320–5328. [Google Scholar] [CrossRef]
- Olea, R.A. CO2 retention values in enhanced oil recovery. J. Pet. Sci. Eng. 2015, 129, 23–28. [Google Scholar] [CrossRef]
- Budzianowski, W. Can ‘negative net CO2 emissions’ from decarbonised biogas-to-electricity contribute to solving Poland’s carbon capture and sequestration dilemmas? Energy 2011, 36, 6318–6325. [Google Scholar] [CrossRef]
- Pieńkowski, G. Przyszła struktura energetyczna oraz rola CCS w Polsce—Wnioski z ostatnich konferencji w Niemczech i w Polsce. Prz. Geol. 2012, 60, 32–35. [Google Scholar]
- Gąsiorowska, E.; Surma, T. Warunki prawne i ekonomiczne wdrożenia ccs w polsce. Rynek Energii 2010, 2, 43–48. [Google Scholar]
- Muritala, I.K.; Guban, D.; Roeb, M.; Sattler, C. High temperature production of hydrogen: Assessment of non-renewable resources technologies and emerging trends. Int. J. Hydrog. Energy 2019, 45, 26022–26035. [Google Scholar] [CrossRef]
- Xu, D.; Li, W.; Ren, X.; Shen, W.; Dong, L. Technology selection for sustainable hydrogen production: A multi-criteria assessment framework under uncertainties based on the combined weights and interval best-worst projection method. Int. J. Hydrog. Energy 2019. Available online: https://www.sciencedirect.com/science/article/abs/pii/S0360319919333403 (accessed on 25 July 2020). [CrossRef]
- Guban, D.; Muritala, I.K.; Roeb, M.; Sattler, C. Assessment of sustainable high temperature hydrogen production technologies. Int. J. Hydrog. Energy 2019, 45, 26156–26165. [Google Scholar] [CrossRef]
- Ren, X.; Li, W.; Ding, S.; Dong, L. Sustainability assessment and decision making of hydrogen production technologies: A novel two-stage multi-criteria decision making method. Int. J. Hydrog. Energy 2020. Available online: https://www.sciencedirect.com/science/article/abs/pii/S0360319919347020 (accessed on 25 July 2020). [CrossRef]
- Cloete, S.; Hirth, L. Flexible power and hydrogen production: Finding synergy between CCS and variable renewables. Energy 2020, 192, 116671. [Google Scholar] [CrossRef]
- Collodi, G.; Azzaro, G.; Ferrari, N.; Santos, S. Techno-economic Evaluation of Deploying CCS in SMR Based Merchant H2 Production with NG as Feedstock and Fuel. Energy Procedia 2017, 114, 2690–2712. [Google Scholar] [CrossRef]
- Bartela, Ł.; Skorek-Osikowska, A.; Kotowicz, J. Economic analysis of a supercritical coal-fired CHP plant integrated with an absorption carbon capture installation. Energy 2014, 64, 513–523. [Google Scholar] [CrossRef]
- Murray, M.L.; Hugo Seymour, E.; Rogut, J.; Zechowska, S.W. Stakeholder perceptions towards the transition to a hydrogen economy in Poland. Int. J. Hydrog. Energy 2008, 33, 20–27. [Google Scholar] [CrossRef]
- Gnanapragasam, N.V.; Reddy, B.V.; Rosen, M.A. Hydrogen production from coal using coal direct chemical looping and syngas chemical looping combustion systems: Assessment of system operation and resource requirements. Int. J. Hydrog. Energy 2009, 34, 2606–2615. [Google Scholar] [CrossRef]
- Mechleri, E.; Brown, S.; Fennell, P.S.; Mac Dowell, N. CO2 capture and storage (CCS) cost reduction via infrastructure right-sizing. Chem. Eng. Res. Des. 2017, 119, 130–139. [Google Scholar] [CrossRef]
- PIG. The Balance of Mineral Resources Deposits in Poland as of 31.12.2019; The Polish Geological Institute: Warszawa, Poland, 2019; ISBN 978-83-66593-57-2. (In Polish) [Google Scholar]
- Gerdes, K.; Summers, W.M.; Wimer, J. Cost Estimation Methodology for NETL Assessments of Power Plant Performance DOE/NETL-2011/1455; National Energy Technology Laboratory: Pittsburgh, PA, USA, 2011. [Google Scholar]
- Jory, S.; Benamraoui, A.; Roshan Boojihawon, D.; Madichie, N. Net present value analysis and the wealth creation process: A case illustration. Account. Educ. J. 2016, 26, 85–99. [Google Scholar]
- Murillo-Zamorano, L.R. Economic efficiency and frontier techniques. J. Econ. Surv. 2004, 18, 33–77. [Google Scholar] [CrossRef]
- Graham, J.R.; Harvey, C.R. The theory and practice of corporate finance: Evidence from the field. J. Financ. Econ. 2001, 60, 187–243. [Google Scholar] [CrossRef]
- Hawawini, G.C.V. Finance for Executives: Managing for Value Creation, 6th ed.; Cengage Learning EMEA: Andover, UK, 2019; ISBN 978-1473749245. [Google Scholar]
- Kopacz, M.; Kwaśniewski, K.; Grzesiak, P.; Kapłan, R.; Kryzia, D. Economic assessments of hydrogen production by coal gasification. Przem. Chem. 2016, 1, 75–83. [Google Scholar] [CrossRef]
- Methodology and Specifications Guide Hydrogen. Available online: https://www.spglobal.com/platts/plattscontent/_assets/_files/en/our-methodology/methodology-specifications/hydrogen-prices.pdf (accessed on 13 September 2020).
- IEA. World Energy Outlook 2019—Analysis—IEA; IEA: Paris, France, 2019; ISBN 978-92-64-97300-8. [Google Scholar]
- Kwaśniewski, K.; Kopacz, M.; Kapłan, R.; Grzesiak, P. Zgazowanie Węgla: Uwarunkowania, Efektywność i Perspektywy Rozwoju; Wydawnictwa AGH: Kraków, Poland, 2015; ISBN 8374648317. [Google Scholar]
© 2020 by the authors. Licensee MDPI, Basel, Switzerland. This article is an open access article distributed under the terms and conditions of the Creative Commons Attribution (CC BY) license (http://creativecommons.org/licenses/by/4.0/).