Article

Kinetics of Biotic and Abiotic CO Production during the Initial Phase of Biowaste Composting

by
Sylwia Stegenta-Dąbrowska
1,
Karolina Sobieraj
1,
Jacek A. Koziel
2,
Jerzy Bieniek
1 and
Andrzej Białowiec
1,2,*
1
Faculty of Life Sciences and Technology, Wrocław University of Environmental and Life Sciences, 37a Chełmońskiego Str., 51-630 Wrocław, Poland
2
Department of Agricultural and Biosystems Engineering, Iowa State University, 605 Bissell Road, Ames, IA 50011, USA
*
Author to whom correspondence should be addressed.
Energies 2020, 13(20), 5451; https://doi.org/10.3390/en13205451
Submission received: 31 August 2020 / Revised: 13 October 2020 / Accepted: 13 October 2020 / Published: 19 October 2020
(This article belongs to the Special Issue Biowaste Management)

Abstract

:
Knowledge of kinetic parameters of CO production during biowaste composting is significantly important for the prediction of its course and estimation of total gas quantity. This allows increasing the control of the process, to minimize its negative impact on the environment and to protect the occupational safety of employees exposed to CO in the biowaste composting plant. For the first time, a full study of the influence of temperature and biowaste sterilization on the kinetics of CO production is presented. The lab-scale experiments used a mixture of green waste, dairy cattle manure, and sawdust in two variants: sterilized and non-sterilized samples. The process was carried out in controlled temperature reactors with measuring the concentrations of CO, O2, and CO2 every 12 h.CO production and k value increased with temperature. However, higher CO production was observed in biotic conditions between 10~50 °C, suggesting the biotic CO formation and 1st-order kinetics. The abiotic (thermochemical) process was more efficiently generating CO above 50 °C, described with a 0-order kinetic model. Additionally, the rate constant (k) value of CO production under biotic conditions was increasing up to a temperature of 60 °C, above which a slight decrease in CO production rate was observed at 70 °C. The presented results are the basis for further studies focused on the feasibility of (1) the mitigation and (2) valorization of CO production during the biowaste biostabilization are warranted.

Graphical Abstract

1. Introduction

Carbon monoxide (CO) is an odorless gas, without color or taste, with a strong toxic effect on living organisms. It is also toxic to many microorganisms due to its ability to inhibit electron transport [1].
Composting and aerobic biostabilization processes of biowaste are sources of CO production, besides major ones such as natural forest fires and incomplete fuel combustion and also through biochar production [2]. Production of CO is a result of the biological decomposition of organic matter, which also generates CO2, CH4, H2, nitrogen compounds, VOC, and H2S [3]. CO emissions have been observed during the composting of green waste [4], green waste with manure [5], organic waste [2], and aerobic biostabilization of the municipal waste [6]. The detection of CO during the pioneering experiments was a surprise due to the widespread belief in its primary production by incomplete combustion [7].
In recent years, the interest in gas emissions during composting in a laboratory, semi-technical, and full-scale conditions has increased [8,9,10,11] and could be a part of the worldwide circular economy [12]. Initial work focused on gas sampling [13], gas concentrations in the compost pores or above the pile surface (CO2, NH3, N2O, CH4, and CO) [8], spatial and temporal variability of compost gases [14], the influence of the feedstock (source-separated organic household waste and food waste; [3]) (agricultural waste [15]), municipal waste [16], including the separated organic fraction [17], green waste [18], particle size on the gaseous products emission [19].
There is still a lack of systematic knowledge in the literature analyzing the kinetics of CO production during aerobic biostabilization of biowaste. To date, soil science provides the most important literature in the field of CO formation kinetics related to the decomposition of organic matter. Conrad and Seiler [20], studied the simultaneous production and utilization of CO in three types of soils and developed early models. CO consumption follows the 1st-order reaction kinetics:
d m d t = k c o m
where:
  • kco—CO consumption constant rate (s−1),
  • m—the mass of CO (mg),
  • t—time (s),
while the CO production follows apparent zero-order reaction kinetics:
d m d t = k p
where:
  • kp—CO production rate (mg.s−1).
Since CO utilization and production occurs simultaneously, the mass balance is as follows:
d m d t = k p k c o m
Integration with the boundary conditions of t = 0, m = m0, and t = ∞, m = me, results in the CO utilization rate constant [18]:
k c o = 1 t l n m 0 m e m m e
where:
  • m0, me—equilibrium values (mg).
CO production from biological processes occurs under both aerobic and anaerobic conditions, with the latter being greater and correlated with O2 availability [3]. Researchers recognize the dual (biotic/abiotic) nature of CO production, but the question of the driving mechanisms remains open. Some argue that CO production is based on thermochemical processes and does not depend on the activity of microorganisms found in composted material [19]. These authors have shown that CO emissions are highly dependent on the temperature and amount of O2 [5]. The temperature dependence and diurnal changes to CO emissions from soil were reported [21]. Other abiotic factors, such as UV radiation, type of material, humidity, and organic matter content, have an impact on CO generation from soil [22,23].
An interesting discovery was made by Rich and King [24], who found that CO is not only produced but also utilized by methanogenic, acetogenic, and sulfate-reducing bacteria in compost [25]. The biotic origin of CO is not fully understood; one hypothesis being that it is formed from abiotic substrates, including porphyrins, polyphenols, and aromatic acids [26].
Despite the agreement that CO production can occur via biotic and abiotic processes—its origins and mechanisms have not been explained exhaustively. It is also necessary to know the full impact of temperature as one of the key parameters of the waste composting process on CO production. Knowledge about the kinetic parameters of CO production during composting is significantly important for the estimation of its production rate and total quantity. This allows increasing the control of the process, minimizing its negative impact on the environment, increasing the sustainability, and, what is immediately more important, to protect the safety of employees exposed to CO in the biowaste composting plant. In the literature, there are many works dealing with the subject of workers’ exposure related to the composting process exposure to volatile organic compounds (VOC), bacteria, fungi, organic dust, odors, leachates, molds, and other substances [27,28,29,30,31]. On the other hand, there are no sources providing information on the risk of CO poisoning; quantitative comparisons with the risk of other pollutants mentioned above do not exist either. However, this topic should not be ignored due to the toxicity of CO for humans and the nature of the work undertaken in composting plants. Most of the people employed perform manual labor, whose frequency and depth of breathing is increased due to their duties, which in turn increases their potential exposure to CO. Longterm exposure to CO may cause a number of diseases related to, among others, the respiratory and circulatory systems [32]. In the long-term, these results could also help save money in composting treatment plants. Designing the process to avoid CO emissions will reduce expenses related to the abstention & turnovers of employees at work or pay compensation for health impairment [33].
In recent work [4], we have indicated that CO production during biowaste aerobic digestion can be biotic and abiotic in nature. The main observation was that CO concentrations varied throughout the process, with the temperature being the main influencing factor. The temperature’s effect was more significant in the case of non-sterilized samples. This observation highlights the fact that microorganisms are involved in net CO production. These results add to the small, yet growing evidence that biotic processes generate CO. What are the details of the kinetics of CO formation according to aerobic biowaste stabilization process parameters? Trying to answer this question requires reexamining the same dataset, i.e., CO, O2, and CO2 concentrations reported in [4], with extensive statistical analysis to reveal the kinetics of CO formation.
Therefore, this novel and significant research aim to explain the effect of compost process temperature and microorganisms activity on CO kinetics production. Additionally, this article, for the first time, comprehensively explains the effect of these parameters on the kinetics of CO production under biotic and abiotic conditions. The main research hypothesis and the driving force behind this work is the belief that understanding the kinetics of CO production during aerobic waste biostabilization and the factors influencing it will allow controlling of this production in the future. We believe that the ability to predict the course of CO formation during the process and the total amount of produced gas will enable the development of models to reduce the negative impact of CO not only on the environment but also on human health. The uniqueness of the presented research is also emphasized by the fact that there are no sources dealing with this topic in the literature, which makes us pioneers in this area. Due to the aspects of occupational health and safety, our results may be of interest to representatives of industry, mainly owners of composting plants.The presented data may also become a stimulus for the development of industrial and engineering solutions aimed at, on the one hand, ensuring the safety of human health and life, but also limiting the negative impact of the composting process on the environment. Additionally, due to environmental aspects, these results may be relevant to politicians, environmentalists, and other researchers dealing with the emission of harmful gases. The perspective of using the results presented in this paper is therefore important not only on a regional scale, concerning individual composting plants, but—what is important—on a global scale.

2. Materials and Methods

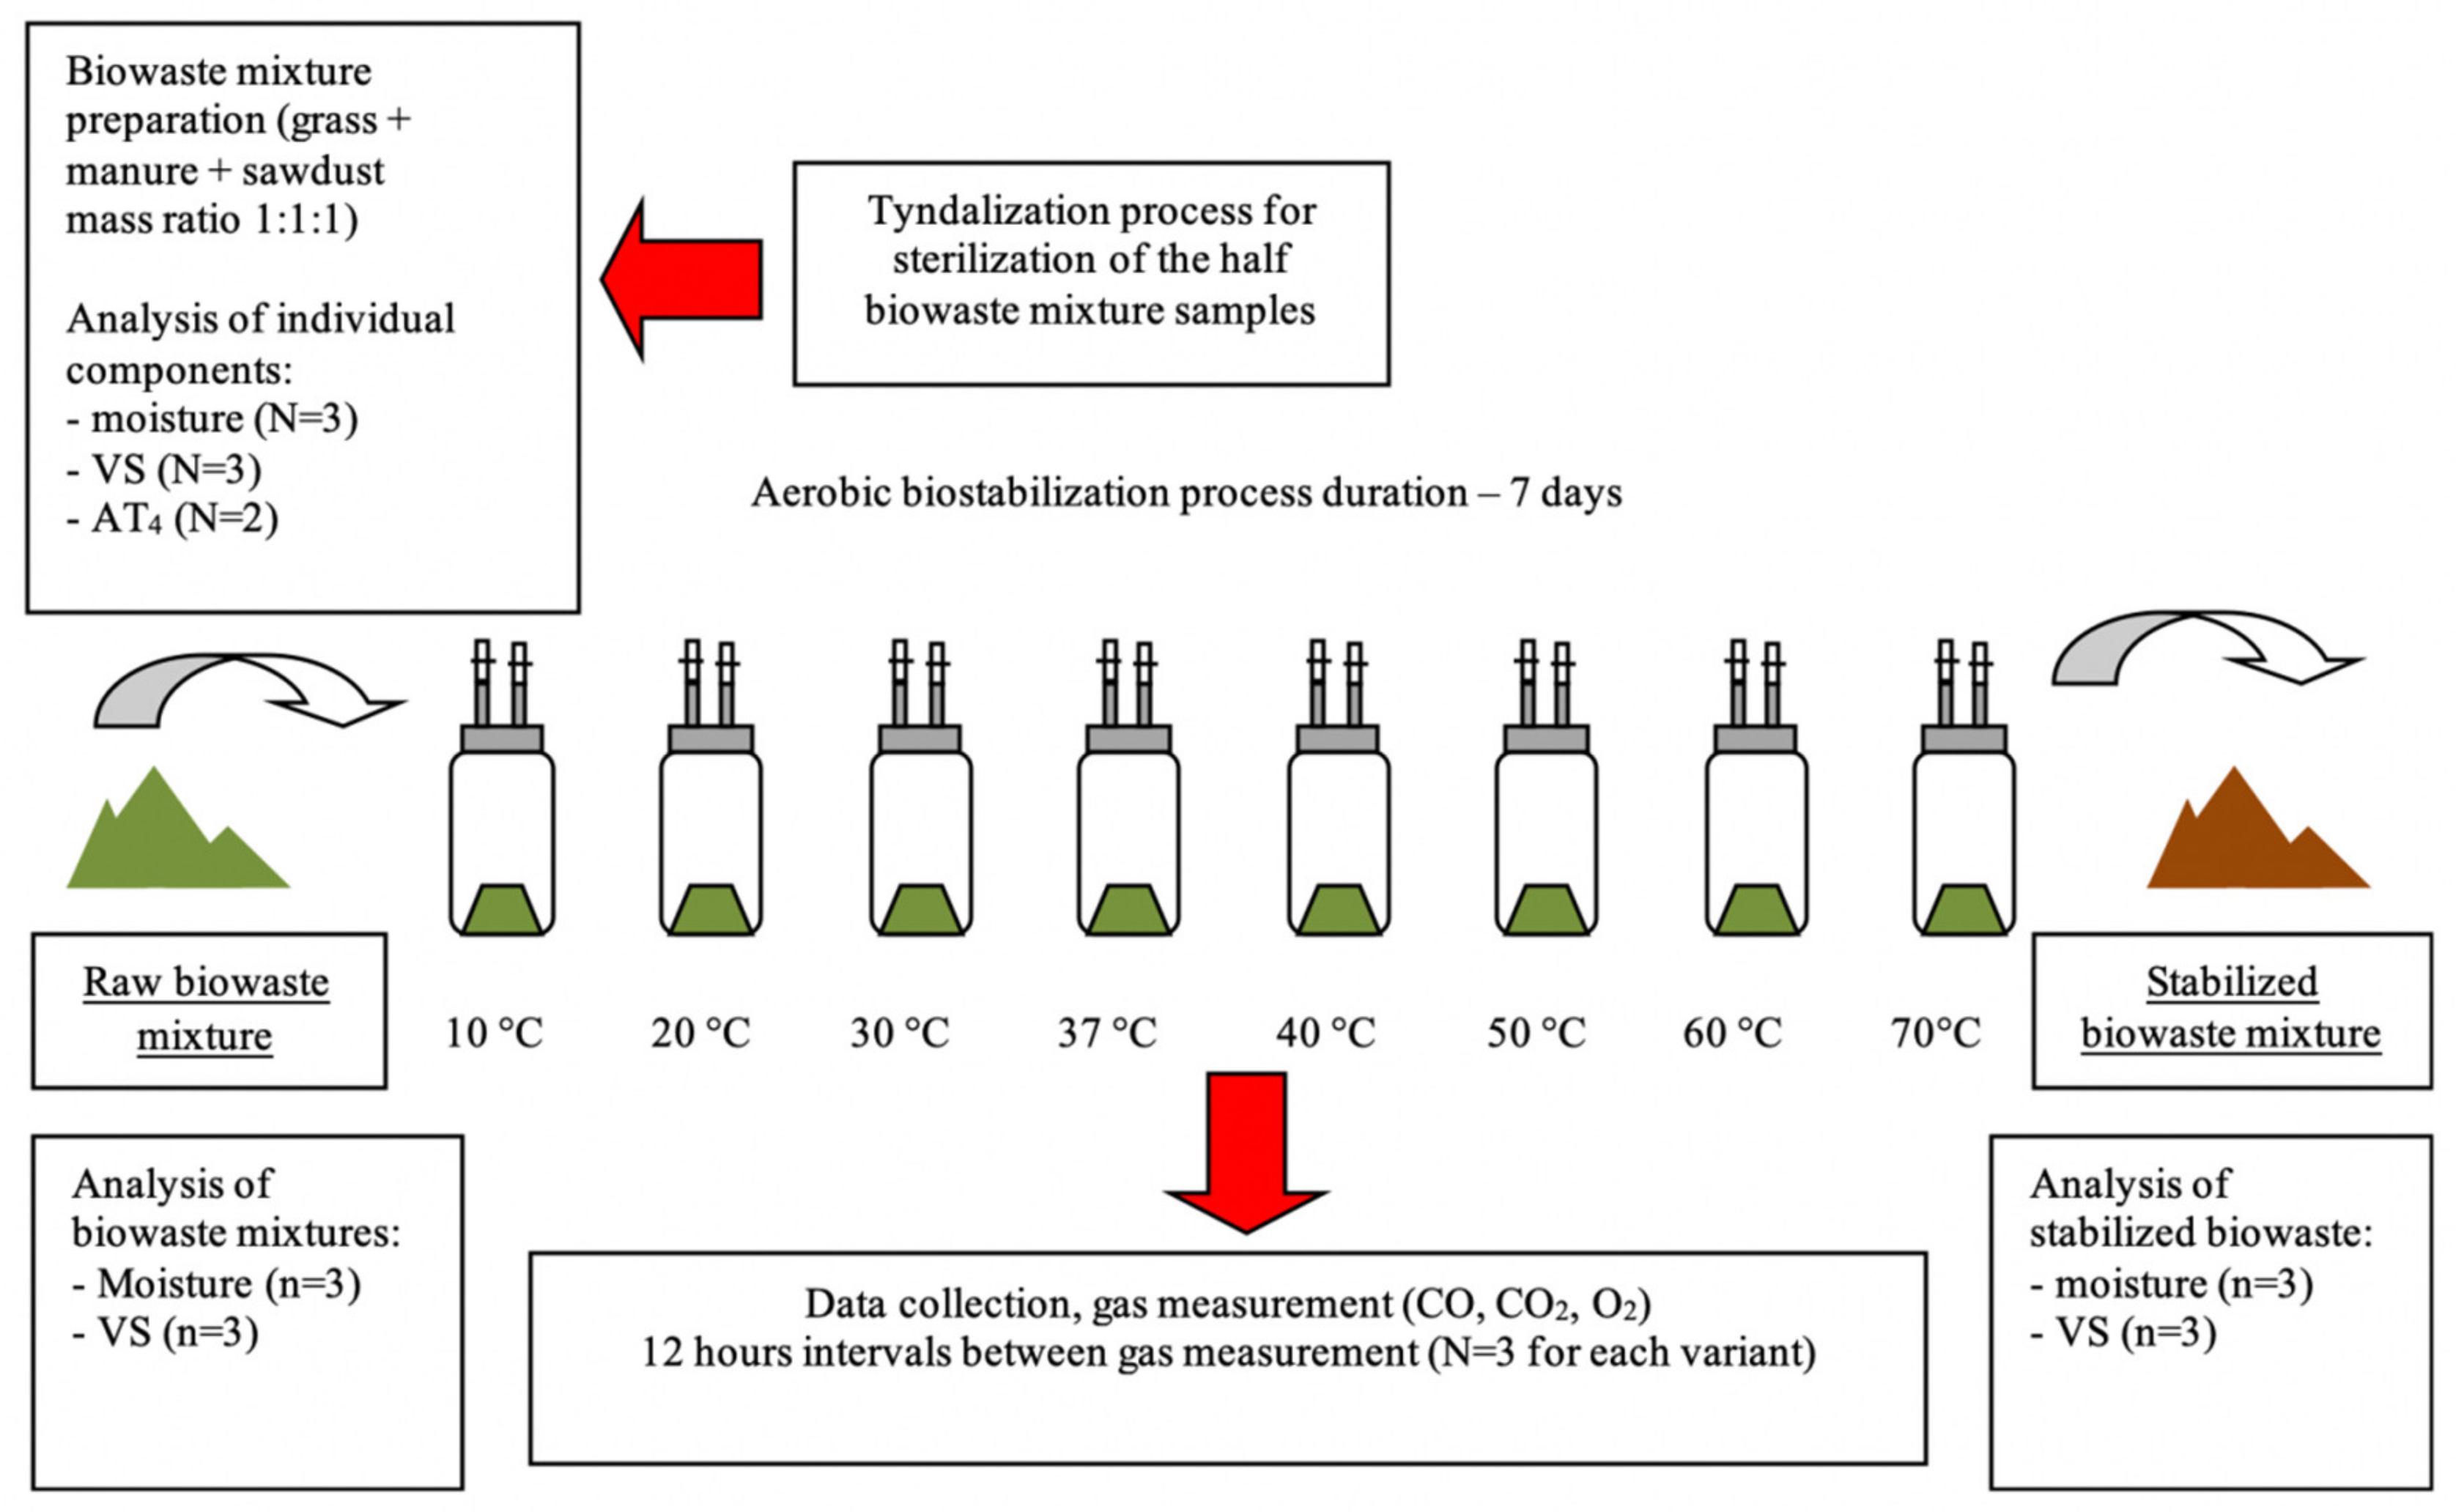
2.1. Waste Characteristics

Three fractions of waste were tested: dairy cattle manure, grass clippings, and pine sawdust. For the process of aerobic biostabilization of waste, it is recommended to keep the material moisture at 40–60% [31]. In order to obtain this parameter equal to ~59%, groups of waste used in the experiment were mixed in a mass ratio of 1:1:1. All samples were analyzed before and after the process for moisture and volatile solids (VS) content [32]. The respirometry activity (a.k.a. AT4) of cattle manure, grass clippings, pine sawdust separately, and of the biowaste mixture were determined according to [33,34].

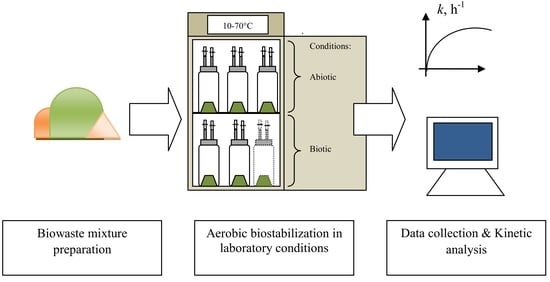
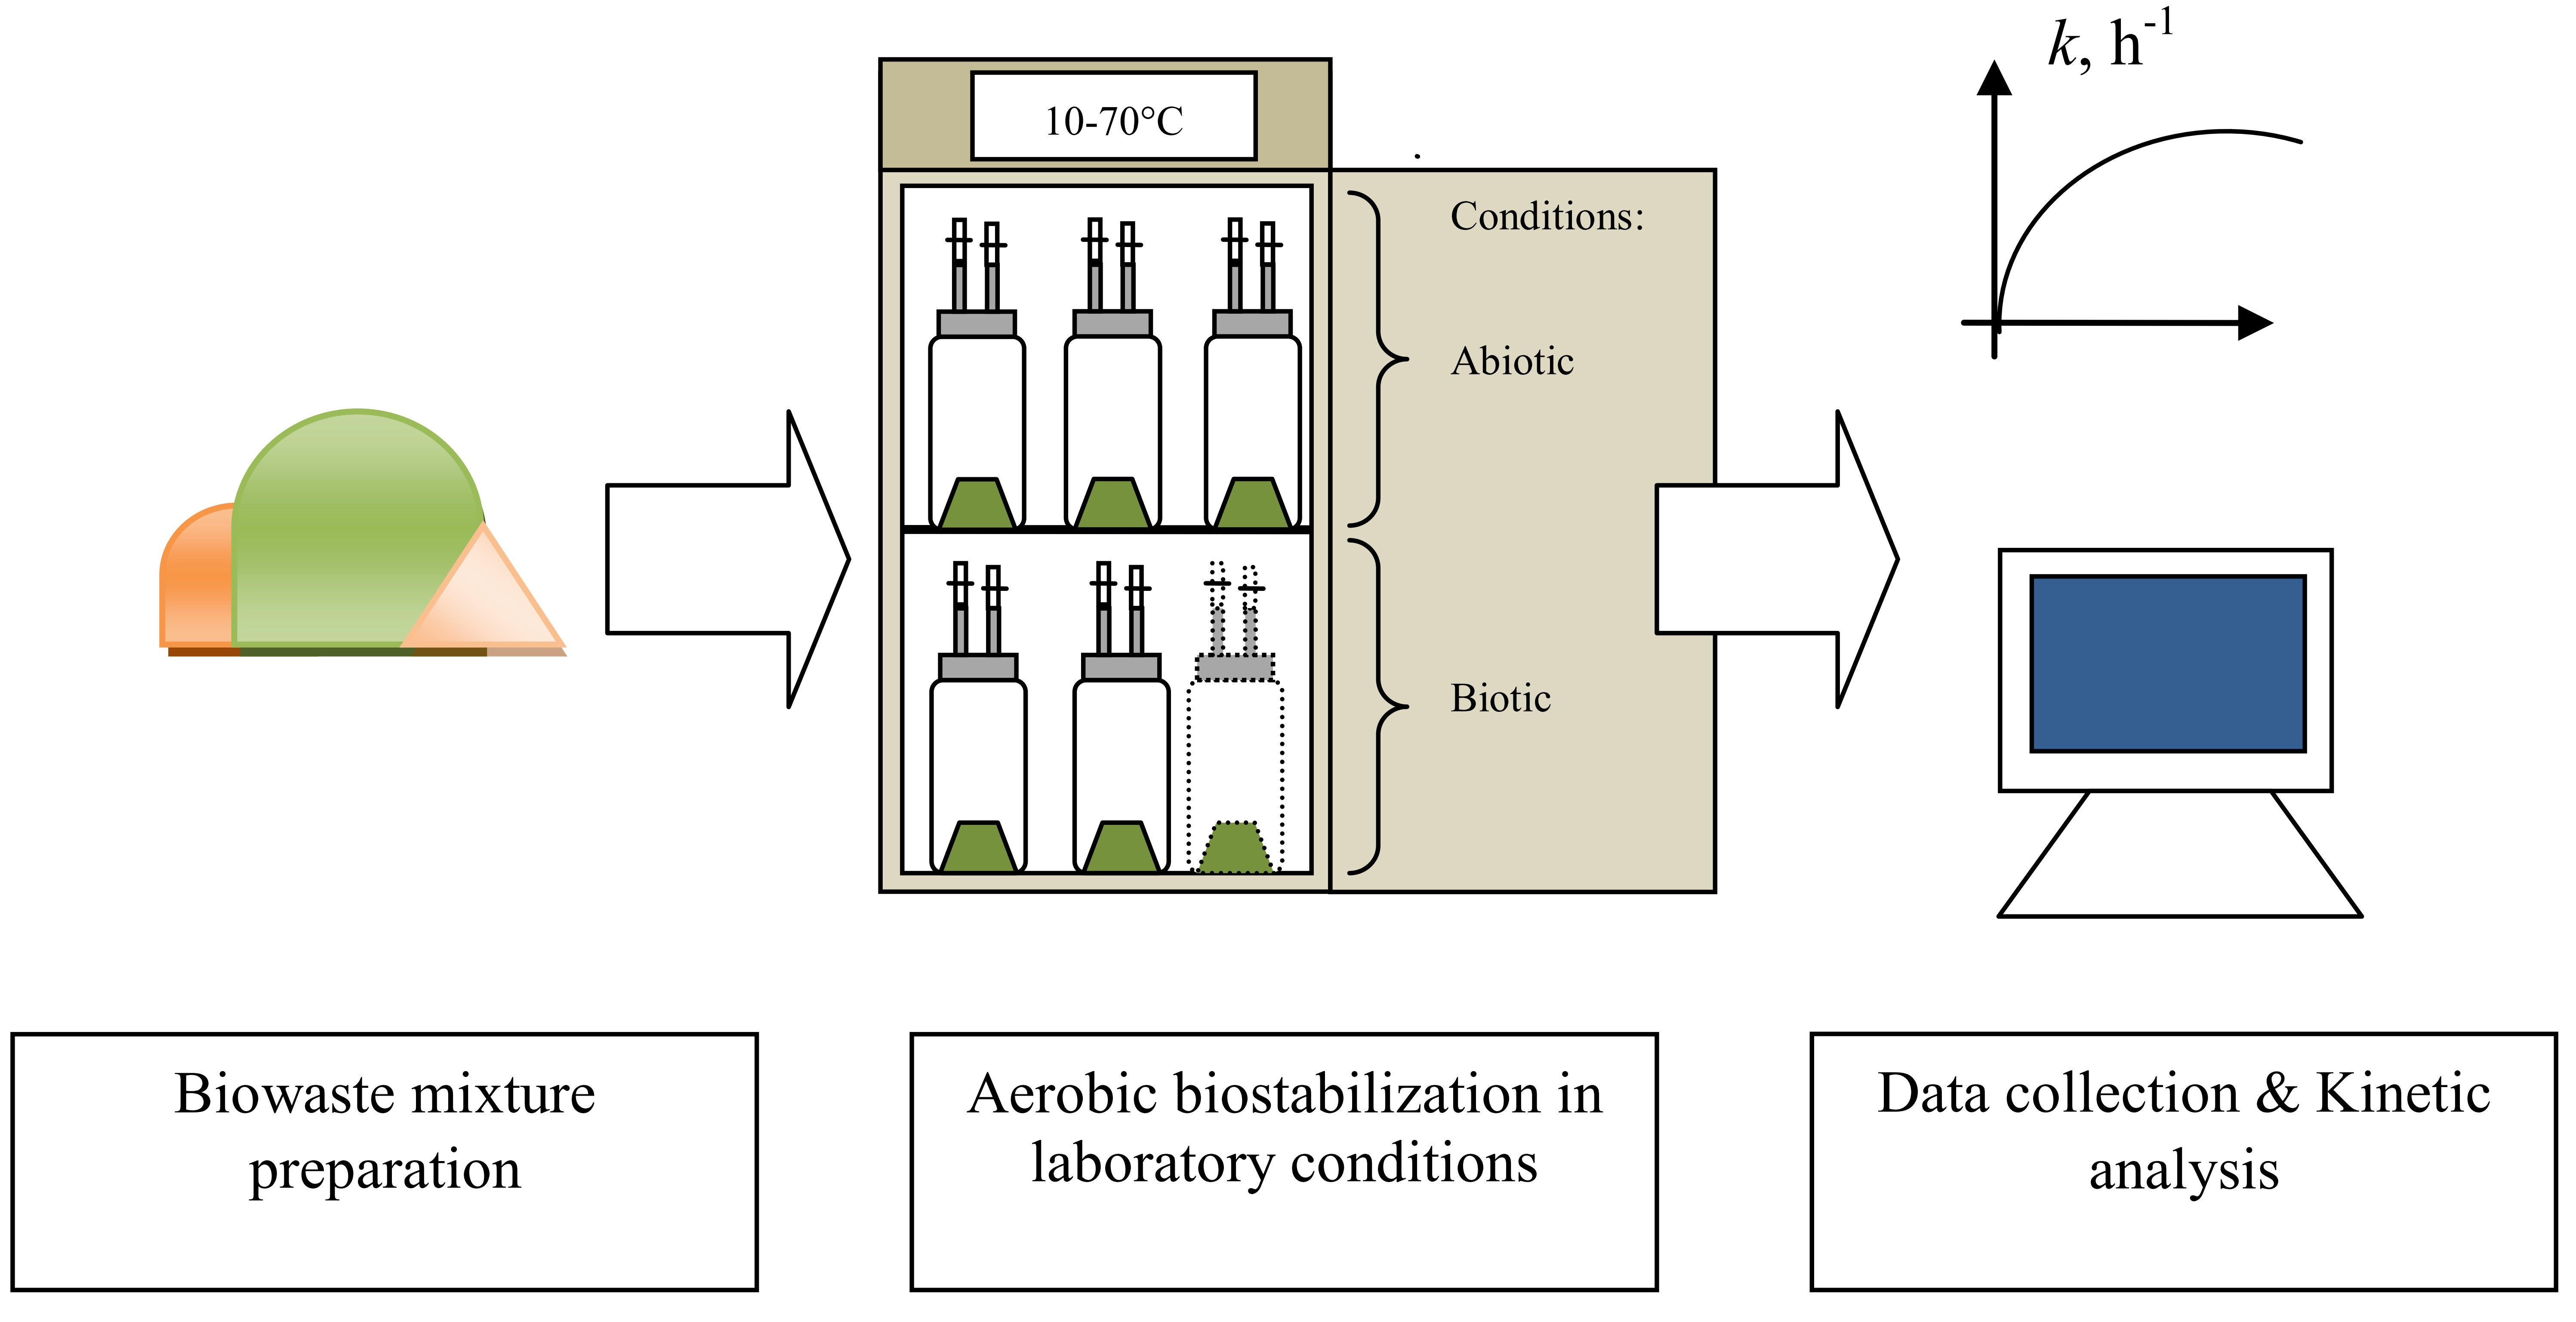
2.2. The Experiment Design and Procedure

The experiments were performed in laboratory conditions, in fixed temperature bioreactors, in triplicates, at the following temperatures: 10, 25, 30, 37, 40, 50, 60, and 70 °C, in sterile (abiotic) and non-sterile (biotic) conditions. For each bioreactor, 50~55 g of mixed biowaste was placed in the climatic chamber (POL-EKO, model ST-3, Wodzisław Śląski, Poland) under constant temperature conditions. The climatic chamber also shielded the bioreactors from natural light. The tests were carried out in 1 L bioreactors. The tyndalization method was used for biowaste sterilization—material in reactors was placed in the dryer for 1 h at 105 °C, 3 times with 24 h intervals. Figure 1 shows the experimental set-up.

2.3. Gas Production Monitoring

The concentrations of CO, O2, and CO2 formed inside the reactors were monitored at a frequency of 12 h, starting at the twelfth hour from the set up of the experiment after incubating the reactors at a constant temperature. Measurements were carried out using a factory-calibrated Kimo KIGAZ 200 (Kimo Instruments, Chevry-Cossigny, France) exhaust gas analyzer. In each case, three replicates were performed, measuring the gas concentrations for ~50 s until the indicated values stabilized. The aerobic conditions in bioreactors’ headspace were obtained by ventilation with the application of sterile filters (to keep sterile conditions in abiotic variants) during each gas measurement. Specific information about gas production measurement methods, air supplied to the process is described in our previous study [4].

2.4. CO Production Kinetics Determination

Data for kinetic analysis were analyzed by excluding the lag-phase [35]. Nonlinear least squares regression was used to determine the kinetic parameters of CO & CO2 production and O2 consumed. The cumulative curves of CO & CO2 production and O2 consumption concerning biowaste dry mass (d.m.) were determined [36]. The zero-order and 1st-order reaction models were compared. The zero-order equation for gas production is:
P = k · t
where:
  • P—total production or consumption (CO, CO2, or O2), (mg·g−1d.m.),
  • K—production or consumption rate (CO, CO2, or O2), (mg·g−1d.m.·h−1),
  • T—time, (h).
The 1st-order reaction equation for CO, CO2, or O2 production or utilization is:
P = P 0 · 1 e k · t
where:
  • P—total production or consumption (CO, CO2, or O2), (mg·g−1d.m.),
  • P0—maximum production or consumption (CO, CO2, or O2), (mg·g−1d.m.),
  • k—production or consumption (CO, CO2, or O2) constant rate, (h−1),
  • t—time, (h).
The k and P0, calculated from nonlinear regression, were used to calculate the average production or consumption rate (r) of CO, CO2, or O2 according to:
r = k · P 0
where:
  • r—average production or consumption rate (r) of CO, CO2, or O2, (mg·g−1d.m.·h−1).
The same procedure (Equations (6) and (7)) was applied for the respiration activity (AT4) of the biowaste sample’s characterization.

2.5. Statistical Analysis

Statistical analysis for the results was performed using the Statistica software 13.3 (TIBCO Software Inc., Palo Alto, CA, USA). Parametric tests (unequal-variance analysis and Tukey’s post-hoc test at the significance level α = 0.05) were used to compare the differences between variants. Kinetic model parameters were statistically verified by estimating the value of the determination coefficient R2 and Akaike information criterion (AIC) according to the following formula [37]:
A I C = n   l o g ê i 2 n + 2 K
where:
  • êi—the estimated residuals for a particular candidate model,
  • K—total number of estimated regression parameters.

3. Results

3.1. Material Properties before and after Composting

The initial moisture content in the biowaste mixture was ~59%. The final moisture content depended on the composting temperature. In general, for the 10~40 °C range, the final moisture content fluctuated near the initial value of 59%. For 25 °C, the moisture content decreased in the abiotic variant to 58%, while it increased to almost 62% for the biotic variant. For 30 °C, a decrease of moisture content in both variants was observed to 53% & 57% in abiotic & biotic variants, respectively. At 37 °C in the case of abiotic variant, the significant (p < 0.05) drop of the water content compared to the abiotic conditions at 25, 60, and 70 °C (Figure 2a), but less significant than at 30 °C (56.5% for abiotic and 58% for biotic conditions). At 40 °C, the differences between abiotic and biotic variants were significant (p < 0.05), and the water content amounted to 57% and 60%, respectively.
Composting above 50 °C significantly (p > 0.05) reduced the water content in all variants, below the optimum value of 59%. At 60 °C, the final moisture content was 40% and 49% for the abiotic and the biotic variant, respectively. It was the highest moisture loss, which may indicate the highest intensity of the process at this temperature. In the abiotic variant, a significant difference (p > 0.05) was observed between 60 & 10, 25 & 30 °C and between 70 & 10, 25, 30, 37, 40 and 50 °C (Figure 2a). Composting at 70 °C resulted in moisture content drop up to 50% in abiotic and 54% in the biotic variant. Significant differences (p > 0.05) were observed between the abiotic variant at 60 & 70 and 10, 25, 30, 37, 40, & 50 °C (Figure 3).
The prepared biowaste mixture was characterized by a high content of volatile solids (~90% d.m., Figure 2b). However, no significant differences (p > 0.05) were observed during the 1-week aerobic biostabilization of the mixture (Figure 2b). In most variants, the content of organic matter was slightly numerically lower (not statistically significant) in non-sterilized biowaste in comparison to the sterilized under the same thermal conditions, which could be due to the activity of microorganisms under biotic conditions. The slight decrease (not statistically significant) in organic compounds is also due to the short process time (7 d). The highest (p < 0.05) differences between abiotic and biotic variants were observed at 30 & 40 °C (91.5% vs. 88.5%, & 91% vs. 88%, respectively) (Figure 2b).
Both two types of substrates (grass and manure) and the resulting biowaste mixture used in experiments were characterized by high respiration activity (Figure 3). The highest activity was obtained in the case of grass (188 mg O2·g−1d.m.), followed by manure (141 mg O2·g−1d.m.), and biowaste mixture (67.5 mg O2·g−1d.m.) (Table 1). The lowest AT4 value for biowaste mixture was caused by the addition of inert sawdust. The kinetic rate constant for the O2 demand of the obtained waste mixture was 0.026 h−1 (Table 1).

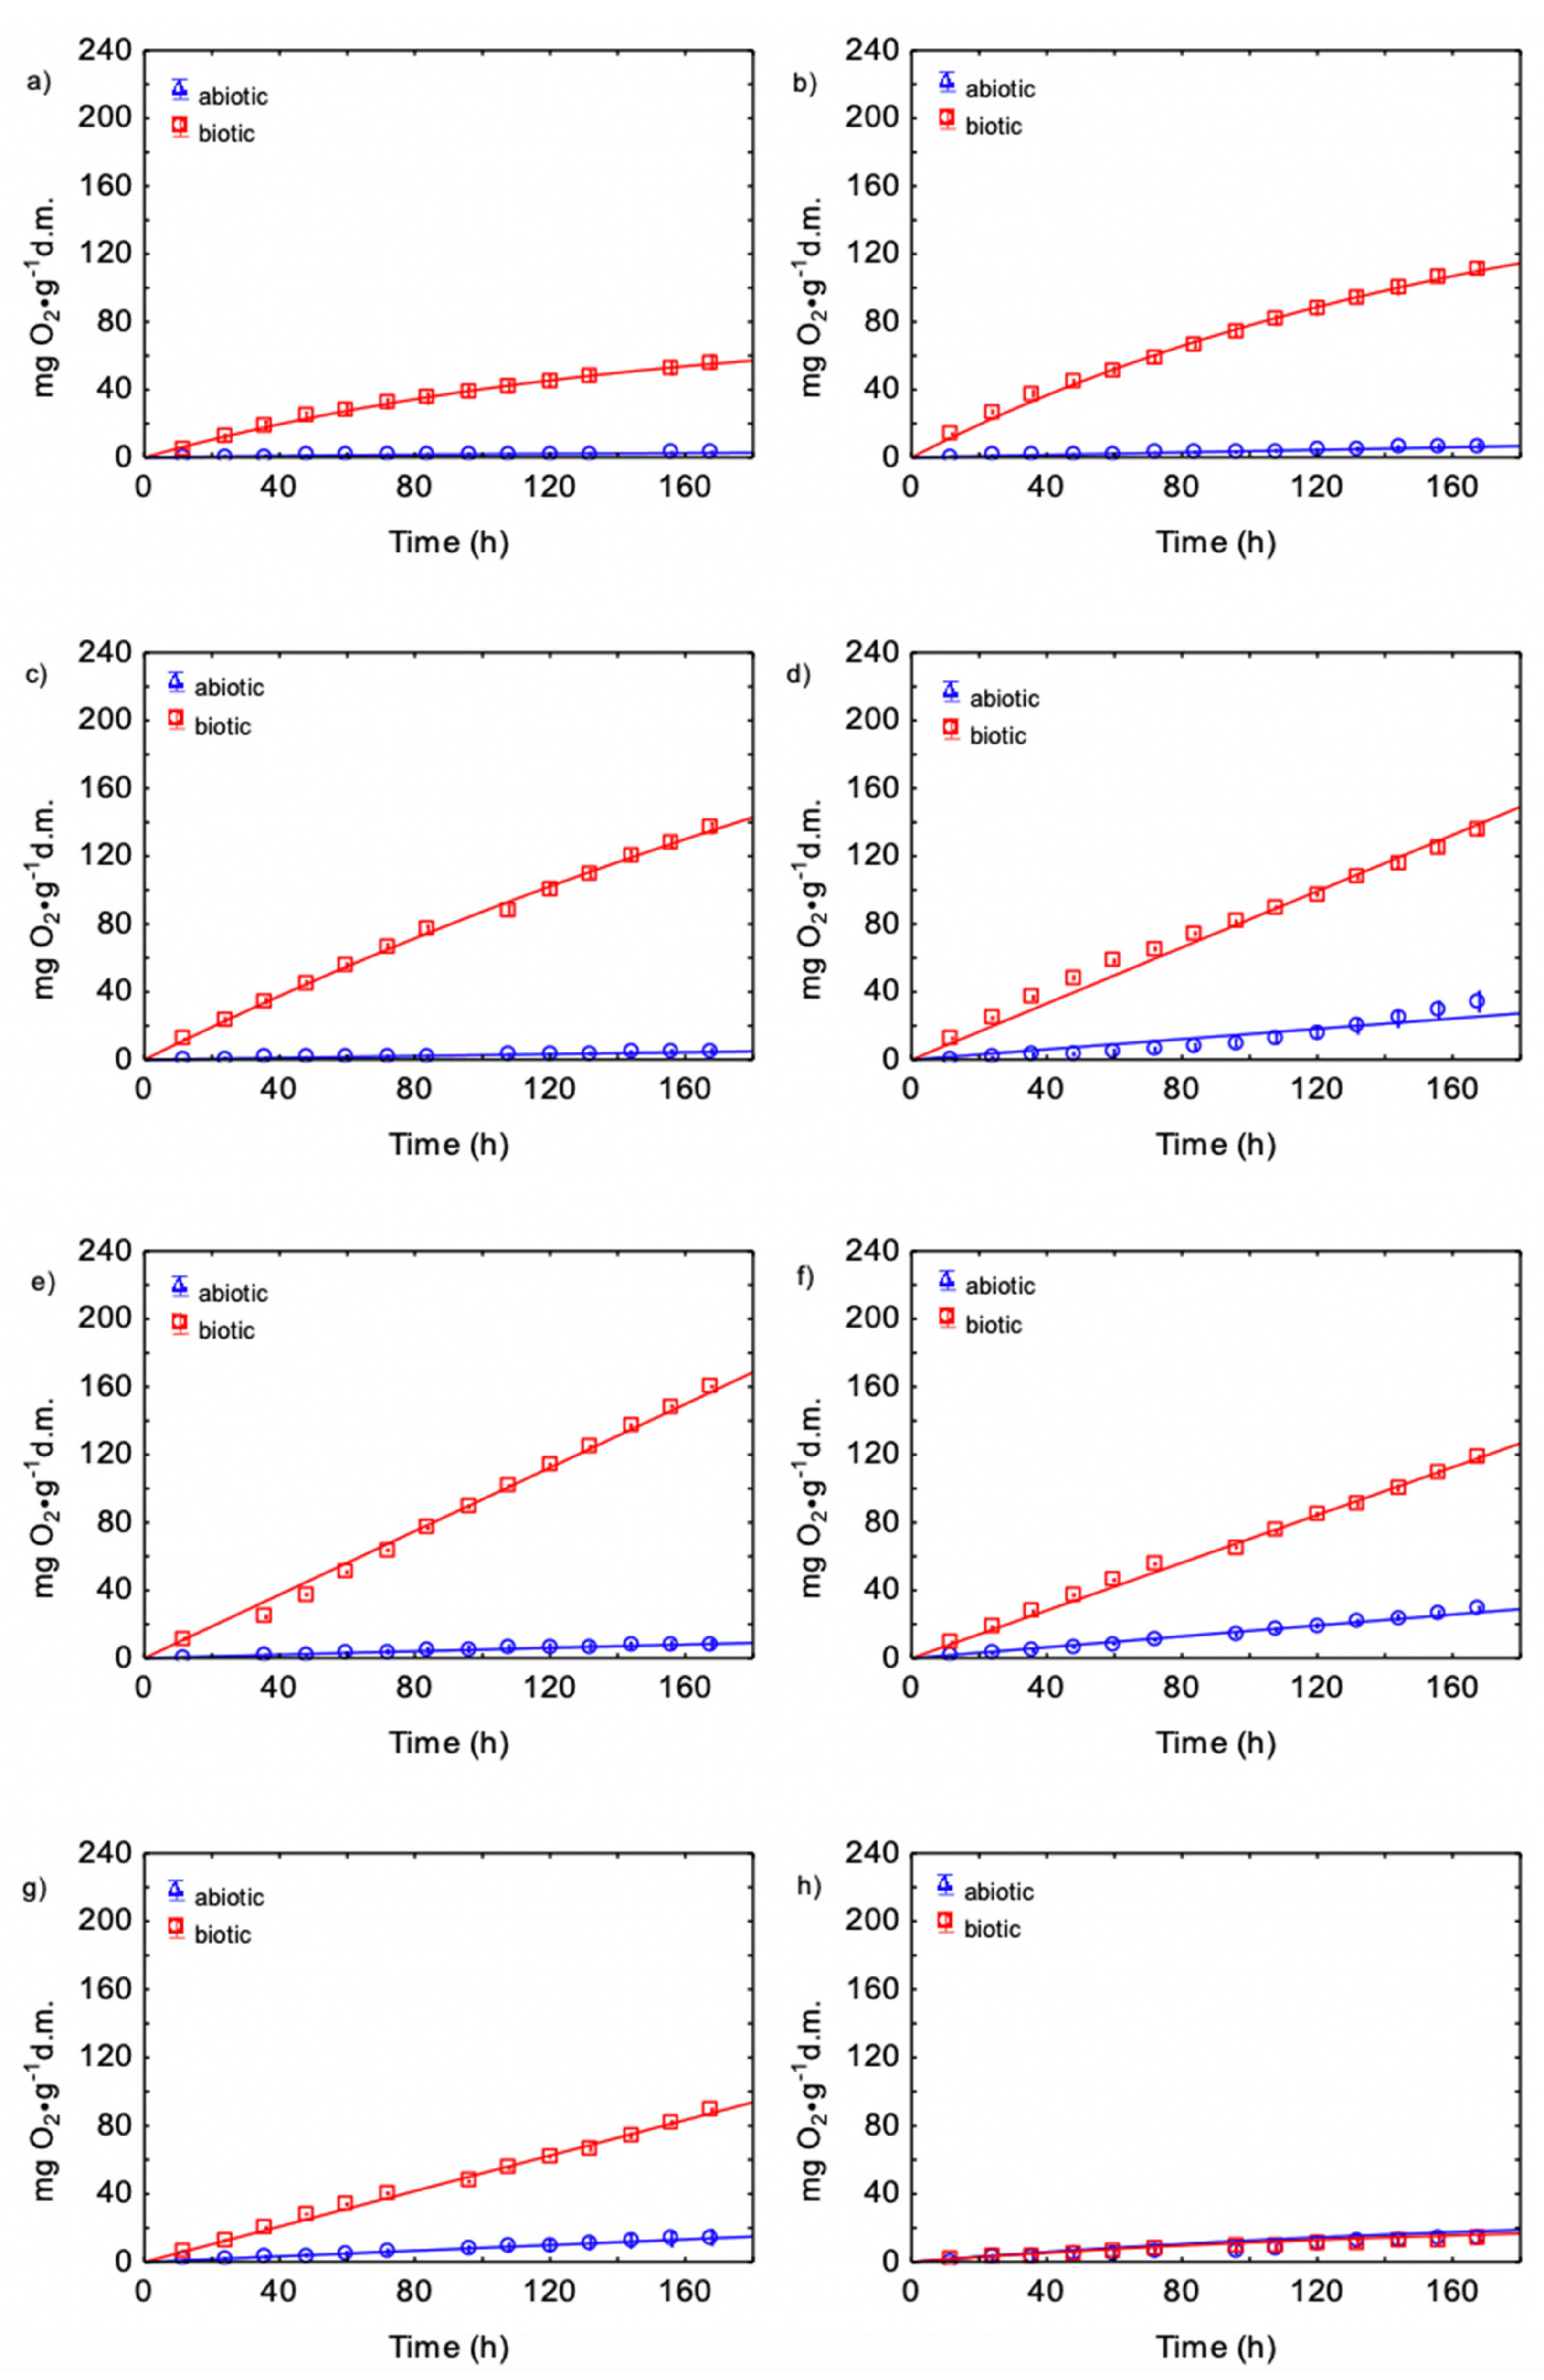
3.2. Dynamics of O2 Consumption and CO2 Production during Biowaste Aerobic Biostabilization

The O2 consumption and CO2 production were higher in all biotic variants compared with abiotic. This also indicated the successful sterilization process driven by biological & thermochemical mechanisms in biotic variants, while only thermochemical in abiotic. O2 consumption in the biotic variant at 10 °C was 56.2 mg O2·g−1d.m. (Figure 4a), while the amount of CO2 produced during the experiment reached 72.8 mg CO2·g−1d.m. (Figure 5a). At the same time, the amount of CO2 produced in the abiotic variant was much lower and amounted to 4.04 mg CO2·g−1d.m (Figure 5a). Larger amounts of CO2 generated and O2 consumed were observed at 20 °C (Figure 4b and Figure 5b). The total amount of O2 consumed by microorganisms during 168 h was 6.03 mg O2·g−1d.m. under abiotic conditions and 112 mg O2·g−1d.m. in the biotic variant. At 30 °C, a further increase in O2 consumed was observed (Figure 4c). The amount of CO2 produced at this temperature was 6.75 mg CO2·g−1d.m. in abiotic and 174 mg CO2·g−1d.m. in biotic variant (Figure 5c). In the case of abiotic conditions, the effect of time was not statistically significant (p > 0.05) for the observed in CO2 production and O2 consumption at 10, 25, and 30 °C, indicating that these variants belonged to the same homogeneous group.
A significant statistical difference was observed only at the end of the process at 37 °C (132~168 h) (Table S3.12–S3.15, Supplementary Materials). A different outcome was noted in the case of abiotic conditions at 30 and 40 °C, i.e., much higher amounts of O2 consumed and CO2 produced in the case of 40 °C, a significant difference (p < 0.05) between variants, notably visible at the end of the process.
The peak of CO2 produced (205 mg CO2·g−1d.m.) and O2 consumed (160 mg O2·g−1d.m) was observed at 40 °C in the biotic variant (Figure 4e and Figure 5e). The values obtained showed significant differences (p < 0.05) for most of the temperatures and belonged to a separate homogeneous group at most of the time of the experiment. At 50 °C, a decrease in the amount of CO2 produced (153 mg CO2·g−1d.m) and O2 consumed (130 mg O2·g−1d.m) were observed (Figure 4f and Figure 5f) in biotic variants in comparison to 40 °C.
At 60°C, a decrease in the amount of CO2 produced (116 mg CO2·g−1d.m) and O2 consumed (101 mg O2·g−1d.m) under biotic conditions were observed (Figure 4g and Figure 5g). The highest amount of CO2 produced 46 mg CO2·g−1d.m in the entire experiment was observed at abiotic conditions under 60 °C (Figure 5g). The amount of O2 consumed and CO2 produced at 70 °C was very low (below 20 mg CO2·g−1d.m) and numerically similar regardless of the conditions (Figure 4h and Figure 5h).

3.3. Kinetics of CO Production during Biowaste Aerobic Biostabilization

The accumulated amount of CO generated during the experiment at various temperatures is shown in Figure 6. Table S3.3 (Supplementary Materials) presents the best-fit reaction kinetics model (0- or 1st-order) selected based on the coefficient of determination (R2) and Akaike information criterion (AIC). The amount of CO produced at 10 °C was 7.23 µg CO·g−1d.m. under abiotic and 16.5 µg CO·g−1d.m. biotic conditions (Figure 6a). At 20 °C, CO production was higher for both abiotic and biotic variants, and the final value was slightly higher for the abiotic (26.7 µg CO·g−1d.m.) compared to 25.9 µg CO·g−1d.m. for biotic (Figure 6b). At 30 °C, the CO production was 17.5 µg CO·g−1d.m. (abiotic) and 21.5 µg CO·g−1d.m. (biotic) (Figure 6c). Higher CO production was observed at 37 °C (Figure 6d), especially for abiotic variant 43.4 µg CO·g−1d.m. compared to 31.4 g CO·g−1d.m. under biotic conditions. The opposite situation was observed during biostabilization at 40 °C (Figure 6e).
Increasing temperature resulted in a further increase in CO production at 50 °C to 58.8 µg CO·g−1d.m. (abiotic) and 73.0 µg CO·g−1d.m. (biotic), at 60 °C to 120 µg CO·g−1d.m. (abiotic) and 115 µg CO·g−1d.m. (biotic), and at 70 °C to 137 µg CO·g−1d.m. (abiotic) and 122 µg CO·g−1d.m. (biotic) (Figure 6f). Significant differences (p < 0.05) in abiotic variants were observed between CO production under 10, 20, 30, 37 & 40 °C and temperatures of 50, 60 & 70 °C, which indicates that the temperature of 40 °C is a threshold value above which the CO production significantly (p < 0.05) increases. In biotic variants, significant differences were noted between the temperature of 10, 20, 30, & 37 °C and the temperature of 50, 60 & 70 °C for up to 60 h of experiment. At 70 °C, the differences were the same in both variants, due to the lethal effects of high temperatures on bacteria.

3.4. Kinetics of CO2 and CO Production and O2 Consumption during Biowaste Aerobic Biostabilization

Kinetics analyses of the production of CO & CO2 and O2 consumption were performed. The obtained results of O2 consumption (Table S2.1, Supplementary Materials) and CO2 production (Table S2.2, Supplementary Materials) during the biowaste aerobic biostabilization process differed significantly depending on the variant and temperature. Particularly high O2 consumption and CO2 production were observed in biotic variants.
The nature of O2 consumption in the low-temperature range from 10 to 30 °C in both abiotic and biotic variants was nonlinear (Table S2.1, Supplementary Materials). At higher temperatures from 37 to 60 °C, the cumulative curves had linear character, while in the case of 70 °C, the 1st-order model better fitted to the results (Table A1). In the case of CO2 production, a clear distinction into abiotic (mostly with a linear trend) and biotic (1st-order model) (Table S2.2, Supplementary Materials, Table A1) was observed. In the case of CO production, it was difficult to demonstrate one specific type of trend. At temperatures up to 30 °C, all analyzed samples followed the 1st-order model (Table S3.3, Supplementary Materials). At 37~40 °C, two different trends were observed, i.e., the linear for abiotic variants and the 1st-order for biotic conditions (Table A1). At 50 °C, all variants were characterized by the 1storder model, while at 60~70 °C, the CO production kinetics had an evident linear character (Table A1).
The k value had typical values for the composting process, 0.002–0.15 (d−1) [38]. It was noted that O2 consumption in the temperature range up to was significantly lower in abiotic variants. Above 40 °C, the k values were similar (Table S2.1, Supplementary Materials) both under biotic and abiotic conditions.
For CO2 production at temperatures up to 37 °C, a slightly higher k value was observed in biotic variants. In the range of 40~70 °C, slightly higher k and rCO2 values were observed in the case of abiotic variants (Table S2.2, Supplementary Materials, Figure A1). Both in O2 and CO production rO2 and rCO2 values were similar in abiotic conditions (Figure A1). In the case of CO production, the highest k values were observed in biotic variants ranging from 20 to 40 °C, i.e., from 0.018 to 0.031 h−1. The k values were higher in all biotic variants than in abiotic (Table S3.3, Supplementary Materials; Figure A1).

4. Discussion

4.1. Biowaste Properties

The properties of biowaste and mixtures were shown and discussed in the previous article [4], Table S1 in Supplementary Materials. The experiment confirmed that the initial moisture content of dairy manure used to the experiment assumed typical values [38]. Organic matter content was similar to the previously observed by Fukumoto et al. [39] from 81.2% to 87.9% d.m. Similarly, the properties of grass did not differ significantly from the results available in the literature, i.e., moisture content of 70~80%, organic content 70~90% d.m. [40,41]. Due to the high moisture in both materials, it has been decided to add dried sawdust to obtain the optimal water content for the composting process (~60%, according to [42]). The sawdust used was characterized by a relatively high content of organic substance compared to those used by Adhikari et al. [43], i.e., 75.0% compared to 53.7% d.m., which was the consequence of using fresh material.
Changes in moisture up to 5% in the material after the process observed during the present study are typical and consistent with data obtained earlier by other researchers. Sun et al. [44] explained this phenomenon by the process of water evaporation and its removal from headspace by the airflow. At lower temperatures (<30 °C), which do not allow for such intensive evaporation from the material, water is formed as a result of the decomposition of organic matter, both from chemical and microbiological sources [45]. This results in increased moisture of the waste [46,47].
The observed differences in the decomposition of the volatile solids between abiotic and biotic conditions were insignificant (especially at >50 °C), which may indicate that the thermochemical mechanism of organic matter decomposition dominated at higher temperatures. de Guardia et al. [48] noted that if the samples are similar to each other in organic matter content and moisture, their degradation is very similar, even despite different process conditions (temperature and moisture). Low organic matter decomposition could also indicate the influence of a large amount of hardly degradable lignocellulosic organic compounds from sawdust; even k value was similar to than proposed by [49] for the composting process. This sawdust constituted 33% of the sample, which is characterized by a high fraction of such substances [4].
Studies of various substrates made by Evangelou et al. [50] also demonstrated the high respiratory activity of microorganisms (AT4) recorded in dairy manure and grass is the result of the high content of the easily-biodegradable organic substance (e.g., mono- and disaccharides, starch, proteins, and fats) in this biowaste. Sawdust was not tested for AT4 activity due to the use of dry material. Low humidity creates an unfavorable environment for the development of microorganisms. For this reason, the addition of dried pine sawdust (used to reduce moisture to optimal values) caused a decrease in AT4 to 67.5 mg O2·g−1d.m. in the biowaste mixture (Table 1).
All obtained results in the respiratory activity of microorganisms are typical for the type of material [51]. Dairy manure used for the tests showed a similar AT4 value to chicken manure 94.7 and 109 mg O2·g−1d.m. [52] and to the organic fraction of municipal waste 90.9~119 mg O2·g−1 d.m. [48].
Similarly to previous research, if the respiratory activity was following the 1st-order model, we also used for the determination of the kinetic parameters. Nonlinear estimations for almost all samples were characterized by a very high coefficient of determination (R2 > 0.96) (Table 1). The highest rate constant was obtained for grass (k = 0.043 h−1); lower k value was noted for manure (k = 0.0136 h−1) and biowaste mixture (k = 0.026 h−1). The rate constants were comparable with the values obtained by other researchers for plant materials such as leaves (k = 0.00129 h−1), branches (k = 0.0025 h−1), grass (k = 0.00125 h−1), and food waste (k = 0.00044 h−1) [53]. In studies made by Fernandez et al. [54], k was from 0.0009 to 0.0018 d−1. These values are in line with those proposed by Mason and Milke [49] for the composting process (k = 0.0063 h−1) and were higher than for organic waste.

4.2. O2 Consumption, CO2 and CO Production during Biowaste Aerobic Biostabilization

CO2 emissions are frequently used for estimating organic carbon decomposition [55]. In this research, it increased up to the 7th day of the process, but then a gradual decrease was observed. This phenomenon was also observed in laboratory conditions during composting garden waste [56,57] and in technical-scale analyzes when composting sewage sludge [44]. The amount of CO2 produced during the 48 days of the process was about 50,000 g CO2·m−2, with 20,000 g CO2·m−2 produced during the next five days of the process [44].
This high initial CO2 production is the result of the microbial activity that degrades easy-available volatile solids, such as simple sugars or organic acids [54]. This was confirmed by studies Nasini et al. [58], who observed a relationship between CO2 emission and the level of microbial activity during static composting in piles of waste from olive oil pressing. The involvement of aerobic microorganisms in the production of CO2 can also be seen in this research. For biotic variants, the amount of CO2 produced was much higher than for abiotic. Furthermore, the cumulative CO2 production was the highest at 30, 37, and 40 °C, while the lowest in extreme thermal conditions, i.e., 10 and 70 °C. This may be due to the domination of mesophilic bacteria in the used biowaste mixture, for which the optimum temperature range is 30~40 °C [59]. Temperatures close to 10 and 70 °C caused inhibition of their metabolism, which affected the reduction of organic matter decompositions and the CO2 production.
Analyzes conducted by Sommer and Moller [60] allowed the observation of the relationship between O2 consumption and CO2 emission. The presence of one gas inhibits the occurrence of another. This tendency can also be seen in the results presented here (cumulative O2 consumption is inversely proportional to CO2 production). Additional confirmation is also the rapid decrease in the amount of O2 during the first 7 days observed earlier in the laboratory by Kulcu and Yaldiz [61] and in the technical-scale conditions [62]. Experiments carried out by [6] are also supported by the presented here findings. In the composting processes they analyzed, the initial decay in O2 content was simultaneous with an increase in the CO2 concentration in the material due to the decomposition of simple organic compounds. The correlation of CO2 production with O2 consumption in the present study and their dependence on the activity of microorganisms concerning temperature was also consistent with reports Puyuelo et al. [63]. They emphasized that temperature and O2 consumption are identified as key parameters for assessment of the microbial activity.
A characteristic feature of CO production during composting is its increased production in the early stages of the process. The researchers reported high concentrations of CO during composting of green waste with grass immediately after a few hours starting the experiment [19]. In the experiments of all of the cited authors [4,7,19,64], the CO content decreased after a period of 1 to 2 weeks. In our previous research [6], CO emissions from the biostabilization process of organic fraction of municipal solid waste CO emission significantly decreased in the 3rd week of the full-scale experiment. This tendency is also visible in the present results. For process variants carried out at 10, 20, 30, and 37 °C after the initial increase in the amount of CO produced, the CO production stagnated (with 40 °C only in the case of biotic variant).
CO production rate decreased in the later stages of biostabilization can be explained by two factors. The first is the consumption of CO by bacteria as a result of oxidation CO to CO2 [5]. The second is based on the dependence between the content of CO and O2 in the biowaste matrix. [3,7,19,64] reported the highest CO production under aerobic conditions. The O2 depletion causes a decrease in the level of CO, and thus affects the increase in CO2 concentration, which could affect the results obtained.
In this study, the highest CO production was characterized by high-temperature biostabilization variants (60, 70, and 50 °C, respectively). The lowest CO production was obtained at 10 and 30 °C. These results are consistent with those obtained by [4]. In their experiment, the highest CO production was observed at 65 and 50 °C, while the lowest amounts of CO were generated during composting of green waste at 5 °C.

4.3. Kinetics of O2Consumption, CO2 and CO Production during Biowaste Aerobic Biostabilization

Many authors recognize the benefits of predicting gaseous products from composting, such as CO2 production and O2 consumption and other GHG, but still less data regarding CO kinetics production [65,66]. Knowledge of the kinetics of the composting process allows its modeling, which in turn could improve the optimization [67]. To date, researchers have proposed several models for process kinetics, mainly based on the physical and biochemical properties of composts [5]. Mathematical models most often refer to 0, 1st, or higher-order kinetics [50,68]. These models can effectively describe the evolution of changes in process parameters, such as mass balance, heat balance, organic matter degradation, C mineralization, or changes in the C, N, P, K content [53,69], O2 demand, or CO2 production [67,70]. The proportion of nutrients have an extreme influence on compost properties [71]. No studies are presenting a full picture of the kinetics of COproduction as a function of the composting process temperature. Due to a gap in the literature, the comparison in this paper was made mainly based on other process parameters obtained by other researchers. The CO2 production stems from the oxidation of readily degradable carbon compounds, and consequently, from the nature of the substrates, O2, moisture, and microbial activity [72]. The CO2 emission rate is also an indicator of the rapid degradation of total organic matter and strong microbial activity [73]. The carbon mineralization of organic wastes follows a combined two-step kinetic: initial rapid phase1st-order followed by 0-order, slow phase [74], thus, the rationale to use of these two models to find kinetic parameters of composting. Results from this study confirmed that zero and 1st-order kinetic suits both for the production CO2 and O2 consumption (first stage of composting), which is confirmed with high R2 and low AIC results (Tables S2.1 and S2.2, Supplementary Materials). CO2production and O2 consumption rate during biotic conditions were typical for the first stage of composting, as were observed by other researchers [46,70,75]. In the abiotic environment, k value was lower due to a lack of microorganism (sterilization process). O2 consumption rate was only a reason for thermochemical reactions inside easily biodegradable fraction. Hosseini and Aziz [76] confirmed that the increase in temperature in the composting pile results in an increase in the consumption rate at which chemical (hydrogen) bonds in substrate compounds like polysaccharides cellulose and lignocellulose are broken. As suggested by Ma et al. 2020 [77] this biodegradation, is made by complex enzymes and requires the synergistic action of various microorganisms. The same conditions influenced the CO production rate. We confirmed that the threshold value of CO production kinetics, below 40 °C is driven by biotic processes, while above 40 °C by thermochemical. However, the net CO production above 40 °C was limited by the biodegradation of thermochemically produced CO. This is because the optimal temperature for most microorganisms is 38.5 °C, with a maximum from 63 °C to ~67 °C, which, as the authors note, is not in line with the process temperature that we observed during composting in real condition, i.e., 60~70 °C [78]. It can be explained that the change in curvature observed is due to a change in the control regime of the oxidation reaction. Initially, it is governed by the biotic process (with a pseudo-first-order kinetics) until a temperature is reached in which a thermochemical regime governs (with zero-order kinetics). In the presented experiment, the confirmation of this trend was also noticed. In thermophilic conditions >50 °C, the CO2 production was significantly reduced. However, the CO production increased with temperature, which confirms thermochemical nature, independent of microorganisms, at least at high temperatures. This observation is also confirmed with the kinetic model, i.e., <50 °C the best-fit model is 1st-order kinetic, but >50 °C, the best-fit model was a 0-order in both abiotic and biotic conditions (Table A1). This trend can be clearly observed in rO2 consumption and rCO2 production rate present in Figure A1. This information is true for 0- and I-orderkinetics.
Although a higher CO production was observed at temperatures <50 °C, the k and CO production ratewas always lower in abiotic conditions, even in thermophilic conditions, when it was similar for both variants. We also observed that in biotic conditions, where the maximum CO production was at 60 °C, while the maximum k was at 37 °C. Some explanation can be elucidated from the results of Tang et al. [79] and Yu et al. [80], who noted that the k value of organic matter decomposition under thermophilic conditions was ~20% higher than under mesophilic conditions, and the maximum thermophilic composting activity at temperatures in the range of 50~60 °C. This was a result of thermochemical decomposition at high temperatures, as well as the microbial activity. It has been experimentally shown that the rate of microbial activity, as well as the process of hydrolysis, are closely related, and the relationship is as follows—the reaction rate increases in the range of 20 to 40~50 °C, then after exceeding 50 °C begins to decrease rapidly (Figure A1) [74]. This effect is also clearly visible in this experiment and noticed in our previous research carried out on a technical scale [8,71] when the k value was the highest between the 2nd and 4th week of tests at a temperature in a pile is >60 °C.
Chen et al. [81] identified that key factors affecting the emissions of GHGs the most are: organic nitrogen (Org N, 33.0%), DOC (20.5%), TN (14.6%), and TOC (10.2%). They believed that this characteristic of waste properties could also affect CO production. The results of this research create possibilities of predicting CO production during composting of organic waste, which can be useful, for example, to the modeling of CO concentrations and emissions in waste treatment plants [71]. Such modeling will allow the minimization of CO emissions from the process and the simultaneous use of engineering and technological solutions to optimize the decomposition of organic matter. Additionally, it will enable the development of recommendations and implementation of solutions limiting the negative impact of CO on the health of composting plant employees who have direct contact with the process. In the long term, the use of the predictive model to reduce CO emissions from the waste composting process will contribute to reducing air pollution and the associated adverse effects on public health, including the economy. Exposure to harmful compounds in the air is one of the main causes of pulmonary and cardiovascular diseases, resulting in the development of chronic diseases and premature mortality of the population. The reduction of these effects as a result of reducing pollutant emissions is defined as 75–85% of all estimated economic benefits of improving air quality [82]. So, it can be said that functioning in a healthier and cleaner environment will increase the standard of living.
Due to the limited knowledge in composting process CO production, we recommend more studies in this area. There are several pathways to explore, including composting trials with different feedstock, scaling up to larger composting volumes, exploring the influence of environmental stressors, and a more comprehensive assessment of the toxicity of emitted gases. This new data can improve mathematical models and help with the mitigation of CO production during composting and storage of organic waste. Another possibility is the production of CO and its use for the production of biorenewables.

5. Conclusions

For the first time, a full study of the influence of temperature and biowaste sterilization on the kinetics CO production is presented. The experiment showed an increase in CO production and k value with temperature. Depending on the conditions (biotic or abiotic) and the temperature, different CO production processes were observed. In both variants, the CO production increased. However, in the temperature range from 10~50 °C, higher CO production was observed in biotic conditions, suggesting that the biological transformation is responsible for CO formation. Above 50 °C, the CO production was higher under abiotic conditions, suggesting that the thermochemical process was more efficient. Additionally, the constant rate (k) value of CO production under biotic conditions was increasing up to a temperature of 60 °C, above which a slight decrease in CO production rate was observed at 70 °C. The 1st-order model described the CO production in <50 °C range; the 0-order model was better for >50 °C.
These observations indicate that the kinetic process of CO production is both abiotic and biotic. Observation of CO emissions under abiotic conditions indicates the thermochemical nature of CO production. Own previous studies have shown a significant impact of O2 consumption on CO production under both abiotic and biotic conditions. Higher CO emissions under abiotic conditions at >50 °C indicated that microorganisms were metabolizing thermochemically produced CO in the biotic variant. However, in the psychrophilic and mesophilic temperature range (10~40 °C), higher CO production under biotic conditions indicated the presence of CO producing microorganisms. The presented results are the basis for further studies on the possibility of controlling CO production during the biowaste aerobic biostabilization process.

Supplementary Materials

The following are available online at https://www.mdpi.com/1996-1073/13/20/5451/s1, Supplementary Materials CO kinetic.xlsx.

Author Contributions

Conceptualization, A.B., J.A.K.; methodology, A.B., S.S.-D.; validation, A.B., S.S.-D.; formal analysis, A.B., S.S.-D., and J.A.K.; investigation, S.S.-D., K.S.; resources, S.S.-D.; data curation, A.B., S.S.-D., and K.S.; writing—original draft preparation, S.S-D.; writing—review and editing, A.B., S.S.-D., K.S., J.B., and J.A.K.; visualization, S.S.-D., K.S.; supervision, A.B., J.B.; funding acquisition, S.S.-D. All authors have read and agreed to the published version of the manuscript.

Funding

This research was funded by the Ph.D. research program ‘InnowacyjnyDoktorat’(no. D220/0002/17) and financially supported by the Wrocław University of Environmental and Life Sciences. This research was partially supported by the Iowa Agriculture and Home Economics Experiment Station, Ames, Iowa. Project no. IOW05556 (Future Challenges in Animal Production Systems: Seeking Solutions through Focused Facilitation) sponsored by Hatch Act & State of Iowa funds.

Acknowledgments

The presented article results were obtained as part of the activity of the leading research team—Waste and Biomass Valorization Group (WBVG), https://www.upwr.edu.pl/research/50121/waste_and_biomass_valorization_group_wbvg.html.

Conflicts of Interest

The authors declare no conflict of interest.

Appendix A

Figure A1. Average production and consumption rate (rO2) (a) O2 consumption 0-order kinetic, (b) O2 consumption I-order kinetic, (c) CO2 production 0-order kinetic, (d) CO2 production I-order kinetic, (e) CO production 0-order kinetic, (f) CO production 0-order kinetic. The error bars are showing +/− standard deviation around the mean. The kinetic values are shown in Tables S2.1–S2.3 (Supplementary Materials, sheets 4–6).
Energies 13 05451 g0a1
Table A1. Kinetic model of O2 consumption and CO2 and CO used for process estimation (based on average results and R2). The kinetic values are shown in Tables S2.1–S2.3 (Supplementary Materials, sheets 4–6).
Production or ConsumptionTemperature
°C
AbioticBiotic
O210 O 2 = 4.16 · 1 e 0.0064 · t O 2 = 77.92 · 1 e 0.0072 · t
20 O 2 = 19.46 · 1 e 0.0032 · t O 2 = 159.23 · 1 e 0.0067 · t
30 O 2 = 15.93 · 1 e 0.0028 · t O 2 = 174.37 · 1 e 0.0072 · t
37 O 2 = 0.1516 · t O 2 = 0.8277 · t
40 O 2 = 0.0505 · t O 2 = 0.9362 · t
50 O 2 = 0.1606 · t O 2 = 0.7034 · t
60 O 2 = 0.0827 · t O 2 = 0.5207 · t
70 O 2 = 30.61 · 1 e 0.0053 · t O 2 = 25.29 · 1 e 0.0060 · t
CO210 C O 2 = 6.39 · 1 e 0.0060 · t C O 2 = 68.05 · 1 e 0.0071 · t
20 C O 2 = 0.0516 · t C O 2 = 228.41 · 1 e 0.0058 · t
30 C O 2 = 0.0369 · t C O 2 = 610.86 · 1 e 0.0022 · t
37 C O 2 = 0.1975 · t C O 2 = 421.37 · 1 e 0.0032 · t
40 C O 2 = 0.0681 · t C O 2 = 1.2022 · t
50 C O 2 = 0.2410 · t C O 2 = 1049.7 · 1 e 0.0010 · t
60 C O 2 = 0.1232 · t C O 2 = 0.6782 · t
70 C O 2 = 35.51 · 1 e 0.0050 · t C O 2 = 42.58 · 1 e 0.0064 · t
CO10 C O = 13.04 · 1 e 0.0053 · t C O = 21.09 · 1 e 0.0097 · t
20 C O = 30.08 · 1 e 0.0138 · t C O = 25.62 · 1 e 0.0214 · t
30 C O = 28.36 · 1 e 0.0057 · t C O = 22.14 · 1 e 0.194 · t
37 C O = 95.57 · 1 e 0.0038 · t C O = 32.32 · 1 e 0.0312 · t
40 C O = 0.1608 · t C O = 48.28 · 1 e 0.0204 · t
50 C O = 77.48 · 1 e 0.0088 · t C O = 95.64 · 1 e 0.0098 · t
60 C O = 0.7194 · t C O = 0.9047 · t
70 C O = 0.7563 · t C O = 0.4543 · t

References

  1. Techtmann, S.M.; Colman, A.S.; Robb, F.T. That which does not kill us only makes us stronger: The role of carbon monoxide in thermophilic microbial consortia. Environ. Microbiol. 2009, 11, 1027–1037. [Google Scholar] [CrossRef]
  2. Ahmad Farid, M.A.; Hassan, M.A.; Roslan, A.M.; Samsudin, M.H.; Mohamad, Z.J.J.; Othman, M.R.; Shirai, Y. Carbon monoxide reduction in the flue gas during biochar production from oil palm empty fruit bunch. J. Clean. Prod. 2020, 258, 120580. [Google Scholar] [CrossRef]
  3. Haarstad, K.; Bergersen, O.; Sorheim, R. Occurrence of carbon monoxide during organic waste degradation. J. Air Waste Manag. Assoc. 2006, 56, 575–580. [Google Scholar] [CrossRef] [PubMed] [Green Version]
  4. Stegenta-Dąbrowska, S.; Drabczyński, G.; Sobieraj, K.; Koziel, J.A.; Białowiec, A. The biotic and abiotic carbon monoxide formation during aerobic co-digestion of dairy cattle manure with green waste and sawdust. Front. Bioeng. Biotechnol. 2019, 7, 283. [Google Scholar] [CrossRef] [PubMed]
  5. Hellebrand, H.J.; Kalk, W.D. Emission of carbon monoxide during composting of dung and green waste. Nutr. Cycl. Agroecosyst. 2001, 60, 79–82. [Google Scholar] [CrossRef]
  6. Stegenta, S.; Dębowski, M.; Bukowski, P.; Randerson, P.F.; Białowiec, A. The influence of perforation of foil reactors on greenhouse gas emission rates during aerobic biostabilization of the undersize fraction of municipal wastes. J. Environ. Manag. 2018, 207, 355. [Google Scholar] [CrossRef]
  7. Hellebrand, H.J. Emission of nitrous oxide and other trace gases during composting of grass and green waste. J. Agric. Eng. Res. 1998, 69, 365–375. [Google Scholar] [CrossRef] [Green Version]
  8. Boldrin, A.; Andersen, J.K.; Moller, J.; Christensen, T.H.; Favoino, E. Composting and compost utilization: Accounting of greenhouse gases and global warming contributions. Waste Manag. Res. 2009, 27, 800–812. [Google Scholar] [CrossRef] [Green Version]
  9. Cayuela, M.L.; Sanchez-Monedero, M.A.; Roig, A.; Sinicco, T.; Mondini, C.; Luz Cayuela, M.; Angel Sanchez-Monedero, M.; Roig, A.; Sinicco, T.; Mondini, C. Biochemical changes and GHG emissions during composting of lignocellulosic residues with different N-rich by-products. Chemosphere 2012, 88, 196–203. [Google Scholar] [CrossRef]
  10. Colon, J.; Cadena, E.; Pognani, M.; Barrena, R.; Sanchez, A.; Font, X.; Artola, A. Determination of the energy and environmental burdens associated with the biological treatment of source-separated Municipal Solid Wastes. Energy Environ. Sci. 2012, 5, 5731–5741. [Google Scholar] [CrossRef] [Green Version]
  11. Ermolaev, E.; Pell, M.; Smårs, S.; Sundberg, C.; Jönsson, H.; Smars, S.; Sundberg, C.; Jonsson, H. Greenhouse gas emission from covered windrow composting with controlled ventilation. Waste Manag. Res. 2012, 30, 155–160. [Google Scholar] [CrossRef] [PubMed]
  12. Daou, A.; Mallat, C.; Chammas, G.; Cerantola, N.; Kayed, S.; Saliba, N.A. The Ecocanvas as a business model canvas for a circular economy. J. Clean. Prod. 2020, 258, 120938. [Google Scholar] [CrossRef]
  13. Sironi, S.; Botta, D. Biofilter efficiency in odor abatement at composting plants. Compost Sci. Util. 2001, 9, 149–155. [Google Scholar] [CrossRef]
  14. Stegenta, S.; Sobieraj, K.; Pilarski, G.; Koziel, J.; Białowiec, A. The spatial and temporal distribution of process gases within the biowaste compost. Data 2019, 4, 37. [Google Scholar] [CrossRef] [Green Version]
  15. Szanto, G.L.; Hamelers, H.M.; Rulkens, W.H.; Veeken, A.H.M. NH3, N2O and CH4 emissions during passively aerated composting of straw-rich pig manure. Bioresour. Technol. 2007, 98, 2659–2670. [Google Scholar] [CrossRef] [PubMed]
  16. Clemens, J.; Cuhls, C. Greenhouse gas emissions from mechanical and biological waste treatment of municipal waste. Environ. Technol. 2003, 24, 745–754. [Google Scholar] [CrossRef] [PubMed]
  17. Amlinger, F.; Peyr, S.; Cuhls, C. Green house gas emissions from composting and mechanical biological treatment. Waste Manag. Res. 2008, 26, 47–60. [Google Scholar] [CrossRef]
  18. Boldrin, A.; Andersen, J.K.; Christensen, T.H. Environmental assessment of garden waste management in the Municipality of Aarhus, Denmark. Waste Manag. 2011, 31, 1560–1569. [Google Scholar] [CrossRef] [Green Version]
  19. Hellebrand, H.; Schade, G.W.; Idler, C.; Kern, J. Carbon monoxide from composting due to thermal oxidation of biomass: An additional pathway for co in agricultural and forest ecosystems. In Proceedings of the Workshop on Agricultural Air Quality: State of the Science, Potomac, MA, USA, 4–8 June 2006; pp. 693–705. [Google Scholar]
  20. Conrad, R.; Seiler, W. Role of microorganisms in the consumption and production of atmospheric carbon monoxide by soil. Appl. Environ. Microbiol. 1980, 40, 437–445. [Google Scholar] [CrossRef] [Green Version]
  21. Zepp, R.G.; Miller, W.L.; Tarr, M.A.; Burke, R.A.; Stocks, B.J. Soil-atmosphere fluxes of carbon monoxide during early stages of postfire succession in upland Canadian boreal forests. J. Geophys. Res. Atmos. 1997, 102, 29301–29311. [Google Scholar] [CrossRef]
  22. Fraser, W.T.; Blei, E.; Fry, S.C.; Newman, M.F.; Reay, D.S.; Smith, K.A.; McLeod, A.R. Emission of methane, carbon monoxide, carbon dioxide and short-chain hydrocarbons from vegetation foliage under ultraviolet irradiation. Plant Cell Environ. 2015, 38, 980–989. [Google Scholar] [CrossRef] [PubMed] [Green Version]
  23. van Asperen, H.; Warneke, T.; Sabbatini, S.; Nicolini, G.; Papale, D.; Notholt, J. The role of photo- and thermal degradation for CO2 and CO fluxes in an arid ecosystem. Biogeosciences 2015, 12, 4161–4174. [Google Scholar] [CrossRef]
  24. Rich, J.J.; King, G.M. Carbon monoxide consumption and production by wetland peats. FEMS Microbiol. Ecol. 1999, 28, 215–224. [Google Scholar] [CrossRef]
  25. Goldstein, J.; Goldstein, N. Controlling odors at composting facilities. Biocycle 2005, 46, 22. [Google Scholar]
  26. Bünger, J.; Schappler-Scheele, B.; Hilgers, R.; Hallier, E. A 5-year follow-up study on respiratory disorders and lung function in workers exposed to organic dust from composting plants. Int. Arch. Occup. Environ. Health 2007, 80, 306–312. [Google Scholar] [CrossRef] [PubMed]
  27. Herr, C.E.W.; Nieden, A.; Seitz, H.; Harpel, S.; Stinner, D.; Stilianakis, N.; Eikmann, T. Bioaerosols in outdoor air—Statement of environmental medical assessment criteria on the basis of an epidemiological cross sectional study. Gefahrst. Reinhalt. Luft 2004, 64, 143–152. [Google Scholar]
  28. Müller, T.; Jörres, R.; Scharrer, E.; Hessel, H.; Nowak, D.; Radon, K. Acute blood neutrophilia induced by short-term compost dust exposure in previously unexposed healthy individuals. Int. Arch. Occup. Environ. Health 2006, 79, 477–482. [Google Scholar] [CrossRef] [PubMed]
  29. Müller, T.; Thissen, R.; Braun, S.; Dott, W.; Fischer, G. (M)VOC and composting facilities—Part 2: (M)VOC dispersal in the environment. Environ. Sci. Pollut. Res. Int. 2004, 11, 152. [Google Scholar] [CrossRef]
  30. Koskela, R.S.; Mutanen, P.; Sorsa, J.; Klockars, M. Factors predictive of ischemic heart disease mortality in foundry workers exposed to carbon monoxide. Am. J. Epidemiol. 2000, 152, 628–632. [Google Scholar] [CrossRef] [Green Version]
  31. Pikoń, K.; Rejman, R. Carbon cycle in municipal solid waste managements. Arch. Gospod. Odpad. 2009, 11, 27–46. [Google Scholar]
  32. Eaton, A.D.; Clesceri, L.S.; Greenberg, A.E.; Franson, M.A.H. Standard Methods for the Examination of Water and Wastewater; American Public Health Association: Washington, DC, USA, 1998. [Google Scholar]
  33. Yu, Q.; Li, H. Moderate separation of household kitchen waste towards global optimization of municipal solid waste management. J. Clean. Prod. 2020, 277, 123330. [Google Scholar] [CrossRef]
  34. Binner, E.; Bohm, K.; Lechner, P. Large scale study on measurement of respiration activity (AT(4)) by Sapromat and OxiTop. Waste Manag. 2012, 32, 1752–1759. [Google Scholar] [CrossRef] [PubMed]
  35. Kilian, E.; Macedowska-Capiga, A. Parametr AT4 jako wskaźnik stopnia stabilizacji odpadów po mechaniczno-biologicznym przetworzeniu (AT4 parameter as an indicator of the degree of stabilization of waste after mechanical and biological treatment). Pr. Inst. Ceram. Mater. Bud. 2011, 4, 88–94. [Google Scholar]
  36. Stegenta, S.; Kałdun, B.; Białowiec, A. Model selection and estimation of kinetic parameters of oxygen consumption during biostabilization of under-size fraction of municipal solid waste. Rocz. Ochr. Sr. 2016, 18, 800–814. [Google Scholar]
  37. Burnham, K.P.; Anderson, D.R.; Burnham, K.P. Model Selection and Multimodel Inference: A Practical Information-Theoretic Approach; Springer: Berlin/Heidelberg, Germany, 2002. [Google Scholar]
  38. Jiang, T.; Schuchardt, F.; Li, G.; Guo, R.; Zhao, Y. Effect of C/N ratio, aeration rate and moisture content on ammonia and greenhouse gas emission during the composting. J. Environ. Sci. 2011, 23, 1754–1760. [Google Scholar] [CrossRef]
  39. Fukumoto, Y.; Suzuki, K.; Kuroda, K.; Waki, M.; Yasuda, T. Effects of struvite formation and nitratation promotion on nitrogenous emissions such as NH3, N2O and NO during swine manure composting. Bioresour. Technol. 2011, 102, 1468–1474. [Google Scholar] [CrossRef]
  40. Albrecht, R.; Joffre, R.; Gros, R.; Le Petit, J.; Terrom, G.; Perissol, C. Efficiency of near-infrared reflectance spectroscopy to assess and predict the stage of transformation of organic matter in the composting process. Bioresour. Technol. 2008, 99, 448–455. [Google Scholar] [CrossRef]
  41. Dach, J. Kompostowanie trawy i liści (Grass and leaves composting). Przegląd Komunal. 2008, 10, 36–39. [Google Scholar]
  42. Kumar, M.; Ou, Y.; Lin, J. Co-composting of green waste and food waste at low C/N ratio. Waste Manag. 2010, 30, 602–609. [Google Scholar] [CrossRef]
  43. Adhikari, B.K.; Trémier, A.; Barrington, S.; Martinez, J. Biodegradability of municipal organic waste: A respirometric test. Waste Biomass. Valor. 2013, 4, 331–340. [Google Scholar] [CrossRef]
  44. Sun, W.; Huang, G.H.; Zeng, G.; Qin, X.; Sun, X. A stepwise-cluster microbial biomass inference model in food waste composting. Waste Manag. 2009, 29, 2956–2968. [Google Scholar] [CrossRef] [PubMed]
  45. Mason, I.G. Mathematical modelling of the composting process: A review. Waste Manag. 2006, 26, 3–21. [Google Scholar] [CrossRef] [PubMed]
  46. Sobieraj, K.; Stegenta, S.; Białowiec, A. The use of respiration activity method for predicting easily biodegradable fractions in organic waste. Przem. Chem. 2017, 96. [Google Scholar] [CrossRef]
  47. Wetzel, S.; Volpe, S.; Damianopoulos, J.; Krigstin, S. Can biomass quality be preserved through tarping comminuted roadside biomass piles? Forests 2017, 8, 305. [Google Scholar] [CrossRef] [Green Version]
  48. de Guardia, A.; Petiot, C.; Rogeau, D.; Druilhe, C. Influence of aeration rate on nitrogen dynamics during composting. Waste Manag. 2008, 28, 575–587. [Google Scholar] [CrossRef]
  49. Mason, I.G.; Milke, M.W. Physical modelling of the composting environment: A review. Part 1: Reactor systems. Waste Manag. 2005, 25, 481–500. [Google Scholar] [CrossRef]
  50. Evangelou, A.; Calabrò, P.S.; Greco, R.; Sánchez, A.; Komilis, D. Biodegradation activity of eight organic substrates: A correlation study of different test methods. Waste Biomass. Valor. 2016, 7, 1067–1080. [Google Scholar] [CrossRef] [Green Version]
  51. Barrena, R.; d’Imporzano, G.; Ponsa, S.; Gea, T.; Artola, A.; Vazquez, F.; Sanchez, A.; Adani, F. In search of a reliable technique for the determination of the biological stability of the organic matter in the mechanical-biological treated waste. J. Hazard. Mater. 2009, 162, 1065–1072. [Google Scholar] [CrossRef] [Green Version]
  52. Sadecka, Z.; Suchowska-Kisielewicz, M. The possibility of using organic substrates in the fermentation process. Rocz. Ochr. Sr. 2016, 18, 400–413. [Google Scholar]
  53. Manu, M.K.; Kumar, R.; Garg, A. drum composting of food waste: A kinetic study. Procedia Environ. Sci. 2016, 35, 456–463. [Google Scholar] [CrossRef]
  54. Fernandez, F.J.; Sanchez-Arias, V.; Villasenor, J.; Rodriguez, L. Evaluation of carbon degradation during co-composting of exhausted grape marc with different biowastes. Chemosphere 2008, 73, 670–677. [Google Scholar] [CrossRef] [PubMed]
  55. Kuwahara, F.; Sano, Y.; Nakayama, A.; Nakasaki, K.; Fukazawa, T. Numerical modeling of a composting process with aeration. J. Porous Media 2009, 12, 927–938. [Google Scholar] [CrossRef]
  56. Ermolaev, E.; Sundberg, C.; Pell, M.; Smårs, S.; Jönsson, H. Effects of moisture on emissions of methane, nitrous oxide and carbon dioxide from food and garden waste composting. J. Clean Prod. 2019, 240, 118165. [Google Scholar] [CrossRef]
  57. Beck-Friis, B.; Smårs, S.; Jönsson, H.; Eklind, Y.; Kirchmann, H. Composting of source-separated household organics at different oxygen levels: Gaining an understanding of the emission dynamics. Compost Sci. Util. 2003, 11, 41–50. [Google Scholar] [CrossRef]
  58. Nasini, L.; De Luca, G.; Ricci, A.; Ortolani, F.; Caselli, A.; Massaccesi, L.; Regni, L.; Gigliotti, G.; Proietti, P. Gas emissions during olive mill waste composting under static pile conditions. Int. Biodeterior. Biodegrad. 2016, 107, 70–76. [Google Scholar] [CrossRef]
  59. Hao, J.; Wang, H. Volatile fatty acids productions by mesophilic and thermophilic sludge fermentation: Biological responses to fermentation temperature. Bioresour. Technol. 2015, 175, 367–373. [Google Scholar] [CrossRef] [PubMed]
  60. Sommer, S.G.; Moller, H.B. Emission of greenhouse gases during composting of deep litter from pig production—effect of straw content. J. Agric. Sci. 2000, 134, 327–335. [Google Scholar] [CrossRef] [Green Version]
  61. Kulcu, R.; Yaldiz, O. Effects of air flow directions on composting process temperature profile. Waste Manag. 2008, 28, 1766–1772. [Google Scholar] [CrossRef]
  62. Sun, X.; Ma, S.; Han, L.; Li, R.; Schlick, U.; Chen, P.; Huang, G. The effect of a semi-permeable membrane-covered composting system on greenhouse gas and ammonia emissions in the Tibetan Plateau. J. Clean Prod. 2018, 204, 778–787. [Google Scholar] [CrossRef]
  63. Puyuelo, B.; Gea, T.; Sánchez, A. A new control strategy for the composting process based on the oxygen uptake rate. Chem. Eng. J. 2010, 165, 161–169. [Google Scholar] [CrossRef] [Green Version]
  64. Stegenta, S.; Sobieraj, K.; Pilarski, G.; Koziel, J.A.; Białowiec, A. Analysis of the spatial and temporal distribution of process gases within municipal biowaste compost. Sustainability 2019, 11, 2340. [Google Scholar] [CrossRef] [Green Version]
  65. Awasthi, S.K.; Sarsaiya, S.; Awasthi, M.K.; Liu, T.; Zhao, J.; Kumar, S.; Zhang, Z. Changes in global trends in food waste composting: Research challenges and opportunities. Bioresour. Technol. 2020, 299, 122555. [Google Scholar] [CrossRef]
  66. Li, Y.; Li, W.; Wu, C.; Wang, K. New insights into the interactions between carbon dioxide and ammonia emissions during sewage sludge composting. Bioresour. Technol. 2013, 136, 385–393. [Google Scholar] [CrossRef]
  67. Vasiliadou, I.A.; Muktadirul Bari Chowdhury, A.K.M.; Akratos, C.S.; Tekerlekopoulou, A.G.; Pavlou, S.; Vayenas, D.V. Mathematical modeling of olive mill waste composting process. Waste Manag. 2015, 43, 61–71. [Google Scholar] [CrossRef] [PubMed]
  68. Tatano, F.; Pagliaro, G.; Di Giovanni, P.; Floriani, E.; Mangani, F. Biowaste home composting: Experimental process monitoring and quality control. Waste Manag. 2015, 38, 72–85. [Google Scholar] [CrossRef] [PubMed]
  69. Petric, I.; Helić, A.; Avdić, E.A. Evolution of process parameters and determination of kinetics for co-composting of organic fraction of municipal solid waste with poultry manure. Bioresour. Technol. 2012, 117, 107–116. [Google Scholar] [CrossRef]
  70. Ge, J.; Huang, G.; Huang, J.; Zeng, J.; Han, L. Mechanism and kinetics of organic matter degradation based on particle structure variation during pig manure aerobic composting. J. Hazard Mater. 2015, 292, 19–26. [Google Scholar] [CrossRef]
  71. Siles-Castellano, A.B.; López, M.J.; Jurado, M.M.; Suárez-Estrella, F.; López-González, J.A.; Estrella-González, M.J.; Moreno, J. Industrial composting of low carbon/nitrogen ratio mixtures of agri-food waste and impact on compost quality. Bioresour. Technol. 2020, 316, 123946. [Google Scholar] [CrossRef]
  72. Paillat, J.-M.; Robin, P.; Hassouna, M.; Leterme, P. Predicting ammonia and carbon dioxide emissions from carbon and nitrogen biodegradability during animal waste composting. Atmos. Environ. 2005, 39, 6833–6842. [Google Scholar] [CrossRef] [Green Version]
  73. Wu, C.; Li, W.; Wang, K.; Li, Y. Usage of pumice as bulking agent in sewage sludge composting. Bioresour. Technol. 2015, 190, 516–521. [Google Scholar] [CrossRef]
  74. Tosun, I.; Gonullu, M.T.; Arslankaya, E.; Gunay, A. Co-composting kinetics of rose processing waste with OFMSW. Bioresour. Technol. 2008, 99, 6143–6149. [Google Scholar] [CrossRef] [PubMed]
  75. Shao, L.; Wang, T.; Li, T.; Lü, F.; He, P. Comparison of sludge digestion under aerobic and anaerobic conditions with a focus on the degradation of proteins at mesophilic temperature. Bioresour. Technol. 2013, 140, 131–137. [Google Scholar] [CrossRef]
  76. Hosseini, S.M.; Aziz, H.A. Evaluation of thermochemical pretreatment and continuous thermophilic condition in rice straw composting process enhancement. Bioresour. Technol. 2013, 133, 240–247. [Google Scholar] [CrossRef] [PubMed]
  77. Ma, C.; Lo, P.K.; Xu, J.; Li, M.; Jiang, Z.; Li, G.; Zhu, Q.; Li, X.; Leong, S.Y.; Li, Q. Molecular mechanisms underlying lignocellulose degradation and antibiotic resistance genes removal revealed via metagenomics analysis duringdifferent agricultural wastes composting. Bioresour. Technol. 2020, 314, 123731. [Google Scholar] [CrossRef] [PubMed]
  78. Tremier, A.; De Guardia, A.; Massiani, C.; Martel, J.L. Influence of the airflow rate on heat and mass transfers during sewage sludge and bulking agent composting. Environ. Technol. 2005, 26, 1137–1149. [Google Scholar] [CrossRef]
  79. Tang, J.C.; Shibata, A.; Zhou, Q.; Katayama, A. Effect of temperature on reaction rate and microbial community in composting of cattle manure with rice straw. J. Biosci. Bioeng. 2007, 104, 321–328. [Google Scholar] [CrossRef] [PubMed]
  80. Yu, S.H.; Clark, O.G.; Leonard, J.J. Influence of free air space on microbial kinetics in passively aerated compost. Bioresour. Technol. 2009, 100, 782–790. [Google Scholar] [CrossRef]
  81. Chen, M.; Huang, Y.; Liu, H.; Xie, S.; Abbas, F. Impact of different nitrogen source on the compost quality and greenhouse gas emissions during composting of garden waste. Process Saf. Environ. Prot. 2019, 124, 326–335. [Google Scholar] [CrossRef]
  82. Burtraw, D.; Toman, M. The Benefits of Reduced Air Pollutants in the U.S. from Greenhouse Gas Mitigation Policies; Discussion Paper 98-01-REV; University of Minnesota: St. Paul, MN, USA, 1997; p. 10496. [Google Scholar] [CrossRef]
Figure 1. Scheme of the experimental set-up.
Energies 13 05451 g001
Figure 2. (a) Moisture content in biowaste (Mix—before the experiment) and residual biowaste after biowaste aerobic biostabilization under biotic and abiotic conditions under different thermal conditions,(b) volatile solids content in biowaste (Mix—before the experiment); letters and symbols (a, b, c, d, *, +, #) indicate homogeneity group according to Tukey’stest at significance level p < 0.05 (abiotic and biotic variant, respectively). The error bars are showing +/− standard deviation around the mean.
Energies 13 05451 g002
Figure 3. The respiration activity (AT0) of substrates (N = 3) and waste mix (N = 2); (a) grass, (b) manure, (c) mixture (different lines on figures mean repetitions).
Energies 13 05451 g003
Figure 4. Cumulative O2 consumption depending on the temperature under abiotic and biotic conditions under different fixed temperatures (a) 10 °C, (b) 20 °C, (c) 30 °C, (d) 37 °C, (e) 40 °C, (f) 50 °C, (g) 60 °C, (h) 70 °C.The error bars are showing +/− standard deviation around the mean. Raw data are shown in Tables S1.1 and S1.2 (Supplementary Materials, sheet 1). The kinetic values are shown in Table S2.1 (Supplementary Materials, sheet 4). Equations used in figures are shown in Table A1. The Tukey test p < 0.05 are shown in Tables S3.1–S3.28 (Supplementary Materials, sheet 6).
Energies 13 05451 g004
Figure 5. Cumulative CO2 production depending on the temperature under abiotic and biotic conditions under different fixed temperatures (a) 10 °C, (b) 20 °C, (c) 30 °C, (d) 37 °C, (e) 40 °C, (f) 50 °C, (g) 60 °C, (h) 70 °C. The error bars are showing +/− standard deviation around the mean. Raw data are shown in Tables S1.3 and S1.4 (Supplementary Materials, sheet 2). The kinetic values are shown in Table S2.2 (Supplementary Materials, sheet 5). Equations used in figures are shown in Table A1. The Tukey test p < 0.05 are shown in Tables S3.29–S3.56 (Supplementary Materials, sheet 8).
Energies 13 05451 g005
Figure 6. Cumulative CO production depending on the temperature under abiotic and biotic conditions under different fixed temperatures (a) 10 °C, (b) 20 °C, (c) 30 °C, (d) 37 °C, (e) 40 °C, (f) 50 °C, (g) 60 °C, (h) 70 °C. The error bars are showing +/− standard deviation around the mean. Raw data are shown in Tables S1.5 and S1.51 (Supplementary Materials, sheet 3). The kinetic values are shown in Table S2.3 (Supplementary Materials, sheet 6). Equations used in figures are shown in Table A1. The Tukey test p < 0.05 are shown in Tables S3.57–S3.84 (Supplementary Materials, sheet 9).
Energies 13 05451 g006
Table 1. The kinetic parameters of respiration activity for grass, manure, and biowaste mixture (shown in Figure 3).
MaterialRepetitionAT4krR2
(mg O2·g d.m.−1)Mean ± SD(h−1)Mean ± SD(mg O2·g d.m.−1·h−1)Mean ± SD-
Grass1167.92188.11 ± 17.90.03920.0432 ± 0.0066.57518.1500 ± 1.610.9642
2194.590.05039.79580.9675
3201.830.04008.07920.9898
Manure1190.74140.63 ± 44.30.00820.0136 ± 0.0061.57071.7558 ± 0.280.9959
2124.440.01301.61920.9897
3106.700.01952.07750.9787
Mixture167.8667.50 ± 0.50.02670.0263 ± 0.0011.81381.7762 ± 0.050.9763
267.150.02591.73850.9648
Publisher’s Note: MDPI stays neutral with regard to jurisdictional claims in published maps and institutional affiliations.

