1. Introduction
The secure and efficient use of electricity represents a major aspect of the social and economic development of a country. Electricity losses happen during power generation, transmission and delivery to consumers. Essentially, power transmission and delivery have a couple of losses, namely, technical losses (TL) and nontechnical losses (NTL) [
1]. TL occur due to the line losses, transformer losses and other power system elements. NTL occur due to the electricity stealing, defective meters, overdue bills and billing mistakes [
1]. More generally, NTL are the difference between total losses and TL. Besides, NTL raise electricity prices, increase load-shedding, decrease revenue and decrease energy efficiency. Thus, NTL badly affect both the utilities and a country’s financial state [
2,
3].
Electricity fraud is one of the chief reasons for the NTL, which accounts for 10–40% of cumulative electricity losses worldwide [
4]. Electricity theft comprises of bypassing electricity meters, tampering with meter readings, tampering with meters themselves and cyber-attacks [
5,
6]. Therefore, the reduction of electricity fraud is a principal concern of the power distribution companies to secure significant amounts of the total electricity losses and revenue [
7].
Electricity theft is spreading widely in many developing countries—e.g., India loses 20% of its total electricity due to electricity theft [
8], and developed countries. For instance, in the U.S., the revenue loss as a result of electricity fraud is about
$6 billion, while in the UK, it costs up to £175 million per annum [
9,
10]. Moreover, it is stated in [
11] that electricity theft accounts for approximately a hundred million Canadian dollars annually. Globally, the utilities lose more than
$20 billion per annum through electricity fraud [
12].
The introduction of advanced metering infrastructure (AMI) in the smart grid environment provides a massive amount of power consumption users’ records, which makes it easier for utilities to monitor the electricity theft [
13,
14]. AMI enables price and load forecasting [
15,
16], energy management [
17,
18] and consumer behavior characterization [
19]. As electricity theft continues to increase, smart meters enable utilities to provide new and innovative solutions to perform electricity theft detection (ETD). Generally, electricity thieves can alter the smart meters’ information physically or through cyber-attacks. Consequently, the primary way of ETD is manually examining the consumers’ electricity meters and comparing the abnormal consumption readings with the previous normal ones, known as the audit and on-site inspection process. However, these methods are costly, inefficient and time-consuming.
In contrast to the manual methods, supervised machine learning solutions have gained the interest of utilities and academia for performing ETD. Studies based on the supervised learning techniques [
20,
21,
22,
23,
24,
25] focus on ETD using the large and imbalanced datasets obtained through the smart meters. However, the performances of these techniques are still not sufficient for the practical applications in utilities. that implies that the techniques raise misclassification scores that lead to the costly procedure of on-site inspections for the final verifications. Therefore, that exhibits the need for a new solution to solve the ETD problem using a large imbalanced dataset to determine the real assessment of the model’s performance.
In ETD literature, the proposed methods are categorized into two major groups: ETD through technical methods and ETD through nontechnical methods. Nontechnical methods cover: the auditing and inspection of illegal electricity consumers, giving awareness to the electricity consumers about electricity theft as a crime and punishment, installing the smart meters that can not be easily tampered with by consumers and reducing electricity theft through the psychosocial methods, such as social support [
26]. Technical methods are also broadly classified into three types: state-based solutions (also known as hardware-based solutions), game-theory-based solutions and data-driven solutions (also known as machine learning-based solutions) [
12].
In hardware-based solutions, the major focus is on designing specific hardware devices and infrastructures to detect electricity theft. Hardware-based solutions consist of: smart meters with radio-frequency identification tags (RFID), anti-tampering sensors, wireless sensors and distribution transformers [
5,
27,
28,
29]. These solutions get high detection efficiency through specific devices, for instance, RFID. The major limitations of the state-based solutions are the high cost of design, the high operational and maintenance costs and the vulnerability to weather conditions. Particularly, due to the inefficiency and high cost of hardware-based solutions, data-driven solutions have gained the interest of researchers. In game-theory-based solutions [
30,
31], ETD is considered as a contest between the power distribution company and electricity fraudsters, known as the players. Both players want to maximize their utility functions. These solutions are low cost and provide reasonable ways to find the electricity theft. Hence, one of the complicated issues in the game-theory-based procedures is how to form the utility function for each player, which is a challenging and time-consuming problem.
Recently, machine learning approaches have achieved significant importance in ETD. The main purpose of these solutions is to analyze the electricity usage behavior of the consumers based on smart meters’ data. These methods require no additional information about the network topology or hardware devices. Thus, machine learning solutions are further categorized into the supervised and unsupervised learning methods. Unsupervised learning methods have proposed clustering-based solutions to group the similar instances into one cluster [
32,
33], members of which each have a high false positive rate (FPR). In this paper, a unique supervised learning-based solution, namely, the LSTM–UNet–Adaboost, is proposed to perform the binary classification using the data from on-site inspections. Thus, we describe some recent advances made in this area.
Buzau et al. [
34] presented a solution that is based on an extreme gradient boosted tree (XGBoost) for the detection of NTL in smart grids. Their main objective was to rank the list of consumers applying the smart meters’ data and extract features from auxiliary databases. Punmiya et al. [
35] introduced a gradient boosting theft detector (GBTD) model, which is composed of three variants of a gradient boosting classifier to perform the ETD. A theft detector is also used for feature engineering-based preprocessing through the GBTD’s feature importance function. Another solution based on the ensemble bagged tree is presented in [
21] for the NTL detection, in which an ensemble of individual decision trees is applied to improve the theft detection by aggregating their performances. Buzau et al. [
23] submit a hybrid of LSTM and multilayer perceptron (MLP), termed LSTM-MLP, for the NTL detection in the smart grid. LSTM is employed to automate the feature extraction from sequential information, while MLP is used to deal with non-sequential information. Likewise, the authors [
36] used a deep neural network for the feature extraction and meta-heuristic technique enabled XGBoost for ETD.
Nelson et al. [
24] combined the maximal overlap discrete wavelet packet transform (MODWPT) with the random under-sampling boosting (RUSBoost) technique to obtain the most suitable features for the identification of NTL. Li et al. [
37] used a semi-supervised technique to perform the detection of NTL. Tianyu et al. [
38] made a semi-supervised deep learning model, known as the multitask feature extracting fraud detector (MFEFD), for ETD: both the supervised and unsupervised learning procedures are combined to capture important features from the labeled and unlabeled data. Maamar et al. [
32] offered a hybrid model that utilizes the k-means clustering procedure and deep neural networks (DNN) for ETD in the AMI system, where k-means is utilized to gather consumers having the same electricity consumption behaviors, and DNN is used to detect anomalies in the electricity consumption behaviors of the consumers. Ghasemi et al. [
26] proposed a solution comprising of a probabilistic neural network and mathematical model, named the PNN–Levenberg–Marquardt, for the identification of two types of illegal consumers using the observer’s meters. PNN is applied to detect the suspicious consumers, and the Levenberg–Marquardt is practiced for classifying the fraud consumers. In [
9], a theft detector is presented, which implements the support vector machine (SVM) for the detection of normal and abnormal consumers using their consumption patterns. Another work [
39] proposed a combined data sampling mechanism and performs ETD through the bi-directional gated recurrent unit (GRU).
In recent years, the convolutional neural network (CNN) has achieved success in ETD because it is a deep learning technique that catches high-level features from the electricity consumption dataset. Authors in [
20] presented a hybrid wide and deep convolutional neural network (WD-CNN) for ETD. The wide part is used to extract the global features from 1-D data, while the deep component is applied to derive periodicity and non-periodicity from 2-D data. Li et al. [
40] introduce a hybrid of CNN and random forest (RF), known as the CNN-RF model, for ETD in smart grids, where the RF is used as the final layer to perform ETD on the extracted features. Hasan et al. [
22] made a solution consisting of the hybrid of CNN and LSTM for ETD. LSTM is used to solve the binary classification problem using CNN’s output. In another study [
41], the authors introduced a hybrid of CNN and GRU for the detection of abnormal consumers. However, CNN only looks for “what” information is available in the data through down-sampling while ignoring “where” this information is present, which degrades the ETD’s performance. Moreover, in the traditional CNN, final classification is performed through either softmax classifier or sigmoid function that leads to the degradation of generalization ability plus subjecting the model to the local optima.
The aforementioned techniques for ETD are innovative and efficient; however, their performances are inadequate for real practices. Generally, these techniques have several limitations that must be addressed as follows: a model’s bias towards the majority class due to the class imbalance; a model’s performance evaluated on synthetic data does not provide a realistic assessment of the theft detection; models require artificial feature extraction and have poor detection performances, such as low detection scores and high misclassification scores. Hence, this detection score is costly for the utilities, e.g., on-site inspections needed for the confirmation. Thus, the problem of ETD is not fixed completely, which implies a new solution that provides a more accurate theft detection score.
To overcome the limitations of previous studies, we propose a new combined LSTM–UNet–Adaboost solution for ETD in this paper. The prime intention behind the proposed solution is to perform the binary classification over the electricity consumption data to characterize the consumers as either benign or thieves. As compared to the above-mentioned studies, our proposed scheme distinguishes itself: by presenting a new class balancing technique IQMOT to overcome the limitations of class imbalance by implementing a UNet technique to automate the feature extraction that captures both “what” and “where” from the 2-D data rather than only “what”, and by performing the joint training and classification through Adaboost using the features extracted from UNet and LSTM. In this regard, the proposed model gets the advantages of two powerful approaches known as deep learning and ensemble learning. Deep learning is applied to automate the feature extraction, while ensemble learning is used to perform the joint training and classification.
To address the above-mentioned problems, this paper proposes a new and practical solution for ETD utilizing long short-term memory (LSTM), UNet and adaptive boosting (Adaboost), named LSTM–UNet–Adaboost. Moreover, a novel class balancing technique, namely, the interquartile minority oversampling technique (IQMOT), is introduced to address the class imbalance issues. In the proposed methodology, real-world electricity theft cases are initially generated using the IQMOT. Then, it solves the ETD problem using the LSTM–UNet–Adaboost model. Essentially, LSTM is used to capture the daily temporal correlations, while a UNet model is applied to capture the abstract features from 2-D electricity consumption data. Finally, the Adaboost model is used to perform the joint training and classification over the extracted features through LSTM and UNet modules. The proposed methodology automates the concept of feature engineering, known as self-learning. Hence, the underlying intuition of this paper is to generate real-world theft cases through a novel sampling technique and to combine a deep learning technique with ensemble learning to improve the theft detection performance. Therefore, the proposed solution is more efficient and reliable as compared to the conventional approaches.
Thus, the chief contributions of this work are described as follows.
IQMOT: A novel class balancing technique, named IQMOT, is presented in this paper to overcome the problems of imbalanced data. It generates more practical theft cases as compared to the traditional class balancing techniques.
LSTM–UNet–Adaboost: We propose a new combined LSTM–UNet–Adaboost model for ETD. The proposed model leverages the advantages of the most recent deep learning technique, i.e., UNet, which is applied for very first time in ETD along with the ensemble learning technique, i.e., Adaboost.
Comprehensive simulations: We conducted extensive simulations on the real electricity consumption dataset and analyzed our proposed solution with standard techniques. Simulation results demonstrated the superiority and effectiveness of our proposed model over existing benchmarks previously used for ETD.
The remainder of this paper is arranged as follows.
Section 2 presents our proposed approach comprising of IQMOT and LSTM–UNet–Adaboost for ETD.
Section 3 illustrates and examines the simulation results before concluding the paper in
Section 4. Lastly, the future directions are described in
Section 5.
2. Proposed Methodology
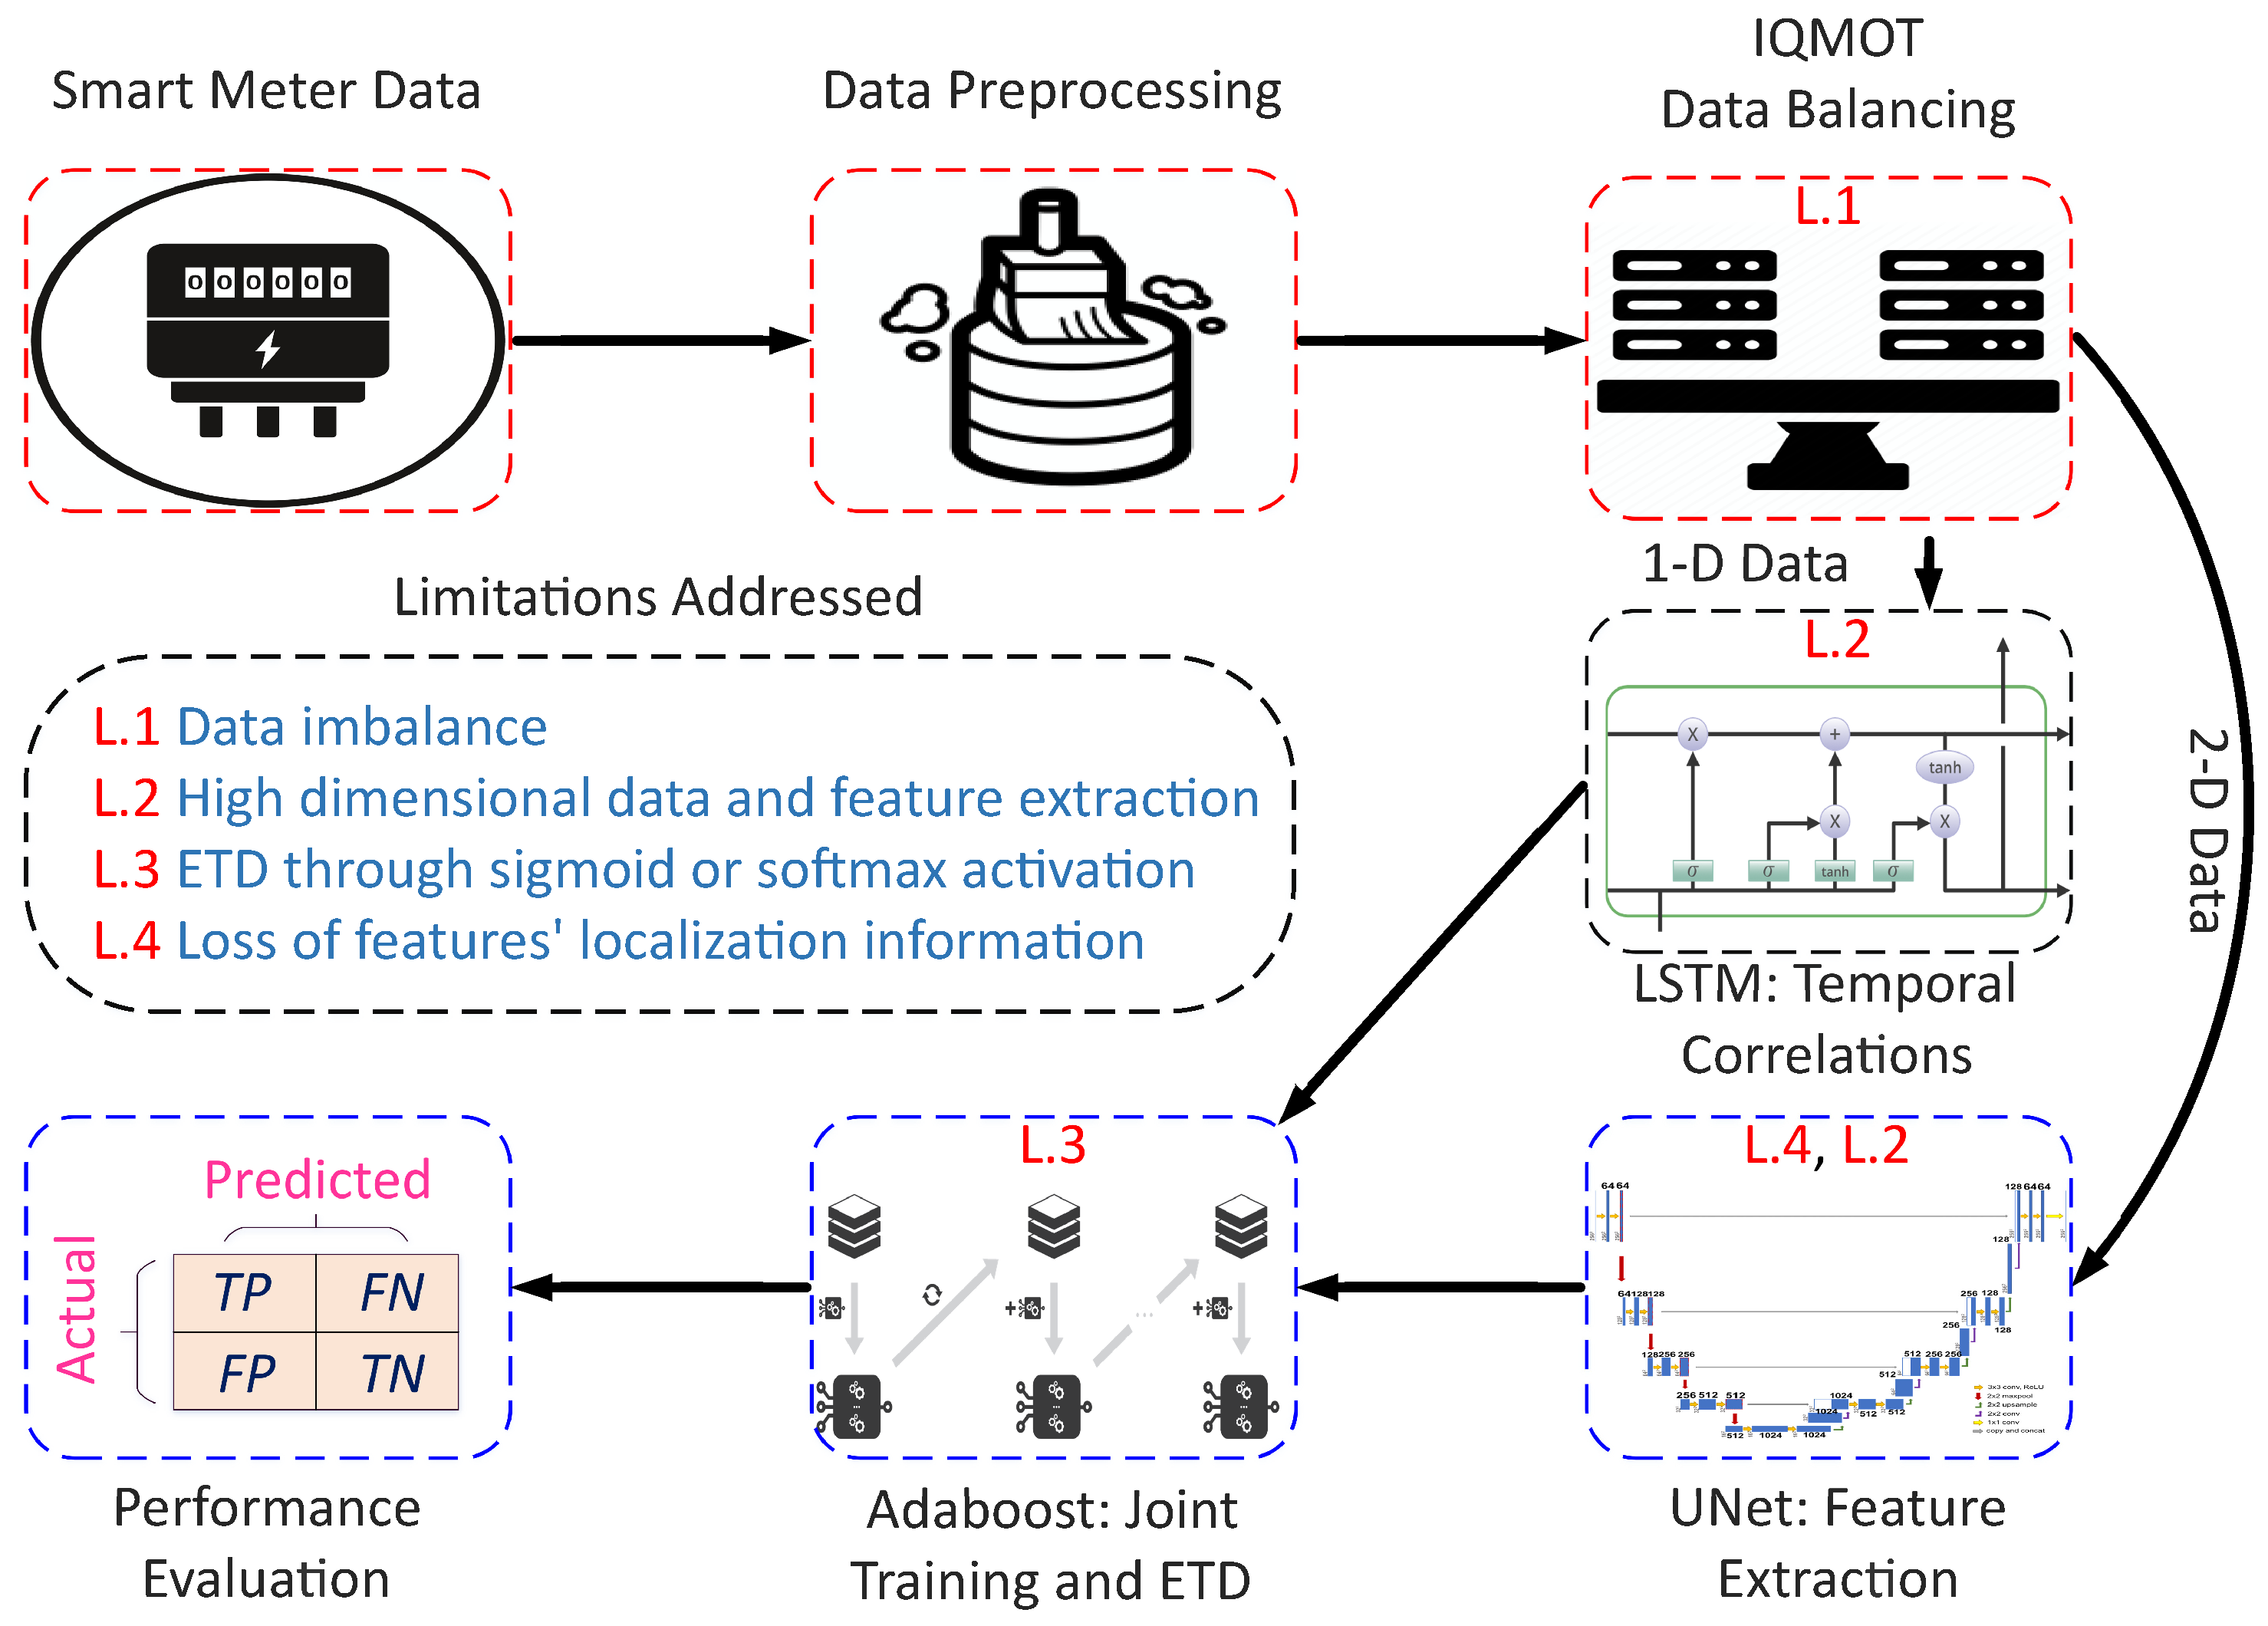
The proposed system model is shown in
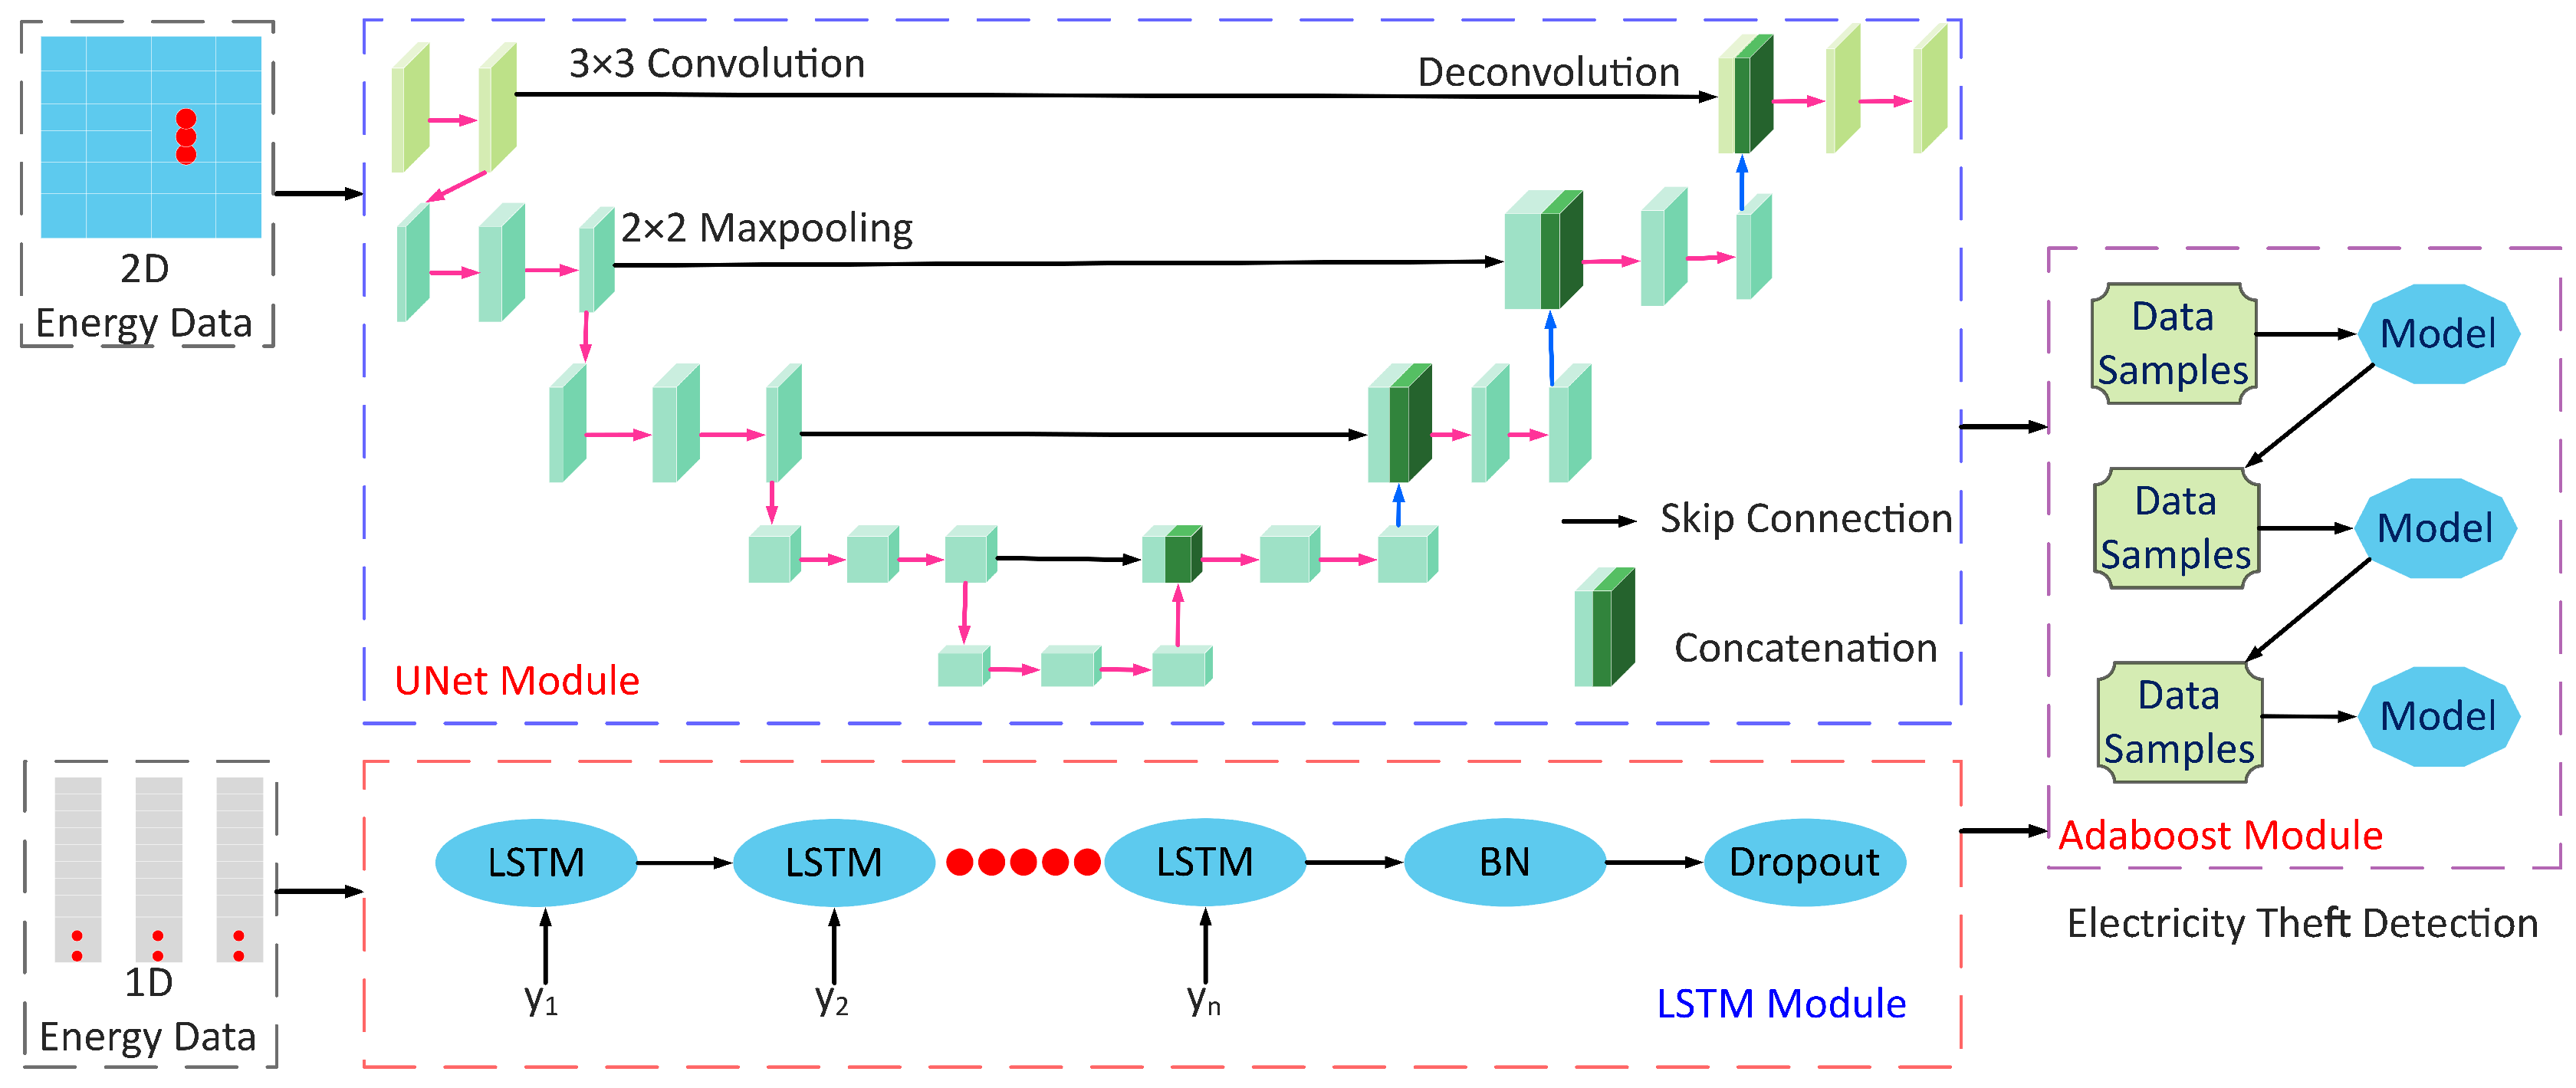
Figure 1; it has three major stages: (1) data preprocessing, (2) data balancing through IQMOT and (3) data analysis using the UNet-LSTM-Adaboost. The proposed hybrid model practices LSTM, UNet and Adaboost, which solves the limitations of the state-of-the-art techniques for ETD, as mentioned in
Section 1. Moreover, we designed a new class balancing mechanism to handle the data imbalance issues faced by the conventional supervised learning techniques. The proposed methodology has the potential to integrate both 1-D and 2-D information obtained from the electricity consumption data. More generally, the LSTM module is used to derive the long-term dependencies from 1-D data, known as the sequential information. The UNet module acquires global features from 2-D electricity consumption data, i.e., non-sequential information. Furthermore, the Adaboost module performs the final joint training and binary classification over the outputs of LSTM and UNet modules, as shown in
Figure 1. We validated the proposed model using the real electricity theft data in terms of selected performance indicators for ETD. The proposed LSTM–UNet–Adaboost model is efficient because it performs joint training on both types of inputs, known as the sequential and non-sequential information, provided by LSTM and UNet. In the following sub-sections, a detailed description of each module is given.
2.1. Data
In this paper, a real-time power consumption dataset of users is employed, which was given to us by the State Grid Corporation of China (SGCC) [
42]. The metadata information of the SGCC dataset is presented in
Table 1. The dataset contains the daily electricity consumption histories of residential consumers. The SGCC conducts real in-the-field inspections to verify the normal and abnormal consumers. Therefore, SGCC explicitly declares that the given dataset holds 3615 instances of electricity theft, which shows the importance of ETD in China. Additionally, it also contains the missing and erroneous values that require preprocessing, as explained in
Section 2.2.
2.2. Data Preprocessing
The real dataset often contains the missing and erroneous values demanded to be resolved by employing the data preprocessing techniques [
43]. Thus, the electricity consumption dataset of SGCC contains the missing and erroneous values due to several reasons, such as failure of any smart meter equipment, storage issue and measurement error or unreliable transmission. Moreover, analyzing and cleansing the dataset assists one in finding and eliminating these erroneous and missing values. In this study, the concept of linear interpolation was employed to find and retrieve the missing values found in the dataset [
20]. Hence, the missing values were recovered as using the Equation (
1):
where
.
is the current electricity consumption at a certain time
t of an
day. Likewise,
and
are the previous and next values of the current electricity consumption, respectively. Likewise, in the SGCC dataset, we have identified outliers, which skew the data, making the training process complex and have a negative impact on the final ETD performance because of overfitting. In this paper, the “three-sigma rule of thumb” [
44] is practiced for detecting and recovering the outliers according to the following equation:
where
. After the detection and removal of the missing and outlier values, the dataset needs to be normalized, as the deep neural networks are sensitive to the diverse data that increases the training time. Hence, the data normalization improves the training process of deep learning models by assigning the same scale to all values present in the dataset and bringing them in the range of 0 and 1. Therefore, a min-max normalization concept was applied to scale the dataset as per the following equation [
40]:
where
is the electricity consumption at a current time
t,
is the least electricity consumption and
is the highest electricity consumption.
2.3. Data Balancing
In this paper, a new data balancing technique, named IQMOT, is introduced to balance the majority and minority classes. In a real-life scenario, the number of benign consumers is always extensive as compared to the electricity thieves. Similarly, in the SGCC dataset, the benign electricity consumers are higher in number than the electricity thieves, as shown in
Table 1. This imbalanced nature of the dataset adversely affects the performances of the supervised learning techniques because of the biasn towards the majority class. Hence, to reduce the class inequality problem, there are two major types of techniques, known as the cost function-based and sampling-based techniques [
22].
In the sampling-based techniques, there are three major approaches, including random under-sampling (RUS), random over-sampling (ROS) and oversampling based on synthetic theft instance generation, such as the synthetic minority over-sampling technique (SMOTE). In RUS, it unintelligently discards the samples from the majority class, which contains normal consumers. This method decreases the computationally beneficial dataset size. The unintelligent removal of samples from the majority class creates a loss of potentially important information, while the remainder does not provide a realistic assessment. ROS replicates the minority class instances to balance the majority and minority classes. There is no loss of potentially useful data; however, due to the unintelligent replication of minority instances, the model leads to an overfitting problem. In this regard, SMOTE is an effective synthetic instance generation technique that generates the new minority instances based on the nearest neighbors [
45].
Synthetic generation of minority instances avoids the overfitting problem, which occurs due to the ROS technique, although the synthetic forms of theft instances do not reflect the real-world electricity theft cases. Moreover, a synthetic formulation replicates the minority class instances based on the nearest neighbors, which further leads to the overfitting problem. In the light of the above-mentioned limitations, we propose a novel class balancing technique in ETD, named IQMOT, to balance the majority and minority class instances. Moreover, IQMOT-based generated instances reflect the real-word theft cases and improve the model’s performance. Besides, simulation results indicate that the proposed IQMOT is superior over the existing SMOTE technique. The pseudo-code of the proposed IQMOT is described in Algorithm 1.
| Algorithm 1 IQMOT algorithm. |
1: Given: An imbalanced dataset X with majority class and minority class , 2: where and 3: Output: Balanced dataset 4: Initialize: Theft consumers normal consumers x, difference between thieves and normal consumers D, 25th percentile , 50th percentile and 75th percentile , 5: Get the total number of thieves and normal consumers, 6: Calculate , , of theft consumers, 7: Calculate percentage of values falling in each percentile, 8: Get numbers: a, b, c to represent the values fall in each group, 9: For n = 1,2,…,D do 10: Create by selecting values from each group with respect to a, b, c where 11: End for
|
In the real dataset comprising of electricity theft consumers, not all theft cases fall in the median of the Gaussian distribution. The electricity theft cases exhibit irregular electricity consumption behaviors, whose consumption values fall outside the median of a normal distribution; they are usually treated as outliers. Therefore, interquartile range is a good statistical tool to indicate such non-normal instances. In this paper, we got inspiration from the outlier detection method, named interquartile range (IQR) [
46], to devise the new class balancing technique that generates the NTL instances closer to the realistic theft cases. We refer to the percentiles where the theft cases are distributed into 25th, 50th and 75th percentiles. In the proposed IQMOT technique, we first get these percentiles that tell us the range and type of theft values falling into each of the percentile groups. Likewise, the median or 50th percentile contains the middle or average energy consumption values of electricity thieves.
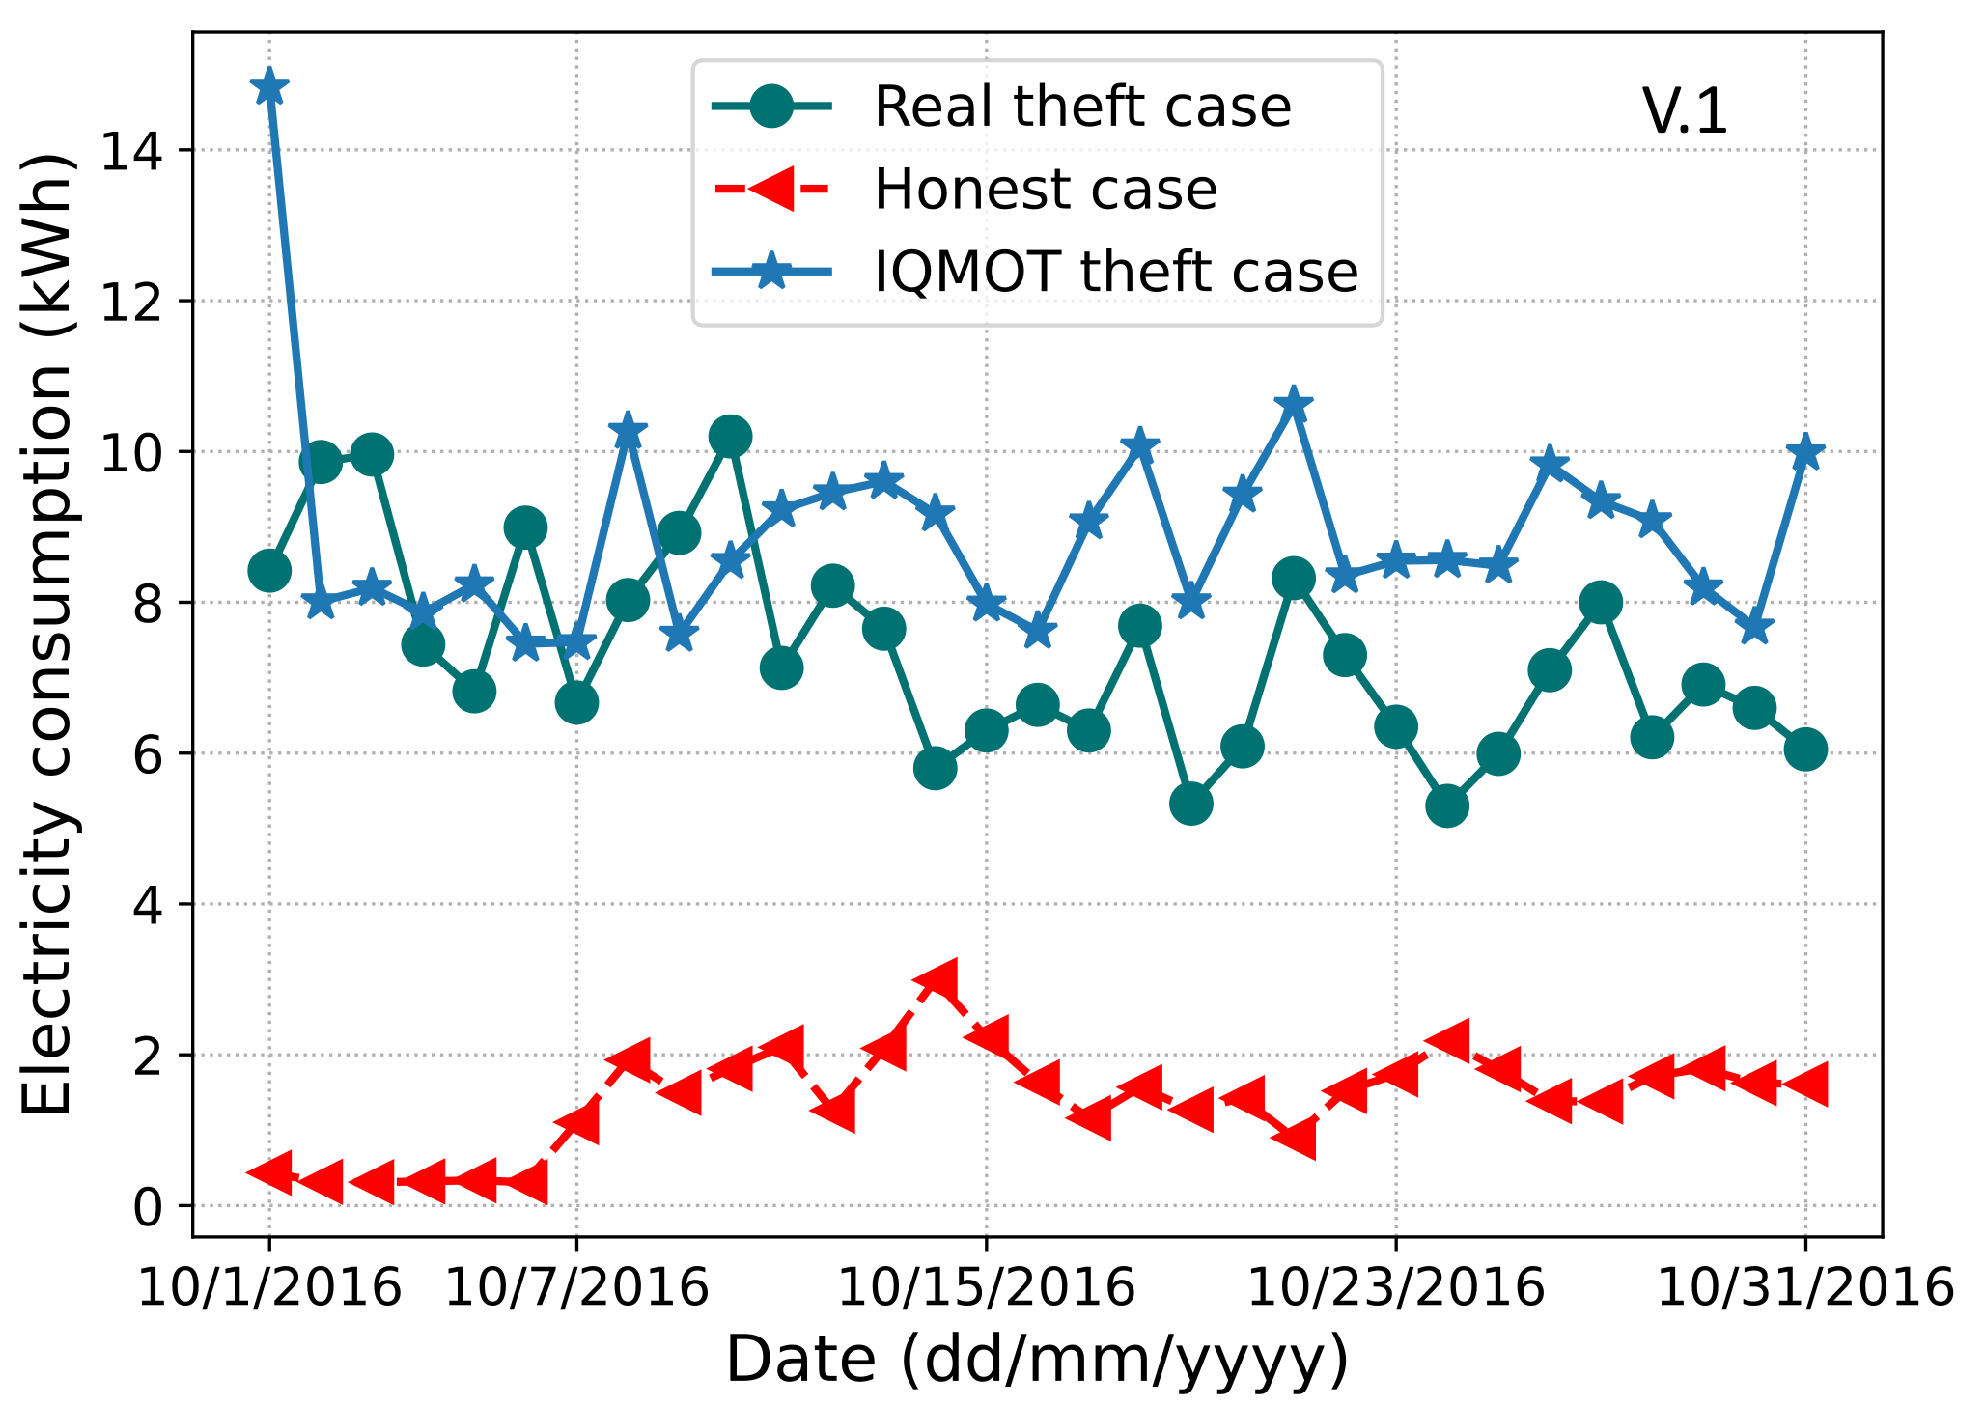
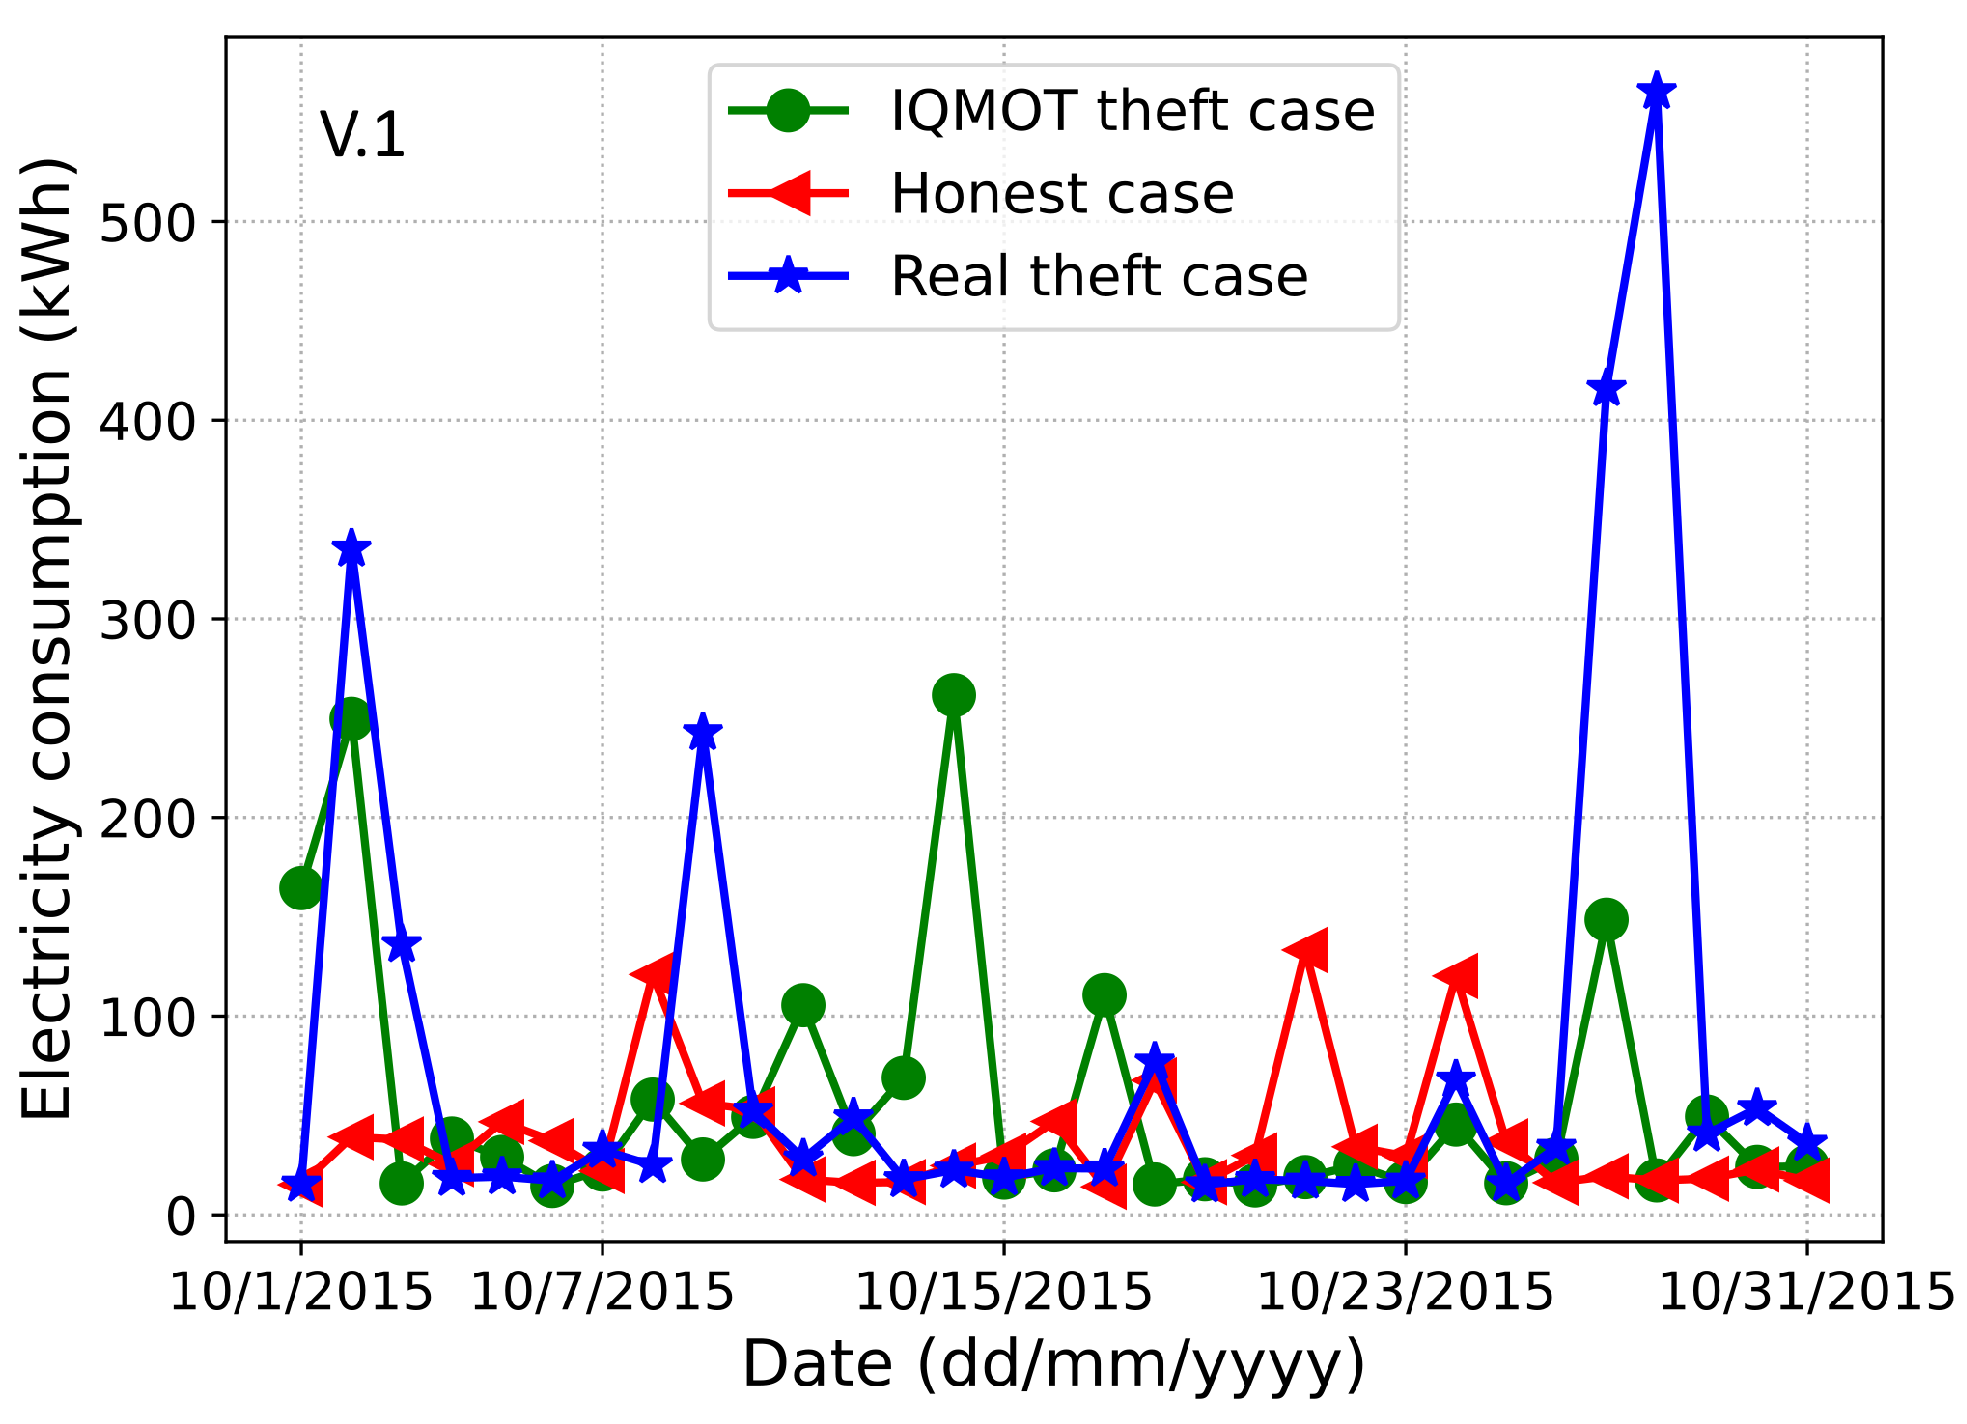
In the proposed IQMOT, percentiles are used to define the limit over the theft values and gives us the representation of electricity theft cases. After getting the percentiles, the percentage of values coming in each percentile is obtained. Based on the computed percentage, we get a number showing the values of theft consumers lying in each group of percentiles. Similarly, values from each of the percentiles are obtained and a new theft case is produced, which is quite similar to the real theft cases. This process iterates until the minority class (electricity thefts) becomes equal to the majority class (normal consumers). Hence, the newly created minority instances reflect electricity consumption that is similar to the available theft instances in the dataset. In
Figure 2 and
Figure 3, we observe the resemblance between original theft cases in the dataset and IQMOT-generated theft cases in a month. Moreover, it is evident that the IQMOT-generated theft cases are more realistic regarding the real theft cases. In this way, the proposed IQMOT overcomes the limitations of the above-mentioned traditional class balancing techniques and generates more realistic theft cases.
2.4. Data Analysis
In the data analysis stage, we extract features from the preprocessed dataset and perform ETD. In particular, LSTM and UNet are applied to extract features from the preprocessed dataset and perform joint training through the Adaboost classifier for final classification. The following sub-sections explain the comprehensive description of each module of the LSTM–UNet–Adaboost.
2.4.1. LSTM Module
In this paper, LSTM is applied to capture the long-term associations from electricity consumption data, i.e., temporal correlations from electricity consumption time series at each time step. Therefore, 1-D daily data of electricity consumption is used as input to the LSTM. The electricity consumption data recorded by the smart meters are increasing day by day, which creates a large dataset history of a single user. A simple neural network or recurrent neural network (RNN) is not sufficient to obtain and maintain the long-term dependencies in their memory to forecast the future information. These models are difficult to train over a large historical dataset while trying to extract the long-term temporal correlations, which leads to the gradient vanishing and exploding problem [
47]. For this reason, in this paper, the LSTM model is employed to memorize the long-term temporal associations from the extensive historical data.
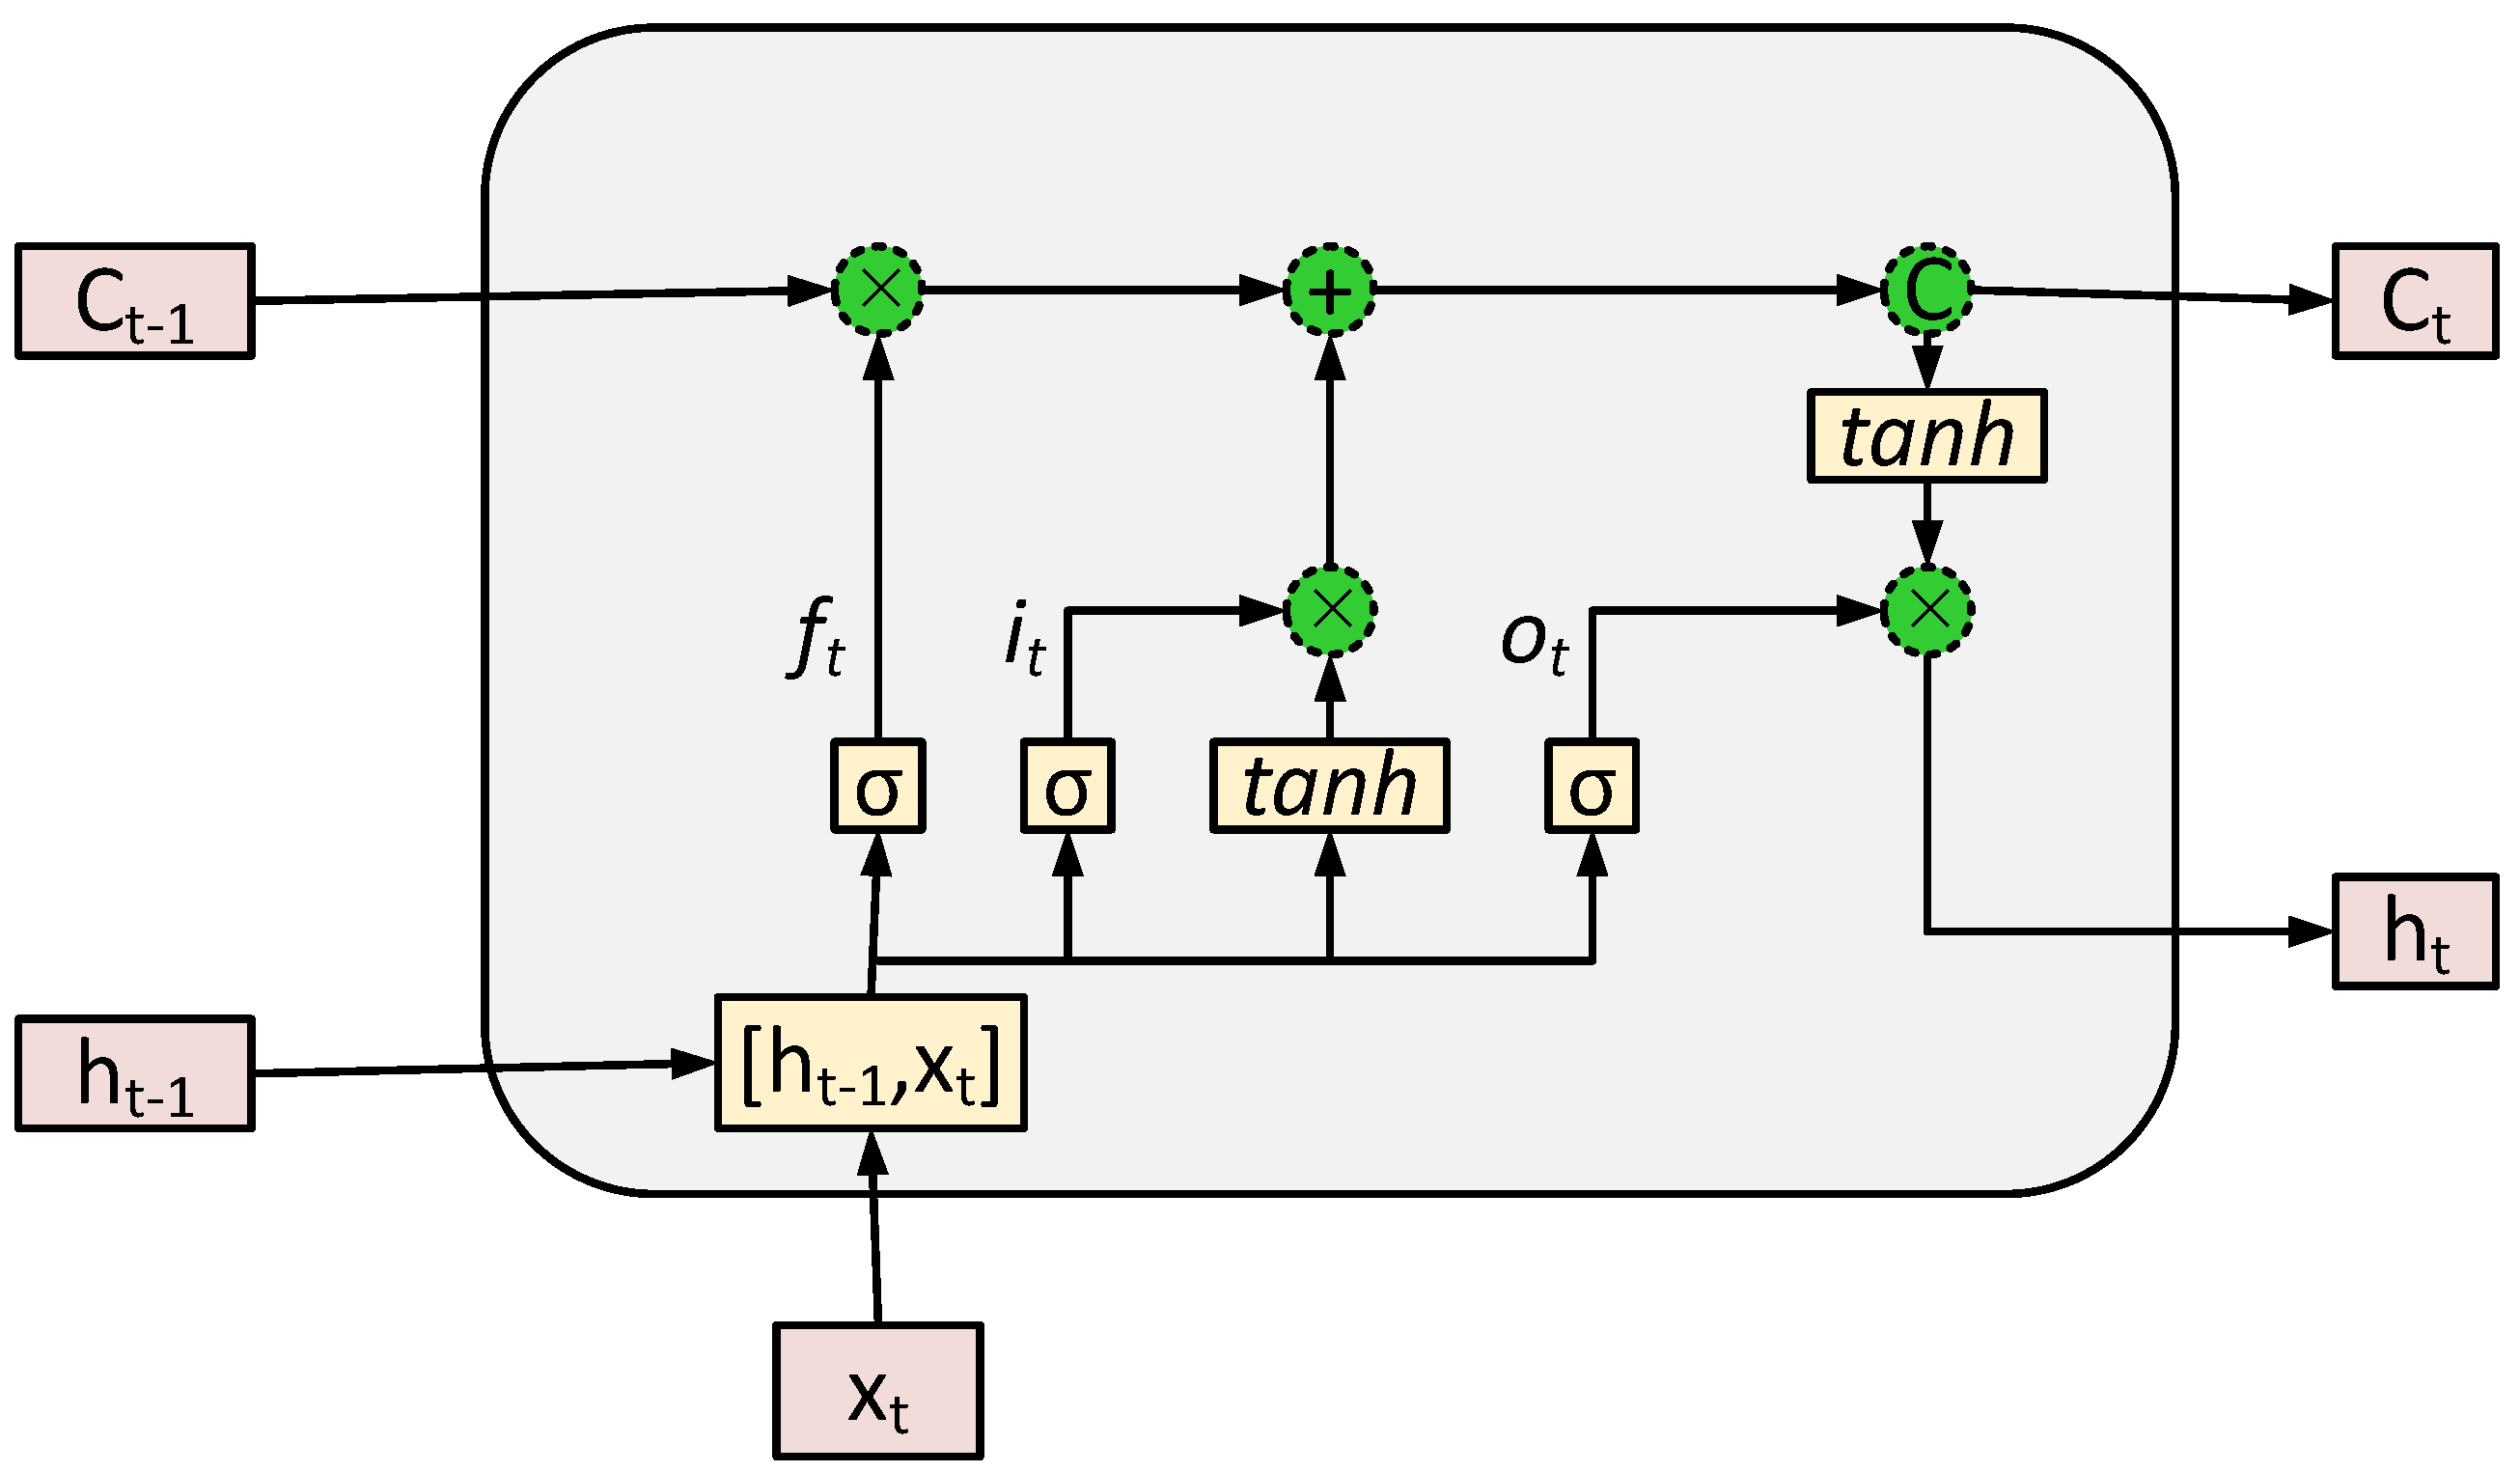
LSTM is a special class of RNN, which has the capability to retain and propagate information from the initial stage towards the final stage of the model [
48].
Figure 4 displays the general structure of the LSTM model. It has three important gates, known as input gate
, output gate
and forget gate
. Its main component is the cell state, which maintains the long-term dependencies along the chain. Thus, the dependencies in the cell state are managed by the aforementioned gates. In
Figure 4,
and
show the current and previous cell state, respectively.
and
show the outputs of the current and previous LSTM units, respectively. Furthermore,
and
represent the sigmoid and hyperbolic tangent functions, respectively. Both functions are non-linear activations in the LSTM model.
and
are the weights and biases of the LSTM model, respectively. LSTM is based on daily electricity consumption data to produce a single output, known as
, which is also recognized as the hidden state at the last time step. Hence, LSTM achieves its purpose by processing the following Equations (
4)–(
9) [
48]:
In this paper, the deep LSTM model is used with a stack of recurrent LSTM layers, since a single layer LSTM model often fails to capture the complete dependencies. The output from each LSTM unit serves as an input to the batch normalization layer, which normalizes the previous layer output at runtime and forwards it to the next layers, where the batch normalization enhances the model convergence, extends the model stability and reduces both the overfitting and training time [
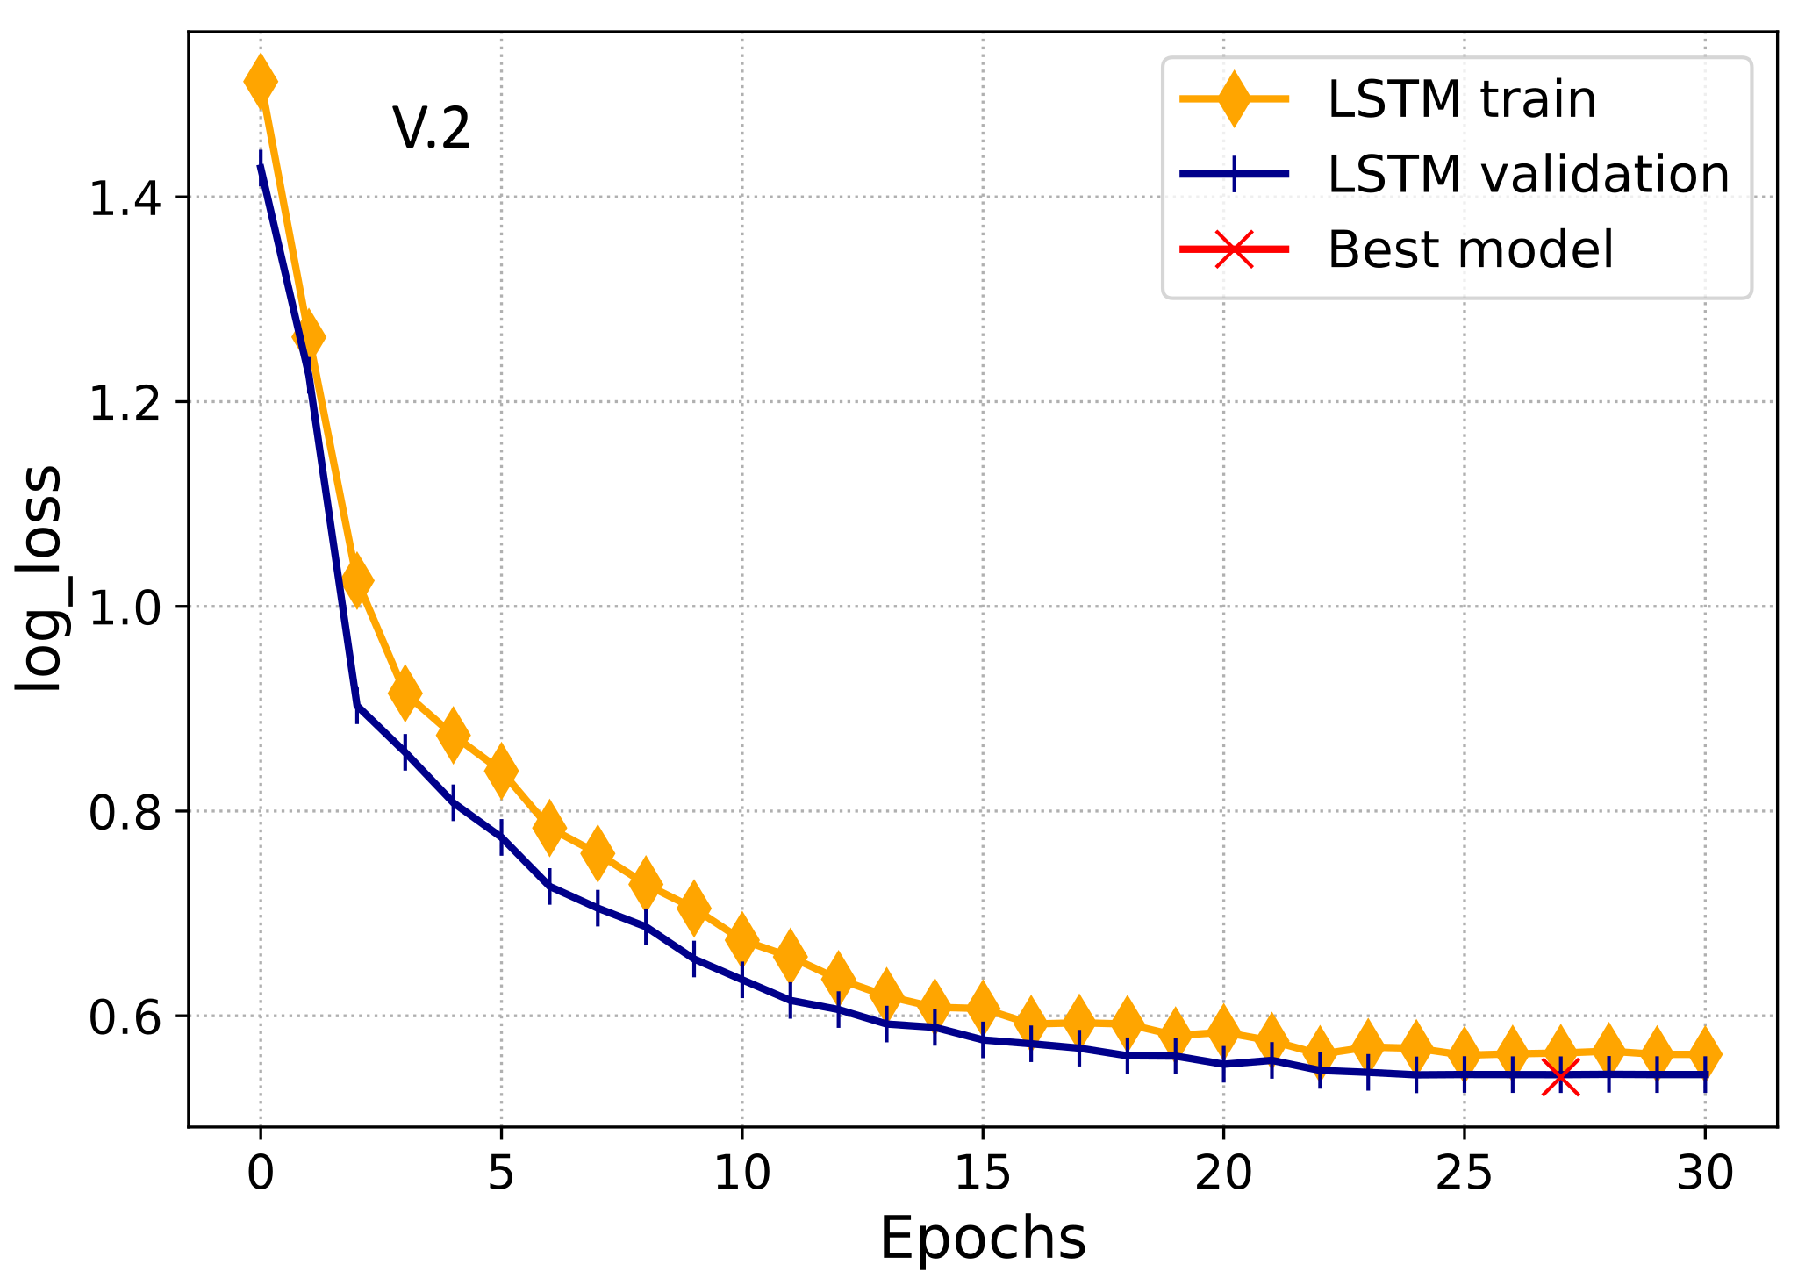
49]. After that, the dropout layer is employed with a 0.5% probability that drops 50% of neurons randomly to inhibit the model from overfitting. Moreover, it improves the model’s convergence by preventing the model from being over-dependent on a few neurons, which allows each neuron to work individually. In particular, the LSTM model comprises of three layers with batch normalization and dropout layers. It utilizes 1-D electricity consumption data using the Adam optimizer with the batch-size of 32 and binary cross-entropy as the cost function. Furthermore, a Keras callbacks concept is used during the model’s training to practice the learning rate decay over five epochs and early stopping procedure over 10 epochs. Consequently, these procedures will improve the model’s convergence and effectively mitigate the overfitting problem.
2.4.2. UNet Module
UNet is used in this paper to learn and derive potentially important information from 2-D electricity consumption data. As in [
20], the authors explain the effect of the periodicity to illustrate how weekly data can better obtain the periodicity from consumption patterns. For this reason, the energy consumption data are transformed into 2-D weekly data and serve as an input to the UNet model. Furthermore, the authors in [
20,
22,
40] have used a traditional CNN technique to derive high-level features from electricity consumption data. However, if we use the regular convolution network with the pooling and dense operations, the model will only extract high-level features of "what," but not their localization information, "where." As a result, in this paper, UNet is used, which derives both the high-level features and their localization information through the down-sampling and up-sampling strategies, respectively.
The UNet model was originally proposed for biomedical image segmentation [
50]. The chief concept behind the semantic image segmentation is to attach the corresponding label of each pixel of the image [
51]. In this way, the model predicts each pixel within the image, also known as the dense prediction. Therefore, semantic segmentation problems are considered as classification problems where each feature of a time-series is labeled with its corresponding class. In this paper, we get inspiration from such a semantic segmentation approach where the UNet model extracts the high-level features from the 2-D electricity consumption data and then labels them to their corresponding classes.
The name UNet is used because of its symmetric U-shape architecture, as shown in
Figure 5. Its architecture mainly consists of two paths: the contraction path (also called down-sampling or encoder) and the expansion path (also called up-sampling or decoder) [
50]. The contraction path performs down-sampling by the convolution and pooling operations, which are used to extract global features from 2-D data. On the other hand, the expansion path does up-sampling over these extracted features through the inverse or transpose convolution operation. Since transposed convolution is the inverse of convolution operation used to perform up-sampling. It tells us the whereabouts of information. We refer to down-sampling because both convolution and pooling operations reduce the size of input features or parameters. Consequently, the model determines parameters through the backpropagation procedure.
UNet has both the long and short skipping connections. The short skipping connections are present in each of the major down or up-sampling blocks, while the long skipping connections are available within the contraction and expansion paths to concatenate the extracted features with their corresponding labels. In this work, the contraction path involves four major blocks where each block contains:
The feature maps are multiplied at each pooling layer, i.e., beginning from 16 feature maps in the first major block, 32 feature maps in the second block and so on. This procedure is also termed as increasing the size of depth and reducing the size of the input. Moreover, the expansion path consists of four major blocks where each block contains:
Transpose-convolution with a stride of 2;
Linking with regular convolution features;
Two convolution layers plus with batch normalization.
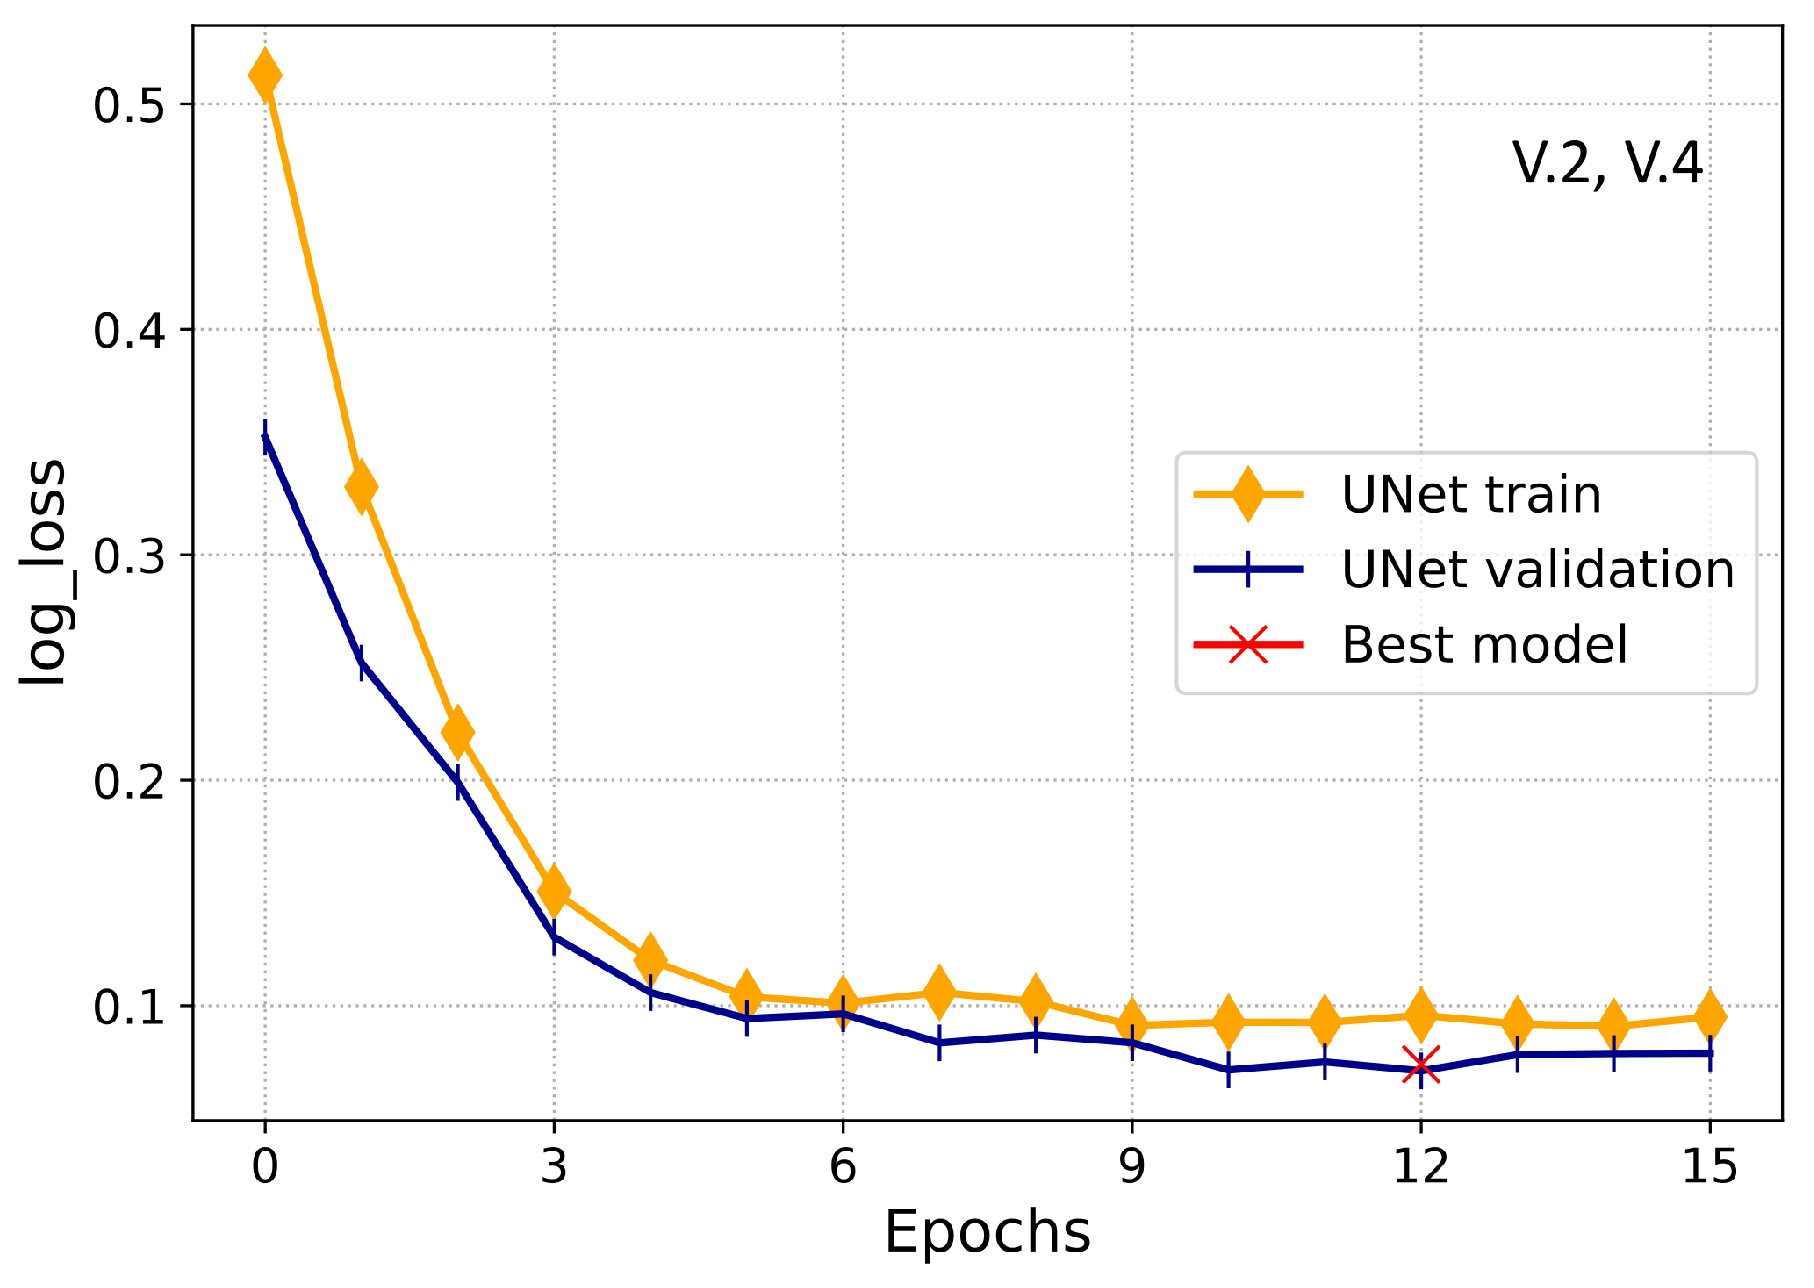
The center of the contraction and expansion path is determined as the bottleneck; it employs a single convolution layer with batch normalization and dropout. In this paper, the UNet model is trained using an Adam optimizer with batch-size of 32 and binary cross-entropy as the cost function. Furthermore, Keras callbacks are used during the UNet training, as already described in
Section 2.4.1. Simulation results validate that UNet appears to be very effective and efficient for ETD based on electricity consumption patterns.
2.4.3. Joint Training and Classification Module
For the joint training and classification mechanism, the ensemble learning boosting technique is applied where different weak classifiers are combined to build a powerful classifier, as shown in
Figure 5. This is more accurate than the final joint training and classification through a single hidden layer based feed-forward neural network (FFNN)—for instance, a fully connected layer with either sigmoid activation or softmax classifier. To improve the ETD performance, we use Adaboost as a final classifier, which acts as a final layer of the LSTM-UNet to replace the single hidden layer based FFNN used in traditional models [
20,
22,
23]. Therefore, Adaboost simply takes the outputs of LSTM-UNet modules and concatenates them to make a new input for the Adaboost model. Now, the long-term dependencies and high-level features are the inputs of the Adaboost model for the final theft detection. In this context, the proposed model derives the benefits of two powerful procedures of machine learning, known as deep learning and ensemble learning.
Adaboost is formerly designed to solve highly non-linear tasks [
24]. The main focus of Adaboost is to learn from the mistakes of previous models and boost the performance of the next model. Thus, the most accurate classifier will be selected to perform the classification task. This process iterates until the training data becomes error-free or the model reaches the specified number of learners. Adaboost has several important hyperparameters, which influentially affect the model’s theft detection performance. Therefore, the grid-search mechanism is applied in this paper to find the most appropriate hyperparameters of Adaboost, as described in
Section 2.5.
2.5. Simulation Setting
The proposed model for ETD was implemented in python using the open-source deep learning libraries, known as Keras and Tensorflow. The proposed model was developed and simulated using the SGCC dataset, which contains a total of 42,372 consumers with 1035 days of electricity consumption history, as given in
Table 1. For simulations, the dataset was first preprocessed through linear interpolation, three-sigma rule and min-max normalization. After that, the dataset was balanced through the proposed IQMOT technique. In the training procedure, the dataset was partitioned into training, validation and testing sets with a training proportion of 80%, and validation and testing proportions of 10% for each, respectively. LSTM model’s configuration consisted of three layers with batch normalization and dropout layers; each LSTM layer had 60 neurons. Besides, the UNet model’s configuration was the same as already defined in
Section 2.4.2. For the training of LSTM, 30 iterations were run initially with a batch-size of 32 using Adam optimizer, while the training of UNet was initially performed by running 15 training iterations with the batch-size of 32. Finally, the Adaboost was executed by utilizing the outputs of LSTM and UNet modules as an input. Furthermore, to select the optimal hyperparameters of the Adaboost and other models, a grid-search algorithm was implemented.
Table 2 shows the important hyperparameters selected for the Adaboost model using grid-search.
2.6. Loss Function
The most widely used loss function for the classification problem is cross-entropy, to classify only two classes. In this paper, the binary cross-entropy loss function, also known as the logarithmic loss, is used to deal with the binary classification task. The predictions become more accurate as the loss function converges to zero. The binary cross-entropy loss function is calculated using the following formula [
23]:
where
N shows the accumulative consumer instances.
represents the actual label and
is the likelihood of the electricity theft measured by the proposed model for the
consumer.
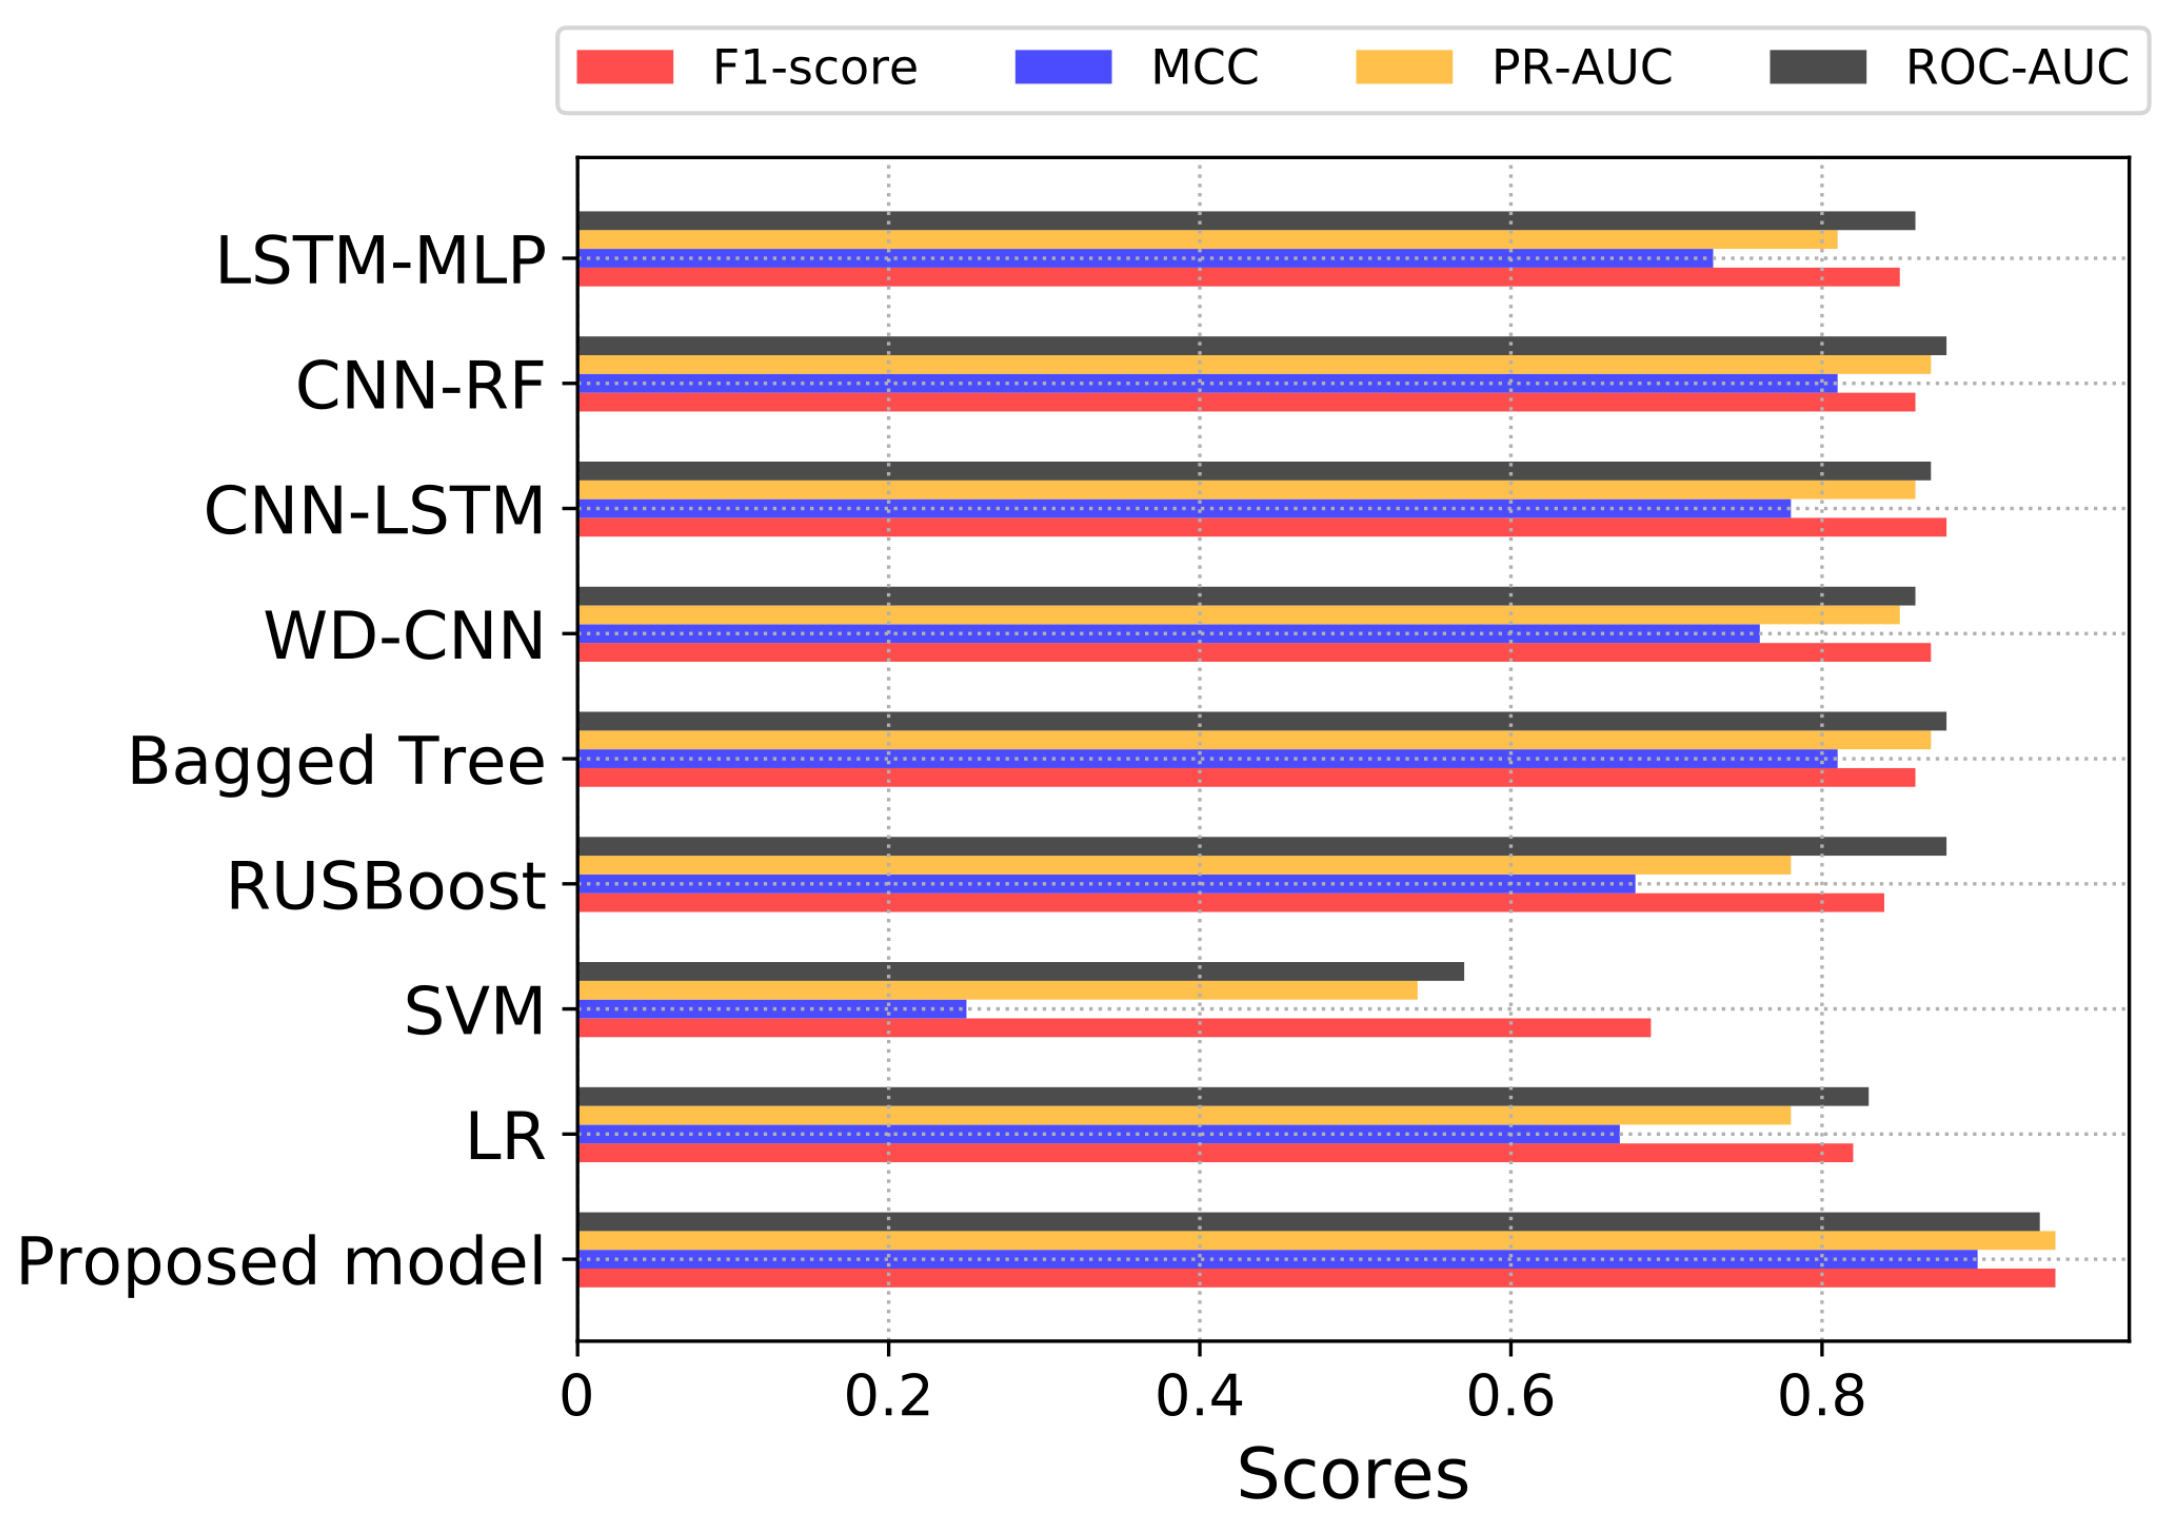
2.7. Performance Evaluation Metrics
In this paper, seven class imbalance metrics are employed to evaluate the performance of the proposed model, which includes area under the curve (AUC), precision, recall, Mathews correlation coefficient (MCC), F1-score, area under the precision-recall curve (PR-AUC) and accuracy. These performance evaluation metrics are determined from the confusion matrix, i.e., a matrix that describes different results in classification problems. Specifically, for the binary classification problem, the confusion matrix returns two rows and two columns, i.e., four possible outcomes. These four possible outcomes are described as follows:
The true positive (TP) score demonstrates the number of dishonest consumers accurately predicted by the classifier;
The true negative (TN) score shows the number of honest consumers accurately predicted by the classifier;
The false positive (FP) score describes the number of honest consumers predicted by the model as thieves;
The false negative (FN) score highlights the number of dishonest consumers predicted by the model as honest consumers.
The following are the performance metrics given in Equations (
11)–(
16), as defined in [
20,
21,
24]:
where
P represents the number of positive samples,
N represents the number of negative samples and
shows the rank value of sample
i.
The accuracy of a classifier is a metric used to indicate the percentage of correct predictions. Besides, a recall is another class imbalance metric, which is also termed the detection rate (DR), sensitivity or the true positive rate (TPR) in the literature. It shows the capability of a scheme to detect electricity theft consumers. Likewise, precision is the ability of the classifier to accurately classify normal consumers. However, accuracy, precision and recall metrics using the imbalanced dataset cannot provide a realistic assessment of the model’s ETD performance [
7]. Hence, F1-score is another useful class imbalance measure as compared to the metrics described above for ETD’s performance examination. In F1-score, we get the balance of both precision and recall, which shows its usefulness as compared to the other metrics.
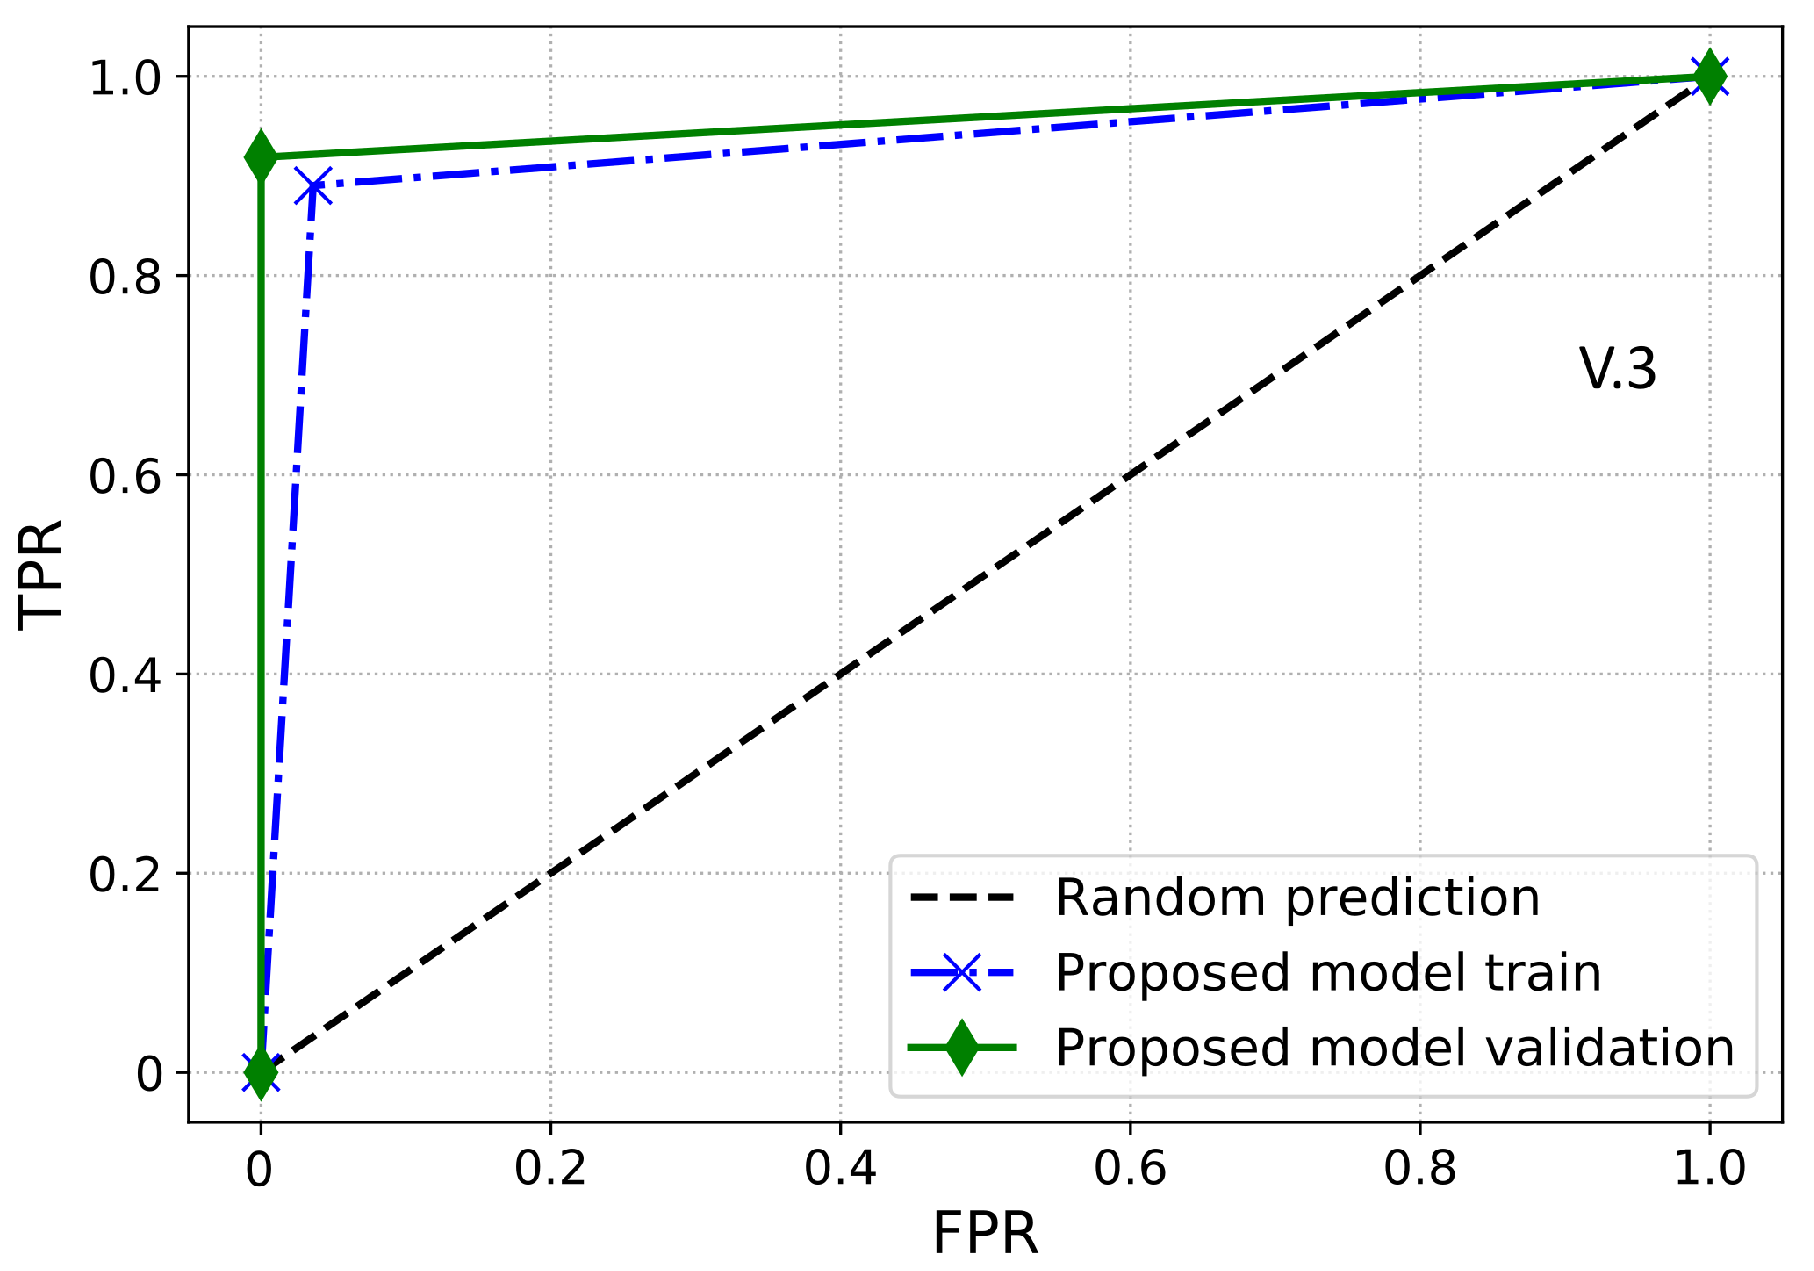
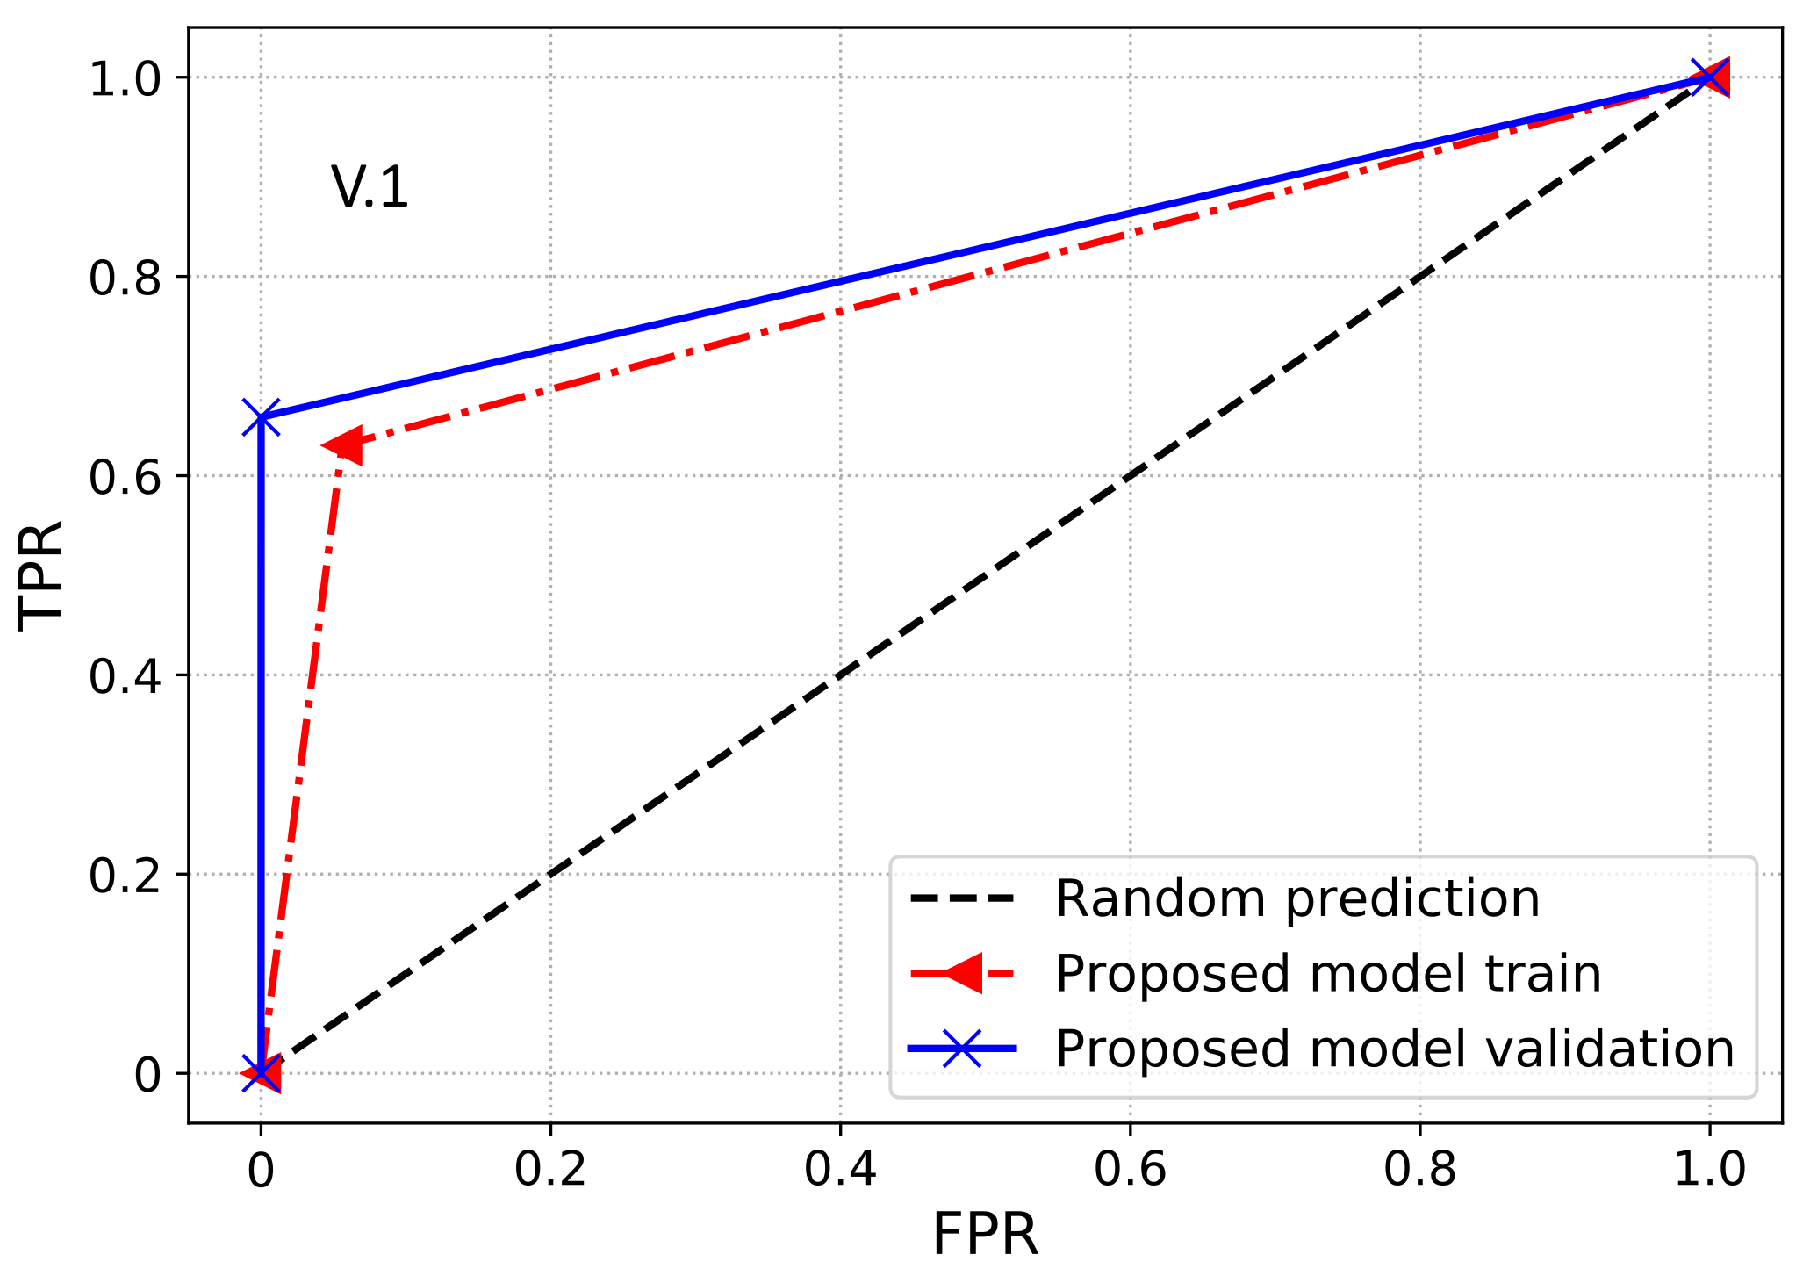
Furthermore, a performance index that is more reliable and accurate for an imbalanced dataset is the AUC. It provides a more realistic assessment of the model’s detection performance in terms of ETD over the imbalanced dataset. Essentially, it is the likelihood that the model ranks a positive sample higher than the negative sample. AUC is also identified as the area under the receiver operating characteristic curve (ROC-AUC). ROC-AUC is used to evaluate the model’s capability to make the separation between the classes. Thus, it is a graphical representation to evaluate the ETD performance of a model by plotting the TPR against the FPR. Moreover, the area under the ROC curve is estimated between the threshold of 0 and 1. If the classifier has a ROC-AUC score higher than 0.5, then it produces a better DR against any random predictions. If the classifier has less than 0.5 ROC-AUC, then it implies that the classifier has limited classification capability.
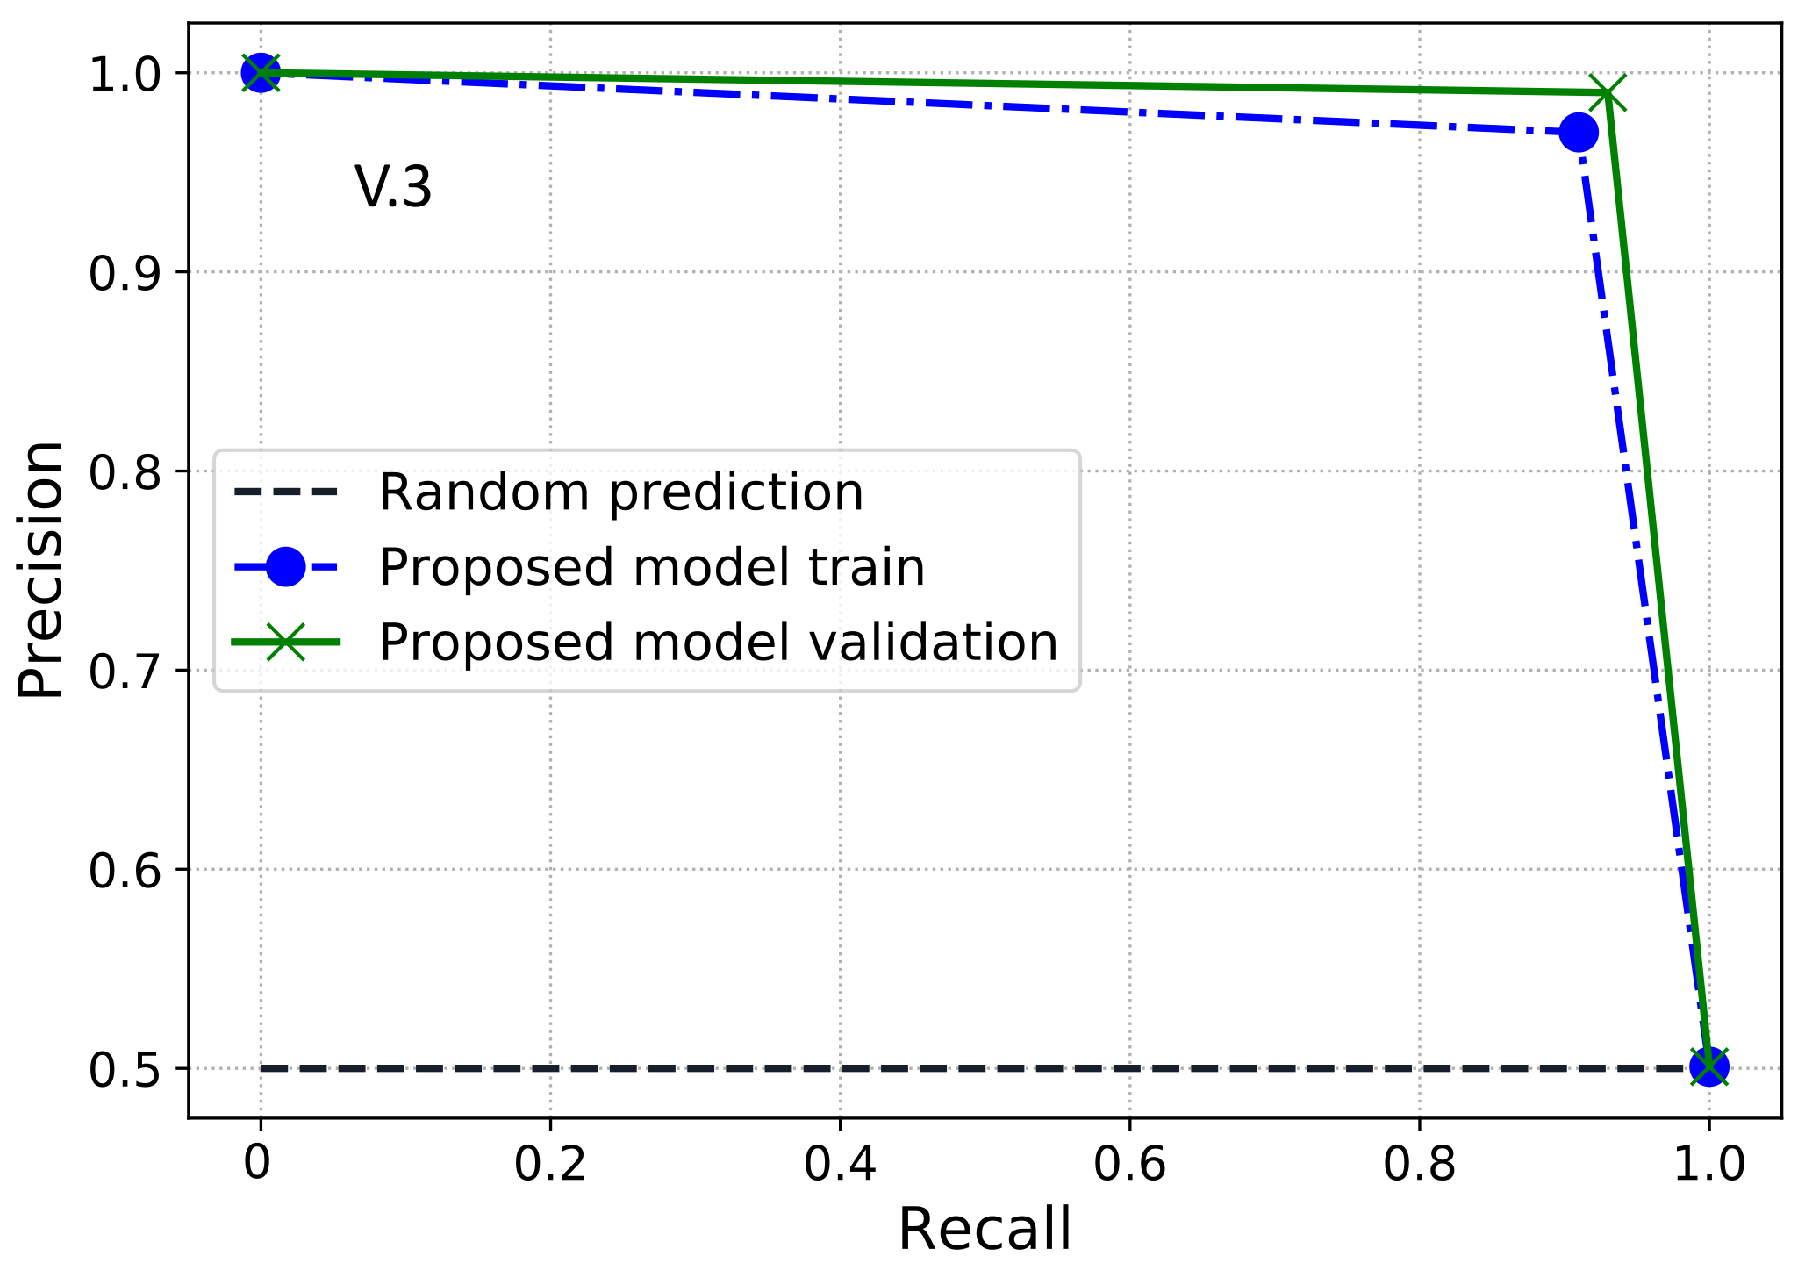
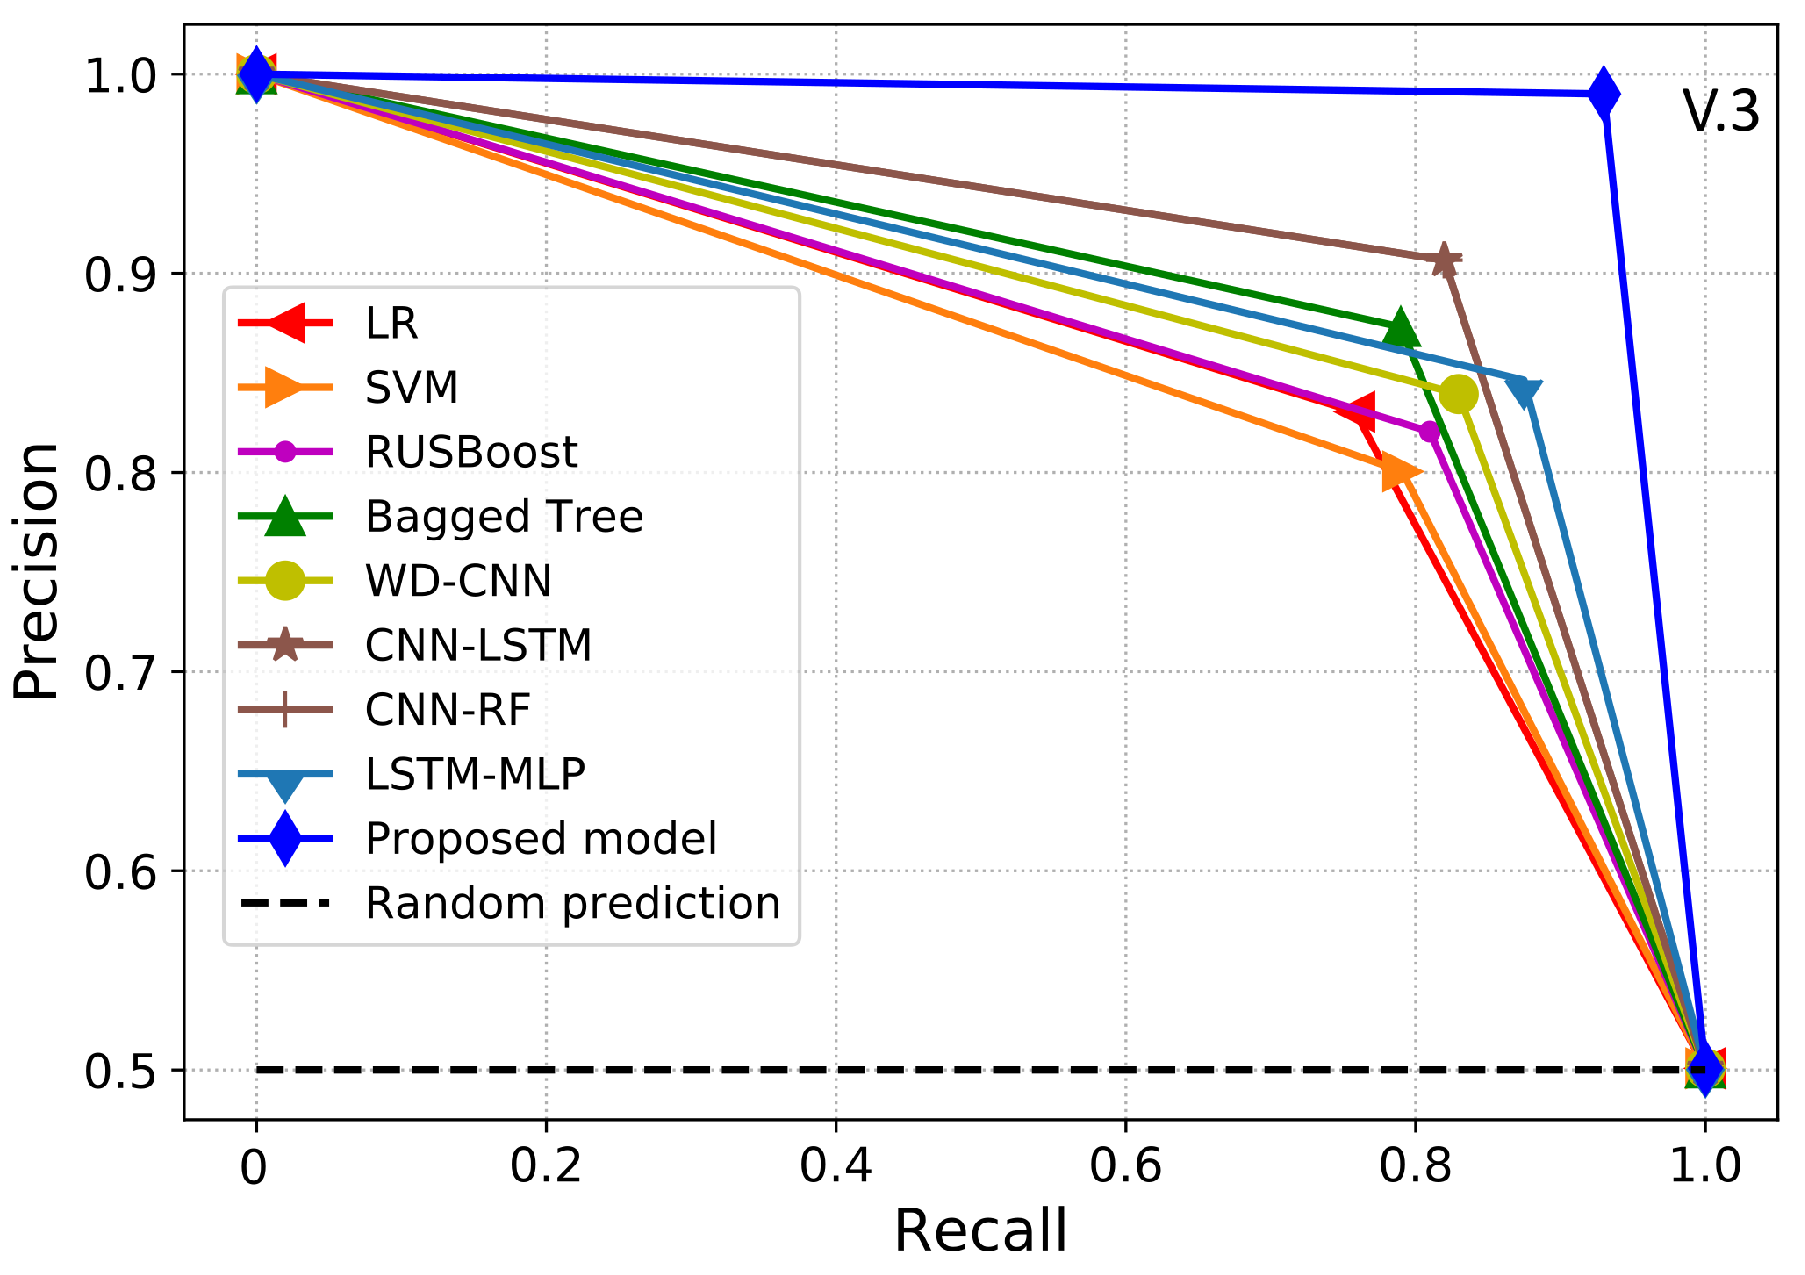
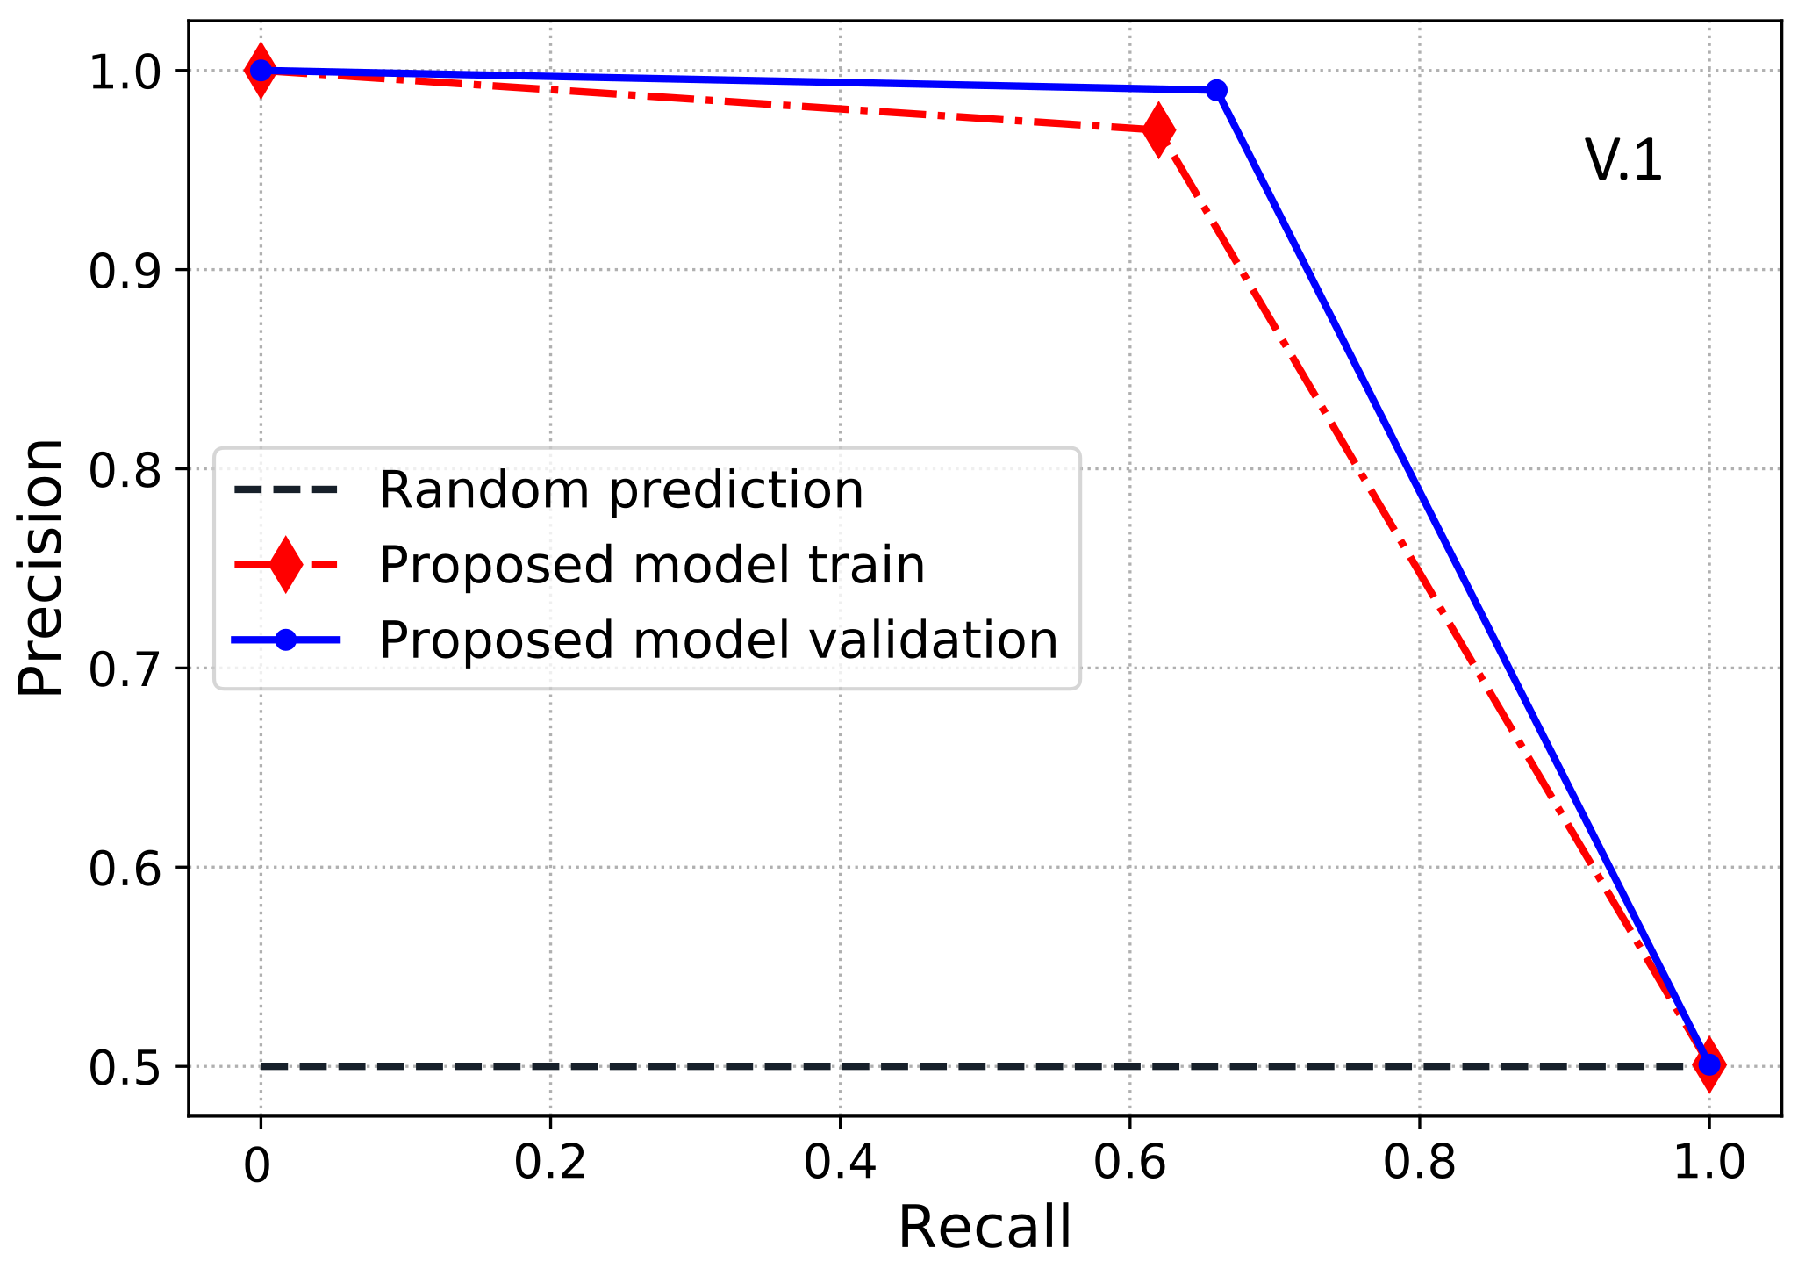
PR-AUC is another useful class imbalance measure employed to assess the model’s performance. Therefore, in this paper, we use PR-AUC, which considers the precision of the classifier and highlights the cost of on-site inspections for the utilities. PR-AUC is examined only when positive samples are on the top rather than the negative samples where the score is improved only when positive samples are on the top and negatives samples are on the bottom. Likewise, MCC is a binary classification metric used to evaluate the model’s performance using the imbalanced data. Moreover, MCC is a more accurate class imbalance metric than the AUC and F1-score because MCC captures the correlation between all four possible outcomes of the confusion matrix and suggests essential evaluation metrics. The MCC score ranges from −1 to 1, where a value near to 1 shows an accurate classification. Likewise, 0 shows the result of random predictions where the model has no class separation capability and −1 dictates incorrect classification. Accordingly, a classifier is good if it achieves ETD objective effectively, i.e., a classifier with a high DR performance and low FPR. The cost of FN is pretty high and important because it shows the cost of energy stolen and not given by the theft consumers. The cost of FP is much lower than FN because it shows the cost of inspection rather than the cost of stolen energy. Hence, in ETD, more importance is given to recall than precision.
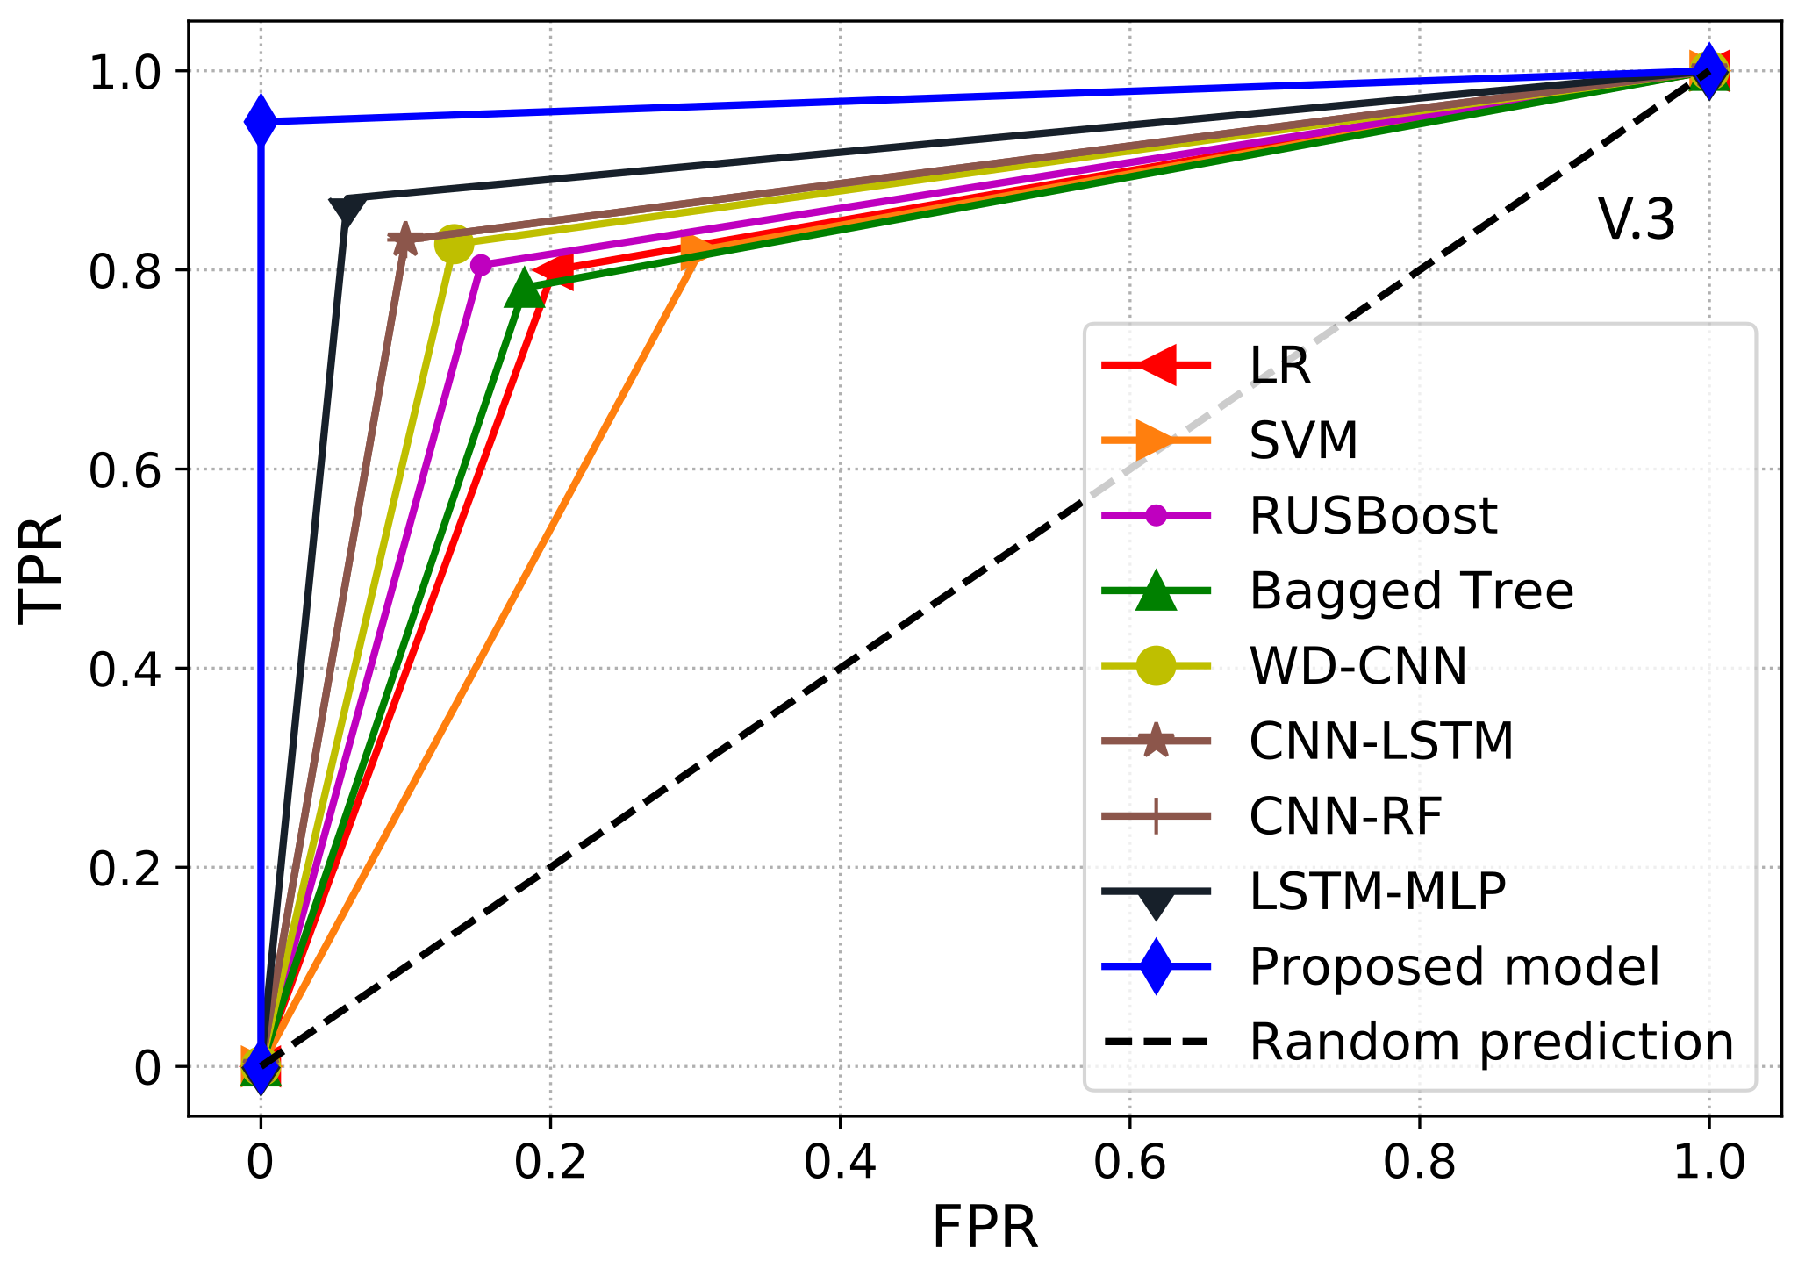
2.8. Benchmark Models
In this section, we illustrate the state-of-the-art benchmark models and basic classification techniques used for comparison with our proposed model. For a fair comparison, we implemented a grid-search algorithm to determine the most suitable hyperparameters of the benchmark models.
2.8.1. Logistic Regression (LR)
LR is the primary model for the binary classification task in ETD, which applies the notion of probability and uses the principle of neural networks. For instance, LR for binary classification is similar to the single hidden layer based neural network using the sigmoid activation function. Thus, the sigmoid score ranges between 0 and 1, where a value near to 1 is labeled as theft and near to 0 is classified as honest.
Table 3 shows the hyperparameters selected for LR through grid-search.
2.8.2. SVM
SVM is a famous technique used to solve the ETD problem. Many previous studies, such as [
52,
53], have used SVM to detect the presence of electricity thieves. Moreover, SVM has important hyperparameters obtained by employing the grid-search algorithm, as shown in
Table 4.
2.8.3. RUSBoost
The RUSBoost technique is the combination of RUS and Adaboost. In [
24,
25], the authors used RUSBoost to perform ETD.
Table 5 demonstrates the selection of the RUSBoost’s hyperparameters using the grid-search technique.
2.8.4. Bagged Tree
The authors in [
21] use a bagged tree for NTL detection. A bagged tree is an ensemble learning technique, in which a number of training subsets are generated with replacements and different classifiers are trained on these subsets. Finally, a single model is selected based on the majority of votes from each model.
Table 6 shows the optimal hyperparameter selection for bagged tree using grid-search.
2.8.5. WD-CNN
The authors in [
20] proposed WD-CNN to detect electricity thieves. The authors trained a wide component using 1-D data and the deep component on 2-D data. Therefore, in this paper, we practice the same WD-CNN setting as formerly proposed by the authors [
20].
2.8.6. CNN-LSTM
CNN-LSTM is a hybrid deep learning model for NTL detection [
22]. It consists of CNN for feature extraction and the derived features further serve as inputs to the LSTM model for classification. Hence, a similar arrangement of CNN-LSTM is used in this paper for comparison.
2.8.7. CNN-RF
CNN-RF is a composite of CNN and RF used for ETD [
40]. CNN is applied to derive global features from data. After that, the derived features are delivered to RF for ETD where RF acts as a final layer of CNN. Therefore, the same model arrangement is considered in this paper as a benchmark scheme.
2.8.8. LSTM-MLP
The authors proposed a hybrid LSTM-MLP model using sequential and non-sequential data for NTL detection [
23]. For a fair comparison, the same model configuration is used in this paper as that already proposed by the authors [
23].


