Abstract
In Longwall Top-Coal Caving (LTCC), the shape of the loose body (LB) and top-coal boundary (TCB) formed after the first coal-drawing are the initial conditions for the common coal-drawing period. Taking the Panel 12309 in Wangjialing coal mine as the research object, the weight of the blocks of caved top coal was measured on-site, and the distribution of their equivalent diameter was calculated. By using a coupled numerical method, the “Finite difference method (FDM)–Discrete element method (DEM)” numerical model was established, and the evolutions of the drawing body (DB), LB, and TCB were obtained. The results show that, in the initial stage of first coal-drawing (0–8.09 s), the amount of DB reached its maximum of 7.18 m3 (0.89 m3/s) and then decreased to a stable value of 0.44 m3/s. The relationships between the characteristic parameters of DB, LB, and TCB and the drawing time were fitted. Taking the second derivative of each parameter with respect to time as its sensitivity (η), it was concluded that due to the large coal-drawing volume in the initial stage (0–8.09 s), the values of the above parameters increased, and the sensitivities reached 6.02 × 10⁻³, 3.09 × 10⁻³, and 6.99 × 10⁻³, respectively. Here, the top-coal migration rule in the first coal-drawing process was revealed from the perspectives of DB, LB, and TCB, thus providing a theoretical basis for the further study of common coal-drawing processes.
1. Introduction
Several longwall mining methods such as Multi-Slice Longwall (MSL), High Reach Single Pass Longwall (SPL), and Longwall Top-coal Caving (LTCC) have been mainly applied to extract thick coal seams. Among them, LTCC can provide substantially less economic sensitivity and a reduced level of technical risk over others. Therefore, LTCC has been widely used to extract thick coal seams in China since the 1980s [1,2]. In LTCC, the coal seam is divided into two parts (the bottom coal and the top coal). Bottom coal is undercut directly by the shearer. Top-coal transitions from a continuous state to a discontinuous crushing state under front abutment pressure and finally caves from the coal-drawing opening under the action of gravity [3]. Most research studies about LTCC focus on the mechanism of stress distribution, top-coal crushing, and top-coal migration with the aim of improving recovery ratio [4,5]. However, a rational method of selecting and optimising coal-drawing process parameters can be obtained only on the basis of an in-depth understanding of top-coal migration. The shape of the loose body (LB) and top-coal boundary (TCB) formed after the first coal-drawing represent the initial conditions of the later coal-drawing period. Therefore, it is necessary and meaningful to study the first coal-drawing process, which is the basis of the whole LTCC mining operation.
Similar material simulation and numerical simulation were used to conduct many studies on drawing body (DB), LB, and TCB of LTCC. Using the finite difference method and taking panel 8911 of Xinzhouyao coal mine as the background, Xie et al. [4] studied top-coal migration and believed that the starting point of the top coal was located at the position of peak abutment pressure. Based on the Omerler Underground Mine M3 working face in Turkey, Yasitli and Unver [6,7] analysed the mechanism of top-coal-drawing. The results show that the uneven distribution of top-coal crushing blocks leads to the complex caving and flow characteristics of top-coal movement, and the trend in solid–fluid movement is different for different distributions of roof coal crushing blocks. Xie and Zhao [5] used PFC2D software to simulate the top-coal caving process and believed that the particle flow numerical method was suitable for use in top-coal caving mining analyses. Vakili [8] used UDEC, 3DEC, and PFC2D numerical simulation software to analyse the cause of top-coal loss. Based on physical similarity simulation test and numerical simulation test results, Wang and Zhang et al. [9,10] concluded that the DB is an ellipsoidal body and that it generates deflection and cutting under the influence of hydraulic supports. Song et al. [11,12] studied the factors influencing top-coal migration by using PFC2D software and believed that the characteristics of the DB and the boundary conditions of top coal were the main factors affecting the top-coal caving process. Zhang et al. [13,14] used DEM to simulate and analyse the coal-drawing process under different termination principles and studied the effects of the dynamic random arch as manifest in the coal-drawing process. Tien et al. [15,16,17] conducted a comprehensive analysis of top-coal migration and presented a detailed discontinuum modelling analysis using a field-scale LTCC model. Zhang et al. [18] believed that, in the coal-drawing process, the movement trajectory of the top-coal block was quasi-linear, and due to the impact of the shield beam and roof structure, the shape of DB was asymmetric. Based on random medium theory, Zhu et al. [19] theoretically derived expressions for the moving boundary of top-coal particles and the shape of the DB and finally obtained a theoretical model for calculating the rate of mining. Wang et al. [20,21] proposed the Boundary–Body-Ratio (BBR) research system of LTCC mining theory, modifying the Bergmark–Roos theoretical model, believing that the DB is a cut-variant ellipsoid, and the boundary between coal and gangue can be fitted with a parabola. Zhang et al. [22] used an FDM–DEM numerical simulation method to simulate the top-coal caving process, believing that the FDM–DEM numerical model composed of particles and blocks as units could better simulate the relationship between the top coal and the roof during caving. Wang et al. [23] observed the movement track of the force chain in top-coal and rock through photoelastic experiment, providing a new experimental idea for the study of top-coal migration.
In previous studies, some researchers have simplified the process of LTCC mining: (1) The top coal was simulated using particles of the same size, which was inconsistent with the distribution of top-coal lumpiness; (2) The process of rotation of the tail beam and retraction of the plunger plate was ignored, and the method of opening at the rear of the support was adopted to simulate the opening of the coal-drawing opening, which is inconsistent with the process of coal-drawing opening on-site. Taking Panel 12309 in Wangjialing coal mine as the research object, the weight of the blocks of caved top coal was measured on-site, and the FDM–DEM numerical model was established. The top-coal migration rule in the first coal-drawing process was revealed from the perspectives of DB, LB, and TCB, which provides a theoretical basis for the further study of common coal-drawing processes.
2. Engineering Background
2.1. General Situation of the Working Face
2.1.1. Geological Aspects
Panel 12309 is located on the west wing of Wangjialing coal mine, with an average burial depth of 260 m. The coal seam is stable and is a simple, near-horizontal structure with an average thickness of 6.5 m. The immediate roof is fine sandstone with an average thickness of 3.54 m, while the main roof is siltstone with an average thickness of 4.2 m. The schematic of the coal seam and roofs [24] is shown in Figure 1.

Figure 1.
Schematic of the coal seam and roofs.
2.1.2. Caving Processes and Equipment
In the mining operation of Panel 12309, the cutting (bottom coal) and caving (top coal) height are 3.0 m and 3.5 m, respectively, the cutting-caving ratio is 1:1.167, and the drawing interval is equal to web cut of shearer (0.865 m). One hundred fifty-two sets of ZFY12000/23/34D two-column top-coal hydraulic supports were arranged on the working face, and the length of the top beam and cover beam of the supports was 7.19 m. When the draw opening was closed, the angle between the tail beam and the horizontal plane was 23°, while when the draw opening was open, the angle between the tail beam and the horizontal plane was 58°. The SGZ-1000/2000 rear-scraper conveyor with the middle width of 1m was adopted. The hydraulic support and scraper conveyors are shown in Figure 2.

Figure 2.
Hydraulic support and rear-scraper conveyor. (a) Draw opening closed. (b) Draw opening opened.
2.2. Measurement of Top-Coal Lumpiness Distribution
2.2.1. Test Purpose
In the process of LTCC, under the influence of mining pressure, the top-coal gradually breaks up, transitioning from a quasi-continuous state to a granular state [25,26]. According to previous research results, the distribution of top-coal lumpiness affects its migration to a certain extent. The migration of top-coal is not the same under different lumpiness distribution conditions. Moreover, due to different geological conditions and mining-production technical conditions, it is difficult to predict the lumpiness distribution of top coal after crushing [27]; therefore, to improve the reliability of the numerical model, it is necessary to install field instrumentation to measure the distribution of top-coal lumpiness in the 12,309 working face.
2.2.2. Test Method
In order to protect the gateways, the top coal near the two ends of the working face will not be caved in LTCC mining. Therefore, 75#, 16#, and 134# hydraulic supports were selected from the middle and two ends of the working face, respectively. We opened the designated coal-drawing opening to draw the top coal and transport it to the stage loader, where the tester takes samples of, and measurements on, the top coal using an explosion-proof electronic scale (Figure 3).

Figure 3.
Field measurement of top-coal mass.
No less than 200 samples of top-coal were randomly selected for each support. First, an explosion-proof electronic scale is used to weigh each block. The equivalent diameter of each block is then calculated using Equation (1).
where d is equivalent particle diameter, M is the mass of a top-coal block, and ρc is the density of the top-coal block.
2.2.3. Test Results
Three hundred fifteen, 240, and 208 groups of data were measured from the 16#, 75#, and 124# hydraulic support respectively, and a total of 763 values were obtained. According to Equation (1), the data were counted, and the results of the number and mass distribution of blocks in different lumpiness ranges were obtained (Figure 4).

Figure 4.
Measured results. (a) Number distribution of blocks. (b) Mass distribution of blocks.
It can be seen from Figure 4a that the maximum lumpiness of top-coal caved by support No. 75 is 24–28 cm, while that from supports No.16 and No.134 is 32–36 cm. The top-coal crushing in the middle of the working face is more complete. In Figure 4b, the equivalent diameter of caved top-coal blocks was divided into four intervals (0–9 cm, 9–18 cm, 18–27 cm, and 27–36 cm), and the mass fractions were 13.83%, 46.31%, 20.34%, and 27.36%, respectively. In the range of 9–18 cm, the mass fraction is the largest, while in the range of 0–9 cm, the mass fraction is the smallest. In the FDM–DEM coupled numerical model, the “Ball” unit in PFC3D was used to simulate the top coal, and the model was established based on the results in Figure 4b.
3. Numerical Simulation
3.1. Numerical Model
The FLAC3D module is called in the PFC3D software to establish the FDM–DEM numerical model of top-caving coal, including the coal seam, immediate roof, main roof, and a set of hydraulic supports and the rear-scraper conveyor. The length, width, and height of the numerical model were 45 m, 1.75 m and 16.1 m, respectively. The top coal and immediate roof were modelled by discontinuous unit (Ball), and the size distribution of top-coal particles conforms to the measured results summarised in Section 2.2. In view of the unmeasurable distribution of the lumpiness of the immediate roof, it was assumed that the equivalent diameter of the immediate roof was four times that of the top coal [7,13,20], with the same probability distribution (Table 1). The bottom coal and the main roof were modelled by continuous unit (Zone). The main roof was located at the top of the whole model, and the unit size was 1 m. Hydraulic supports and the rear-scraper conveyor were simulated by “Wall” elements in PFC3D. In the modelling process, the bottom coal model was first established, and then the top-coal and the immediate roof particles were successively established by means of random particle generation, automatic gravity field balance, and gradual servo-controlled compaction under vertical stress until the actual thickness was reached. The numerical model is shown in Figure 5.

Table 1.
Diameter of top-coal and immediate roof.
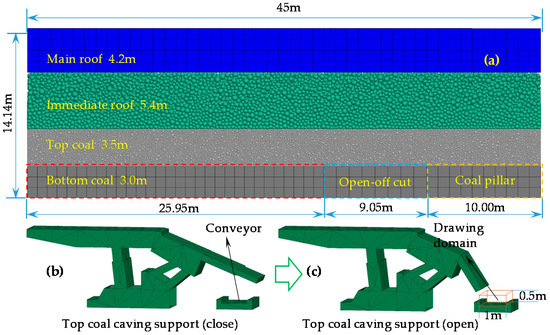
Figure 5.
Numerical model. (a) A profile of the entire model; (b,c) top-coal caving support.
The actual average buried depth of coal seam was 360 m, and the height of the numerical model was 16.1 m; therefore, during the establishment of the initial balance in the model, vertical stress should be applied to the surface of the main roof to simulate the weight of the rock layer with a thickness of 345.86 m lying above. Calculated using an average bulk unit weight for this rock stratum of 22 kN/m3 [24], the main roof should be applied to a vertical stress of 7.57 MPa. Elastic models were used for bottom coal and main roof, and linear models were used for contact between Ball–Ball and Ball–Facet components (Table 2 lists unit parameters; Table 3 lists contact parameters).
Table 2.
Unit parameters [4,24,28].
Table 3.
Contact parameters [9,13,28,29].
The linear model provides the behaviour of an infinitesimal interface that does not resist relative rotation so that the contact moment (Mc) equals zero. The contact force is resolved into linear and dashpot components. The linear component provides linear elastic (no-tension) frictional behaviour, while the dashpot component provides viscous behaviour (Figure 6a). The linear force is produced by linear springs with constant normal and shear stiffnesses, kn and ks. The dashpot force is produced by dashpots with viscosity given in terms of the normal and shear critical-damping ratios, βn and βs. The linear springs act in parallel with the dashpots. A surface gap, gs, is defined as the difference between the contact gap gc and the reference gap gr, so that when the reference gap is zero, the notional surfaces coincide with the piece surfaces (Figure 6b). The contact is active if and only if the surface gap is less than or equal to zero; the force–displacement law is skipped for inactive contacts.

Figure 6.
Linear constitutive model. (a) Behaviour and rheological components of the linear model; (b) surface gap for the linear-based models.
3.2. Numerical Methods
In the numerical simulation, the actual production process used at the LTCC face was fully considered, and the whole numerical calculation process was divided into two stages: a preparation stage and the first coal-drawing stage. Among them, the preparation stage was used to invert the process whereby the bottom coal was cut off without top-coal caving. The first coal-drawing stage was used to invert the first coal-drawing process of the LTCC working face.
In the preparation stage, the excavation of the working face before coal-drawing is simulated, including the extraction of open-off cut and the installation of the hydraulic support and the rear-scraper conveyor (Figure 7). With the coal-drawing opening closed, the operation of cutting bottom coal, shifting supports, and the rear-scraper conveyor shall be carried out in succession. When the moving boundary of the LB reaches the immediate roof, the calculation of the first stage shall be terminated.

Figure 7.
Excavation of open-off cut and equipment installation.
The second stage is the first coal-drawing stage. On the basis of the first stage, the coal-drawing opening is opened, and the calculation is terminated when the immediate roof particle reaches the rear-scraper conveyer. In this stage, the monitoring of each indicator is realised by the FISHCALL function which allows for the FISH function to be executed at a specific point in the cycle sequence during cycling. In the present work, the FISH function is inserted at point −11.0 (before validate data structures in PFC) of each calculation cycle to achieve two ends: (1) delete the particles that fall from the coal opening to the rear-scraper conveyor; (2) when immediate roof particles fall into the scraper conveyor, the calculation will be terminated. The process of numerical simulation is shown in Figure 8.

Figure 8.
Process of numerical simulation.
4. Numerical Simulation Results
4.1. Preparation Stage
After the equipment is installed, the top-coal begins to fall (Figure 9A), and the termination condition of the first stage is reached after cutting the bottom coal and advance the support five times. The boundary of the LB after each extraction was extracted based on the particle displacement of up to 25 mm, as shown in Figure 9.

Figure 9.
Displacement of particles in the first stage.
Figure 9 shows that the boundary of LB expands with the advance of the working face during the preparation stage. The endpoint position of the boundary of the LB is relatively stable and is located at the transition point between the top beam and the cover beam of the support on the side of working face and at the apex of the bottom coal pillar on the side of the goaf. Before moving the support, the maximum height of the LB is 1.27 m (Figure 9A). After moving the support, the maximum height of LB increases continuously, and the rate of increase thereof decreases over time. The boundary of the LB reaches the immediate roof after the fourth support-shifting operation, and the particles in the immediate roof move locally after the fifth support-shift.
4.2. First Coal-Drawing Stage
4.2.1. Evolution of the DB
- Total DB
The total DB refers to all top-coal particles caved from the drawing opening during the first coal-drawing stage. In the numerical simulation, the first coal-drawing stage lasted for 64.72 s, with an error of 10.1% from the actual average first coal-drawing time of 72 s, which was divided into eight time intervals, and the caved particles in each interval were grouped (Figure 10).

Figure 10.
Shape of the total drawing body (DB) in the first coal-drawing stage. (a) DB in the model after initial equilibrium; (b) DB in the model before coal-drawing.
In Figure 10, the shape of the total DB is shown in the model after initial equilibrium (Figure 10a) and the model before coal-drawing (Figure 10b). In the model after initial equilibrium, the total DB protrudes at the side of the goaf (yellow line in Figure 10a), while in the model before coal-drawing, it is a smooth curve (yellow line in Figure 10b); on the side of the working face, the curves delimiting the shape of the total DB in the two models coincide. In the model after initial equilibrium and the model before coal-drawing, the position of the immediate roof particles caved at the end of coal-drawing all deflected to goaf relative to the centreline of the rear-scraper conveyor, and the deflection angle by the highest particle that moves was consistent (4°). The maximum horizontal width and vertical height of the total DB at each time point were extracted and the data plotted (Figure 11a). The vertical line at the mid-point of the rear-scraper conveyor was taken as the axis for extraction of the range of the total DB at each time point on the working face and goaf side, and the histogram was thereof plotted (Figure 11b).

Figure 11.
Evolution of the total DB. (a) Maximum horizontal width and vertical height of the total DB; (b) width of the total DB at each time point on the working face and goaf side.
It can be seen from Figure 11a that the height (hTDB) and width (LTDB) of the total DB increase continuously with the increase of the coal-drawing time (t). Among them, hTDB and t conform to an exponential relationship, while LTDB and t conform to a linear relationship as follows:
In the first coal-drawing process, the rate of change of LTDB is constant, while that of hTDB gradually decreases. It can be seen from Figure 11b that, after 8.09 s of coal-drawing, LTDB in the goaf side (1.67 m) is smaller than the width of the working face (2.06 m). With the increase of coal-drawing time, the LTDB towards both the working face and the goaf side expand constantly. On the side of the working face, LTDB increases from 2.06 m to 4.13 m (an increase of 100.49%). On the side of the goaf, LTDB increased from 1.67 m to 3.89 m, increasing by 133%. As affected by the hydraulic support, the top coal is more likely to be caved on the working face side with lower frictional resistance, so LTDB on the working face side is always larger than that on the goaf side. On the working face side, the scope of the DB is limited by the hydraulic support, so the rate and amount of expansion on the goaf side are slightly higher than those on the working face side.
- Interval DB
The interval DB refers to the top-coal blocks caved by the coal-drawing opening within a specific time interval. The first coal-drawing stage was divided into eight time intervals, and the top-coal particle information relating to caved-in material in each time interval was extracted and marked in the initial model (Figure 12).

Figure 12.
Shape of the interval DB.
Figure 12 shows that, except for the first interval (0–8.09 s), the interval DB was an ellipsoidal cut inclined to the working face. In addition, at the initial stage of coal-drawing, the horizontal width (LIDB) and vertical height (hIDB) of the interval DB both exceeded those in the later stage. The width (LIDB) and height (hIDB) of the shape of interval DB in each interval were extracted and plotted (Figure 13a). The volume of particles caved in each interval was extracted and the histogram plotted (Figure 13b).

Figure 13.
Evolution of the shape of the interval DB. (a) Maximum horizontal width and vertical height of the interval DB; (b) volume of particles caved in each interval.
Figure 13a shows that both LIDB and hIDB first decrease and then tend to be stable with increasing coal-drawing time, and they follow exponential relationships therewith as follows:
In the first coal-drawing process, LIDB decreased faster and by more than hIDB. It can be seen from Figure 13b that, in the initial stage of coal-drawing (0–8.09 s), the amount of coal in the DB was at its maximum, reaching 7.18 m3 (0.89 m3/s), and it then decreased to a stable value of 0.44 m3/s. That is, when the coal-drawing opening was just opened, the amount of top-coal caved was maximised, gradually decreased, and then tended to be stable.
4.2.2. Evolution of the LB
The LB refers to the loose part caused by the migration of surrounding coal and rock to the mined-out space during mining. The shape of the LB at nine time points was extracted based on the particle displacement of up to 25 mm (Figure 14).

Figure 14.
Shape of the loose body (LB).
Figure 14 shows that in the coal-drawing process, the LB expands to varying degrees in both horizontal and vertical directions. At the beginning of coal-drawing (t = 0), as affected by the preparation stage, the horizontal width of the LB (LLB) was 8.53 m, and the vertical height of the LB (hLB) was 6.79 m. At the end of coal-drawing, LLB was 16.90 m (an increase of 98.12%) and hLB was 9.22 m (an increase of 35.79%). The width (LLB) and height (hLB) of the LB at each time point were extracted (Figure 15a). The vertical line at the mid-point of the rear-scraper conveyor was taken as the axis from which to extract the range of the LB at each time point on the working face and goaf side, and the histogram was plotted (Figure 15b).

Figure 15.
Evolution of the LB. (a) Maximum horizontal width and vertical height of the LB; (b) width of the LB at each time point on the working face and goaf side.
As shown in Figure 15a, the height (hLB) and width (LLB) of the LB increase continuously with the increase of the coal-drawing time (t). Among them, hLB and t conform to an exponential relationship, while LLB and t conform to a linear relationship as follows:
In the first coal-drawing process, the rate of increase of LLB was constant, while that of hLB gradually decreased. It can be seen from Figure 15b that, at the beginning of the first coal-drawing, the LLB in the goaf side (5.92 m) exceeded the width of the working face (2.61 m). With increased coal-drawing time, LLB both towards the working face and the goaf side expanded constantly. On the side of the working face, LLB increased from 2.61 m to 7.69 m, increasing by 1.95 times. On the side of the goaf, LLB increased from 5.92 m to 9.21 m (an increase of 55.57%). The rate of expansion of the LB on the working face side was significantly higher than that on the goaf side.
4.2.3. Evolution of TCB
TCB refers to the boundary surface between coal and gangue. The immediate roof particle size distribution and boundary shape at each time point were extracted. A Cartesian coordinate system was established with the mid-point of the rear-scraper conveyor as the origin, the floor as the x-axis, and the vertical line as the y-axis (Figure 16).

Figure 16.
Shape of the top-coal boundary (TCB).
Figure 16 shows that in the first coal-drawing process, the range of movement of the TCB gradually increased, and its lowest point gradually dropped to the rear-scraper conveyor. The range of movement of the TCB increased 1.86 times from 5.45 m at the beginning of coal-drawing to 15.59 m at the end of coal-drawing. The vertical distance between the TCB and rear-scraper conveyor is 6.12 m at the beginning of coal-drawing. At the end of coal-drawing, the TCB intersects the rear-scraper conveyor (that is, the immediate roof particles were caved by the rear-scraper conveyor). To show the evolution of the TCB more intuitively, the morphology of the TCB at each time point is plotted (Figure 17).

Figure 17.
Evolution of the TCB.
Figure 17 shows that, within the range of about 1.5 m from the end of the top beam of the hydraulic support, the TCB is stable after drawing coal at 16.18 s (brown dotted line in the figure). The TCB on the working face side underwent the most significant evolution above the back part of shield beam and coal-drawing opening. On the side of the goaf, the TCB gradually developed downward, and its rate of growth gradually decreased. As affected by the preparation stage, the TCB as shown at t = 0 is formed, and its lowest point is inclined towards the goaf. The TCB began to evolve from the above position. The evolution track of the lowest point position of TCB is shown as the red dotted line in the figure, which is quasi-parabolic and gradually approaches the centreline of the rear-scraper conveyor (blue dotted line). We extracted the moving span (LTCB) and minimum height (hTCB) of the TCB (Figure 18a). The vertical line at the mid-point of the rear-scraper conveyor was taken as the axis to extract the range of the TCB at each time point on the working face and goaf side, and the histogram was plotted (Figure 18b).

Figure 18.
Evolution of the TCB. (a) Moving span and minimum height of the TCB; (b) width of the TCB at each time point on the working face and goaf side.
As shown in Figure 18a, the moving span of the TCB (LTCB) increases with prolonged coal-drawing time (t). The minimum height of the TCB (hTCB) decreases with prolonged coal-drawing time (t). There is an exponential relationship between LTCB and t, and hTCB has a linear relationship with t.
In the first coal-drawing process, the rate of increase of the moving span of the TCB gradually decreases, while the rate of decrease of the lowest height is unchanged in the first and middle stages of coal-drawing and increases slightly at the end of coal-drawing. According to Figure 18b, as influenced by the preparation stage, at the beginning of coal-drawing, the range of LTCB on the goaf side (5.3 m) exceeds that on the working face side (0.51 m). With the beginning of the first coal-drawing operation, the range of movement of the TCB expands on both the working face side and the goaf side. On the side of the working face, LTCB increased from 0.51 m to 6.95 m, increasing by 12.63 times. On the side of the goaf, LTCB increased from 5.30 m to 8.64 m (an increase of 63.02%). The rate of expansion of the range of movement of the TCB on working face side is significantly higher than that on the goaf side.
5. Discussion
5.1. Coal-Drawing Sensitivity
The fitting equations of parameters of total DB, interval DB, LB, and TCB and coal-drawing time are summarised in Table 4.
Table 4.
Summary of fitting results.
Herein, the first coal-drawing is divided into eight equal time intervals. The fitting results for LIDB and hIDB are exponential functions; therefore, in the early stage of the first coal-drawing, due to the sudden opening of the coal-drawing opening, a large amount of top-coal is caved, exceeding that subsequently (Figure 13b).
The relationship between the acceleration of each parameter in the evolution process and the drawing time is helpful to analyse the sensitivity of each parameter to time in the whole process. Therefore, the second derivative of each parameter with respect to t is taken as its coal-drawing sensitivity (η), and the results (Table 4) are discussed. The sensitive–y curves of each parameter are shown in Figure 19.

Figure 19.
Sensitivity curve.
As shown in Figure 19, the height of the total DB, the height of the LB, and the moving width of the TCB are more sensitive to the coal-drawing time. The sensitivity of the DB is such that ηDB = (8.89 × 10⁻³)e−0.048t, the sensitivity of the LB is such that ηLB = (4.31 × 10⁻³)e−0.041t, and the sensitivity of the TCB is such that ηTCB = (8.69 × 10⁻³)e−0.027t. Due to the large volume of top-coal caved in the initial stage (0–8.09 s), the rate of change of the aforementioned parameters increased, and the sensitivities reached 6.02 × 10⁻³, 3.09 × 10⁻³, and 6.99 × 10⁻³, respectively.
5.2. Geometry of the Numerical Model
The width of the numerical model is 1.75 m, which is equal to the width of a top-coal-caving hydraulic support. Only the caving process of a single hydraulic support is simulated in our manuscript. In this work, 2D simulation is carried out by using 3D numerical software, and the reasons are as follows:
- (1)
- In most of the theoretical researches on top-coal caving, many researchers have simplified the three-dimensional problem to a plane problem. Based on reasonable simplification of the problem, the influence of various factors on the top-coal caving process has been eliminated to achieve more targeted research on the caving process.
- (2)
- We have drawn from the experience of numerical simulation that the 2D model has drawbacks in dealing with top-coal caving. When the particles vary greatly in size, the gap between the particles will increase significantly in the 2D model, which adversely affects the contact between the particles. Moreover, the simulated particles are all spheres, and their arrangement regularity is too strong in the 2D state. Therefore, the top-coal drawing body cannot form similar ellipsoid and is closer to the diamond. As a result, the various parameters cannot be simulated well in the 2D model. For these reasons, 3D software was selected instead of 2D software in our work.
5.3. Numerical Simulation Process
The numerical model and simulation process in this paper are deficient in the following two aspects:
- (1)
- In the present work, we analysed only the first round of top-coal drawing; however, in the in situ condition, it is more important to analyse the drawing procedures after the first drawing. Based on this paper, we will further establish a common top-coal drawing model and carry out in-depth researches on the top-coal drawing process after the first top-coal drawing.
- (2)
- So far, we have modelled the top coal and immediate roof with a linear model, which indicates that the top coal is already in a granular state. The undercut of bottom coal will not influence the progressive fracturing of the top coal anymore. The emphasis of our work is on the migration rule of the discontinuous crushed top coal. Of course, we firmly believe that it is the best solution if the failure process, migration rule, and drawing characteristics of top-coal can be simulated in one numerical model. However, there is still no scientific method to realize the above process, and it will become an important work of our future research.
6. Conclusions
Taking the working face 12309 of Wangjialing Coal Mine as the engineering background and based on in situ measurements of top-coal lumpiness, the “continual-discontinuity” numerical model was established, and the first coal-drawing process was numerically simulated. The numerical calculation process was divided into two stages: a preparation stage and the first coal-drawing stage. The main conclusions are as follows:
- The equivalent weighing method was used to measure the distribution of top-coal lumps in situ. The number of top-coal lumps was inversely proportional to their equivalent diameter. The equivalent diameter was divided into four intervals (0–9 cm, 9–18 cm, 18–27 cm, and 27–36 cm), and their mass fractions were 13.83%, 46.31%, 20.34%, and 27.36%, respectively.
- In the preparation stage, five bottom-coal cutting and support advances were involved, and the range of the LB expanded to the immediate roof. The height of the LB expanded from 1.27 m to 3.43 m.
- Based on the simulated results of the preparatory stage, the evolutions of the total DB, interval DB, LB, and TCB were analysed. The width of the total DB increased from 3.73 m to 8.02 m, increasing by 1.15 times. In contrast, the interval DB was larger in the early stage and smaller in the later stage. The amount of caved coal in the first interval (0–8.09 s) was 7.18 m3, and this then gradually decreased, while the amount caved in the seventh interval (46.54–56.63 s) was 2.87 m3, being the least amount. The moving width of the TCB increased from 5.45 m to 15.59 m (an increase of 1.86 times). The height of the TCB decreased from 6.12 m to 0 m (caved from the rear-scraper conveyer). The width of the LB increased from 8.53 m to 16.90 m (an increase of 98.12%), and the height of the LB increased from 6.79 m to 9.22 m (an increase of 35.79%).
- The relationship between the characteristic parameters of the total DB, interval DB, LB, and TCB and the coal-drawing time was fitted. The second derivative of each parameter with respect to time was taken as its sensitivity. It was concluded that the height of the total DB, the height of the LB, and the moving width of the TCB were more sensitive to the coal-drawing time. Due to the large volume of top-coal caved in the initial stage (0–8.09 s), the rates of change of the aforementioned parameters increased, and the sensitivities reached 6.02 × 10⁻³, 3.09 × 10⁻³, and 6.99 × 10⁻³, respectively.
- In this paper, the evolution law of DB, LB, and TCB of top-coal in the first coal drawing process was obtained, but the numerical model still needs to be improved to carry out in-depth research on the top-coal drawing process after the first top-coal drawing, as does a scientific method to realize the process that takes failure process, migration rule, and drawing characteristics of top-coal into account simultaneously.
Author Contributions
Conceptualization, Y.H., D.Z. and X.S.; methodology, X.S.; software, Y.H. and D.Z.; validation, Y.H., D.Z. and X.S.; formal analysis, Y.H., D.Z. and X.S.; investigation, Y.H., D.Z. and X.S.; resources, X.S.; data curation, Y.H.; writing—original draft preparation, D.Z. and X.S.; writing—review and editing, Y.H.; visualization, Y.H.; supervision, D.Z.; project administration, X.S.; funding acquisition, D.Z. and X.S. All authors have read and agreed to the published version of the manuscript.
Funding
This research was funded by Independent Research Projects of State Key Laboratory of Coal Resources and Safe Mining, grant number SKLCRSM19KF019; by National Natural Science Foundation of China, grant number 51904200, 51874281, and 51574174; by Scientific and Technological Innovation Programs of Higher Education Institutions in Shanxi, grant number 2019L0183.
Conflicts of Interest
The authors declare no conflict of interest.
Abbreviations
| FDM | Finite difference method |
| DEM | Discrete element method |
| LB | Loose body |
| DB | Drawing body |
| TCB | Top-coal boundary |
| LTCC | Longwall top-coal caving |
| MSL | Multi-Slice Longwall |
| SPL | High Reach Single Pass Longwall |
| BBR | Boundary–Body-Ratio |
| d | Equivalent particle diameter (m) |
| M | Mass of a top-coal block (kg) |
| ρc | Density of the top-coal block (kg m−3) |
| t | Coal-drawing time (s) |
| hTDB | Height of the total DB (m) |
| LTDB | Width of the total DB (m) |
| hIDB | Height of the interval DB (m) |
| LIDB | Width of the interval DB (m) |
| hLB | Height of the LB (m) |
| LLB | Width of the LB (m) |
| hTCB | Minimum height of the TCB (m) |
| LTCB | Moving span of the TCB (m) |
| ηDB | Sensitivity of the DB |
| ηLB | Sensitivity of the LB |
| ηTCB | Sensitivity of the TCB |
References
- Wang, J.; Yu, B.; Kang, H.; Wang, G.; Mao, D.; Liang, Y.; Jiang, P. Key technologies and equipment for a fully mechanized top-coal caving operation with a large mining height at ultra-thick coal seams. Int. J. Coal Sci. Technol. 2015, 2, 97–161. [Google Scholar] [CrossRef]
- Wang, J.C. Engineering practice and theoretical progress of top-coal caving mining technology in China. J. China Coal Soc. 2018, 43, 43–51. [Google Scholar]
- Alehossein, H.; Poulsen, B.A. Stress analysis of longwall top coal caving. Int. J. Rock Mech. Min. 2010, 47, 30–41. [Google Scholar] [CrossRef]
- Xie, H.; Chen, Z.; Wang, J. Three-dimensional numerical analysis of deformation and failure during top coal caving. Int. J. Rock Mech. Min. 1999, 36, 651–658. [Google Scholar] [CrossRef]
- Xie, Y.S.; Zhao, Y.S. Numerical simulation of the top coal caving process using the discrete element method. Int. J. Rock Mech. Min. 2009, 46, 983–991. [Google Scholar] [CrossRef]
- Unver, B.; Yasitli, N. Modelling of strata movement with a special reference to caving mechanism in thick seam coal mining. Int. J. Coal Geol. 2006, 66, 227–252. [Google Scholar] [CrossRef]
- Yasitli, N.E.; Unver, B. 3D numerical modeling of longwall mining with top-coal caving. Int. J. Rock Mech. Min. 2005, 42, 219–235. [Google Scholar] [CrossRef]
- Vakili, A.; Hebblewhite, B.K. A new cavability assessment criterion for Longwall Top Coal Caving. Int. J. Rock Mech. Min. 2010, 47, 1317–1329. [Google Scholar] [CrossRef]
- Wang, J.; Yang, S.; Li, Y.; Wei, L.; Liu, H. Caving mechanisms of loose top-coal in longwall top-coal caving mining method. Int. J. Rock Mech. Min. Sci. 2014, 71, 160–170. [Google Scholar] [CrossRef]
- Wang, J.; Zhang, J.; Song, Z.; Li, Z. Three-dimensional experimental study of loose top-coal drawing law for longwall top-coal caving mining technology. J. Rock Mech. Geotech. Eng. 2015, 7, 318–326. [Google Scholar] [CrossRef]
- Song, Z.; Zhang, J. Numerical Simulation of Top-Coal Thickness Effect on the Top-CoalRecovery Ratio by Using DEM Method. Electron. J. Geotech. Eng. 2015, 20, 3795–3796. [Google Scholar]
- Song, Z.Y.; Wei, W.J.; Zhang, J.W. Numerical investigation of effect of particle shape on isolated extracted zone (IEZ) in block caving. Arab. J. Geosci. 2018, 11, 310. [Google Scholar] [CrossRef]
- Zhang, N.B.; Liu, C.Y.; Wu, X.J.; Ren, T.X. Dynamic Random Arching in the Flow Field of Top-Coal Caving Mining. Energies 2018, 11, 1106. [Google Scholar] [CrossRef]
- Zhang, N.B.; Liu, C.Y.; Yang, P.J. Flow of top coal and roof rock and loss of top coal in fully mechanized top coal caving mining of extra thick coal seams. Arab. J. Geosci. 2016, 9, 465. [Google Scholar] [CrossRef]
- Le, T.D.; Mitra, R.; Oh, J.; Hebblewhite, B. A review of cavability evaluation in longwall top coal caving. Int. J. Min. Sci. Technol. 2017, 27, 907–915. [Google Scholar] [CrossRef]
- Le, T.D.; Oh, J.; Hebblewhite, B.; Zhang, C.; Mitra, R. A discontinuum modelling approach for investigation of longwall top coal caving mechanisms. Int. J. Rock Mech. Min. 2018, 106, 84–95. [Google Scholar] [CrossRef]
- Le, T.D.; Zhang, C.G.; Oh, J.; Mitra, R.; Hebblewhite, B. A new cavability assessment for Longwall Top Coal Caving from discontinuum numerical analysis. Int. J. Rock Mech. Min. 2019, 115, 11–20. [Google Scholar] [CrossRef]
- Zhang, J.W.; Wang, J.C.; Wei, W.J.; Chen, Y.; Song, Z.Y. Experimental and numerical investigation on coal drawing from thick steep seam with longwall top coal caving mining. Arab. J. Geosci. 2018, 11, 96. [Google Scholar] [CrossRef]
- Zhu, D.J.; Chen, Z.H.; Du, W.S.; Zhang, L.F.; Zhou, Z.H. Caving mechanisms of loose top-coal in longwall top-coal caving mining based on stochastic medium theory. Arab. J. Geosci. 2018, 11, 621. [Google Scholar] [CrossRef]
- Wang, J.C.; Wei, W.J.; Zhang, J.W. Effect of the size distribution of granular top coal on the drawing mechanism in LTCC. Granul. Matter 2019, 21, 70. [Google Scholar] [CrossRef]
- Wang, J.C.; Zhang, J.W.; Li, Z.L. A new research system for caving mechanism analysis and its application to sublevel top-coal caving mining. Int. J. Rock Mech. Min. 2016, 88, 273–285. [Google Scholar] [CrossRef]
- Zhang, Q.L.; Yue, J.C.; Liu, C.; Feng, C.; Li, H.M. Study of automated top-coal caving in extra-thick coal seams using the continuum-discontinuum element method. Int. J. Rock Mech. Min. 2019, 122, 104033. [Google Scholar] [CrossRef]
- Wang, J.A.; Yang, L.; Li, F.; Wang, C. Force chains in top coal caving mining. Int. J. Rock Mech. Min. Sci. 2020, 127, 104218. [Google Scholar] [CrossRef]
- Huo, Y.M.; Song, X.M.; Sun, Z.D.; Wang, Z.L.; Li, H.C. Evolution of mining-induced stress in fully mechanized top-coal caving under high horizontal stress. Energy Sci. Eng. 2020, 8, 2203–2215. [Google Scholar] [CrossRef]
- Zhu, D.F.; Wu, Y.H.; Liu, Z.H.; Dong, X.Q.; Yu, J. Failure mechanism and safety control strategy for laminated roof of wide-span roadway. Engineering Failure AnalysisInt. Eng. Fail. Anal. 2020, 111, 104489. [Google Scholar] [CrossRef]
- Zhu, D.F.; Song, X.M.; Li, H.C.; Liu, Z.H.; Wang, C.; Huo, Y.M. Cooperative load-bearing characteristics of a pillar group and a gob pile in partially caved areas at shallow depth. Energy Sci. Eng. 2020, 8, 89–103. [Google Scholar] [CrossRef]
- Bai, Q.S.; Tu, S.H.; Wang, F.T. Characterizing the Top Coal Cavability with Hard Stone Band(s): Insights from Laboratory Physical Modeling. Rock Mech. Rock Eng. 2019, 52, 1505–1521. [Google Scholar] [CrossRef]
- Song, Z.; Konietzky, H. A particle-based numerical investigation on longwall top coal caving mining. Arab. J. Geosci. 2019, 12, 556. [Google Scholar] [CrossRef]
- Song, Z.; Konietzky, H.; Herbst, M. Drawing mechanism of fractured top coal in longwall top coal caving. Int. J. Rock Mech. Min. Sci. 2020, 130, 104329. [Google Scholar] [CrossRef]
Publisher’s Note: MDPI stays neutral with regard to jurisdictional claims in published maps and institutional affiliations. |
© 2020 by the authors. Licensee MDPI, Basel, Switzerland. This article is an open access article distributed under the terms and conditions of the Creative Commons Attribution (CC BY) license (http://creativecommons.org/licenses/by/4.0/).