Article

Assessment of Greenhouse Gases and Pollutant Emissions in the Road Freight Transport Sector: A Case Study for São Paulo State, Brazil

by
Pedro Gerber Machado
1,2,*,
Ana Carolina Rodrigues Teixeira
2,
Flavia Mendes de Almeida Collaço
3,
Adam Hawkes
1 and
Dominique Mouette
2,3
1
Chemical Engineering Department, Imperial College London, London SW7 2AZ, UK
2
Institute for Energy and Environment, Universidade de São Paulo, São Paulo SP 05508-010, Brazil
3
School of Arts, Sciences and Humanities, Universidade de São Paulo, São Paulo SP 03828-000, Brazil
*
Author to whom correspondence should be addressed.
Energies 2020, 13(20), 5433; https://doi.org/10.3390/en13205433
Submission received: 28 August 2020 / Revised: 6 October 2020 / Accepted: 13 October 2020 / Published: 18 October 2020
(This article belongs to the Special Issue Changes of Global Energy Systems)

Abstract

:
This study analyzes the road freight sector of São Paulo state to identify the best options to reduce greenhouse gases emissions and local pollutants, such as particulate matter, nitrogen oxides, carbon monoxide, and hydrocarbons. Additionally, the investment cost of each vehicle is also analyzed. Results show that electric options, including hybrid, battery, and hydrogen fuel-cell electric vehicles represent the best options to reduce pollutants and greenhouse gases emissions concomitantly, but considerable barriers for their deployment are still in place. With little long-term planning on the state level, electrification of the transport system, in combination with increased renewable electricity generation, would require considerable financial support to achieve the desired emissions reductions without increasing energy insecurity.

Graphical Abstract

1. Introduction

The transportation sector requires considerable analysis for energy-environmental planning [1,2], involving scenario creation to represent alternatives [3,4], data gathering on technologies from vehicles to fuel production pathways [5,6], and adequate representation of policy and regulation and other mechanisms of system change [7]. It is also an important sector, with very rapid growth in developing countries where energy-environmental planning is needed the most. However, the required relevant analyses to support robust decision making are usually limited or unavailable in these countries [8].
Authors have preferred studies applying models on the national level in previous works, which indicates that the subnational scale lacks literature, especially in developing countries. Alongside this, the pace in which technological advancements in recent have occurred in recent years has been underwhelming. It is then apparent that accelerating mitigation actions in the short-term is necessary, requiring the private sector’s urgent involvement and greater engagement by subnational governments.
Furthermore, changes in behavior by consumers and promoting technological changes in the transport sector, such as fleet electrification, are most important in developing countries. Therefore, Latin American, African, and Southeast Asian countries are essential objects of research at the national or regional level. Based on their characteristics and energy infrastructure, analyzing these countries and their potential scenarios would help reach the sustainable development goals [9]. Notwithstanding, without the short-term actions necessary, the expected population growth and rise in energy consumption are most likely to increase greenhouse gases (GHG) emissions and the slow pace of technological progress experienced in these countries [10]. Furthermore, there is a need to assess the emission of GHG and its effects on climate change, and also the emission of air pollutants [11,12,13], which have dangerous impacts on human health [14,15], in order to guide further adjustments in the energy infrastructure to promote energy development with lower environmental and health burdens [13,16,17].
As the use of internal combustion engines in transport increases, air pollution from motor vehicles has rapidly become a major environmental issue in big cities of the developing world [18], which increases the complexity of the road transport’s environmental problem. Although much research has been focused on GHG emissions from the transport sector [19,20,21], modeling pollutant emissions in conjunction with GHG emissions have different outputs, especially for developing countries, where health issues are most evident [22].
By considering the complexity of the problem in the energy–environment–transport nexus, this study aims to comprehensively analyze the alternative options for the road transport sector regarding GHG emissions and significant local pollutants—particulate matter (PM), nitrogen oxides (NOx), hydrocarbon (HC), and carbon monoxide (CO)—for the State of São Paulo, Brazil, with 2050 as a time horizon. Precisely because of the need for more studies on the local level in developing countries [9], this study presents an essential contribution to the current discussion of the environmental burden of the transport sector. Using the Low Emissions Analysis Platform (LEAP) model, São Paulo future transport system is compared with six alternative options for medium and heavy-duty trucks (MHDT), being liquified natural gas (LNG), compressed natural gas (CNG), biodiesel, fuel-cell electric, and battery electric vehicles. As will be seen in the literature review, subnational studies of this magnitude, including pollutants and GHG emissions, with a comprehensive set of alternative options, lack literature, and this study tries to fill that gap.
This paper follows a classic structure, with a literature review (Section 2), a methodology section (Section 3), results (Section 4), a discussion section that deals with the shortcomings of the paper and the barriers to deploying the best options for the transport sector, and conclusions (Section 6).

2. Literature Review

Several studies [23,24,25] around the world have been developed using energy planning models such as LEAP in order to evaluate different scenarios for future energy consumption and carbon emissions [26]; to forecast electricity demand [24]; to evaluate the impacts of technological changes [27,28]; energy and urban planning solutions [25]; to develop policies for low carbon development [29,30]. Moreover, the use of energy planning models is essential to identify possibilities through the scenarios built for different sectors, considering the energy supply and demand and a tool to analyze future policies [30].
Considering the transport sector, some authors have studied changes in fuel share to reduce fossil fuel consumption to reach goals related to emissions reduction [31,32], vehicle efficiency improvement [33,34], changes in vehicle technology (e.g., electric vehicles) [35,36,37], and the use of alternative fuels [38,39]. In general, the motivation of these studies is to serve as evidence to support policy recommendations, where the use of the models brings data and insight to help evaluate policy feasibility [26,40,41].
Studies that use the LEAP model to perform scenarios for transport, such as Chollacoop et al. [42], evaluate the use of fuel mixes. This study was developed to analyze measures that have been implanted in Thailand, and results show that fuel mixing (in this case 95% ethanol and 5% diesel) helps to increase the demand for alternative fuels and decrease fossil fuel consumption, reduce GHG emissions, and improve the national energy security.
Another example is the work done by Zhang, Feng, and Chen [26], who analyzed different pathways to evaluate the energy savings and emissions mitigation in China for the period between 2007 and 2030. Some policy measures were considered in an integrated scenario for the transport sector, such as the modal shift, vehicle efficiency improvements, and energy substitution, including hybrid, fuel cell (hydrogen) for taxis, compressed natural gas (CNG) for buses and passenger vehicles. Results showed that the implementation of these policies could help to reduce the growth rate of total energy consumption by 1.76% and energy intensity by 4.73% when compared to a reference scenario (without policy measures). Moreover, the transport sector showed the potential to reduce total consumption by almost 15% and carbon emissions by 20%. Hu, Ma, and Ji [29] is another example of combined measures such as alternative fuels and vehicles, and public transport, which was shown to be crucial in reaching a sustainable system and reducing energy consumption and supply. The transport and industry sectors were identified as critical players in the potential for energy saving and carbon mitigation. In Brazil, Collaço, Dias, et al. [43] evaluated the future energy system for the São Paulo megacity using different pathways to increase renewable and endogenous sources for different sectors. Scenarios were modeled for the transport sector considering public transport, renewable energy use such as biodiesel and ethanol, and bicycles. The elimination of fossil fuel in public transport found were to reduce GHG emissions, and the increase in electric vehicles leads to better air quality and public health and reduces GHG and traffic congestion.
Costa et al. [44] assessed the introduction of electric vehicles in the city of São Paulo and compared them to the use of ethanol in order to evaluate the benefits of this change. Four different scenarios were performed considering different stages of the electric vehicles’ introduction. The scenario which considers the replacement of 25% of gasoline-powered vehicles by electric vehicles in 2030 showed that energy consumption could be reduced around 15%, and CO2 emissions around 26% compared to the values in 2015. The authors concluded that electric vehicles could be an excellent way to mitigate emissions.
Dias et al. [45] also studied the impact of electric vehicles in São Paulo. However, this paper analyzes the impacts on electricity demand and emissions. Scenarios were analyzed considering the introduction of 10%, 30%, and 100% in vehicles fleet to compare to a base scenario without electric mobility. Results showed that in a scenario with 10% of electric vehicles introduced in the fleet, electricity demand increases by 2%, and CO2e emissions reduce by 1.3%. From the literature review, it is clear that there is a gap in analyses focused on the road freight transport sector, especially when it comes to comparing options to designate appropriate public policies comprehensively. Next, the methodology used for this analysis will be explained.

3. Methodology

3.1. The Low Emissions Analysis Platform (Previously Called Long-Range Energy Alternatives Planning System) (LEAP)

LEAP is a simulation and optimization energy-economy model that builds energy scenarios using a hybrid of top-down and bottom-up data. LEAP uses energy demand and primary energy transformation data for the energy supply sector (transmission and distribution, primary energy conversion, and energy resource extraction data) [46].
The model is used to estimate GHG emissions from energy use and production and local and regional air pollutants. The LEAP model also allows analysis of the impacts of adopting different energy policies on GHG emissions, energy savings, and the reduction of local air pollution [46]. More information on LEAP is available in [46] and [47].
The main exogenous inputs for the São Paulo state LEAP model for the transport sector are (1) energy demand; (2) energy infrastructure characteristics, such as efficiency and availability of existing and future energy-related technologies; (3) sources of primary energy supply, and the corresponding planed future potential; (4) final energy imports into the city (electricity, ethanol, biodiesel, diesel, gasoline, and other fossil fuels); (5) policy and infrastructure constraints [46,47,48]. Finally, energy demand projection has been estimated based on the official Brazilian GDP projection obtained from [49] from 2014 until 2050.

3.2. Alternative Technologies for the Road Freight Sector

As previously mentioned, there is a need for inputs from several databases to perform energy-environmental models, including pollutant emission factors. In order to fill gaps regarding factors, a systematic review was performed based on papers found on Scopus and Web of Science database during the period from 2015 to 2020.
Only papers in English were considered. A combination of keywords (alternative fuel, natural gas, electric, fuel cell, hydrogen heavy-duty vehicle, truck, commercial vehicle, air pollution, greenhouse gas emission, economic analysis, interview) were used considering the goals of this study. Papers without quantitative analysis were not considered.
In the first moment, a total of 2631 papers were found, and, after removing duplicates, screening the papers by title/abstracts, and a full-text review, 86 papers were considered eligible for this study. Data extraction and analysis were performed using Microsoft Excel to obtain fuel processing data, emission factors, and costs related to heavy-duty trucks. Figure 1 shows the systematic review steps.
The resulting values for each of the environmental aspects are shown in Table 1. Values for CNG, LNG, and biodiesel were compiled for all pollutants and GHGs. For the electric options, fuel consumption was derived from the review, and no combustion emissions exist in the demand phase. The hybrid option, however, did not have consistency in the emission factors available, and as per Askin et al. [34], a ratio between diesel and hybrid engines was applied, taking account of the São Paulo reality.
The next section will present the current São Paulo state energy system, focusing on the infrastructure necessary to satisfy the demand for diesel and the alternative options under analysis.

3.3. São Paulo State Energy System

São Paulo is one of the 26 States in Brazil and is the richest in the country, with 34% of its GDP [54] and the second-highest GDP per capita [55]. With such economic importance, the State of São Paulo is the largest consumer of diesel oil, responsible for 20% of all sales in the country in 2014 [56]. Additionally, São Paulo has the most developed energy system infrastructure in the country and imports crude oil and natural gas for processing in its six facilities.
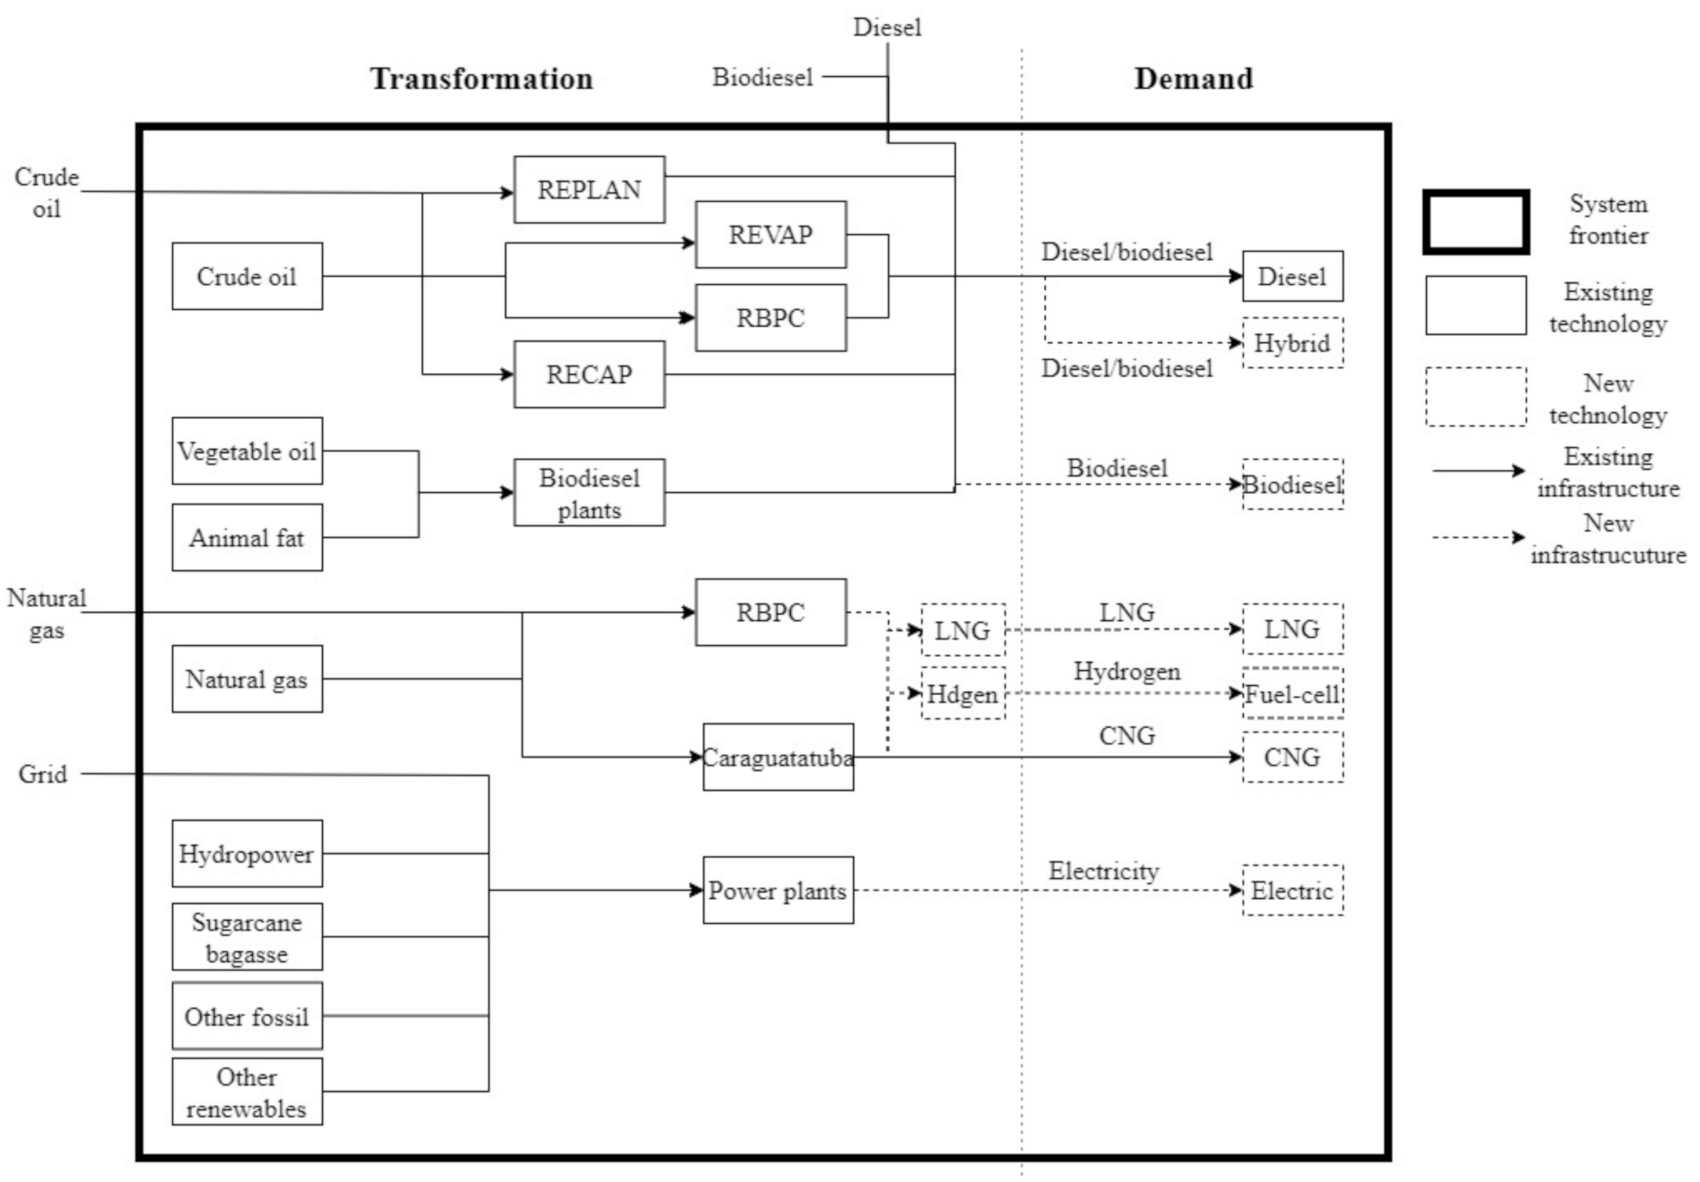
For the modeling design exercise, it is necessary to have vehicles available for the consumer and the future alternative fuels for the transport sector. Figure 2 shows the State’s energy system frontier, the existing technologies in the demand side, and the transformation side for the transport sector and the new technologies and infrastructure analyzed.
As seen in Figure 2, technological options for the base year (2014) were limited only to diesel engines. Secondly, it is also necessary to have advancements in the transformation section of energy systems, including natural gas liquefaction plants and hydrogen production plants, to satisfy the future potential demand in the respective scenarios.
The State of São Paulo has by far the largest crude oil refining capacity, with 38.5% of all crude oil refining capacity in the country, divided into four refineries current in operation. REPLAN (Refinaria de Paulínia), the largest in the country, has an installed capacity of 434 barrels per day. REVAP (Refinaria Henrique Lage) has an installed capacity of 251.6 barrels per day, and RBPC (Refinaria Presidente Bernardes) has a capacity of 169.8 barrels per day. The smallest refinery in the State is RECAP (Refinaria de Capuava), with 53.4 barrels per day [56].
Table 2 shows the total capacity by year for the processing units related to the transport sector (fuel production). In 2014, the State produced almost twice its demand for diesel, reaching 12.6 million toe of interstate exports and consumption of 9 million toe in the transport sector alone [57].
When it comes to natural gas processing units (NGPU), São Paulo state also has the largest share of installed capacity in the country, with 23% of the country’s capacity. The capacity in the State is divided into two facilities, Caraguatatuba, with a capacity of 20 million m3 of wet natural gas per day, and RPBC, with a total capacity of 2.3 million m3 of wet natural gas processed per day [56]. Natural gas is yet only deployed in light-duty vehicles in the transport sector in the State of São Paulo, with a consumption of 240,000 toe in 2014 [57].
On the other hand, biodiesel production in the State of São Paulo does not have the same significance. Although the State has a considerable production of ethanol, with 48% of the country’s production, biodiesel production capacity in the State represents only 10% of the country’s installed capacity to split into five functioning facilities [56].
A comprehensive analysis of alternative fuels for the transport sector needs to include not only emissions in the demand side but also from the transformation sector, especially when considering electric vehicles. Table 3 shows the environmental loadings for the MHDT and the transformation sectors of existing facilities in the State. The information in Table 3 was also used when calculating the imported emissions.
LEAP performs the calculations for each point of emissions in the demand side and transformation side of the energy system. For the transport sector, LEAP uses the fleet in the base year and the vintages of those vehicles based on the year each vehicle was produced. Each environmental loading and fuel consumption change with the vintage of the vehicle. The lifecycle profiles, emissions loadings, survival rate, and fuel consumption are presented in the appendix (Table A1). Each environmental loading is calculated as follows:
E m t , v , y , p = S a l e s t , v · S u r v t , y · v · M i l e a g e t , y , v · E m F a c t o r t , v , p · E m D e g t , y · v , p
where E m t , v , y , p is the total emission of pollutant p, from vehicles type t of vintage v in year y. S a l e s t , v are the sales of each vintage, S u r v t , y · v is the survival rate of vintage v in year y, M i l e a g e t , y , v is the distance each vehicle traveled in year y, E m F a c t o r t , v , p is the emission of pollutant p by kilometer and E m D e g t , y · v , p is the percent change of the emission factor of pollutant p in year y, compared to the year of its vintage. Next, the basic premises for the baseline scenario and the alternative scenarios will be presented.

3.4. Cost Analysis

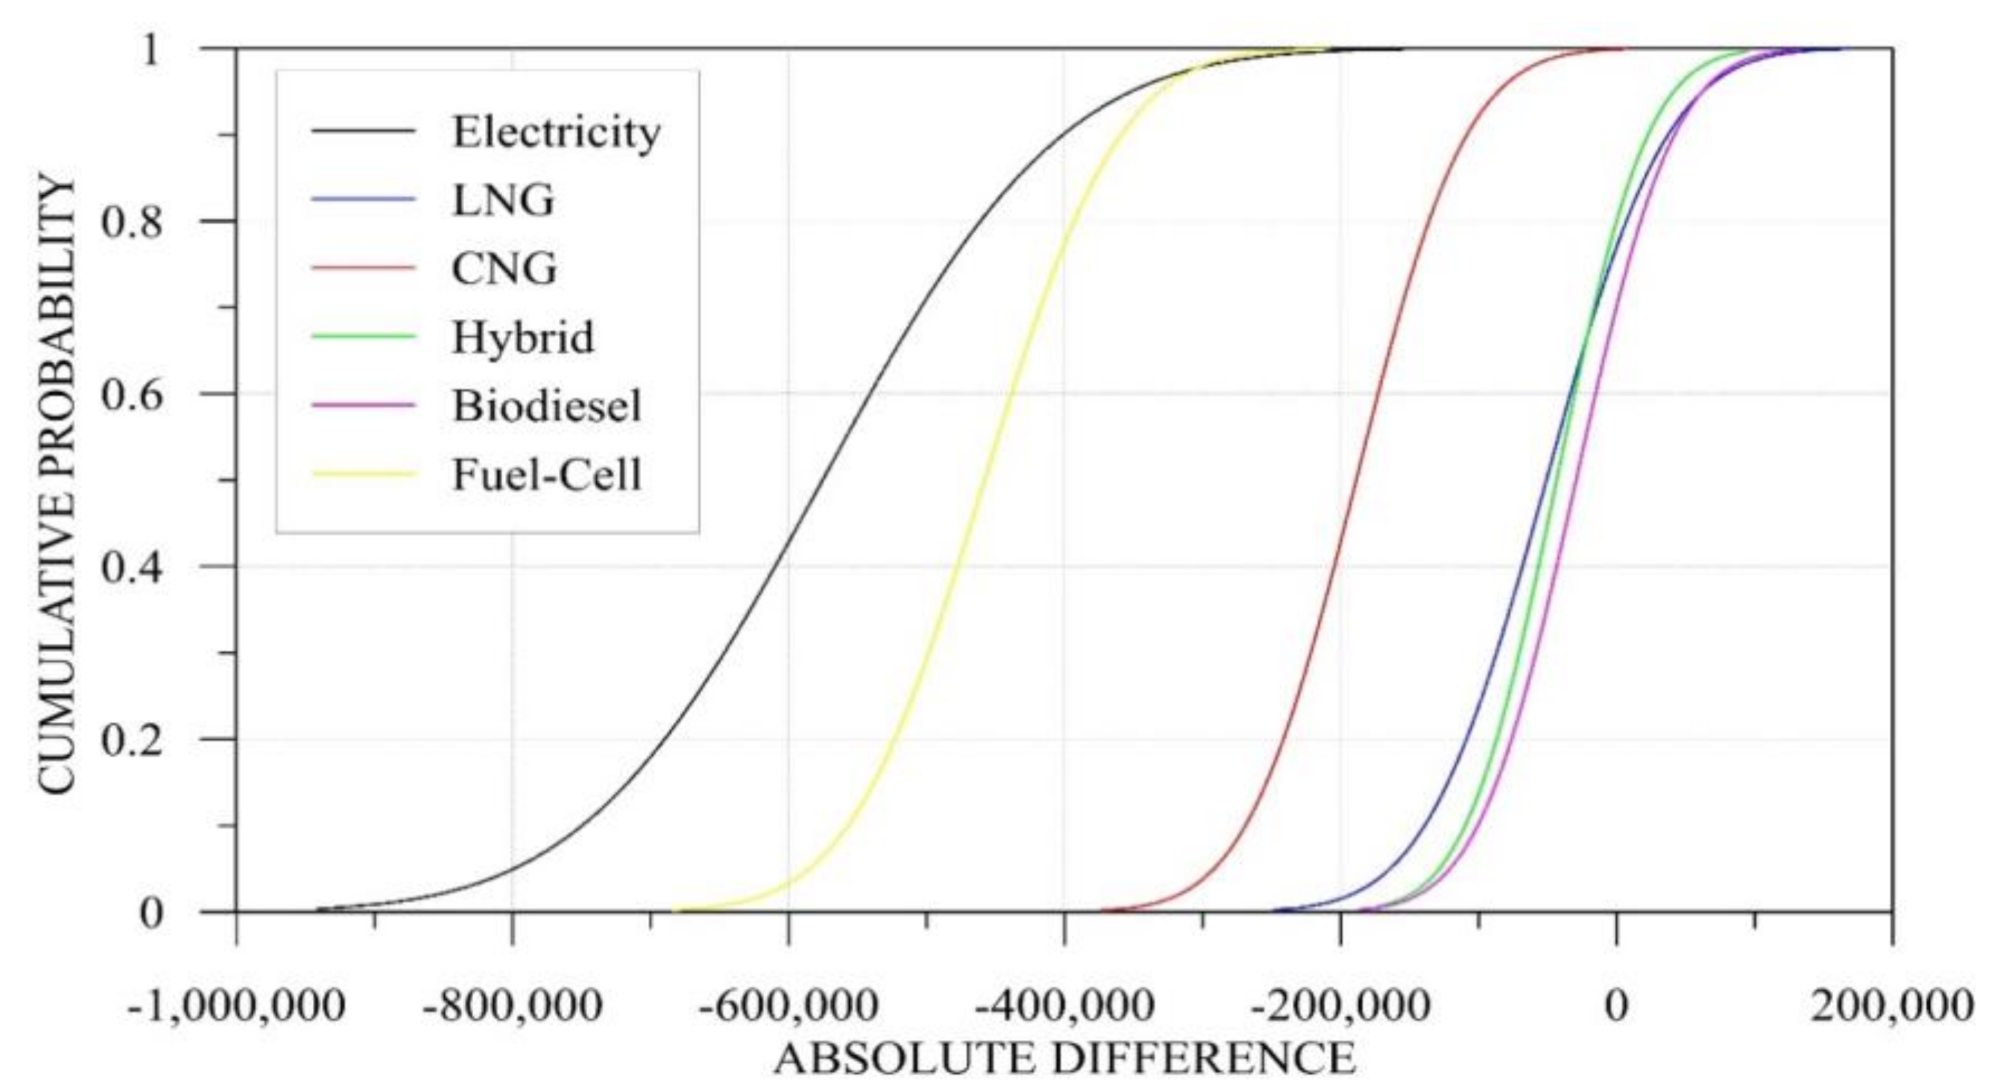
The cost analysis was done using the literature review as input for a Monte-Carlo analysis. The range of values found in the literature is presented in Table 4 in R$ of 2014. The average annual exchange rate of that year of 2.35 R$/USD.
The Monte-Carlo analysis will provide an overview of the probability of costs of each alternative technology in comparison with the diesel option. Each vehicle price will be randomly chosen from the range of values and compared to the diesel value in absolute terms as:
A b s D i f   =   C D i e s e l   C A l t
where AbsDif is the absolute difference between the cost of diesel ( C D i e s e l ) and the alternative option ( C A l t ). When negative, the alternative technology is more expensive than diesel, and when positive, the alternative technology is cheaper. After running this calculation 10,000 times, Monte-Carlo analysis issues the cumulative probability of the difference in costs between the option.

3.5. Assumptions Common to all Scenarios

The evolution of the energy system of the São Paulo State has been based on public information on new capacity for the transformation sector and the evolution of truck sales. Table 5 shows the premises that are common to all scenarios.
For MHDT, an elasticity of 1.09 was used, in terms of GDP growth [49]. In the baseline scenario, only diesel trucks exist in the fleet until 2050. In the transformation sector, no additional crude oil refining capacity is foreseen until 2050. The evolution of the energy processing (transformation) infrastructure has been based on reporting and energy plans and studies by the national [66,67] and state government [68].

3.6. Alternative Options Scenarios

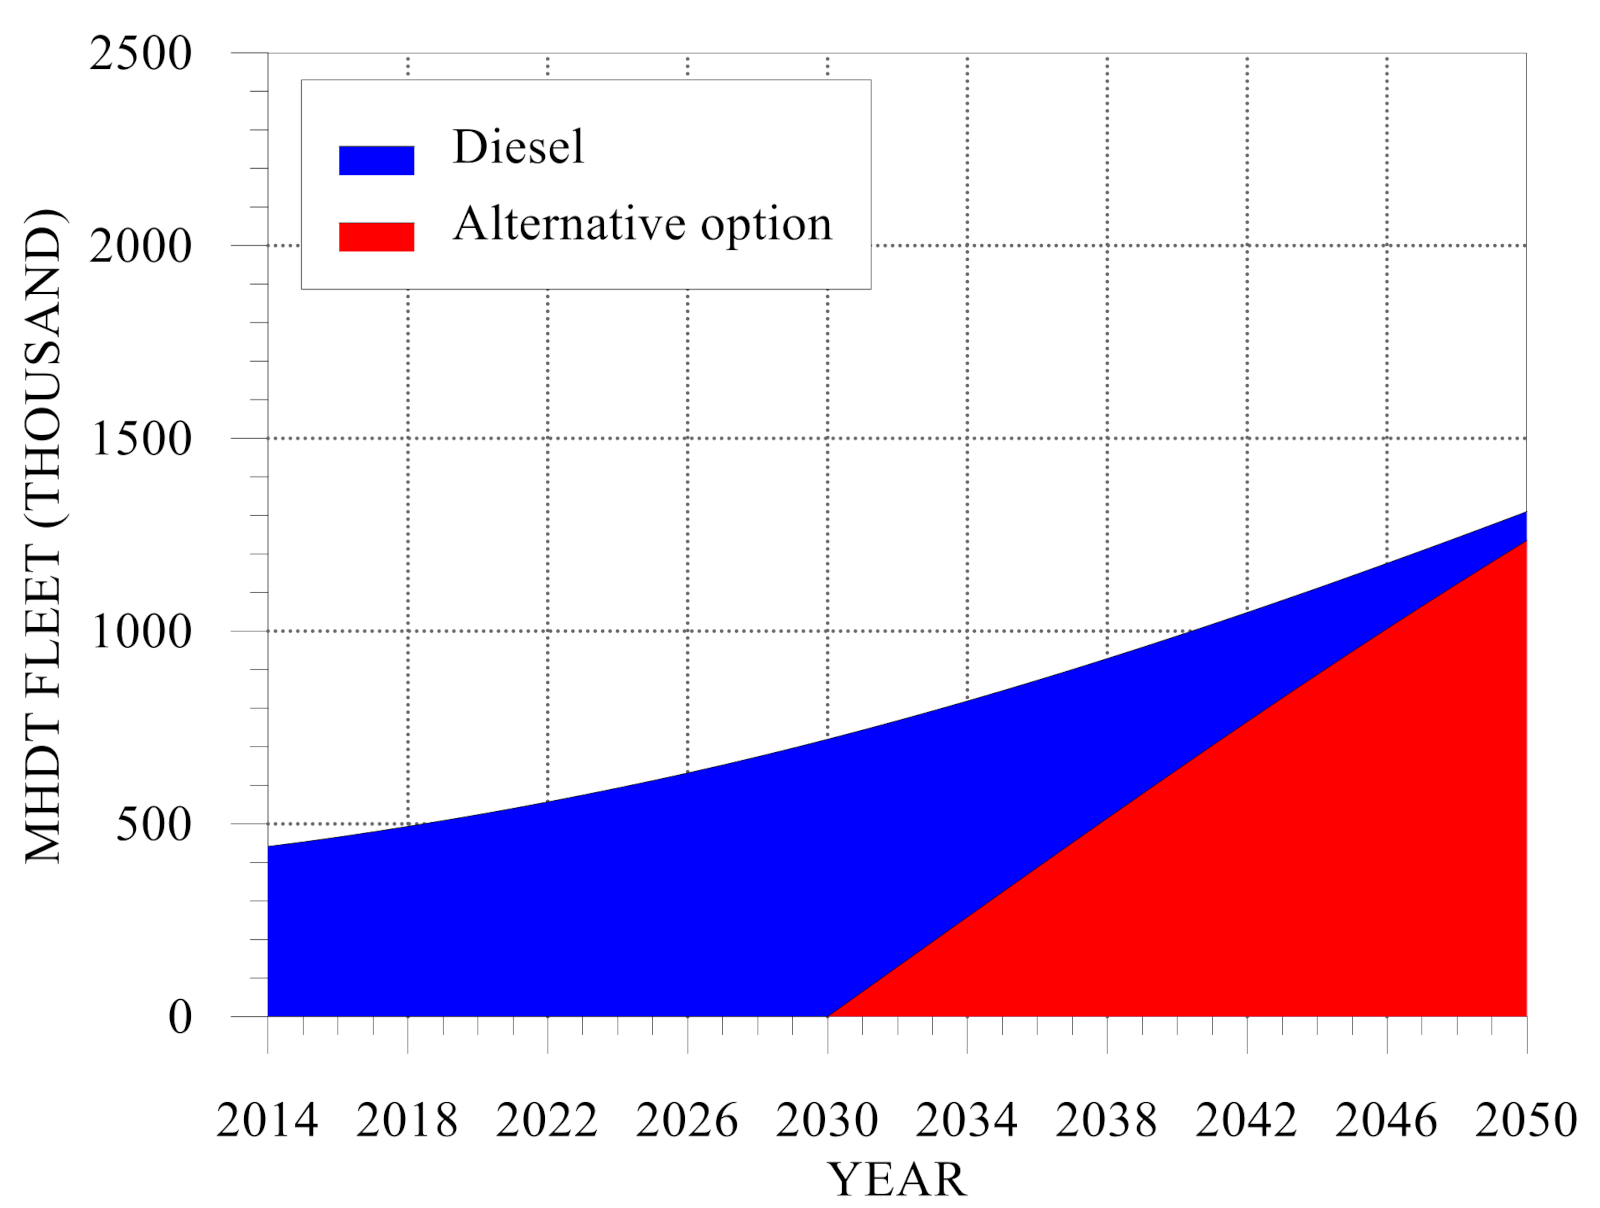
The comparison of scenarios will be based on the assumption that MHDT sales from 2030 on will be taken over by the alternative option (Figure 3), following a prohibition of diesel oil vehicles. Although this is not the case yet, Brazilian legislators consider this scenario with a particular law already under implementation [70].

3.7. Sensitivity Analysis

A sensitivity analysis was performed based on the minimum and maximum values of each environmental loading in this study. Table 6 shows the values taken from the review, and, in the case of no information, a ±20% variation was applied to the average values used and reported in Table 3. For CO2e, the minimum values in processing units (transformation) were set to zero to represent carbon capture and storage technologies and biogenic CO2 in biodiesel.
With the minimum and maximum values as input, the output of LEAP will serve as the basis for a Monte-Carlo analysis [71]. Lower and upper values are assumed to be the extremes of a triangular distribution, which will randomly provide 10,000 values of percent-change to the baseline scenario. With these values, it is possible to construct a cumulative probability curve, and, therefore, provide a measure of uncertainty for the results in 2050.

4. Results

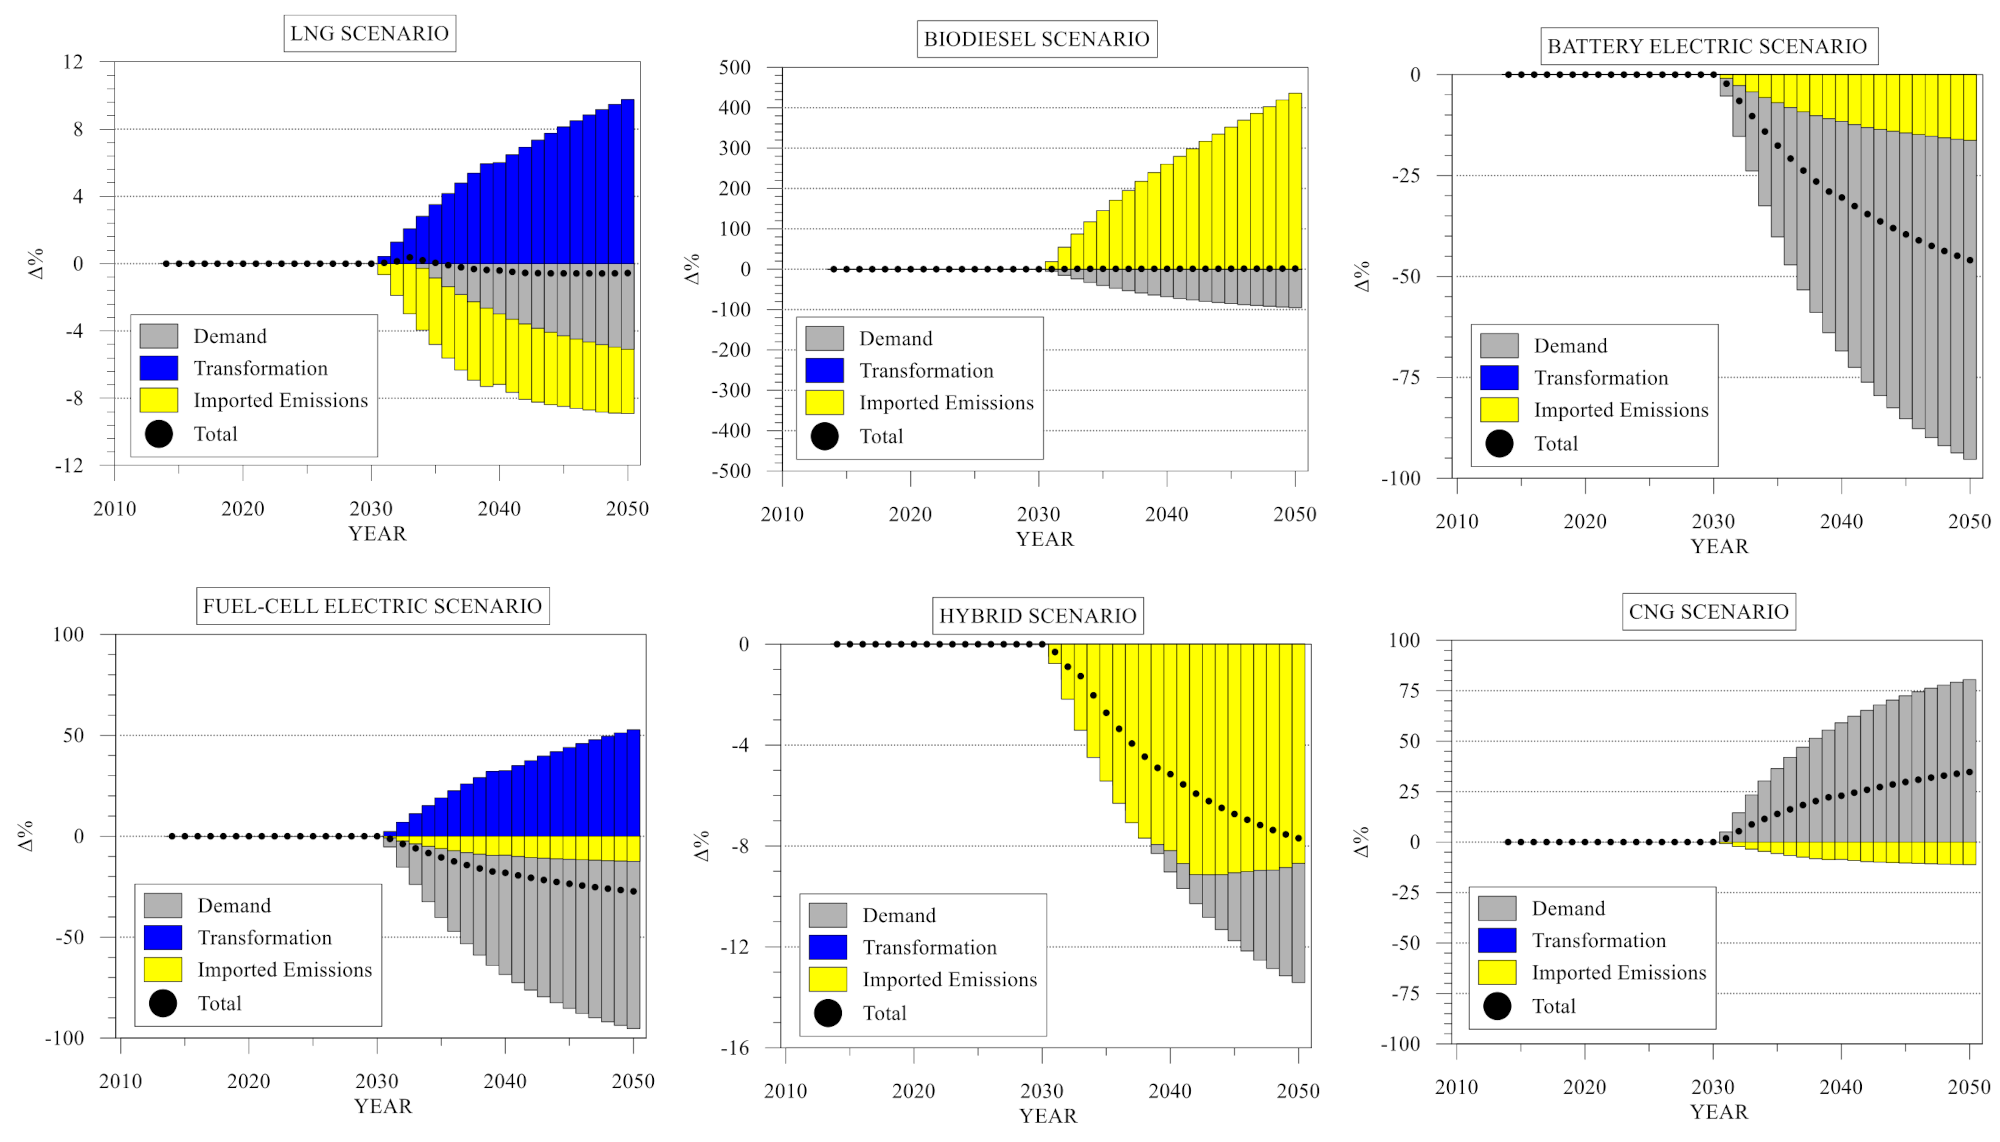
Results are split into three main sections GHG emissions, local air pollutant emissions, which include CO, HC, NOx, and PM and costs. In each scenario, the results are presented as percent-changes to the baseline scenario for demand, transformation, imported emissions, and total reductions.
With São Paulo being a major energy importer, imported emissions correspond to the most difference after demand-side changes, mainly due to the lack of infrastructure in the State in the next 30 years to produce its fuel, which forces the imports of more energy in the case of new alternative fuels. In LNG and hydrogen, fuel production is considered to take place within the State’s limits. While these fuels are not yet produced in the State, this study considers that locally produced fuels would fulfill new demand.

4.1. GHG Emissions

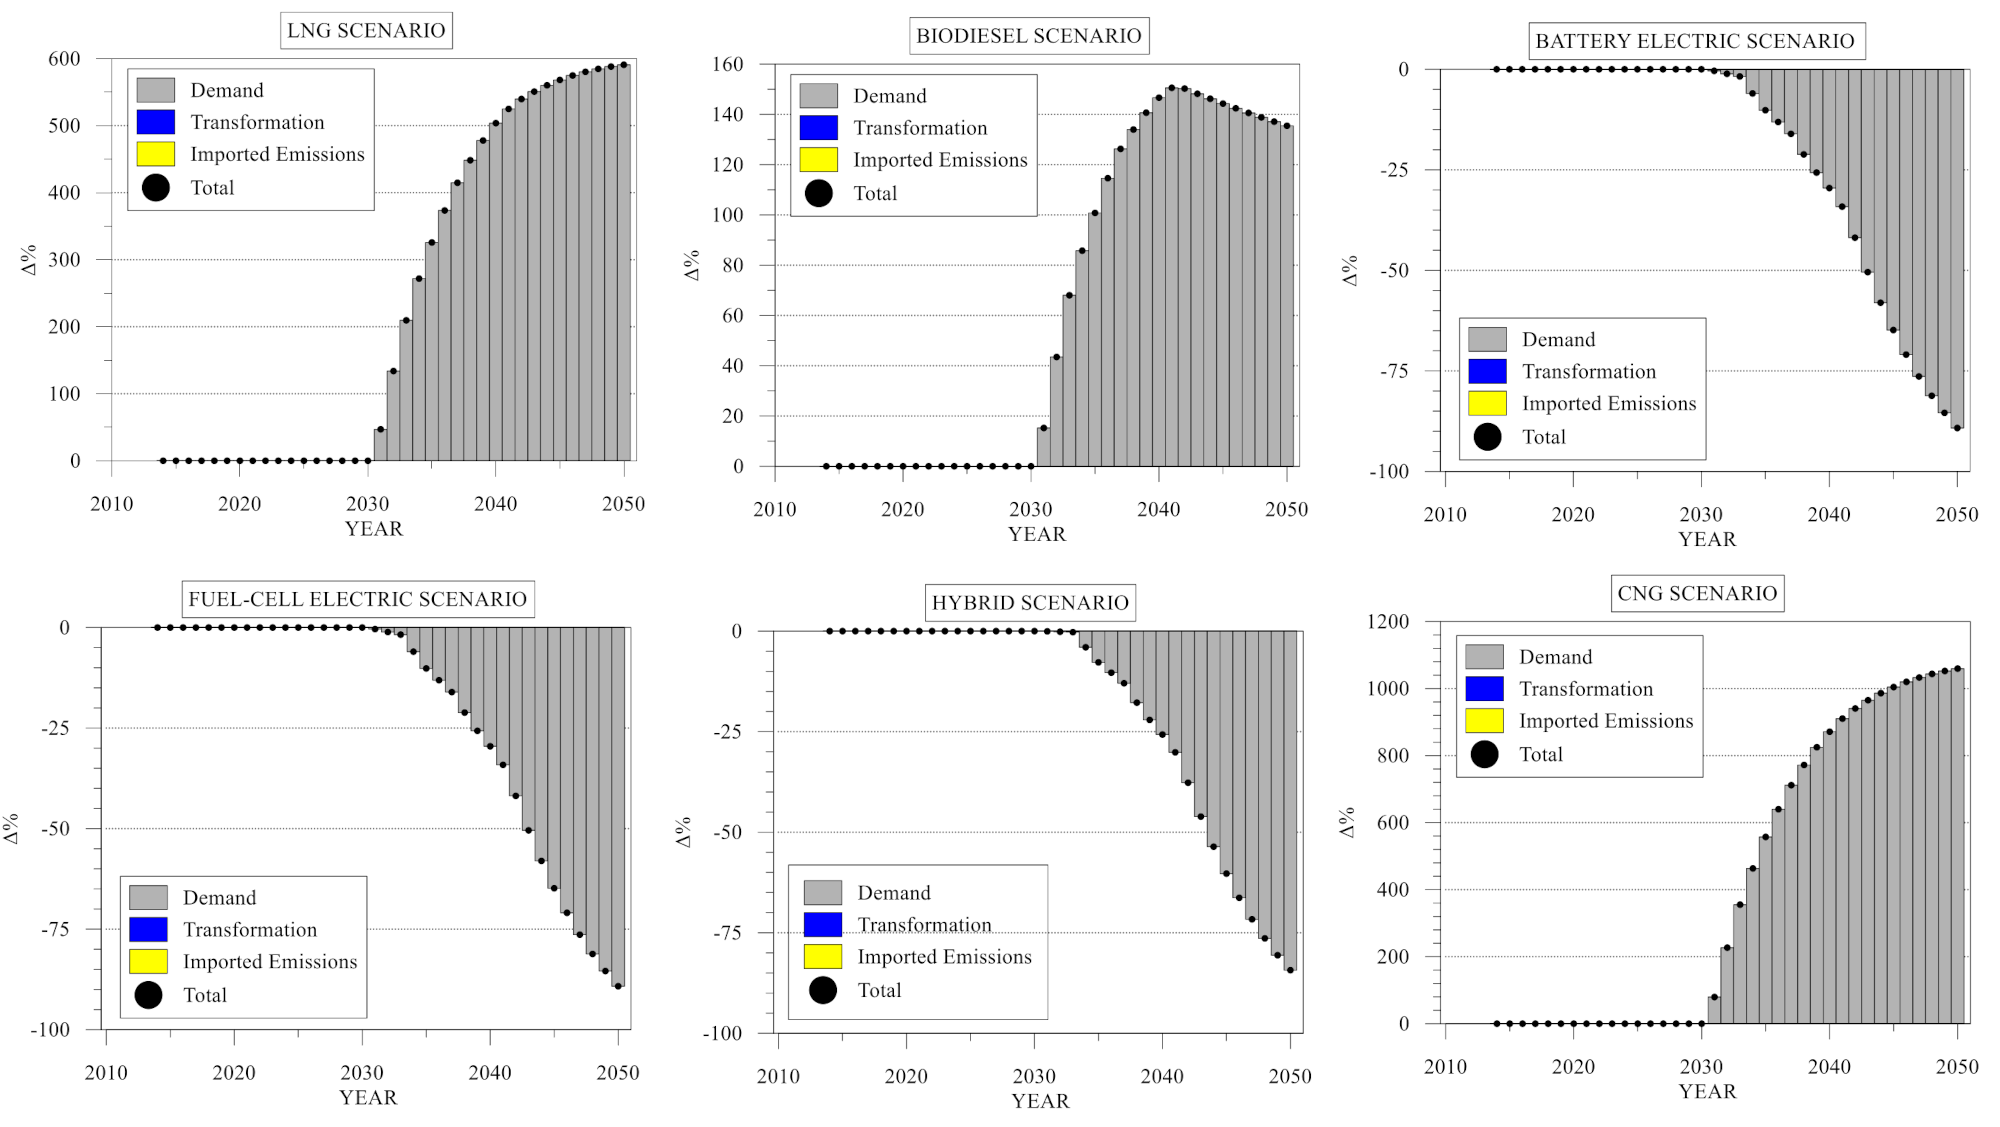
GHG emissions data in all phases of the energy life cycle (combustion in the demand side, fuel production in transformation, either local or imported) is the most abundant of all the aspects studied in this analysis. LNG, for example, appeared 41 times in the review performed. Figure 4 shows the percent-change reduction of each phase of the fuel life cycle. In general, the scenarios show that internal combustion engines (biodiesel, LNG, hybrid, and CNG) have the worst performance when it comes to total GHG emissions reduction, with hybrid reducing 8%, LNG reducing 1%, biodiesel increasing 2%, and CNG increasing 35% by 2050.
Comparing the possible uses of natural gas, hydrogen fuel-cell MHDT has the best performance for GHG emissions, reaching 27% of reduction in 2050. However, the best option overall is in the battery-electric scenario. With zero emissions in the demand side (no combustion) and with an electric system mainly based on renewables within São Paulo and in the country as a whole, the GHG emissions reduction using electric MHDT could reach 46% in 2050, if all diesel vehicle sales are ceased in 2030. Despite this reduction, it is essential to mention that the GHG emissions from the battery MHDT production were not considered, although these emissions are low and represent less than 4% of the total emissions [72].
Concerning biofuel versus fossil fuel, biodiesel presents virtually no difference in well-to-wheel emissions than diesel due to the high emissions in the production process. Although some studies that analyzed biodiesel from seed oil [73,74] and biodiesel from waste sources [75,76] found that the biodiesel combustion process emits more CO2 than diesel, biogenic CO2, carbon dioxide that originates from biologically based materials other than fossil fuels, has a net CO2 emission of zero. However, the production process of biodiesel based on transesterification emits considerably more GHG emissions than mineral diesel production [63]. To consider other production processes and feedstock, the sensitivity analysis in Section 4.3 considers the minimum value of CO2e emission factor to be zero.

4.2. Local Air Pollutants

4.2.1. Carbon Monoxide (CO)

CO emission is a result of combustion processes that occur under non-optimal conditions, in which there is incomplete combustion. Most emissions in urban areas come from motor vehicles. This gas has high blood hemoglobin affinity, which interferes and reduces the brain, heart, and body oxygen access during the breathing process. This can cause fatigue, chest pain, asphyxia, and death [77].
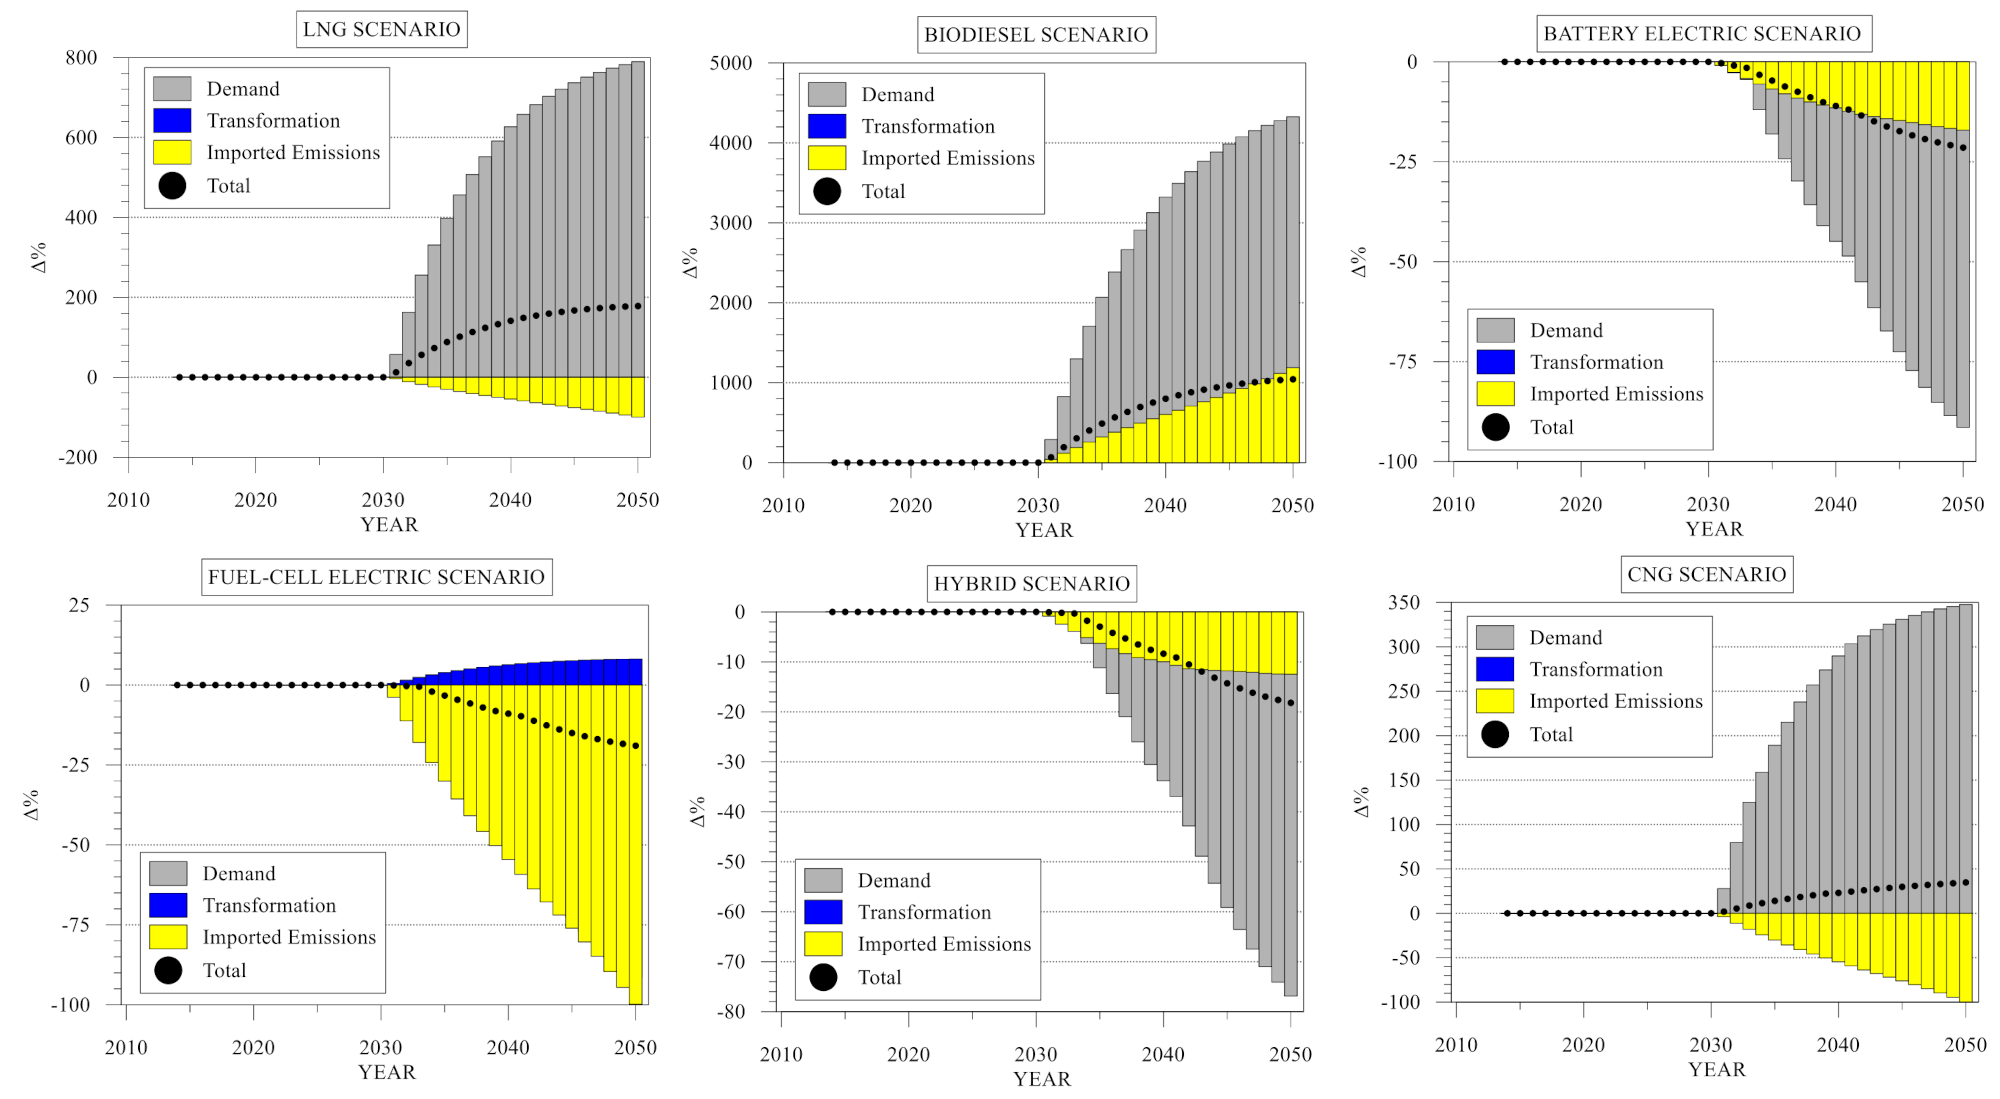
Except for hybrid vehicles, which correspond to an 18% reduction in 2050, the other internal combustion options have considerable negative impacts on CO emissions, ranging from a 76% increase in the CNG scenario to 1000% in the biodiesel scenario by 2050. Since CO production is caused by an incomplete combustion process, it was observed that depending on the type of biodiesel, this fuel has completely different characteristics such as the case of viscosity, density, and oxygen content, which directly impact the combustion efficiency. As can be observed, there are some studies—Emiroğlu and Şen [78], Hoekman and Robbins [79], and Qasim et al. [80]—that evaluate the biodiesel addition to diesel fuel reduces CO emissions due to the higher oxygen content provided by biodiesel. However, other studies such as the case of Adam et al. [76], showed an increase in CO emissions using biodiesel and an explanation for that is the higher viscosity and density of biodiesel than diesel, for instance, contributing to reduce the fuel atomization, damaging the combustion efficiency. In our study, however, diesel oil emissions factors come from public data of the State of São Paulo, which are lower than those found for diesel in the article review, which means that the reference of comparison in our study changes. Nonetheless, as it is the case of GHG, CO emissions have the highest reductions in electric vehicles, either fuel-cell or battery electric. With a 19% reduction in fuel-cell and 21% reduction in battery-electric MHDT. Figure 5 shows the resulting percent-change differences in CO emissions compared to the baseline scenario.

4.2.2. Hydrocarbons (HCs)

HC emissions in urban centers come primarily from fuel burning in cars, buses, and trucks, although industrial and natural processes also emit hydrocarbons. Methane and non-methane hydrocarbons make up for total hydrocarbons. Its main effect is in the tropospheric ozone formation [77]. Unfortunately, information on HC emissions is scarce and only available for the demand side of the analysis. The behavior of HC emissions in internal combustion engines depends on many factors, such as the fuel oxygen content [81], temperature [82], fuel quality [83], and ignition delay [84]. In biodiesel, some studies showed an increase in emissions compared to the diesel fuel due to the air–fuel mixture [75] and fuel atomization [78]. On the other hand, some studies showed that biodiesel could reduce HC emissions due to fuel oxygen content [80]. Figure 6 shows the difference in percent-change of HC emissions compared to the baseline scenario for each MHDT technology.
Results show that electric vehicles have the most reduction, since there is no combustion in the demand phase of the transport system, reaching an 89% reduction in 2050 in both scenarios. LN and CNG have tremendous impacts mainly for the CH4 share of total hydrocarbons. Vermeulen et al. [85] state that 85% of the total hydrocarbons emissions is CH4, which is not toxic to human health. Assuming that the emissions regard only the demand side, the increase of HC emissions due to the use of LNG and CNG fuel compared to the diesel baseline scenario corroborate the experimental results found in the studies performed by Grigoratos et al. [86] and Yuan et al. [87], which HC emissions increase with LNG and CNG use in internal combustion engines.

4.2.3. Nitrogen Oxides (NOx)

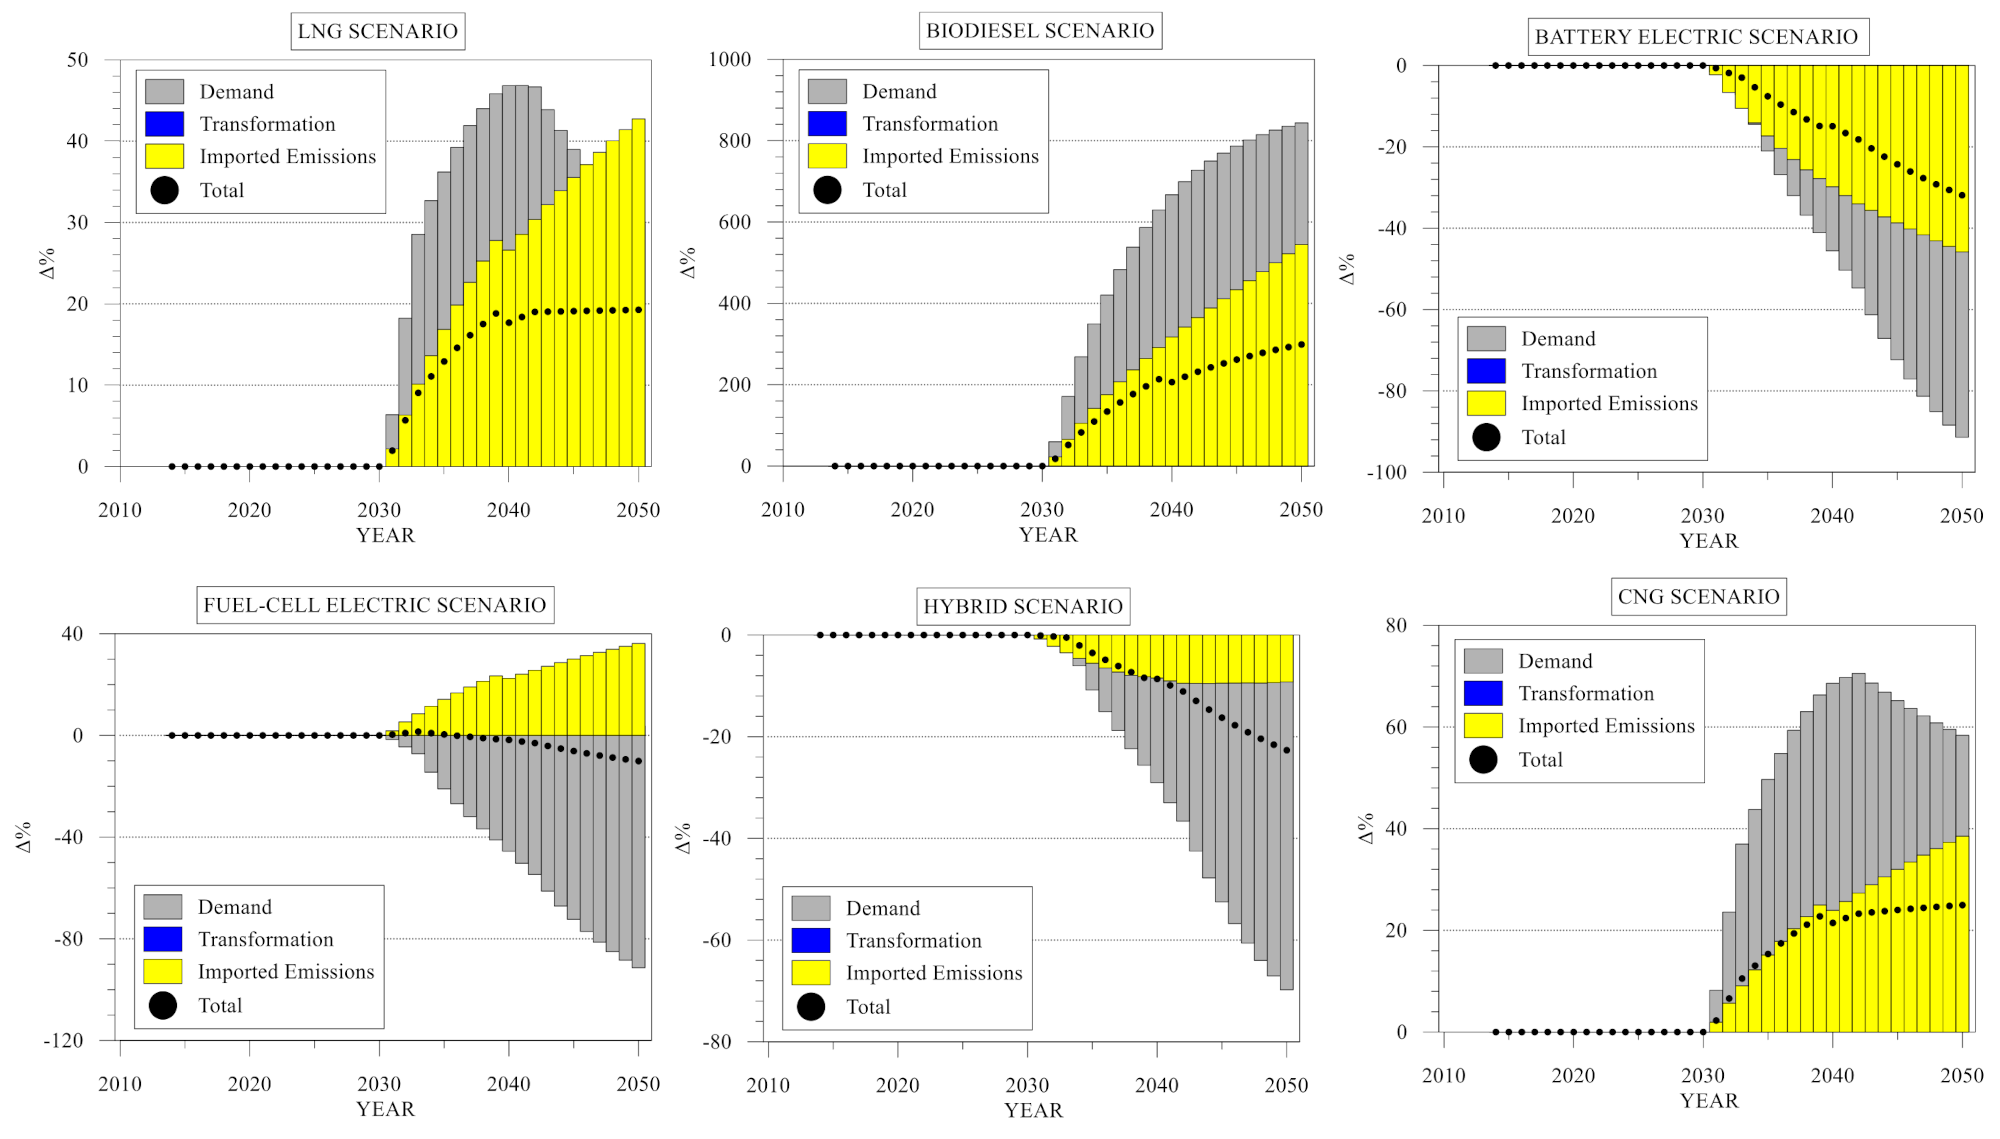
NOx emissions are a result of the combustion process and are directly related to high combustion temperatures [88]. Different factors can contribute to NOx formation, such as residence time [89], ignition delay [90], and cetane number [91]. In large cities, vehicles are generally the primary source of this gas emission, and one of the concerns about NOx formation is that this pollutant is a precursor to other pollutants, as in particulate matter (PM). NO, under the sunlight, action transforms into NO2 and plays an important role in the photochemical oxidants’ formation such as tropospheric ozone [92]. High concentrations of NO2 can lead to an increase in hospital admissions due to breathing and lung problems. On the other hand, its main impact on the environment is photochemical smog and acid rain formation [77]. Figure 7 shows the differences in NOx emissions in each scenario in comparison to the baseline scenario. For once, the reductions from fuel-cell MHDT are not among the highest reductions. Hybrid vehicles reduce more than fuel-cell electric by 13 percentage points. While hybrid MHDT decreases 23% of NOx emissions by 2050, hydrogen fuel-cell electric vehicles reduce 10% due to the imported emissions in the processing of natural gas for hydrogen production.
Overall, LNG, CNG, and biodiesel cause increases in emissions, while most reductions occur in the battery-electric scenario. By 2050, this scenario could reduce total NOx emissions by 30%. The increase in NOx emissions due to the introduction of LNG, CNG, and biodiesel fuels in the market occurs due to the higher emissions factor of these fuels compared to the conventional diesel. In the model, larger values were found for biodiesel, and a reason for this is that biodiesel oxygen content is higher than diesel, contributing to an increase in the temperature of combustion and, consequently, NOx emissions [74,78,81].

4.2.4. Particulate Matter (PM)

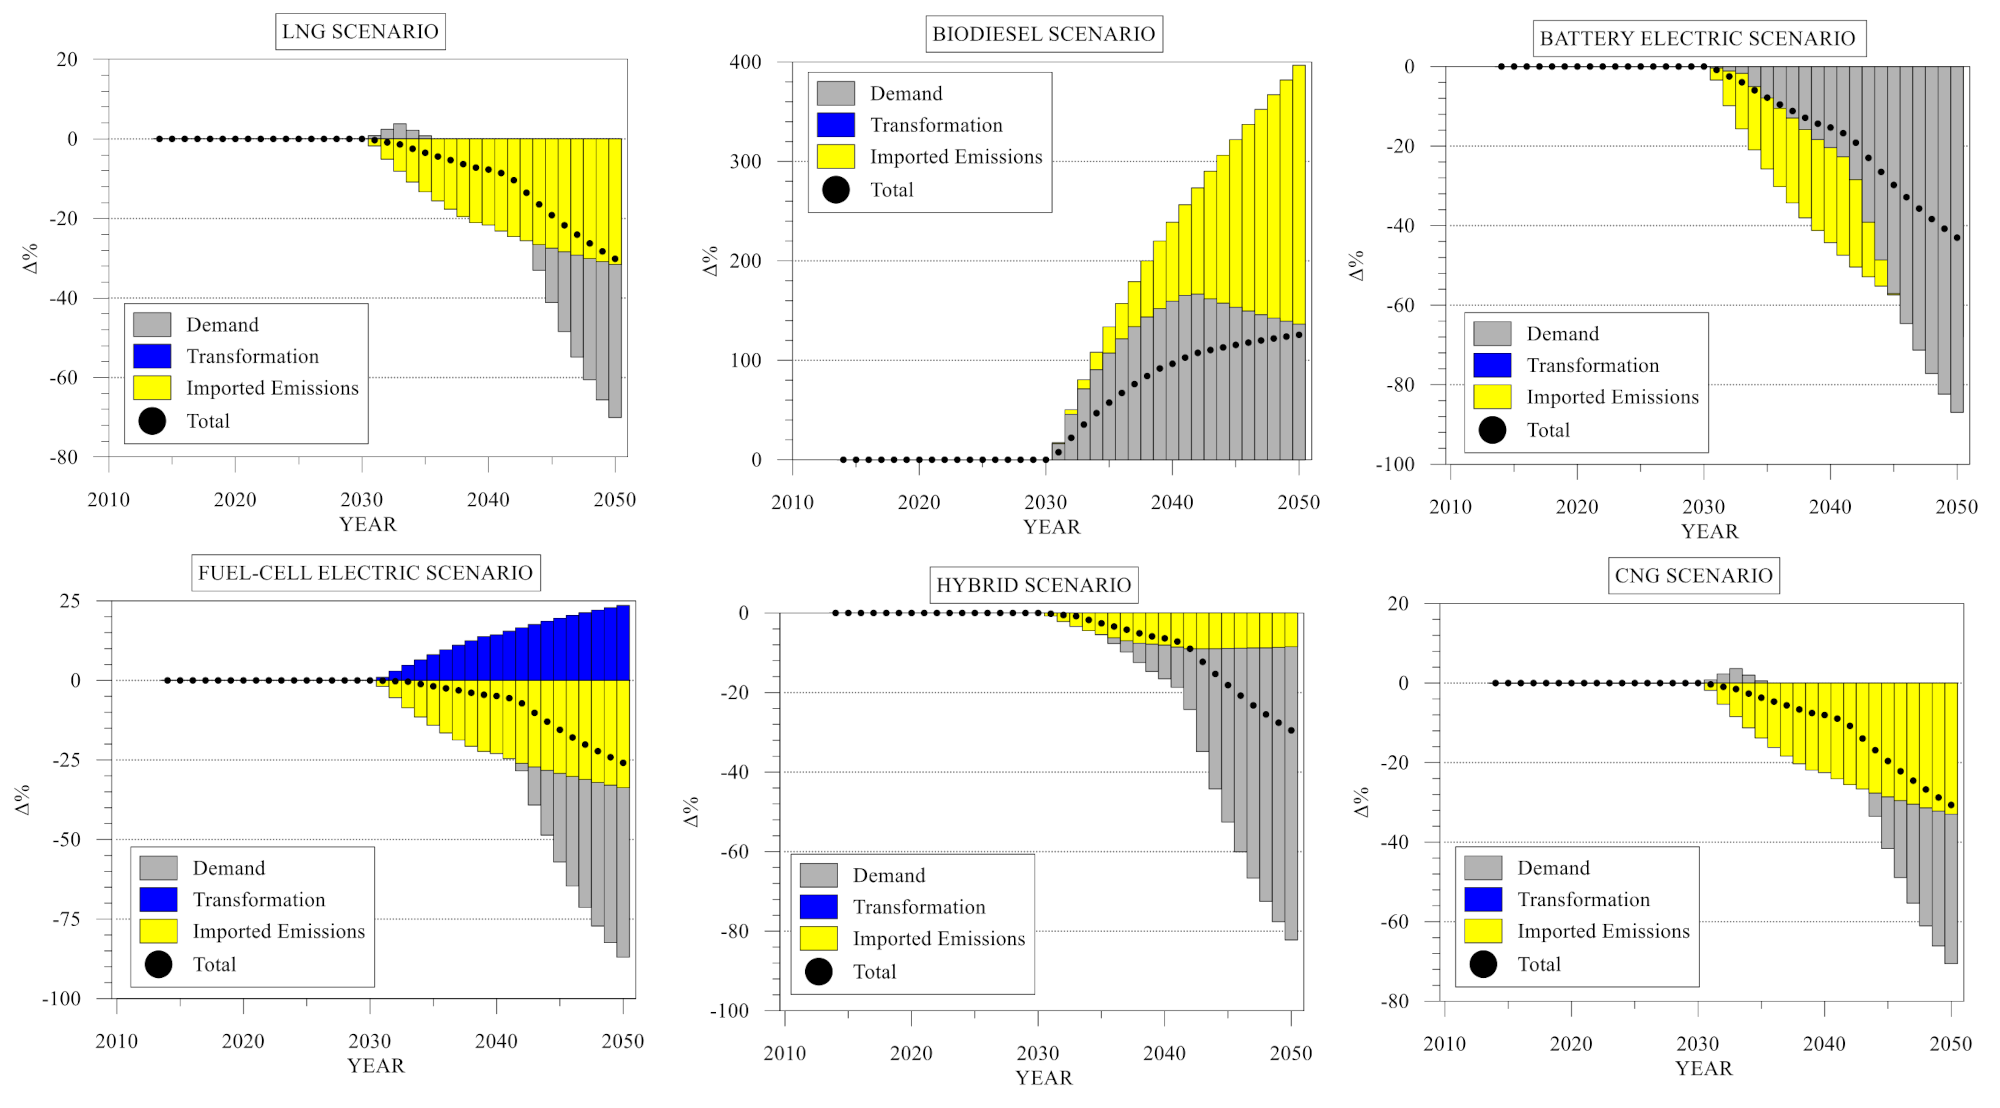
PM encompasses an extensive range of solid and liquid pollutants that can be in suspension in the atmosphere due to their small size. In general, PM diameter is related to its capacity of penetration in the respiratory tract [93]. The PM emission results from fossil fuel combustion, biomass powerplant burning, agricultural ammonia, and emissions from construction sites. Several studies [12,94] show the relationship between PM and health issues such as lung cancer, atherosclerosis, lung inflammation, and worsening asthma symptoms [77]. Due to its direct impacts on health, PM is the most studied pollutant in the review, and data availability is considerably higher than other pollutants. Figure 8 shows the resulting difference in PM emissions in each scenario compared to the baseline scenario until 2050.
In contrast to other pollutants, natural gas-based fuels also present a viable option to reduce PM, and reductions are comparable to electric vehicles. Emissions reductions by LNG are four percentage points higher than fuel-cell electric vehicles, with LNG reducing 30% of emissions by 2050 and fuel-cell electric MHDT reducing 26%. Hybrid vehicles also present substantial reductions, reaching 30% in 2050. Overall, however, electric vehicles still have a considerable advantage in reducing PM emissions, reaching 43% in 2050. The only option showing an increase in PM emissions is biodiesel. The lack of data regarding biodiesel processing and the low number of studies focusing on PM emissions from biodiesel makes the analysis more challenging for this fuel.

4.3. Sensitivity Analysis

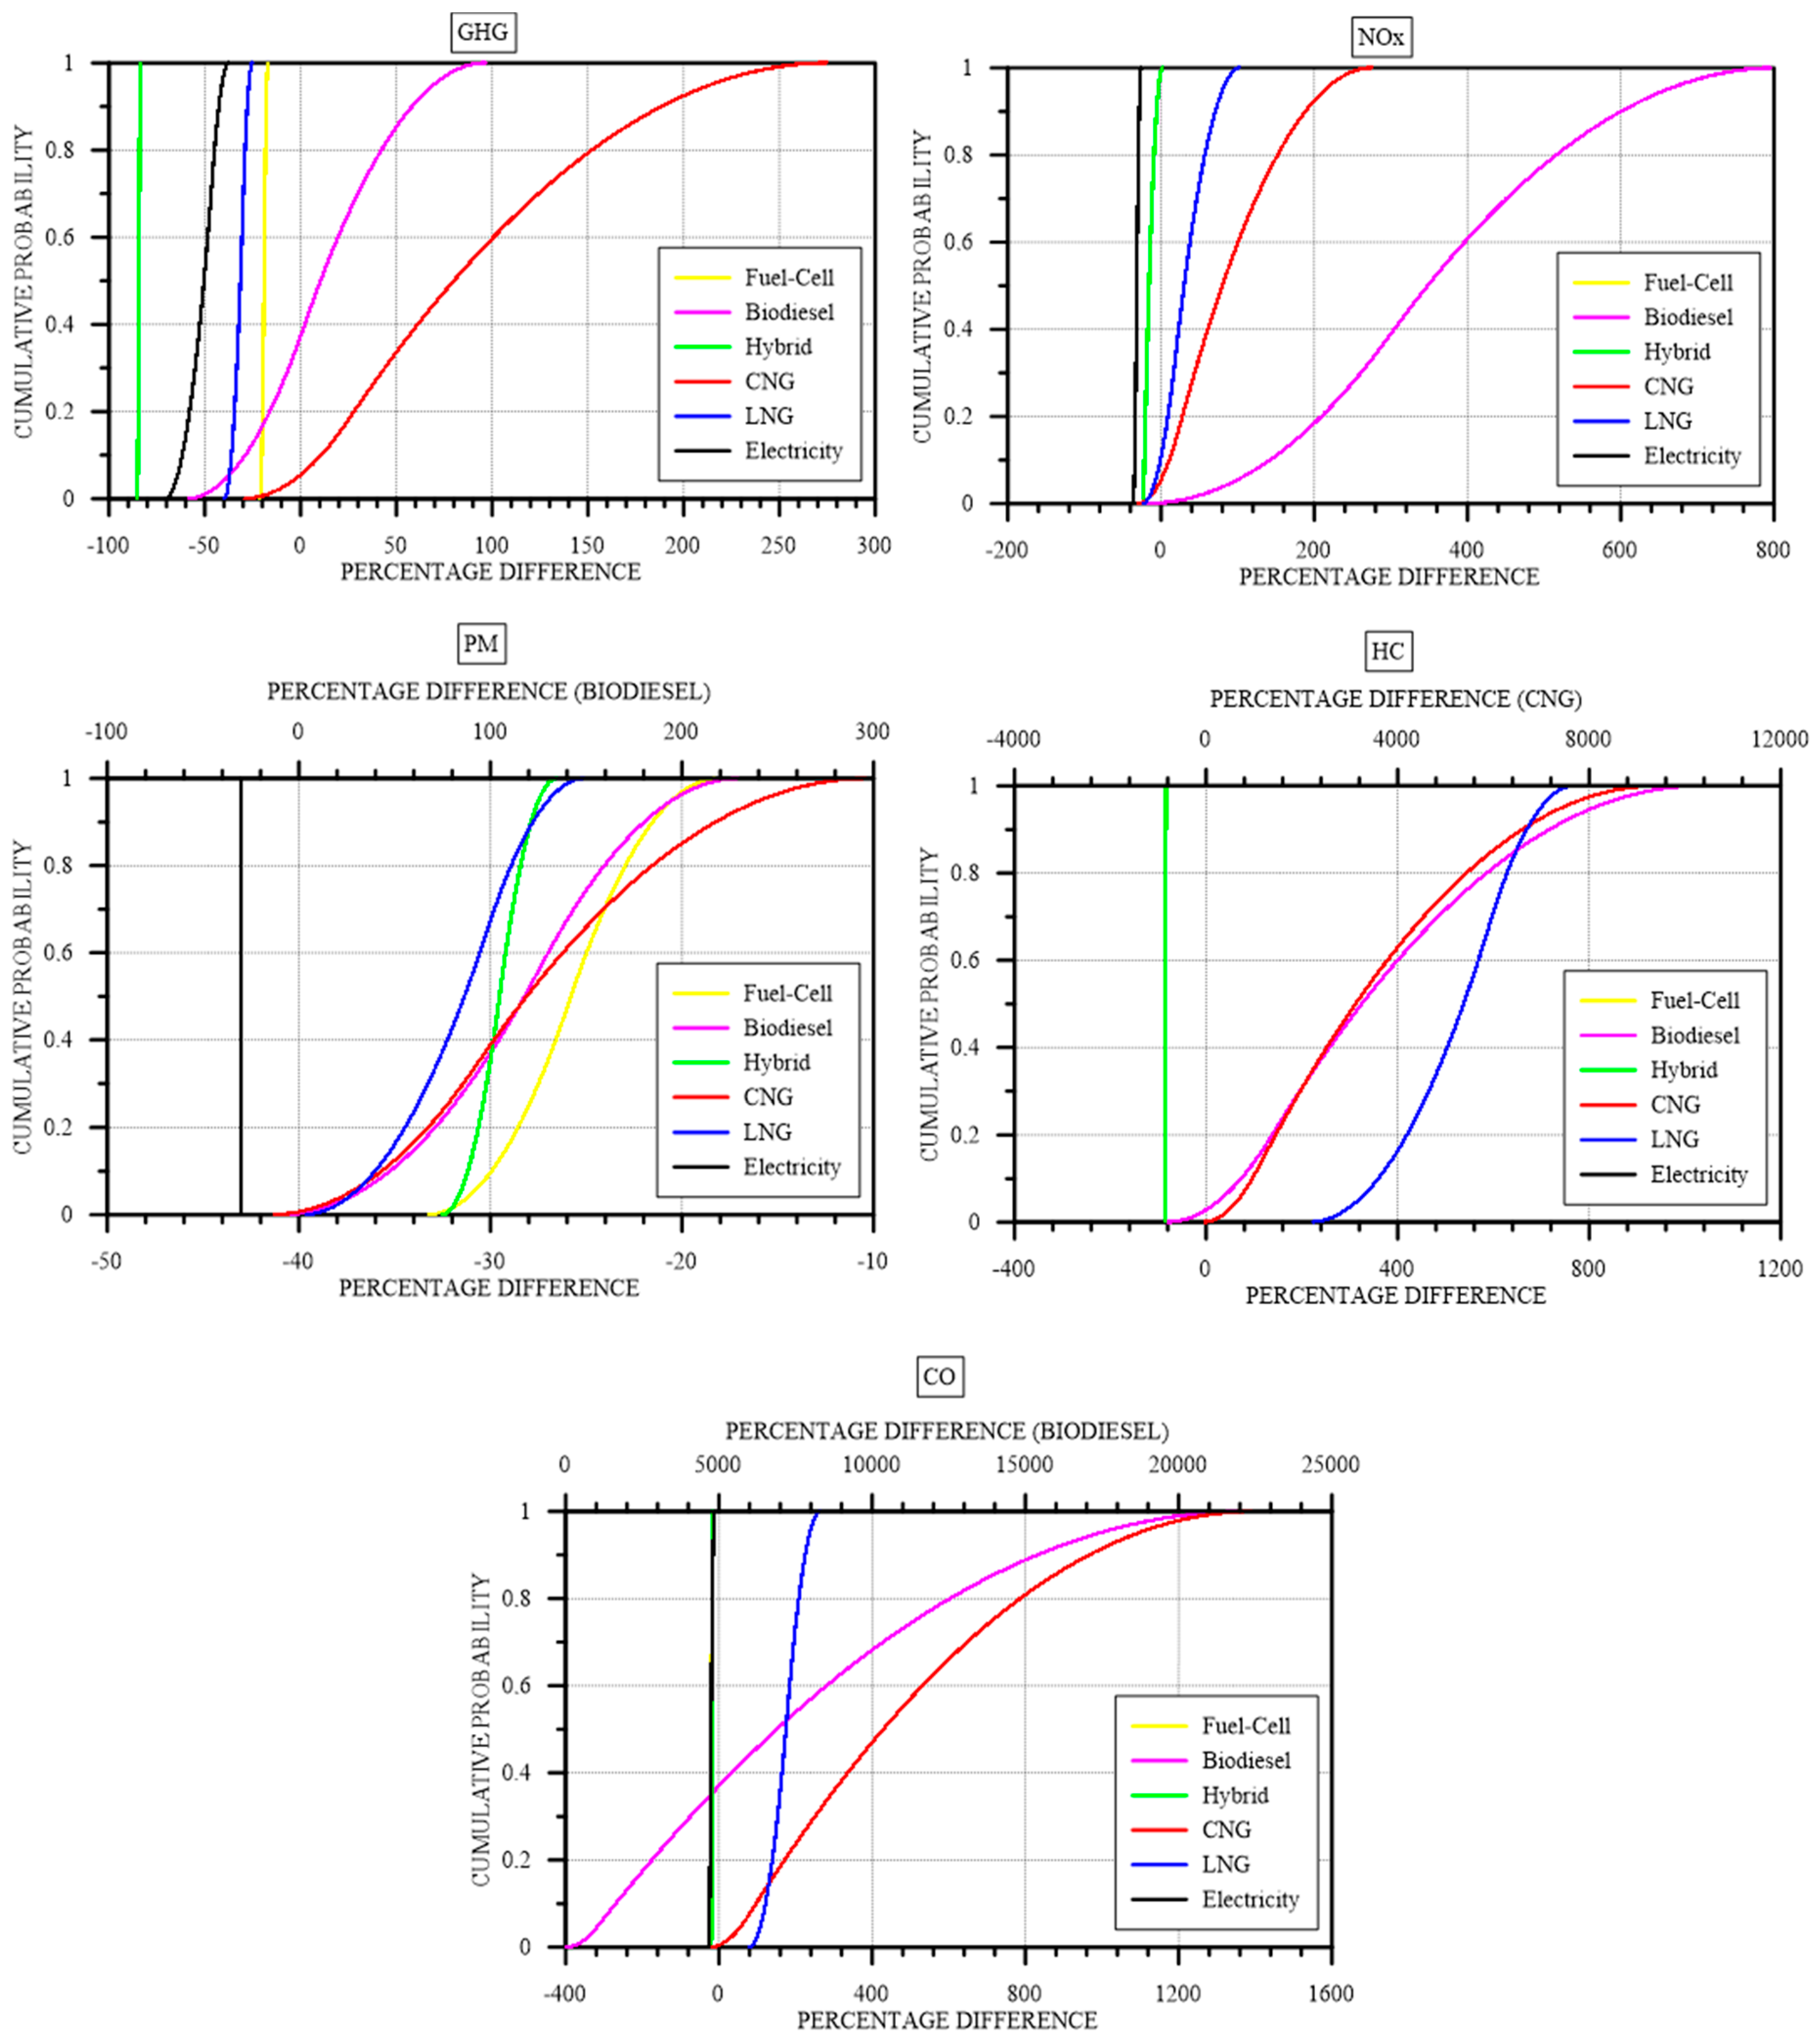
The relative change in each environmental aspect (GHG emissions and local pollutant emissions) was tested using extreme emission factors in the literature for the demand and transformation sectors. Figure 9 shows the cumulative probability of a total percent change in 2050, including demand, transformation, and imported emissions. A secondary x-axis was added to the top of the graph for aspects with higher variations. PM (biodiesel percent-changes should be read on the top axis), HC (CNG percent-changes should be read on the top axis), and CO (biodiesel percent-changes should be read on the top axis) have a secondary axis to help the visualization of results.
The variation in emission factors confirms that electric MHDTs have the highest probability of reducing GHG emissions, with battery-electric having a 100% chance of reducing emissions by at least 40%. In comparison, hydrogen fuel-cell vehicles have a 90% chance of reducing any emissions. Hybridization of vehicles also presents 90% of reducing some emissions. In this way, electric vehicles (pure and hybrid) could allow the Brazilian market to reduce emissions considering. In the case of pure electric vehicles, most emissions are associated with electricity production, which more than 60% is from clean sources such as hydropower. This is still expected to be the case in 2050 since little changes in the electricity mix in São Paulo are expected until 2050. However, other factors such as costs, recharging infrastructure, and customer acceptance have to be analyzed for the success of this alternative vehicle.
On the other hand, LNG and biodiesel present a similar probability of reducing emissions, with a 40% chance of not reducing emissions. CNG is the option with the lowest chance of reducing emissions, with a 10% chance of not reducing emissions. Some reasons for that are the low number of papers found with CNG emission factors during the review process. Additionally, some papers [95,96] analyze other fuels such as CNG hydrogen enrichment and are not only focused on pure fuel. Furthermore, the use of CNG can contribute to increasing methane emissions, which has high global warming potential. Moreover, many emission factors used as the basis for this work were found from testing vehicles considering different drive cycles, which will impact results [97].
NOx emissions are also most probably reduced by battery-electric, fuel-cell electric, and hybrid vehicles, with a 100% chance of reducing emissions. The other internal combustion options have the lowest chance of reducing NOx emissions, with LNG and CNG having less than 10% chance of reducing emissions and biodiesel having a 100% chance of increasing emissions in 2050. As previously mentioned, biodiesel as a pure fuel can increase exhaust emissions due to the higher temperature combustion.
The other pollutants present an extensive uncertainty, especially regarding CNG and biodiesel. While biodiesel has a 0% chance of reducing any emissions of PM and CO and a 5% chance of reducing HC, CNG has a 100% chance of reducing at least 15% of PM and 0% chance of reducing any CO and HC emissions.
On the other hand, battery-electric, fuel-cell electric, and hybrid vehicles would reduce PM CO and HC emissions with a 100% chance. LNG presents as an option to reduce PM emissions, with a 100% chance of reduction in 2050, but for the other pollutants (CO and HC), there is no chance of reduction based on the available data in the literature.

4.4. Cost Analysis

From a sustainability perspective, economic feasibility is still one factor contributing to a final decision. Although fuel economy, fuel price, and operation and maintenance costs affect the viability of a technological change, the actual price of the vehicle is of significant importance for the investor [98,99]. From the literature review performed, a wide variety of purchase prices were found for each vehicle type. Figure 10 shows the cumulative probability of the absolute difference between diesel MHDT and alternative technologies. Values higher than 0 show that alternative technology is cheaper than their diesel counterpart, while values lower than 0 show that diesel vehicles are cheaper than the alternative. Based on the values found in the literature and presented in Table 4, Figure 10 presents the resulting probability curve based on a Monte-Carlo analysis from 10,000 random calculations.
The results show that the most environmentally friendly options, which are the electricity-based vehicles, namely hydrogen fuel-cell and battery electric MHDT, are at the same time the most expensive. While there is a 100% chance of fuel-cell and battery electric vehicles to be R$ 200,000 more expensive than diesel vehicles, LNG, hybrid, and biodiesel options still present around 25% chance of being cheaper. CNG, on the other hand, is presented by the literature as a more expensive option, in comparison to the other internal combustion MHDT.

5. Discussion

The use of diesel oil in the freight transport in the São Paulo State, and the country as a whole, has been the status quo since the 1930s when diesel production effectively began in the country [100]. With the establishment of the automobile industry in Brazil in the 1960s, roads and trucks for freight transport became the norm, and any previous efforts in expanding the use of railroads and trains were decimated [101]. Besides, as a developing country from the south, the use of freight transport meant not only new jobs and the creation of a new production chain based on automobile sales but also a way to develop the transport sector based on a mode with lower capital and maintenance costs, compared to railroads and trains [101].
With the 1970s oil crisis and the PROALCOOL program [102], attempts were made to try to insert ethanol in the freight transport sector, but this was limited to small amounts, and by the end of the 1980s, diesel was the sole fuel for freight in the country [102]. Since the 1990s, therefore, the use of diesel in the country has continuously increased at an average rate of 3% [103]. In 2016, changes in fuel policy created a scenario in which made more economic sense to sell crude oil and import diesel oil than to process its crude oil. This made Brazil a net oil exporter and a net diesel importer, increasing each year ever since [103]. São Paulo State, which has the highest share of oil processing, is also the highest in diesel consumption. With a lack of oil refineries projects in the São Paulo State (or in the country for that matter), any increase in diesel demand will most definitely be met by imports. Therefore, when it comes to emissions, either GHG or local pollutants, changes in consumption within the State will cause changes, not in the local transformation sectors (represented by four oil refineries and two NGPU), but in the transformation sectors of diesel exporters.
As far as alternative fuels go, there is no evidence that the importer role São Paulo state is taking at the moment will change if any other fuel is chosen to power the transport sector. Although some public policies aim to increase the production of other fuels such as biodiesel through the RenovaBio policy [104], its use is still a complement, not as a drop-in substitute to fossil diesel. With little plans from State and national energy strategies to break the hegemony of diesel (and its counterpart biodiesel), if alternative fuel vehicles become a reality in the State, a supply problem will arise from the lack of infrastructure to supply such fuel. This problem requires long-term severe strategies and policies to avoid higher energy dependency, as already happens with diesel. Security of energy supply decreases vulnerability [105], has a direct effect on the balance of payments [106], especially in places where energy plays a significant role in trade balances, and, in some cases, on the government’s budget [107].
Furthermore, the cost of energy is an essential factor in that rate of inflation, and finally, energy security affects the competitiveness of a country [106]. Moreover, the costs of energy are a critical factor in the rate of inflation and the international competitive position of a country’s economy. Furthermore, not only policies towards the reduction of GHG and pollutant emissions in the transport sector itself are necessary (such as the Rota30 program [108]), but the proper investment in energy infrastructure that supports drastic changes in emissions.
The question arises then if the best options regarding GHG and local pollutant emissions, which are the battery and hydrogen fuel-cell electric options, will ever be a possibility for developing regions like São Paulo or Brazil. Even though other authors point out that electric trucks could cause an increase of emissions in several places in the world [109,110], and that it is still necessary to evaluate peak power demand to understand the operational aspects of transport electrification, electric trucks in Brazil have the most radical reductions in GHG. However, being the most expensive options, there is a small chance that the government or even the private sector will be willing to pay the price, based solely on environmental reasons. The way to go in the country has been to continue to depend on diesel, and most recently, the discussion on natural gas use in the transport sector has gained some momentum due to the high production of this fuel in the country after the pre-salt layer discovery [111]. Cheaper than other alternative options, natural gas might create some room in the market corroborated by its lower PM emissions, even though other pollutants, or GHG emissions, do not have the same outcome.

6. Conclusions

Machado et al. [9] point out that there is a lack of comprehensive analyses of the road transport sector from a global south perspective, with most of the focus being on high-income countries. The development of the analysis, per se, showed to be a challenge due to the lack of public, local, and empirical data, such as measured emissions by diesel and alternative trucks, oil refineries, power plants, and natural gas processing units. For this reason, a sensitivity analysis was necessary to show the variability in data and the different outcome provided by the model when using different premises. The lack of data shows that future research on this topic should focus on testing and simulating the alternative options within Brazilian reality, which is peculiar in terms of road conditions and the country’s size, mainly in terms of autonomy and costs; including public health expenditures and operation and maintenance costs, to provide a more accurate result to electric trucks’ actual viability.
Nonetheless, the results showed that São Paulo State and Brazil could have tremendous environmental gains from substituting internal combustion trucks to electric options such as battery and fuel-cell electric to maintain its renewability in electricity generation or develop an infrastructure capable of supplying hydrogen. However, as the most expensive options, there are still considerable barriers to their deployment. If legislation prohibiting using fossil fuels in freight is eventually approved, financial incentives will be necessary for electric vehicles and renewable energy; otherwise, São Paulo will not accomplish the expected environmental benefits.

Author Contributions

Conceptualization, P.G.M., A.C.R.T., F.M.d.A.C., D.M.; methodology, P.G.M., A.C.R.T., F.M.d.A.C., D.M.; software, P.G.M., F.M.d.A.C.; validation, P.G.M., F.M.d.A.C.; formal analysis, P.G.M., F.M.d.A.C., A.C.R.T.; investigation, P.G.M., A.C.R.T., F.M.d.A.C.; resources, A.H., D.M.; data curation, A.C.R.T., P.G.M., F.M.d.A.C.; writing—original draft preparation, P.G.M., A.C.R.T.; writing—review and editing, P.G.M., A.C.R.T., F.M.d.A.C., A.H., D.M.; visualization, P.G.M., A.C.R.T.; supervision, D.M., A.H.; project administration, D.M.; funding acquisition, D.M., A.H. All authors have read and agreed to the published version of the manuscript.

Funding

FAPESP, grant number 2014/50279-4, funded this research. PGM was funded by CNPq grant number 205987/2018-4. ACRT was funded by FAPESP grant number 2019/09242-3.

Conflicts of Interest

The authors declare no conflict of interest.

Appendix A

Table A1. Life cycle profiles of emission degradation and survival rates of MHDT.
YearsEmDeg CO (%)EmDeg HC (%)EmDeg CH4 (%)EmDeg Nox (%)EmDeg MP (%)EmDeg N2O (%)EmDeg CO2 (%)Surv MHDT
0100100100100100100100100
110010010010010010010097
21091021001049210096.6194.80
3532731100313574100108.6592.10
4489820100319572100108.6589.50
5561662100321593100108.6586.80
6563752100319636100108.6584.10
76671415100337834100108.6581.40
86671415100337834100108.6578.70
95671361100384773100108.6575.90
105951802100458969100108.6573.10
11109232331004692473100108.6570.30
12121539441007424973100108.6567.50
13121539441007424973100108.6564.60
14121539441007424973100108.6561.80
15121539441007424973100108.6558.90
16121539441007424973100108.6556.10
17121539441007424973100108.6553.20
18121539441007424973100108.6550.40
19121539441007424973100108.6547.70
20121539441007424973100108.6545.00
21121539441007424973100108.6542.30
22121539441007424973100108.6539.70
23121539441007424973100108.6537.20
24121539441007424973100108.6534.80
25121539441007424973100108.6532.50
26121539441007424973100108.6530.20
27121539441007424973100108.6528.10
28121539441007424973100108.6526.10
29121539441007424973100108.6524.10
30121539441007424973100108.6522.30
31121539441007424973100108.6520.60
32121539441007424973100108.6519.00
33121539441007424973100108.6517.50
34121539441007424973100108.6516.00
35121539441007424973100108.6514.90
36121539441007424973100108.6513.70
37121539441007424973100108.6512.60
38121539441007424973100108.6511.60
39121539441007424973100108.6510.70
40121539441007424973100108.659.90
41121539441007424973100108.659.10
42121539441007424973100108.658.40
43121539441007424973100108.657.80
44121539441007424973100108.657.20
45121539441007424973100108.656.60
46121539441007424973100108.656.10
47121539441007424973100108.655.60
48121539441007424973100108.655.20
49121539441007424973100108.654.80
50121539441007424973100108.654.40
51121539441007424973100108.654.10
52121539441007424973100108.653.70
53121539441007424973100108.653.40
54121539441007424973100108.653.20
55121539441007424973100108.652.90
56121539441007424973100108.652.60
57121539441007424973100108.652.40
58121539441007424973100108.652.10
59121539441007424973100108.651.90

References

  1. Liu, X. Microbial technology for the sustainable development of energy and environment. Biotechnol. Reports 2020, 27, e00486. [Google Scholar] [CrossRef]
  2. Schlenzig, C. Energy planning and environmental management with the information and decision support system MESAP. Int. J. Glob. Energy Issues 1998, 12, 81–91. [Google Scholar] [CrossRef]
  3. Capros, P.; Mantzos, L. European Union post-Kyoto scenarios: Benefits from accelerated technology progress. Int. J. Glob. Energy Issues 2000, 14, 204–221. [Google Scholar] [CrossRef]
  4. McDowall, W.; Anandarajah, G.; Dodds, P.E.; Tomei, J. Implications of sustainability constraints on UK bioenergy development: Assessing optimistic and precautionary approaches with UK MARKAL. Energy Policy 2012, 47, 424–436. [Google Scholar] [CrossRef] [Green Version]
  5. Pöschl, M.; Ward, S.; Owende, P. Evaluation of energy efficiency of various biogas production and utilization pathways. Appl. Energy 2010, 87, 3305–3321. [Google Scholar] [CrossRef]
  6. Cooper, J.; Hawkes, A.; Balcombe, P. Life cycle environmental impacts of natural gas drivetrains used in UK road freighting and impacts to UK emission targets. Sci. Total Environ. 2019, 674, 482–493. [Google Scholar] [CrossRef]
  7. Jacobsson, S.; Lauber, V. The politics and policy of energy system transformation—Explaining the German diffusion of renewable energy technology. Energy Policy 2006, 34, 256–276. [Google Scholar] [CrossRef]
  8. Sadri, A.; Ardehali, M.M.M.; Amirnekooei, K. General procedure for long-term energy-environmental planning for transportation sector of developing countries with limited data based on LEAP (long-range energy alternative planning) and EnergyPLAN. Energy 2014, 77, 831–843. [Google Scholar] [CrossRef]
  9. Machado, P.G.; Mouette, D.; Villanueva, L.D.; Esparta, A.R.; Mendes Leite, B.; Moutinho dos Santos, E. Energy systems modeling: Trends in research publication. Wiley Interdiscip. Rev. Energy Environ. 2018, 8, 1–15. [Google Scholar] [CrossRef]
  10. Hong, S.; Chung, Y.; Kim, J.; Chun, D. Analysis on the level of contribution to the national greenhouse gas reduction target in Korean transportation sector using LEAP model. Renew. Sustain. Energy Rev. 2016, 60, 549–559. [Google Scholar] [CrossRef]
  11. Takeshita, T. Assessing the co-benefits of CO2 mitigation on air pollutants emissions from road vehicles. Appl. Energy 2012, 97, 225–237. [Google Scholar] [CrossRef]
  12. Song, S. Assessment of transport emissions impact and the associated social cost for Chengdu, China. Int. J. Sustain. Transp. 2018, 12, 128–139. [Google Scholar] [CrossRef]
  13. Brown, K.E.; Henze, D.K.; Milford, J.B. Accounting for climate and air quality damages in future U.S. electricity generation scenarios. Environ. Sci. Technol. 2013, 47, 3065–3072. [Google Scholar] [CrossRef] [PubMed]
  14. Fan, F.; Lei, Y.; Li, L. Health damage assessment of particulate matter pollution in Jing-Jin-Ji region of China. Environ. Sci. Pollut. Res. 2019, 26, 7883–7895. [Google Scholar] [CrossRef]
  15. Cunha-Lopes, I.; Martins, V.; Faria, T.; Correia, C.; Almeida, S.M. Children’s exposure to sized-fractioned particulate matter and black carbon in an urban environment. Build. Environ. 2019, 155, 187–194. [Google Scholar] [CrossRef]
  16. Lumbreras, J.; Valdés, M.; Borge, R.; Rodríguez, M.E. Assessment of vehicle emissions projections in Madrid (Spain) from 2004 to 2012 considering several control strategies. Transp. Res. Part A Policy Pract. 2008, 42, 646–658. [Google Scholar] [CrossRef] [Green Version]
  17. Proost, S.; Van Regemorter, D.; Lantz, F.; Saint-Antonin, V. Limiting air pollution from transport: Economic evaluation of policy options for the European Union. Int. J. Glob. Energy Issues 2000, 14, 320–330. [Google Scholar] [CrossRef]
  18. Shabbir, R.; Ahmad, S.S. Monitoring urban transport air pollution and energy demand in Rawalpindi and Islamabad using leap model. Energy 2010, 35, 2323–2332. [Google Scholar] [CrossRef]
  19. Skytte, K.; Pizarro, A.; Karlsson, K.B. Use of electric vehicles or hydrogen in the Danish transport sector in 2050? Wiley Interdiscip. Rev. Energy Environ. 2017, 6, e233. [Google Scholar] [CrossRef] [Green Version]
  20. Quiros, D.C.; Smith, J.; Thiruvengadam, A.; Huai, T.; Hu, S. Greenhouse gas emissions from heavy-duty natural gas, hybrid, and conventional diesel on-road trucks during freight transport. Atmos. Environ. 2017, 168, 36–45. [Google Scholar] [CrossRef]
  21. Karkatsoulis, P.; Siskos, P.; Paroussos, L.; Capros, P. Simulating deep CO2 emission reduction in transport in a general equilibrium framework: The GEM-E3T model. Transp. Res. Part D Transp. Environ. 2017, 55, 343–358. [Google Scholar] [CrossRef]
  22. Mcmichael, A.J.; Campbell-Lendrum, D.H.; Corvalán, C.F.; Ebi, K.L.; Githeko, A.K.; Scheraga, J.D.; Woodward, A. Climate Change and Human Health: Risks and Responses; World Health Organization (WHO): Geneva, Switzerland, 2003. [Google Scholar]
  23. Ur Rehman, S.A.; Cai, Y.; Fazal, R.; Das Walasai, G.; Mirjat, N.H. An integrated modeling approach for forecasting long-term energy demand in Pakistan. Energies 2017, 10, 1868. [Google Scholar] [CrossRef] [Green Version]
  24. Wu, Q.; Peng, C. Scenario analysis of carbon emissions of China’s electric power industry up to 2030. Energies 2016, 9, 988. [Google Scholar] [CrossRef] [Green Version]
  25. de Almeida Collaço, F.M.; Simoes, S.G.; Dias, L.P.; Duic, N.; Seixas, J.; Bermann, C. The dawn of urban energy planning – Synergies between energy and urban planning for São Paulo (Brazil) megacity. J. Clean. Prod. 2019, 215, 458–479. [Google Scholar] [CrossRef]
  26. Zhang, L.; Feng, Y.; Chen, B. Alternative scenarios for the development of a low-carbon city: A case study of Beijing, China. Energies 2011, 4, 2295–2310. [Google Scholar] [CrossRef]
  27. Flores, W.C.; Bustamante, B.; Pino, H.N.; Al-Sumaiti, A.; Rivera, S. A national strategy proposal for improved cooking stove adoption in Honduras: Energy consumption and cost-benefit analysis. Energies 2020, 13, 921. [Google Scholar] [CrossRef] [Green Version]
  28. Nieves, J.A.; Aristizábal, A.J.; Dyner, I.; Báez, O.; Ospina, D.H. Energy demand and greenhouse gas emissions analysis in Colombia: A LEAP model application. Energy 2019, 169, 380–397. [Google Scholar] [CrossRef]
  29. Hu, G.; Ma, X.; Ji, J. Scenarios and policies for sustainable urban energy development based on LEAP model – A case study of a postindustrial city: Shenzhen China. Appl. Energy 2019, 238, 876–886. [Google Scholar] [CrossRef]
  30. Emodi, N.V.; Emodi, C.C.; Murthy, G.P.; Emodi, A.S.A. Energy policy for low carbon development in Nigeria: A LEAP model application. Renew. Sustain. Energy Rev. 2017, 68, 247–261. [Google Scholar] [CrossRef]
  31. Alamia, A.; Magnusson, I.; Johnsson, F.; Thunman, H. Well-to-wheel analysis of bio-methane via gasification, in heavy duty engines within the transport sector of the European Union. Appl. Energy 2016, 170, 445–454. [Google Scholar] [CrossRef]
  32. Bai, A.; Jobbágy, P.; Popp, J.; Farkas, F.; Grasselli, G.; Szendrei, J.; Balogh, P. Technical and environmental effects of biodiesel use in local public transport. Transp. Res. Part D Transp. Environ. 2016, 47, 323–335. [Google Scholar] [CrossRef]
  33. Ferreira, M.B.; Salvador, R.; Barros, M.V.; de Souza, J.T.; Rabelo, T.G.L.; de Francisco, A.C.; Coelho, R.; Piekarski, C.M. Eco-efficiency of the differential ratio change in a heavy-duty vehicle and implications for the automotive industry. Sustain. Prod. Consum. 2020, 21, 145–155. [Google Scholar] [CrossRef]
  34. Askin, A.C.; Barter, G.E.; West, T.H.; Manley, D.K. The heavy-duty vehicle future in the United States: A parametric analysis of technology and policy tradeoffs. Energy Policy 2015, 81, 1–13. [Google Scholar] [CrossRef] [Green Version]
  35. Liimatainen, H.; van Vliet, O.; Aplyn, D. The potential of electric trucks – An international commodity-level analysis. Appl. Energy 2019, 236, 804–814. [Google Scholar] [CrossRef]
  36. Sen, B.; Ercan, T.; Tatari, O. Does a battery-electric truck make a difference? – Life cycle emissions, costs, and externality analysis of alternative fuel-powered Class 8 heavy-duty trucks in the United States. J. Clean. Prod. 2017, 141, 110–121. [Google Scholar] [CrossRef]
  37. Gao, Z.; LaClair, T.J.; Smith, D.E.; Daw, C.S. Exploring fuel-saving potential of long-haul truck hybridization. Transp. Res. Rec. 2015, 2502, 99–107. [Google Scholar] [CrossRef]
  38. Liu, X.; Yu, X. Enhancement of Butanol Production: From Biocatalysis to Bioelectrocatalysis. ACS Energy Lett. 2020, 5, 867–878. [Google Scholar] [CrossRef]
  39. Onarheim, K.; Hannula, I.; Solantausta, Y. Hydrogen enhanced biofuels for transport via fast pyrolysis of biomass: A conceptual assessment. Energy 2020, 199, 117337. [Google Scholar] [CrossRef]
  40. Neuwahl, F.; Löschel, A.; Mongelli, I.; Delgado, L. Employment impacts of EU biofuels policy: Combining bottom-up technology information and sectoral market simulations in an input-output framework. Ecol. Econ. 2008, 68, 447–460. [Google Scholar] [CrossRef] [Green Version]
  41. Gerboni, R.; Grosso, D.; Carpignano, A.; Dalla Chiara, B. Linking energy and transport models to support policy making. Energy Policy 2017, 111, 336–345. [Google Scholar] [CrossRef]
  42. Chollacoop, N.; Saisirirat, P.; Fukuda, T.; Fukuda, A. Scenario analyses of road transport energy demand: A case study of ethanol as a diesel substitute in Thailand. Energies 2011, 4, 108–125. [Google Scholar] [CrossRef] [Green Version]
  43. de Almeida Collaço, F.M.; Dias, L.P.; Simoes, S.G.; Pukšec, T.; Seixas, J.; Bermann, C. What if São Paulo (Brazil) would like to become a renewable and endogenous energy -based megacity? Renew. Energy 2019, 138, 416–433. [Google Scholar] [CrossRef]
  44. Costa, E.; Seixas, J.; Costa, G.; Turrentine, T. Interplay between ethanol and electric vehicles as low carbon mobility options for passengers in the municipality of São Paulo. Int. J. Sustain. Transp. 2017, 11, 518–525. [Google Scholar] [CrossRef]
  45. Dias, M.V.X.; Haddad, J.; Horta Nogueira, L.; da Costa Bortoni, E.; Passos da Cruz, R.A.; Akira Yamachita, R.; Goncalves, J.L. The impact on electricity demand and emissions due to the introduction of electric cars in the São Paulo power system. Energy Policy 2014, 65, 298–304. [Google Scholar] [CrossRef]
  46. Heaps, C.G. Long-Range Energy Alternatives Planning (LEAP) System; Stockholm Environment Institute: Somerville, MA, USA, 2006. [Google Scholar]
  47. Bhattacharyya, S.C.; Timilsina, G.R. A review of energy system models. Int. J. Energy Sect. Manag. 2010, 4, 494–518. [Google Scholar] [CrossRef]
  48. Heaps, C. LEAP Data Requirements for Energy Planning and Mitigation Assessment. Available online: http://www.energycommunity.org/documents/DataRequirements.pdf (accessed on 15 March 2019).
  49. Ministério da Ciência Tecnologia e Inovações. Opções Transversais para Mitigação de Emissões de Gases de Efeito Estufa: Captura, Transporte e Armazenamento de Carbono; Rathmann, R., Ed.; Ministério da Ciência Tecnologia e Inovações: Brasilia, Brazil, 2017.
  50. Lee, D.-Y.; Elgowainy, A.; Kotz, A.; Vijayagopal, R.; Marcinkoski, J. Life-cycle implications of hydrogen fuel cell electric vehicle technology for medium- and heavy-duty trucks. J. Power Sources 2018, 393, 217–229. [Google Scholar] [CrossRef]
  51. Susmozas, A.; Iribarren, D.; Zapp, P.; Linβen, J.; Dufour, J. Life-cycle performance of hydrogen production via indirect biomass gasification with CO2 capture. Int. J. Hydrogen Energy 2016, 41, 19484–19491. [Google Scholar] [CrossRef]
  52. Dufour, J.; Serrano, D.P.; Gálvez, J.L.; Moreno, J.; García, C. Life cycle assessment of processes for hydrogen production. Environmental feasibility and reduction of greenhouse gases emissions. Int. J. Hydrogen Energy 2009, 34, 1370–1376. [Google Scholar] [CrossRef]
  53. Balcombe, P.; Anderson, K.; Speirs, J.; Brandon, N.; Hawkes, A. Methane and CO2 Emissions From the Natural Gas Supply Chain an Evidence Assessment. Available online: www.sustainablegasinstitute.org (accessed on 12 May 2020).
  54. Ipeadata. PIB Estadual. Available online: http://www.ipeadata.gov.br/Default.aspx (accessed on 22 February 2017).
  55. Ipeadata. PIB Estadual per Capita. Available online: http://www.ipeadata.gov.br/Default.aspx (accessed on 22 February 2017).
  56. ANP. Anuário Estatístico Brasileiro do Petróleo, Gás Nnatural e Biocombustíveis. Available online: http://www.anp.gov.br/publicacoes/anuario-estatistico (accessed on 9 April 2020).
  57. SEEMSP. Balanço Energético do Estado de São Paulo 2017: Ano Base 2016. Available online: http://dadosenergeticos.energia.sp.gov.br/portalcev2/intranet/BiblioVirtual/diversos/BalancoEnergetico.pdf (accessed on 22 April 2019).
  58. CETESB. Emissões Veiculares no Estado de São Paulo 2014. Available online: https://cetesb.sp.gov.br/veicular/relatorios-e-publicacoes/ (accessed on 5 December 2018).
  59. SEEMSP. Dados Gás, Petróleo e Derivados. Available online: https://www.infraestruturameioambiente.sp.gov.br/infraestrutura/coordenadorias/coordenadoria-de-petroleo-gas-e-mineracao/dados-do-setor-de-petroleo-e-gas/ (accessed on 22 April 2019).
  60. ANEEL. BIG—Banco de Informações de Geração. Available online: https://www2.aneel.gov.br/aplicacoes/capacidadebrasil/Combustivel.cfm (accessed on 9 April 2020).
  61. de Villiers, M.G.; Kenny, A.R.; Howells, M.I. Sustainable Energy for South Africa: LEAP Data; Energy Research Institute: London, UK, 1999. [Google Scholar]
  62. de Villiers, M.G. Greenhouse Gas Baseline and Mitigation Options for the Commercial Sector; Energy Research Institute: London, UK, 1999. [Google Scholar]
  63. Souza, S.P. de Avaliação de Aspectos Econômicos e Ambientais da Produção Integrada de Etanol e Biodiesel. Available online: http://repositorio.unicamp.br/jspui/handle/REPOSIP/265819 (accessed on 26 August 2018).
  64. Sharma, A.; Strezov, V. Life cycle environmental and economic impact assessment of alternative transport fuels and power-train technologies. Energy 2017, 133, 1132–1141. [Google Scholar] [CrossRef]
  65. Intergovernmental Panel on Climate Change—IPCC. Revised 1996 IPCC Guidelines for National Greenhouse Gas Inventories. Volume 3: Reference Manual. 2020. Available online: https://www.ipcc-nggip.iges.or.jp/public/gl/invs1.html (accessed on 9 April 2019).
  66. EPE. Plano Decenal de Expansão de Energia 2029. Available online: https://www.epe.gov.br/pt/publicacoes-dados-abertos/publicacoes/plano-decenal-de-expansao-de-energia-2029 (accessed on 27 April 2020).
  67. EPE. Sistema de Informações Geográficas do Setor Energético Brasileiro. Available online: https://gisepe.epe.gov.br/WebMapEPE/ (accessed on 9 April 2020).
  68. SEEMSP. Matriz Energética do Estado de São Paulo 2035. Available online: https://cetesb.sp.gov.br/proclima/2011/03/09/matriz-energetica-do-estado-de-sao-paulo-2035/ (accessed on 4 June 2020).
  69. Brasil. Modelagem Setorial de Opções de Baixo Carbono para o Setor de Transportes. Available online: https://www.mctic.gov.br/mctic/opencms/ciencia/SEPED/clima/opcoes_mitigacao/Opcoes_de_Mitigacao_de_Emissoes_de_Gases_de_Efeito_Estufa_GEE_em_SetoresChave_do_Brasil.html (accessed on 20 October 2019).
  70. Brasil. Projeto de Lei do Senado n° 304, de 2017. Available online: https://www25.senado.leg.br/web/atividade/materias/-/materia/130612 (accessed on 4 June 2020).
  71. Mackay, D.J.C. Introduction to Monte Carlo Methods. In Learning in Graphical Models; Springer Netherlands: Dordrecht, The Netherlands, 1998; pp. 175–204. ISBN 0-262-60032-3. [Google Scholar]
  72. Tong, F.; Jaramillo, P.; Azevedo, I.M.L. Comparison of Life Cycle Greenhouse Gases from Natural Gas Pathways for Medium and Heavy-Duty Vehicles. Environ. Sci. Technol. 2015, 49, 7123–7133. [Google Scholar] [CrossRef] [Green Version]
  73. Çelebi, K.; Uludamar, E.; Tosun, E.; Yıldızhan, Ş.; Aydın, K.; Özcanlı, M. Experimental and artificial neural network approach of noise and vibration characteristic of an unmodified diesel engine fuelled with conventional diesel, and biodiesel blends with natural gas addition. Fuel 2017, 197, 159–173. [Google Scholar] [CrossRef]
  74. Baltacioglu, M.K.; Arat, H.T.; Özcanli, M.; Aydin, K. Experimental comparison of pure hydrogen and HHO (hydroxy) enriched biodiesel (B10) fuel in a commercial diesel engine. Int. J. Hydrogen Energy 2016, 41, 8347–8353. [Google Scholar] [CrossRef]
  75. Ogunkoya, D.; Fang, T. Engine performance, combustion, and emissions study of biomass to liquid fuel in a compression-ignition engine. Energy Convers. Manag. 2015, 95, 342–351. [Google Scholar] [CrossRef]
  76. Adam, A.; Ramlan, N.A.; Jaharudin, N.F.; Hamzah, H.; Othman, M.F.; Mrwan, A.A.G. Analysis of combustion characteristics, engine performance and exhaust emissions of diesel engine fueled with upgraded waste source fuel. Int. J. Hydrogen Energy 2017, 42, 17993–18004. [Google Scholar] [CrossRef] [Green Version]
  77. MMA. Poluentes Atmosféricos. Available online: https://www.mma.gov.br/cidades-sustentaveis/qualidade-do-ar/poluentes-atmosféricos.html#Dioxido_de_nitrogenio (accessed on 15 August 2019).
  78. Emiroğlu, A.O.; Şen, M. Combustion, performance and exhaust emission characterizations of a diesel engine operating with a ternary blend (alcohol-biodiesel-diesel fuel). Appl. Therm. Eng. 2018, 133, 371–380. [Google Scholar] [CrossRef]
  79. Hoekman, S.K.; Robbins, C. Review of the effects of biodiesel on NOx emissions. Fuel Process. Technol. 2012, 96, 237–249. [Google Scholar] [CrossRef]
  80. Qasim, M.; Ansari, T.M.; Hussain, M. Combustion, performance, and emission evaluation of a diesel engine with biodiesel like fuel blends derived from a mixture of Pakistani waste canola and waste transformer oils. Energies 2017, 10, 1023. [Google Scholar] [CrossRef] [Green Version]
  81. Liu, J.; Wang, H.; Li, Y.; Zheng, Z.; Xue, Z.; Shang, H.; Yao, M. Effects of diesel/PODE (polyoxymethylene dimethyl ethers) blends on combustion and emission characteristics in a heavy duty diesel engine. Fuel 2016, 177, 206–216. [Google Scholar] [CrossRef]
  82. Hosseini, S.M.; Ahmadi, R. Performance and emissions characteristics in the combustion of co-fuel diesel-hydrogen in a heavy duty engine. Appl. Energy 2017, 205, 911–925. [Google Scholar] [CrossRef]
  83. Singh, D.; Singal, S.K.; Garg, M.O.; Maiti, P.; Mishra, S.; Ghosh, P.K. Transient performance and emission characteristics of a heavy-duty diesel engine fuelled with microalga Chlorella variabilis and Jatropha curcas biodiesels. Energy Convers. Manag. 2015, 106, 892–900. [Google Scholar] [CrossRef]
  84. Pan, W.; Yao, C.; Han, G.; Wei, H.; Wang, Q. The impact of intake air temperature on performance and exhaust emissions of a diesel methanol dual fuel engine. Fuel 2015, 162, 101–110. [Google Scholar] [CrossRef]
  85. Vermeulen, R.; Verbeek, R.; van Goethem, S.; Smokers, R. Emissions Testing of two Euro VI LNG Heavy-Duty Vehicles in the Netherlands: Tank-to-Wheel Emissions. Available online: https://publications.tno.nl/publication/34625802/QoDRSe/TNO-2017-R11336.pdf (accessed on 12 August 2018).
  86. Grigoratos, T.; Fontaras, G.; Martini, G.; Peletto, C. A study of regulated and green house gas emissions from a prototype heavy-duty compressed natural gas engine under transient and real life conditions. Energy 2016, 103, 340–355. [Google Scholar] [CrossRef]
  87. Yuan, J.H.; Zhou, S.; Peng, T.D.; Wang, G.H.; Ou, X.M. Petroleum substitution, greenhouse gas emissions reduction and environmental benefits from the development of natural gas vehicles in China. Pet. Sci. 2018, 15, 644–656. [Google Scholar] [CrossRef] [Green Version]
  88. Heywood, J.B. Internal Combustion Engine: Fundamentals, 2nd ed.; McGraw-Hill Education: New York, NY, USA, 2018. [Google Scholar]
  89. Sathiyamoorthi, R.; Sankaranarayanan, G.; Adhith kumaar, S.B.; Chiranjeevi, T.; Dilip Kumar, D. Experimental investigation on performance, combustion and emission characteristics of a single cylinder diesel engine fuelled by biodiesel derived from Cymbopogon Martinii. Renew. Energy 2019, 132, 394–415. [Google Scholar] [CrossRef]
  90. Nantha Gopal, K.; Ashok, B.; Senthil Kumar, K.; Thundil Karuppa Raj, R.; Denis Ashok, S.; Varatharajan, V.; Anand, V. Performance analysis and emissions profile of cottonseed oil biodiesel–ethanol blends in a CI engine. Biofuels 2018, 9, 711–718. [Google Scholar] [CrossRef]
  91. Al-lwayzy, S.H.; Yusaf, T. Diesel engine performance and exhaust gas emissions using Microalgae Chlorella protothecoides biodiesel. Renew. Energy 2017, 101, 690–701. [Google Scholar] [CrossRef]
  92. CETESB. Poluentes—Qualidade do Ar. Available online: https://cetesb.sp.gov.br/ar/poluentes/ (accessed on 15 August 2019).
  93. Dapper, S.N.; Spohr, C.; Zanini, R.R. Poluição do ar como fator de risco para a saúde: Uma revisão sistemática no estado de São Paulo. Estud. AVANÇADOS 2016, 30, 83–97. [Google Scholar] [CrossRef]
  94. Teixeira, A.C.R.; Borges, R.R.; Machado, P.G.; Mouette, D.; Dutra Ribeiro, F.N. PM emissions from heavy-duty trucks and their impacts on human health. Atmos. Environ. 2020, 241, 117814. [Google Scholar] [CrossRef]
  95. Hora, T.S.; Agarwal, A.K. Experimental study of the composition of hydrogen enriched compressed natural gas on engine performance, combustion and emission characteristics. Fuel 2015, 160, 470–478. [Google Scholar] [CrossRef]
  96. Park, C.W.; Kim, C.G.; Choi, Y.; Lee, S.Y.; Lee, S.W.; Yi, U.H.; Lee, J.H.; Kim, T.M.; Kim, D.S. development of hydrogen-compressed natural gas blend engine for heavy duty vehicles. Int. J. Automot. Technol. 2017, 18, 1061–1066. [Google Scholar] [CrossRef]
  97. Lajevardi, S.M.; Axsen, J.; Crawford, C. Examining the role of natural gas and advanced vehicle technologies in mitigating CO2 emissions of heavy-duty trucks: Modeling prototypical British Columbia routes with road grades. Transp. Res. Part D Transp. Environ. 2018, 62, 186–211. [Google Scholar] [CrossRef]
  98. Tu, J.; Yang, C. Key Factors Influencing Consumers’ Purchase of Electric Vehicles. Sustainability 2019, 11, 3863. [Google Scholar] [CrossRef] [Green Version]
  99. Yang, Y.; Tan, Z. Investigating the Influence of Consumer Behavior and Governmental Policy on the Diffusion of Electric Vehicles in Beijing, China. Sustainability 2019, 11, 6967. [Google Scholar] [CrossRef] [Green Version]
  100. Dias, J.L.D.M.; Quaglino, M.A. A questão do petróleo no Brasil: Uma história da Petrobrás; Fundação Getúlio Vargas: Rio de Janeiro, Brazil, 1993. [Google Scholar]
  101. Barat, J. A evolução dos transportes no Brasil; IBGE: Rio de janeiro, Brazil, 1978.
  102. Moreira, J.R.; Goldemberg, J. The alcohol program. Energy Policy 1999, 27, 229–245. [Google Scholar] [CrossRef]
  103. EPE; BEN—Séries Históricas Completas. Available online: http://www.epe.gov.br/pt/publicacoes-dados-abertos/publicacoes/BEN-Series-Historicas-Completas (accessed on 18 October 2019).
  104. MME. Síntese RenovaBio. Available online: http://www.mme.gov.br/documents/10584/135676503/RENOVABIO_breve+resumo.pdf/4cc8ffe5-c517-45db-adc4-a81acd138384 (accessed on 3 July 2019).
  105. Laldjebaev, M.; Morreale, S.J.; Sovacool, B.K.; Kassam, K.A.S. Rethinking energy security and services in practice: National vulnerability and three energy pathways in Tajikistan. Energy Policy 2018, 114, 39–50. [Google Scholar] [CrossRef] [Green Version]
  106. Bluszcz, A. European economies in terms of energy dependence. Qual. Quant. 2016, 51. [Google Scholar] [CrossRef] [Green Version]
  107. Bompard, E.; Carpignano, A.; Erriquez, M.; Grosso, D.; Pession, M.; Profumo, F. National energy security assessment in a geopolitical perspective. Energy 2017, 130, 144–154. [Google Scholar] [CrossRef] [Green Version]
  108. MDIC. Rota 2030—Mobilidade e Logística. Available online: http://www.mdic.gov.br/index.php/competitividade-industrial/setor-automotivo/rota2030 (accessed on 16 July 2019).
  109. Schulte, J.; Ny, H. Electric road systems: Strategic stepping stone on the way towards sustainable freight transport? Sustain. 2018, 10, 1148. [Google Scholar] [CrossRef] [Green Version]
  110. Zhao, Y.; Onat, N.C.; Kucukvar, M.; Tatari, O. Carbon and energy footprints of electric delivery trucks: A hybrid multi-regional input-output life cycle assessment. Transp. Res. Part D Transp. Environ. 2016, 47, 195–207. [Google Scholar] [CrossRef]
  111. Azevedo Filho, E.T.; Palma, M.A.M.; Perestrelo, M.; da Hora, H.R.M.; Lira, R.A. The pre-salt layer and challenges to competitiveness in Brazil: Critical reflections on the local content policy in the oil and gas Sector. Extr. Ind. Soc. 2019, 6, 1168–1173. [Google Scholar] [CrossRef]
Figure 1. Systematic review flowchart.
Energies 13 05433 g001
Figure 2. Representation of current and new infrastructure of the São Paulo state energy system to supply current and new technologies for MHDV.
Energies 13 05433 g002
Figure 3. Fleet evolution from diesel to alternative option based on the assumption of diesel vehicles sales prohibition.
Energies 13 05433 g003
Figure 4. GHG emissions change in percent-change in comparison to the baseline scenario from 2014 to 2050.
Energies 13 05433 g004
Figure 5. CO emissions change in percent-change in comparison to the baseline scenario from 2014 to 2050.
Energies 13 05433 g005
Figure 6. HC emissions change in percent-change in comparison to the baseline scenario from 2014 to 2050.
Energies 13 05433 g006
Figure 7. NOx emissions change in percent-change in comparison to the baseline scenario from 2014 to 2050.
Energies 13 05433 g007
Figure 8. PM emissions change in percent-change in comparison to the baseline scenario from 2014 to 2050.
Energies 13 05433 g008
Figure 9. Sensitivity analysis for GHG, NOx, PM, CO, and HC for the years of 2050 of the percent-difference in emissions between alternative options and diesel.
Energies 13 05433 g009
Figure 10. Cumulative probability of the absolute cost difference (in R$ of 2014) between diesel and alternative MHDT. (Higher than zero = alternative vehicle is cheaper than diesel).
Energies 13 05433 g010
Table 1. Fuel consumption, CO2, CH4, N2O and pollutants emission factors for MHDV alternative technologies and new fuel processing facilities.
Demand
TechnologyFuel Consumption (MJ/100 km)CO2 (g/kWh)CH4 (g/kWh)N2O (g/kWh)NOx (g/kWh)PM (g/kWh)HC (g/kWh)CO (g/kWh)
CNG a1131.9575.25.420.00162.240.010.871.15
LNG a1165.9354.30.270.00161.760.010.442.24
Diesel Hybrid b1104.03440.010.0080.330.0020.0030.03
Biodiesel a1976.00--4.110.040.053.4
Fuel-cell electric a917.00000000
Battery electric a456.00000000
Transformation
TechnologyCO2e (g/MJ)NOx (g/MJ)PM (g/MJ)HC (g/MJ)CO (g/MJ)
Hydrogen (steam methane reform) c570.030.006-0.02
NG liquefaction d8----
CNG = compressed natural gas; NG = natural gas; LNG = liquified natural gas; NOx = nitrogen oxides; PM = particulate matter; HC = hydrocarbons; CO = carbon monoxide. a Result from the review. b Based on [34]. c [50,51,52]. d [53].
Table 2. Base year information for the energy system in the State of São Paulo, MHDV and transformation (2014).
Demand
VehiclesStock (Units)Scrappage (Units)Sales (Units)Fuel Consumption (MJ/100 km)Mileage (Kilometers)
Medium and heavy-duty trucks (diesel) a412,04416,15045,685160823,570
Transformation
Processing unitCapacity (MBOE/year)
Crude oil refineries b
REVAP92.73
REPLAN152.2
RPBC63.8
RECAP19.6
NGPU b
Caraguatatuba51.1
RPBC6.4
Biodiesel plants c
Bio Petro0.2
Biocapital0.4
JBS0.6
Orlândia0.4
SP Bio0.2
Electricity generation dCapacity (MW)
Hydropower13,290.0
Sugarcane bagasse5557.5
Natural gas987.8
Other fossil1176.8
Other renewable47.7
REVAP = Refinaria Henrique Lage; REPLAN = Refinaria de Paulínia; RBPC = Refinaria Presidente Bernardes; RECAP = Refinaria de Capuava. a [58]. b [59]. c [56]. d [60].
Table 3. Environmental loading information for existing technologies.
Demand
VehiclesCO2 CH4N2ONOxPMHCCO
Medium and heavy-duty trucks (diesel) (g/km) a1229.40.060.031.130.010.010.12
Transformation
CO2 CH4N2OCO2eNOxPMHCCO
Crude oil processing (t/TJ) b8---0.020.0035--
NGPU (t/TJ) c---120.220.002--
Biodiesel plant (t/TJ) d---760.270.027-0.09
Electricity generation (t/TJ) e
Natural gas55.80.24--1.3--0.34
Diesel72.50.04--1.3--0.35
Residual oil76.50.00090.0003-0.2--0.015
Petroleum coke76.50.00090.0003-0.2--0.015
Refinery feedstocks76.50.00090.0004-0.22--0.016
Sugarcane bagasse00.00030.004-0.1--0.1
Wood00.030.004-0.1--0.1
NGPU = natural gas processing unit; NOx = nitrogen oxides; PM = particulate matter; HC = hydrocarbons; CO = carbon monoxide. a [58]. b [61,62]. c CO2e taken from [53], pollutant emissions from [61,62]. d [63,64]. e [65].
Table 4. Medium and heavy-duty trucks purchase cost for diesel, battery-electric, CNG, hybrid, biodiesel, and fuel-cell electric vehicles found in the literature review in R$ of 2014 per vehicle.
R$ (2014)/VehicleBattery ElectricDieselLNGCNGHybridBiodieselFuel-Cell Electric
Minimum498,946.4139,344.3187,598.0356,088.7277,108.7228,707.8571,719.0
Average880,552.3243,077.8319,645.1445,110.9298,834.3285,884.7714,648.7
Maximum1,114,503.9386,043.6416,672.9534,133.1324,470.6343,061.6857,578.5
CNG = compressed natural gas; LNG = liquified natural gas.
Table 5. Assumptions common to all scenarios.
VariablePremise
GDP increaseBased on [49]
Demand
Medium and heavy-duty trucks sales aElasticity of 1.09 to GDP growth [69]
Transformation
NPGU capacity increase bAddition of 10 × 106 m3/day in 2040, with availability increasing from 54% in 2014 to 100% in 2050.
Crude oil refineries capacity increase cNo additional processing increase
Biodiesel plants dCapacity growth of 3.9% per year, with availability increasing from 25% in 2014 to 100% in 2050.
Electricity generation e
  Natural gas Capacity growth of 1.5% per year
  DieselCapacity growth of 3% per year
  HydropowerCapacity growth of 0.3% per year
  SolarCapacity growth of 3% per year
  Sugarcane bagasseCapacity growth of 4.7% per year
  WoodCapacity growth of 3.3% per year
  WindCapacity growth of 7.6% per year
GDP = gross domestic product; NPGU = natural gas processing unit. a [69]. b Brazilian 2029 energy plan does not include any new additional capacity of natural gas processing, but the Brazilian energy Company has proposed the construction of a neu NPGU in the State of São Paulo with a capacity of 10 × 106 m3/day [67]. c No new facilities for crude oil processing have been proposed in the State, nor is it included in any energy plan. d Based on the projected biodiesel capacity in [66]. e [68].
Table 6. Minimum and maximum values for each indicator to calculate sensitivity.
Demand
Tech.Fuel Economy (MJ/100 km)CO2 (g/kWh)CH4 (g/kWh)N2O (g/kWh)NOx (g/kWh)PM (g/kWh)HC (g/kWh)CO (g/kWh)
MinMaxMinMaxMinMaxMinMaxMinMaxMinMaxMinMaxMinMax
CNG a210204017111190.1710.8−20%+20%0.019.0800.020.0940.019
LNG a7431394273434−20%+20%−20%+20%0.035.0400.01−20%+20%−20%+20%
Diesel Hybrid a9091300−20%+20%−20%+20%−20%+20%−20%+20%−20%+20%−20%+20%−20%+20%
Biodiesel a5553852−20%+20%−20%+20%−20%+20%−20%+20%−20%+20%−20%+20%−20%+20%
Fuel-cell electric a7501025--------------
Electric a144936 -------------
Transformation
Tech.CO2e (g/MJ)NOx (g/MJ)PM (g/MJ)HC (g/MJ)CO (g/MJ)
MinMaxMinMaxMinMaxMinMaxMinMax
NGPU b033−20%+20%0.090.11----
H2 SMR c0590.020.050.0050.008--0.020.027
NG liq. d020--------
Biodiesel plant e01020.240.290.0240.029--0.080.1
Electricity generation
Fossil fuels0+20%−20%+20%----−20%+20%
Sugarcane bagasse--−20%+20%----−20%+20%
CNG = compressed natural gas; LNG = liquified natural gas; NGPU = natural gas processing unit; SMR = steam methane reform; NOx = nitrogen oxide; PM = particulate matter; HC = hydrocarbon; CO = carbon oxide. a Absolute values were taken from the systematic review. b Lower values for CO2 were based on the assumption of direct or indirect carbon and capture. Other values were based on [53]. c Lower values for CO2 were based on the assumption of direct or indirect carbon and capture. Other values were based on [50,51,52]. d [53]. e [63,64].
Publisher’s Note: MDPI stays neutral with regard to jurisdictional claims in published maps and institutional affiliations.