1. Introduction
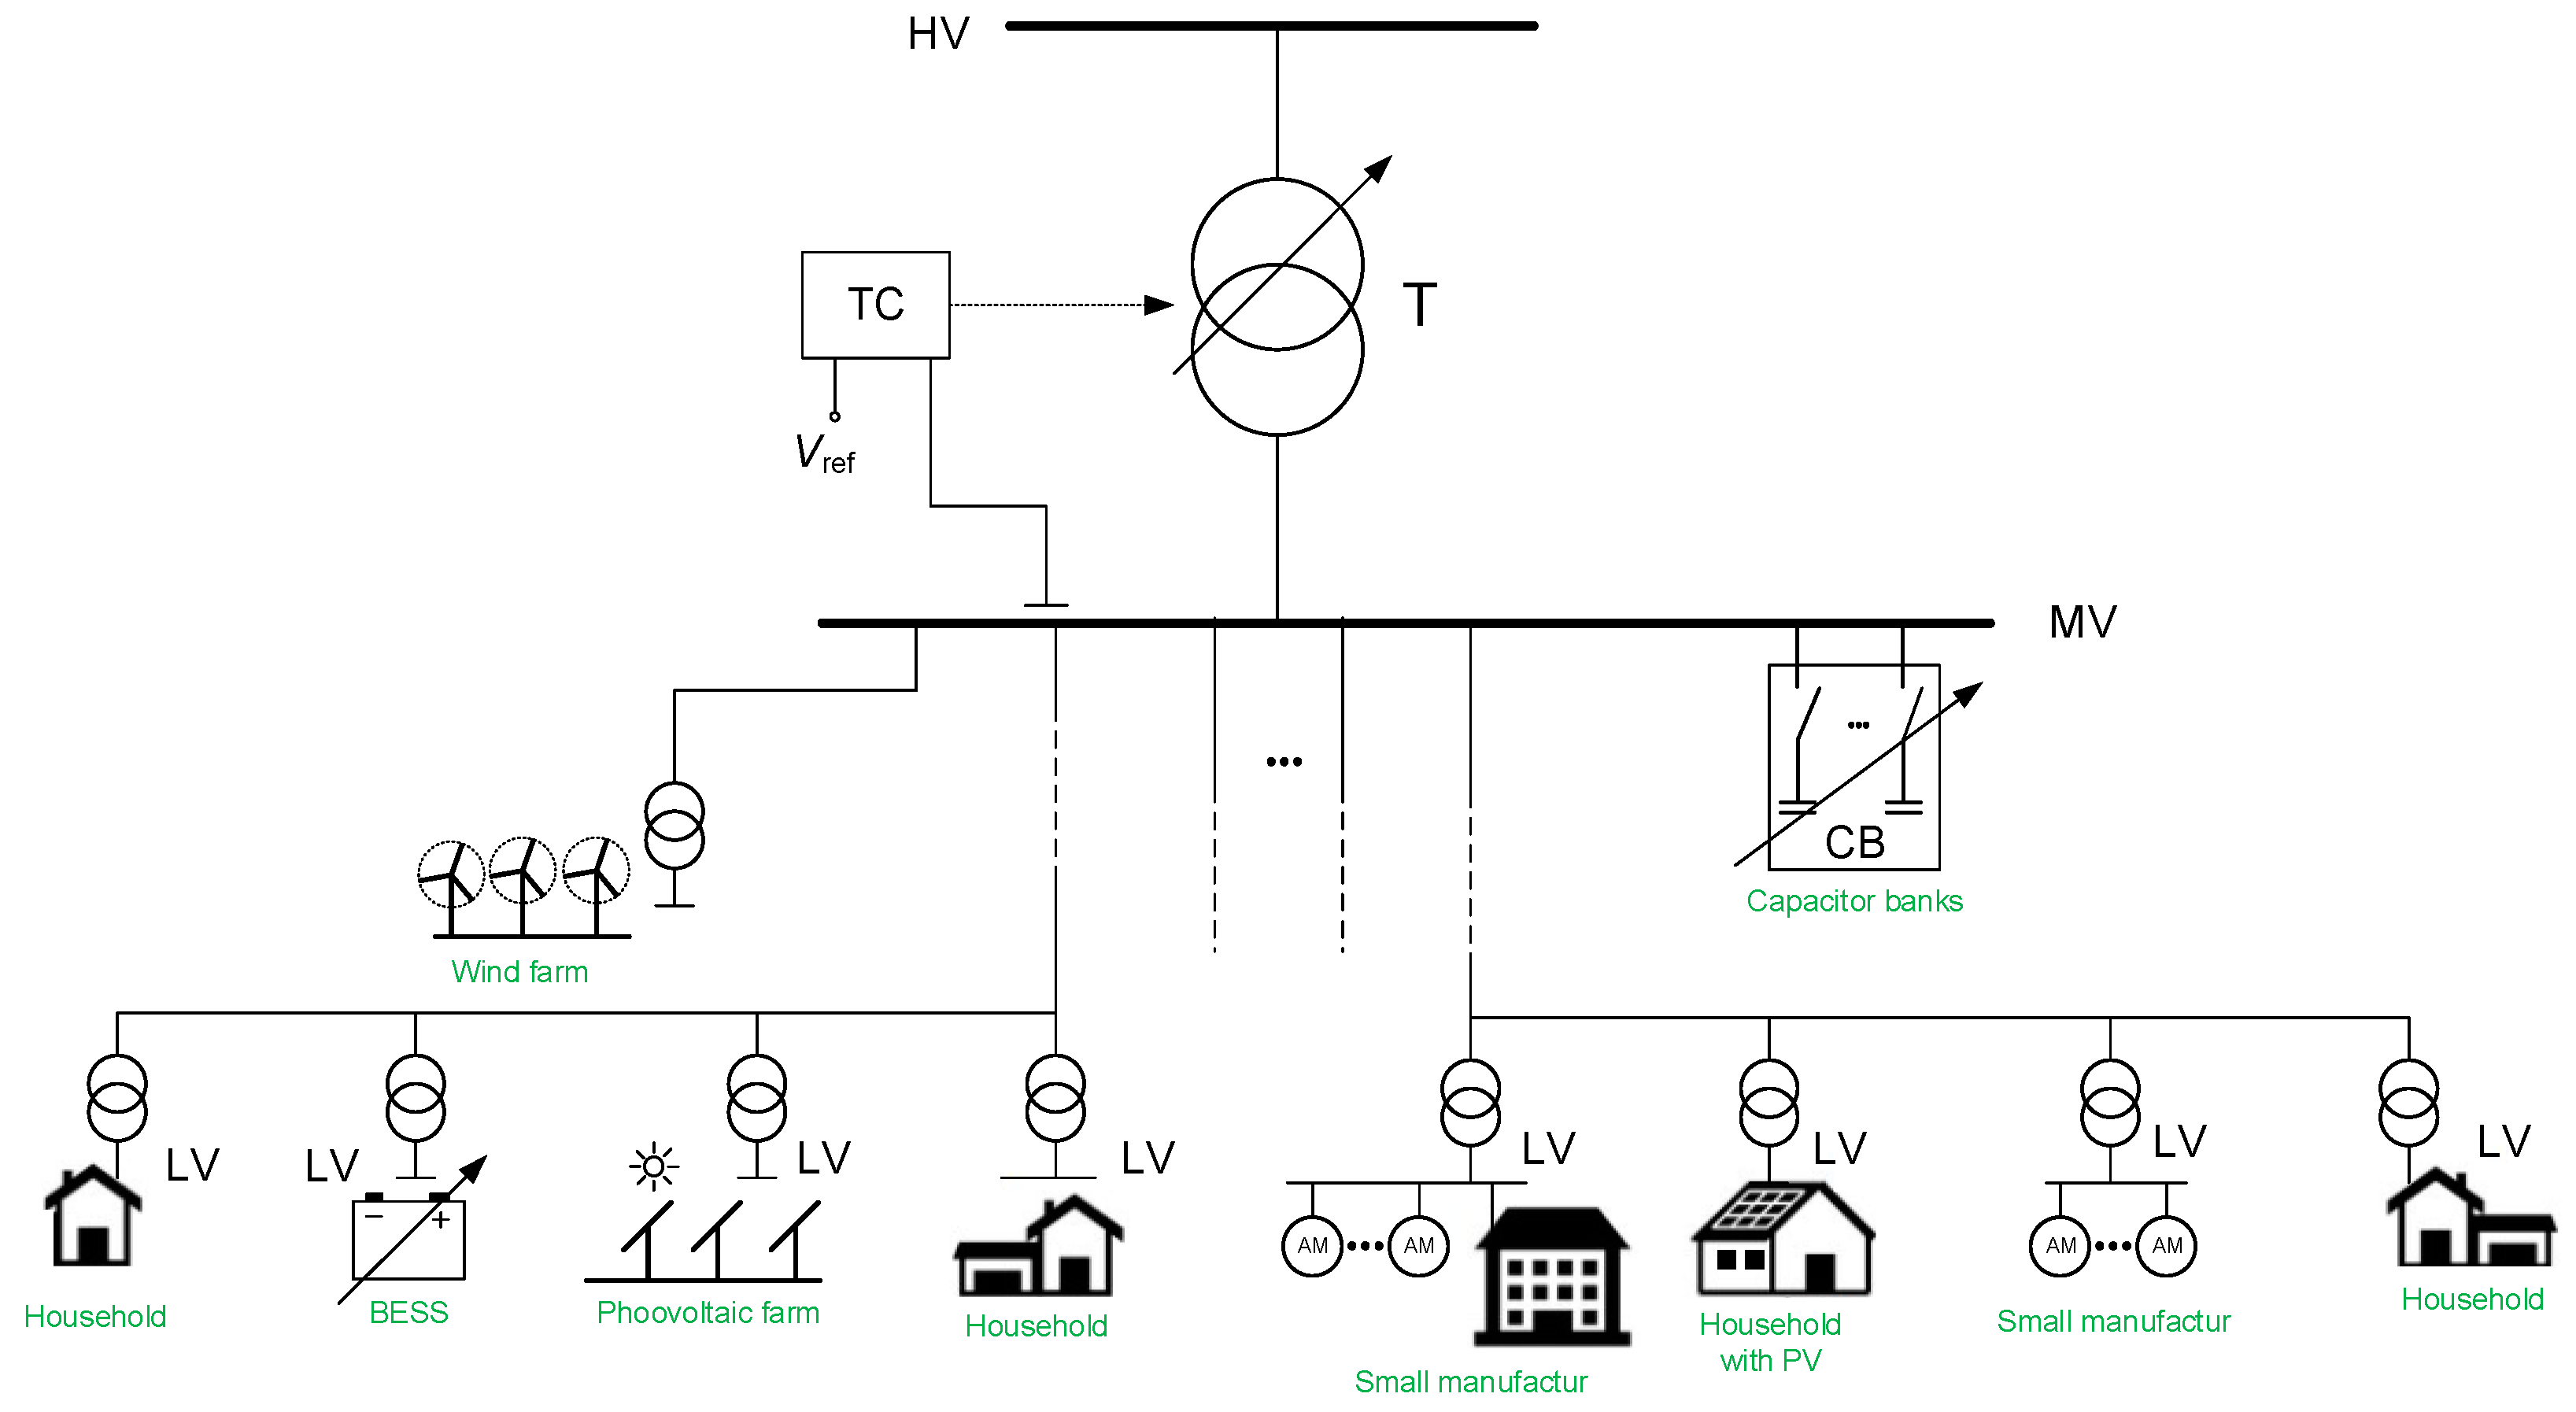
The interface between the High-Voltage (HV) transmission grid and the Medium-Voltage (MV) distribution network are HV/MV substations. An example of the structure of such a station is shown in
Figure 1. In some HV/MV substations, stations shunt compensators are installed. Most often they are Capacitor Banks (CB), less often reactors.
The variability of active power and reactive power of sources creates the need for voltage regulation. Voltage regulation is done primarily by changing the power transformer voltage ratio in the HV/MV substation and by controlling shunt capacitors (if any). A criterion for the operation of a transformer regulator in a HV/MV substation is to maintain the preset voltage value on the MV side Vref. The range of voltage variations is determined by the transformer parameters and the network characteristic. The regulation capacities of a transformer are usually a dozen or so taps that enable voltage change within a range of several dozen percent of the rated voltage. Preset values along with a schedule of changes are defined offline by the operation staff. The voltage regulation is continued either until an extreme maximum or minimum tap position is achieved, or until the voltage value attains one of the limiting values: of over-voltage VTmax or under-voltage VTmin.
An item of the equipment of some HV/MV substations are also capacitor banks. Their regulation involves switching individual sections on or off. Switching processes are determined by, inter alia, the time schedule and are done by manual switch-on, either remotely or locally, or by an individual controller operating in voltage regulation mode.
To minimize the influence of load variability on the voltage levels in the network, requirements to improve the reactive power management are imposed on both the generators and consumers [
1]. These are generally limited to the requirement to maintain a constant preset magnitude of reactive power or not to exceed the preset value of the coefficient tg.
Usually, when the volume of distributed generation and daily variability of loads are low, the efficiency of voltage regulation by changing the power transformer ratio is satisfactory. However, in networks with a high saturation of distributed generation, the efficiency of such a method of voltage regulation is increasingly often insufficient. High generation variability (wind, photovoltaic generation) deteriorates the voltage profiles on the grid [
2,
3,
4,
5,
6,
7,
8,
9]. An equally important problem is periodically too low or too high voltage in the network [
10,
11]. Too high voltage occurs as a result of a change in the typical direction of power flow (flow—from HV/MV substations to consumers) caused by a large generation volume, e.g., as a result of favorable weather conditions.
The possibilities of improving the quality of regulation, which can be found in the literature, e.g., [
2,
3,
4,
5,
6,
10,
12], most often include various methods of coordination of the operation of the transformer regulator with various devices operating in the MV network. This coordination can be decentralized or centralized.
Most of the proposed solutions do not assume a change of the transformer regulator algorithm.
The analysis of the operation algorithms of the transformer regulators supplying the distribution network showed that no solution would take into account the change like the d
Q/d
V coefficient. There is, however, a commercial device called Collapse Prediction Relay (CPR-D) offered by A-Eberle [
13,
14,
15] but its algorithm is very complex. To determine the need to block or properly control the transformer tap changer, the following are used: bifurcation theory [
16,
17,
18] in combination with neural network elements, determination of Lyapunov exponents, identification of voltage drop and, finally, damping coefficients.
Bearing the above in mind, an attempt was made to develop an effective and simple method of controlling the operation of the transformer supplying the distribution network. The main difference between the aforementioned CPR-D system and the proposed co-authoring algorithm lies in the specific purpose of operation. In the case of the CPR-D system, the aim is to identify the state of emergency, while the purpose of the proposed adaptive control system for transformers supplying the distribution network is to prevent the emergence of a voltage avalanche hazard.
The paper will present an algorithm for the operation of the regulator of a distribution network-supply transformer, which is protected by the patent [
19]. The solution presented in the paper extends the functionality of the typical algorithms of the power transformer regulator. In the described solution, in the normal operating state of the network, the power transformer regulator works according to a typical manufacturer-defined algorithm. The proposed algorithm is activated only when there is a risk of voltage collapse, possibly leading to a blackout.
Moreover, in this paper, theoretical fundamentals concerning the effect of the regulation of the transformer voltage ratio on the risk of an occurrence of a voltage collapse, and the results of the simulation studies and laboratory tests of the proposed algorithm will be described.
2. Voltage Stability Phenomenon
Voltage stability is the ability of a power system to maintain steady acceptable voltages at all buses in the system under normal operating conditions and after being subjected to a disturbance. The main factor causing instability is the inability of the power system to meet the demand for reactive power [
20,
21,
22,
23,
24,
25].
A system is voltage unstable if, for at least one bus in the system, the bus voltage magnitude (V) decreases as the reactive power injection (Q) is increased at the same bus. In other words, a system is voltage stable if V-Q sensitivity is positive for every bus and voltage unstable if V-Q sensitivity is negative for at least one bus.
Voltage instability is essentially a local phenomenon; however, its consequences may have a widespread impact. Voltage collapse is more complex than simple voltage instability and is usually the result of a sequence of events accompanying voltage instability leading to a low-voltage profile in a significant part of the power system.
The physical cause of a voltage collapse occurring are primarily some phenomena taking place within the complex load. A reduction in load node voltage causes a reduction of the driving torque of asynchronous motors making up the load. The reduction of asynchronous motor torques is accompanied by an increase of slips and thereby a substantial increase in reactive power taken up from the network, and, as a consequence, a further reduction in load node voltage. As the voltage goes down, subsequent motors within the complex load halt. The consequences of this course of events are obvious to the consumers. For the electric power system, the consequences generally do not end up with a voltage collapse in only one load node. At the same time, the voltages of adjacent nodes will go down, and the phenomenon may spread to other loads.
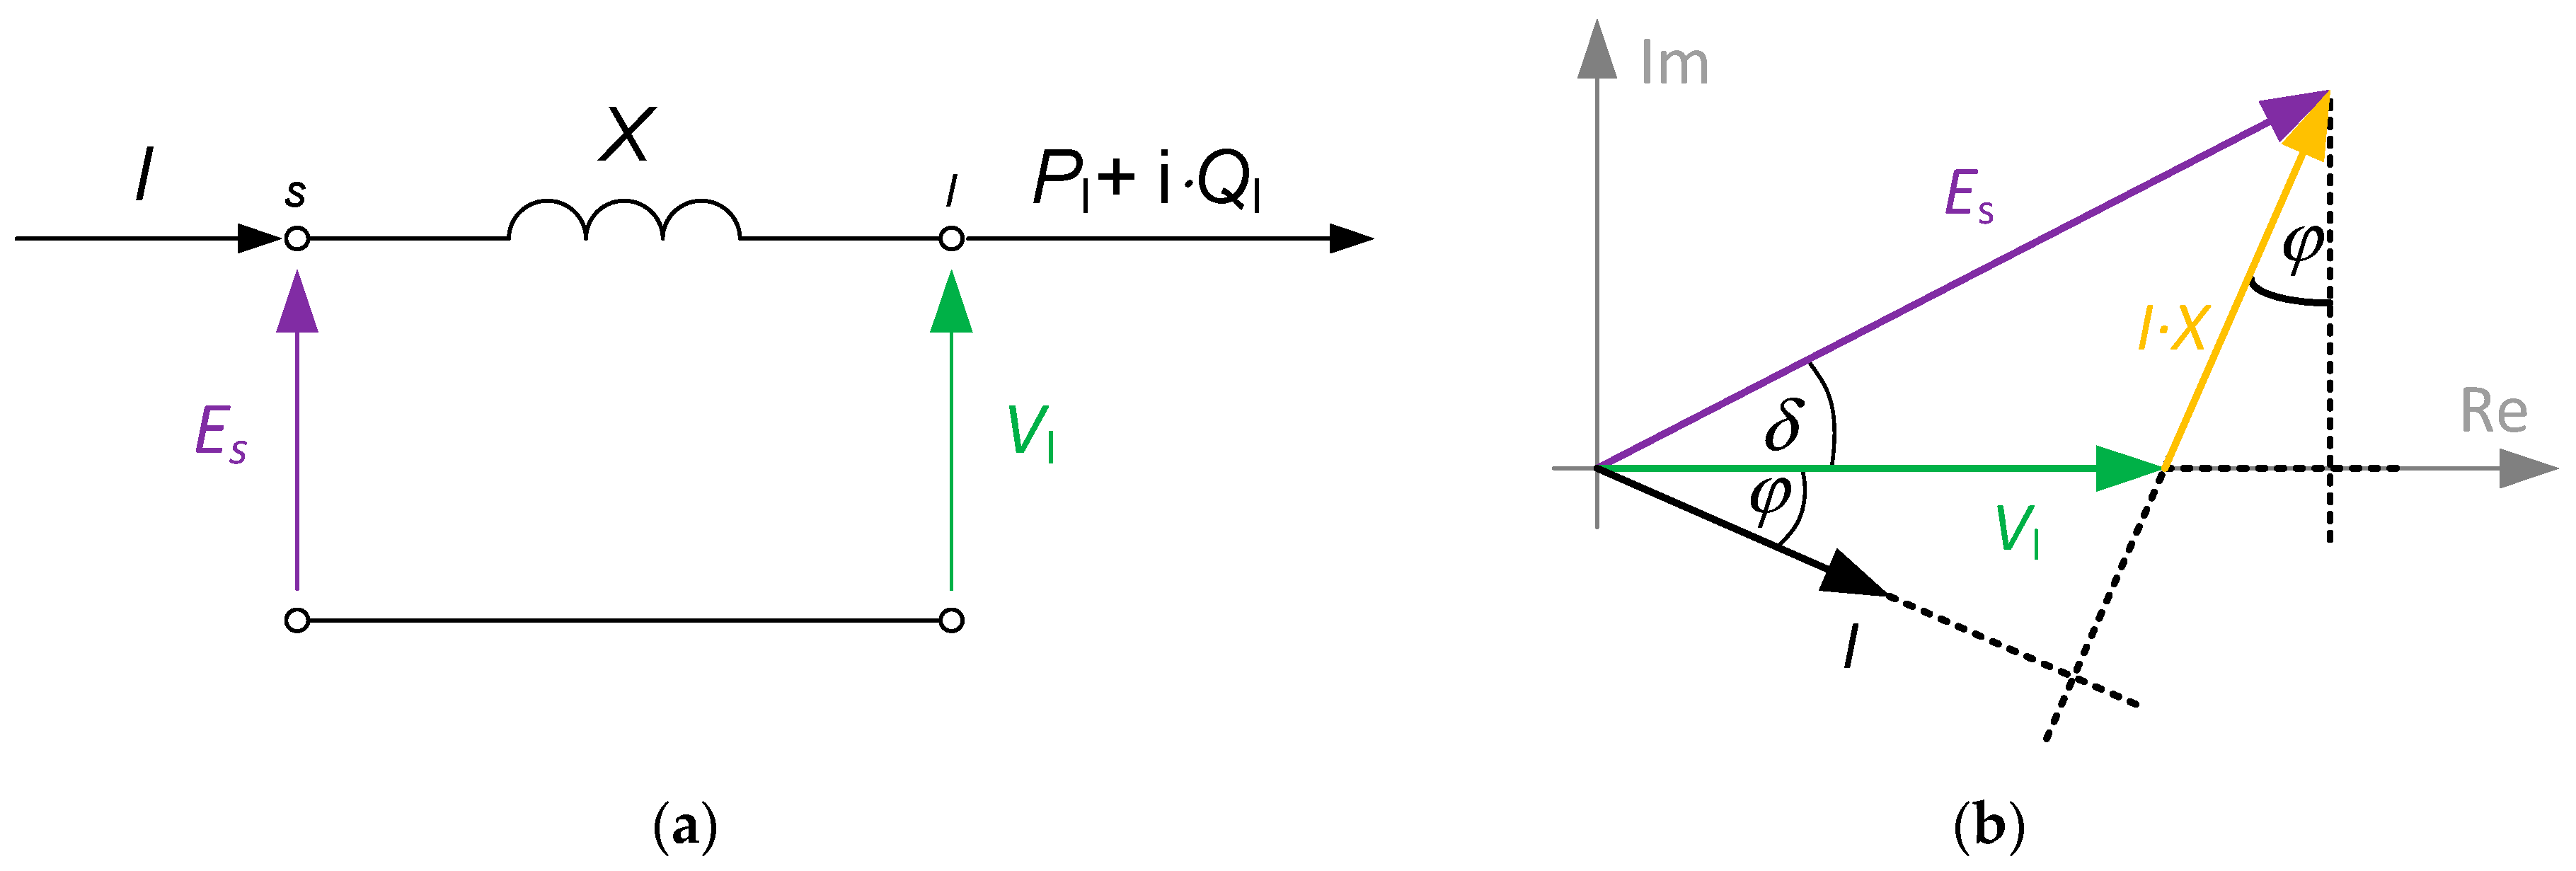
Voltage instability may occur in several different ways. In its simple form, it can be illustrated by considering the two-terminal network of
Figure 2 [
25]. It consists of a constant voltage source (
Es) supplying a load (
Pl + i
Ql) through the equivalent reactance of the power system (
X).
The properties of the power system as a source supplying a selected load node will be described using the reactive power generation characteristic, hereinafter in abbreviation called the generation characteristic and denoted by Qs(V). The generation characteristic defines, as a function of voltage, the reactive power given up by the power system to a given load node, with that node being loaded with the preset load active power, Pl(V).
On the right-hand side in
Figure 2b, the complex load with a given characteristic is cut off, and only the sole equivalent source is separated. For this source, formulae can be written, which define the active power and reactive power supplied to the load node:
These formulae can be transformed into the following form:
According to the definition of the generation characteristic, the source should be loaded with the active power, that is to substitute
Ps(
V) =
Pl(
V). With this assumption, the following will be obtained from Formula (2) after making simple transformations:
Formula (3) defines the generation characteristic, or the relationship of the reactive power Qs(V) supplied to the load node by the source, with the source being loaded with active power with the preset voltage characteristic Pl(V). The generation characteristic corresponding to Formula (3) is a curve similar to an inverted parabola. The smaller the equivalent reactance of the source X and the smaller active power loading the source Pl, the more the V2/X parabola shifts towards the center of the coordinating system.
The source and the load may only operate with each other at such a voltage, where the power supplied by the source is equal to the power taken up by the load
Qs(
V) =
Ql(
V). In
Figure 3, this corresponds to the points of intersection of both characteristics. Obviously, the point of the stable operation of the system may only be a locally stable point of equilibrium. The condition of equilibrium is as follows:
whereas Δ
Q =
Qs −
Ql is the excess of the source’s reactive power over the load demand.
In the case shown in
Figure 3a, the stability condition (4) is met at point “b” only. At that point, the system can operate in a stable manner. Electrically, the behavior of the system is as follows. A momentary increase in voltage by a small magnitude of Δ
V is accompanied by an excess of received power over the generated power, which entails a drop of voltage and the return to the point of equilibrium. Similarly, a momentary decrease in voltage is accompanied by an excess of generated power over the received power, which results in an increase in voltage and the return to the point of equilibrium. A special case of equilibrium point (the point “a”) is the situation illustrated in
Figure 3b. At point “a”, the stability condition (3) is not satisfied. At this point, the system could not operate in a stable manner. Any change in voltage causes an excess of receiver power over the generated power, which results in a further decrease in voltage. The system departs from the point of equilibrium with continuously decreasing voltage. The loss of the system’s stability, manifesting itself in a voltage breakdown due to a small disturbance, is called the voltage collapse.
3. The Voltage Dependency of Loads
The effect of operation and some regulation properties of any electric device taking up active and/or reactive power can be described using, e.g., static characteristics. Typical characteristics describe the variability of active
PL and reactive
QL power take-up as a function of variations in voltage and frequency. Simulation studies concerning the analyses of the operation of electric power systems rarely consider single loads. More often, aggregated load models are used, in which the load power is the sum of the powers of electric loads of different characteristics [
26,
27,
28,
29,
30,
31,
32,
33,
34]. This sum includes the proportionality factors
kP and
kQ, defined as the percentage fraction of individual groups of loads of the total load power, that are determined at the point of common connection (PCC) (e.g., a specific outlet field in a HV/MV substation), which, assuming a constant frequency level, can be described in a general form using the following relationships:
where:
- -
PLn, QLn—total value of, respectively, the active and reactive power of a load group, corresponding to the rated voltage magnitude;
- -
kP, kQ—factors defining the percentage fractions of individual load groups of the total power;
- -
αP, αQ—exponents defining the voltage dependence of a group of loads;
- -
i, j—parameters defining the number of different voltage dependency groups.
From the point of view of the regulation of voltage in HV/MV substation, power variations are the most important, as they determine the greatest voltage variability. With small voltage deviations from the rated voltage of ±10%, it can be assumed that, in the vast majority of instances, the coefficient of voltage sensitivity of the reactive power of loads, defined as d
Q/d
V, has a positive value. This is an advantageous situation since at that case one has the so-called self-regulation of the power system—where a decrease in voltage results in a reduction in reactive power take-up by the loads. It should be noted, however, that the value of the d
Q/d
V coefficient is variable in time. This is caused by the variation of network voltages, the variation of the fractions of individual groups of loads on the total node power (the variation of the coefficients
kP and
kQ), etc. The variation of the d
Q/d
V coefficient applies not only to the absolute value but also to the sign. In a situation where the d
Q/d
V coefficient is less than 0, lowering the voltage at the load’s terminals will result in an increase in reactive power uptake. Such behavior of loads is undesirable in a situation where a voltage drop is due to a deficit of reactive power in the system, as it will contribute to a deepening of that deficit. A negative value of the d
Q/d
V coefficient may occur, e.g., in networks with large participation on asynchronous motors [
26]. Examples of static characteristics
V-Q for selected cases are shown in
Figure 4 and
Figure 5.
It should be noted that the value of the d
Q/d
V coefficient depends not only on the voltage level but also on the machine loading. The examples shown (
Figure 4 and
Figure 5) include the cases of loading the machine with a constant moment,
T = const.; a constant power,
P = const.; and a moment dependent on the square of velocity,
T = f(
ω2).
Even though the results of the investigation [
35] carried out by the author in the years 2007–2008 show that instances where the d
Q/d
V is negative or close to 0 are not frequent, this problem should be expected to exacerbate in the nearest future. One of the main causes may be the increased number of refrigerating equipment units—air conditioners. The International Energy Agency (IEA) has published a report entitled The Future of Cooling [
36] which forecasts that the growing use of air conditioners in households and offices worldwide will become, over the nearest three decades, one of the main factors of the global demand for electric energy. This problem is addressed also in other publications [
29,
37]. As has been shown by the investigation results reported in [
29,
33,
38,
39,
40], the coefficient of reactive power voltage susceptibility, d
Q/d
V, of the above-mentioned equipment is negative at lower voltages, as shown in
Figure 5. It is also worth noting that the demand for reactive power increases with increasing ambient temperature.
The characteristic of voltage sensitivity d
Q/d
V, as seen from the terminals of the distribution network supply transformer, is a resulting characteristic. In a situation, where a large number of loads with an “unfavourable” characteristic of voltage susceptibility are present in the network under analysis (
Figure 4 and
Figure 5), this may pose a threat to the voltage stability in a specific area. The problems may deepen in a situation, where capacitor banks are installed in a large number of network nodes, or the network has a large number of cable lines.
4. The Influence of Transformer Tap Position Changes on the V-Q Characteristics
The characteristics shown in
Figure 4 and
Figure 5 apply to the situation where the voltage ratio of a transformer is constant. At a constant voltage ratio, the reduction of voltage on the primary side
V1 results in a corresponding reduction of voltage on the secondary side
V2. In the situation where the transformer voltage controller would maintain a constant voltage value on the secondary side, the reactive power
Q2 taken up by the loads would not change (
Figure 6).
The discrete nature of voltage regulation by changing the voltage ratio, associated with the stepwise change of the number of coils and the dead zone, also causes a discrete change in the reactive power of the loads.
The process of voltage regulation by changing the transformer voltage ratio is slow. In real power systems, the aim is to reduce the number of tap switchovers during 24 h. It is achieved, e.g., by increasing the settings of switchover delay times or by increasing the dead zone. This is an intentional action, dictated, e.g., by economical and operational reasons. The characteristic presented in
Figure 6 proves itself excellently in the analysis of steady states or in the case of slow voltage changes—slower than the action of transformer control systems.
In the case of large overloads, the rate of voltage changes might be greater than the transformer voltage ratio change rate. In such instances, load characteristics should be taken for consideration, which do not allow for the transformer regulation action.
Depending on the phenomena under consideration, the voltage ratio value should remain either unchanged or equal to the extreme voltage ratio values corresponding to the outermost position of the tap changer.
5. The Effect of Transformer Voltage Ratio Regulation on the Risk of a Voltage Collapse Occurring
The mechanism of a voltage collapse occurrence is very complex and comprises many components of the electric power system. Regardless of the causes of its occurrence, the loss of voltage stability is closely related to a disturbance of the reactive power balance in the system. It can either be a local phenomenon or cover a larger part of the electric power system. The causes of the overloading of an electric power system with reactive power and the methods of analysis of the voltage stability of electric power subsystems were addressed in numerous publications, including [
20,
21,
41,
42,
43,
44,
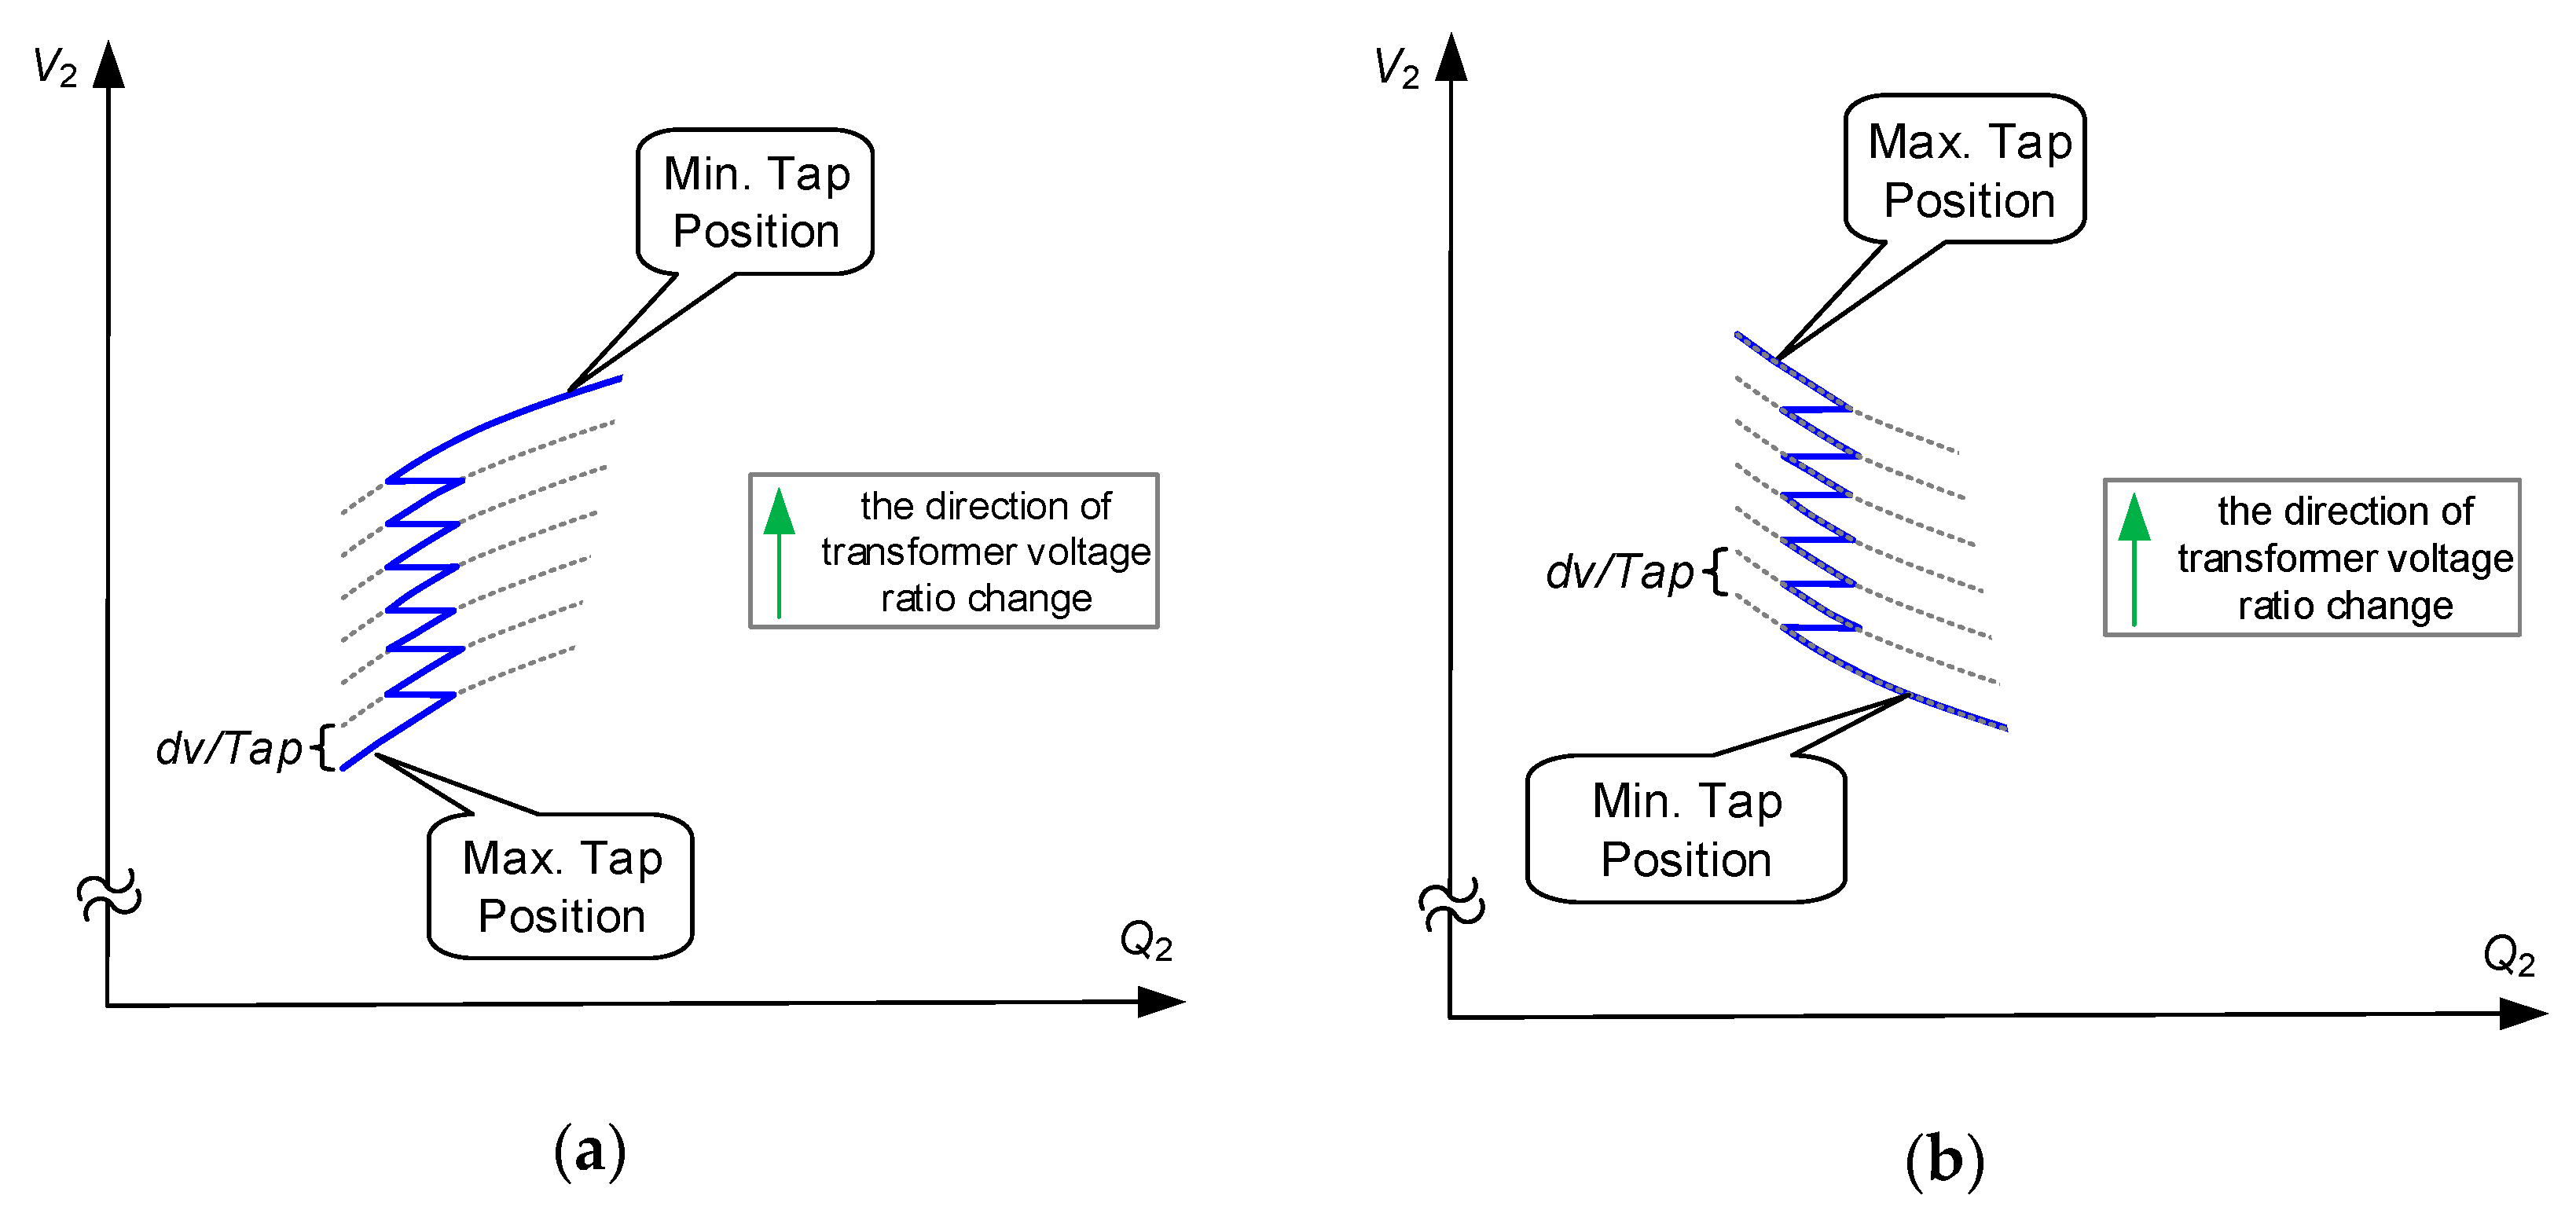
45]. This section discusses phenomena that pose a threat to voltage stability and result from transformer voltage ratio regulation. The following two extreme situations are taken for analysis: the first one, in
Figure 7a, in which the coefficient of voltage susceptibility of the power of loads is positive (d
Q/d
V > 0); and the second one, in
Figure 7b, where the coefficient is negative (d
Q/d
V < 0). It has also been assumed that the voltage change rate is greater than the speed of action of transformer control systems.
The effect of voltage ratio changes with a reactive power deficit in a situation, where (d
Q/d
V > 0), is illustrated in
Figure 7a. As a result of a lowering of voltage in the MV network, the transformer controller changes the voltage ratio magnitude to maintain the preset voltage value on the transformer secondary side. The change of the voltage ratio entails a change in the reactive power uptake characteristic. The fixed working point OP
1 moves toward the increased reactive power uptake up to the point OP
2, in which, in an extremely unfavorable case, limiters in the generator controller might be activated. The activation of any current limiter causes a reduction of the magnitude of excitation voltage and, as a consequence, of the generated reactive power, contributing thereby to an aggravation of the reactive power deficit in the electric power system. In the case under discussion, from the point of view of voltage stability, it would be the most favorable to halt the voltage regulation (a constant transformer voltage ratio).
The constant transformer voltage ratio will, however, not always bring about desirable effects. As has been mentioned in the introduction, in distribution networks with a large number of asynchronous drives, including air conditioning devices, and a considerable power of capacitors, the d
Q/d
V coefficient may take on negative values. This means that—with decreasing voltage—the input power increases. In that case, the natural characteristic of loads is distinctly less advantageous than the characteristic determined by the action of the transformer voltage controller that maintains, in a certain range, a constant voltage and the resulting constant reactive power uptake
Figure 7b.
When the coefficient dQ/dV < 0 of the characteristics of reactive power, operating transformer voltage controller leads to achieving a stable, new working point OP2. Blocking the controller operation could, in this case, result in a permanent deficit in reactive power (the working point OP3), causing aperiodic instability—a voltage collapse.
To sum up, if at a given voltage, the voltage susceptibility coefficient dQ/dV determined in the HV/MV substation is negative, while the voltage is lowering, stopping the regulation by changing the power transformer voltage ratio is unfavourable. A stop in transformer regulation may occur, e.g., in a situation when the transformer controller’s under-voltage interlock is activated. A similar effect will be observed when the voltage change rate is greater than the rate of voltage correction as a result of transformer voltage ratio regulation (e.g., a large time delay value).
6. New Algorithm of the Transformer Controller Reducing the Risk of Voltage Collapse
6.1. Idea
This section will present the algorithm designed for counteracting the aggravation of the reactive power deficit in a voltage stability risk situation. The algorithm can be described in the following manner: if the voltage level in a HV network is lower than the accepted threshold value, VHVmin, and its decrease rate exceeds the preset threshold value of , then:
If the coefficient dQ/dV > 0, then the transformer controller will operate following the constant lower voltage value criterion (VMVref = const.), with the simultaneous correction of the preset value to the lowest permissible value of VMVref = VMVmin. Thus, the controller will reduce the MV side voltage to VMVmin, and after exhausting the regulation capacities (the outermost tap) or reaching the preset value, it will maintain the constant voltage ratio.
If dQ/dV ≅ 0, then the transformer controller will operate following the constant lower voltage value criterion with the preset voltage value unchanged.
If the dQ/dV < 0, then the transformer controller will operate following the constant lower voltage value criterion at the unchanged preset voltage value, with the simultaneous correction of the preset value to the highest permissible value of VMVref = VMVmax.
An exemplary diagram of the operation algorithm of an adaptive HV/MV transformer regulator is shown in
Figure 8 and
Figure 9.
An important parameter that activates the operation of the proposed algorithm is the maximum rate of reduction of the HV side voltage
. Assuming that the voltage ration value is constant, the voltage decrease rate at either side of the transformer will be identical. If the voltage decrease rate on the primary side is lower than the secondary side voltage change rate caused by the voltage ratio change, then the secondary side voltage will be maintained at a constant level. In that case, the secondary side voltage drop will be compensated for by the change of the voltage ratio. With a view to the above, the maximum voltage decrease rate can be determined from the relationship:
while:
where:
- -
dv%—tapping step;
- -
tΣ—total tap change time;
- -
top—switch opening time (for contemporary switches it is of the order of 2–10 s);
- -
tdb—dead time associated with the decay of transient processes caused by the switchover (e.g., for TCS—Transformer Control System) this time is of the order of 1 s for the case, where there is a signal confirming the current tap position, or 3 s in the absence of such confirmation).
Relationship (6) describes the maximum theoretical voltage drop value. Considering the measurement accuracy, both the statistical and dynamic errors, and the fact that the value of dv% is a certain average value, the criterion value of should be adopted as considerably smaller, as confirmed by the simulation study results reported further in this section.
In cases when dQ/dV > 0, a change (reduction) of the preset voltage value occurs in the proposed algorithm. The purpose of this is to reduce the uptake of reactive power. The preset voltage value should be as small as possible and, at the same time, should satisfy the following two conditions:
Maintaining the preset voltage value should enable the permissible minimum voltages within the power supplied network to be met;
It should not be lower than the limiting Vext. voltage value, at which the coefficient dQ/dV ≅ 0.
Bearing the above in mind, and also to estimate the risk of occurring a dramatic reactive power uptake in situations, where the coefficient d
Q/d
V < 0, it would be advisable to determine the voltage susceptibility characteristic,
V = f(
Q), for each HV/MV substation. The above-mentioned characteristic can be determined through: simulation studies, a network experiment, or, preferably, by the analysis of the results of both investigation types. Regardless of the adopted method, a revision of the current state of the network should be made, including the parameters of network elements, voltage effects in vulnerable network nodes, caused by a change in transformer voltage ration, or, last but not least, the applied types and settings of the safeguards of induction machines in individual network nodes. The accuracy of the model of particular network elements, including safeguards, will determine the reliability of results obtained by means of simulation studies. In the case of a network experiment, a good knowledge of the network under examination will enable the experiment to be safely carried out and reliable results to be obtained. This effect will only be obtained, when a sufficiently low voltage level is successfully obtained, and no emergency trips of the drives occur due to carrying out the network experiment. As indicated by the characteristics shown in
Figure 4 and
Figure 5, an extremum of the function occurs at voltages lower than the permissible long-lasting voltage; hence, it is essential that the network experiment is carried out at a possibly low voltage. A low voltage level in HV/MV substations increases the risk of emergency trips of asynchronous drives inside the network, caused by an excessive current increase or too low voltage. In practice, two types of safeguards are used for protecting asynchronous drives connected to an MV network. The primary type includes overcurrent protections with a time-dependent characteristic. A secondary, less often used safeguard are undervoltage protections—with typical settings being (0.7–0.8)
Vn.
6.2. Methodology for dQ/dV Coefficient Determination
In order to determine the V = f(Q) characteristic and the value of Vext., a change of supply voltage should be induced. The simplest and most effective method of changing voltage in an HV/MV substation is by changing the voltage ratio of the power transformer.
The conditions for conducting the experiment can be defined as follows:
The measurements are to be made during the normal operation of the medium voltage network;
The measurements should be made using measuring instruments (network parameter recorders) of the appropriate class;
The measurements should be conducted in the periods of characteristic loadings, such as a peak or off-peak period, winter, summer, etc.;
The measurements should be conducted in the period of a limited load variation;
Voltage changes are to be made within limits permissible in a given network node;
The test should be started at a maximally high voltage to obtain a possibly large number of measurement samples.
The proposed course of the test:
Preparation of the measuring apparatus (connection, parametrization, turning on the recording);
Switching over the transformer voltage controller to the manual operation mode;
Change of the tap towards the reduction of voltage;
Successive tap changes should proceed as quickly as possible to minimize the influence of the typical power variation of the loads;
The switchovers should be done in one direction.
In a situation where a bank of capacitors is installed in the HV/MV substation. The tests should be carried out with the capacitors bank turned on and off, respectively. It should be borne in mind that in the conditions of normal operation, in the situation of lowered voltage, the capacitor bank shall be turned on. Its voltage susceptibility characteristic (negative value of the dQ/dV coefficient) may noticeably change the Qsubst = f(Vsubst) curve. If turning the capacitor bank on–off during the experiment could cause the maximum voltage to be exceeded, the bank should stay turned off.
To emulate the course of the test to determine the
Qsubst = f(
Vsubst) characteristic, simulation studies were carried out using a model of a 91-node real MV network. The model included 58 MV nodes (interconnected with 66 MV cable lines) and 33 MV/LV substations. A simplified diagram of the network is shown in
Figure 9.
Two types of load models are used in each node. The constant admittance model and the dynamic asynchronous motor model were both taken from the library of the PowerFactory program. The motor power was selected to obtain the assumed percentage of asynchronous machines while retaining the reference power value in a node. As the effect of the voltage level at which measurements are made is significant, two variants of the initial supply voltage value were considered: the first, where
VMV(t = 0) = 1 pu, and the second one, where
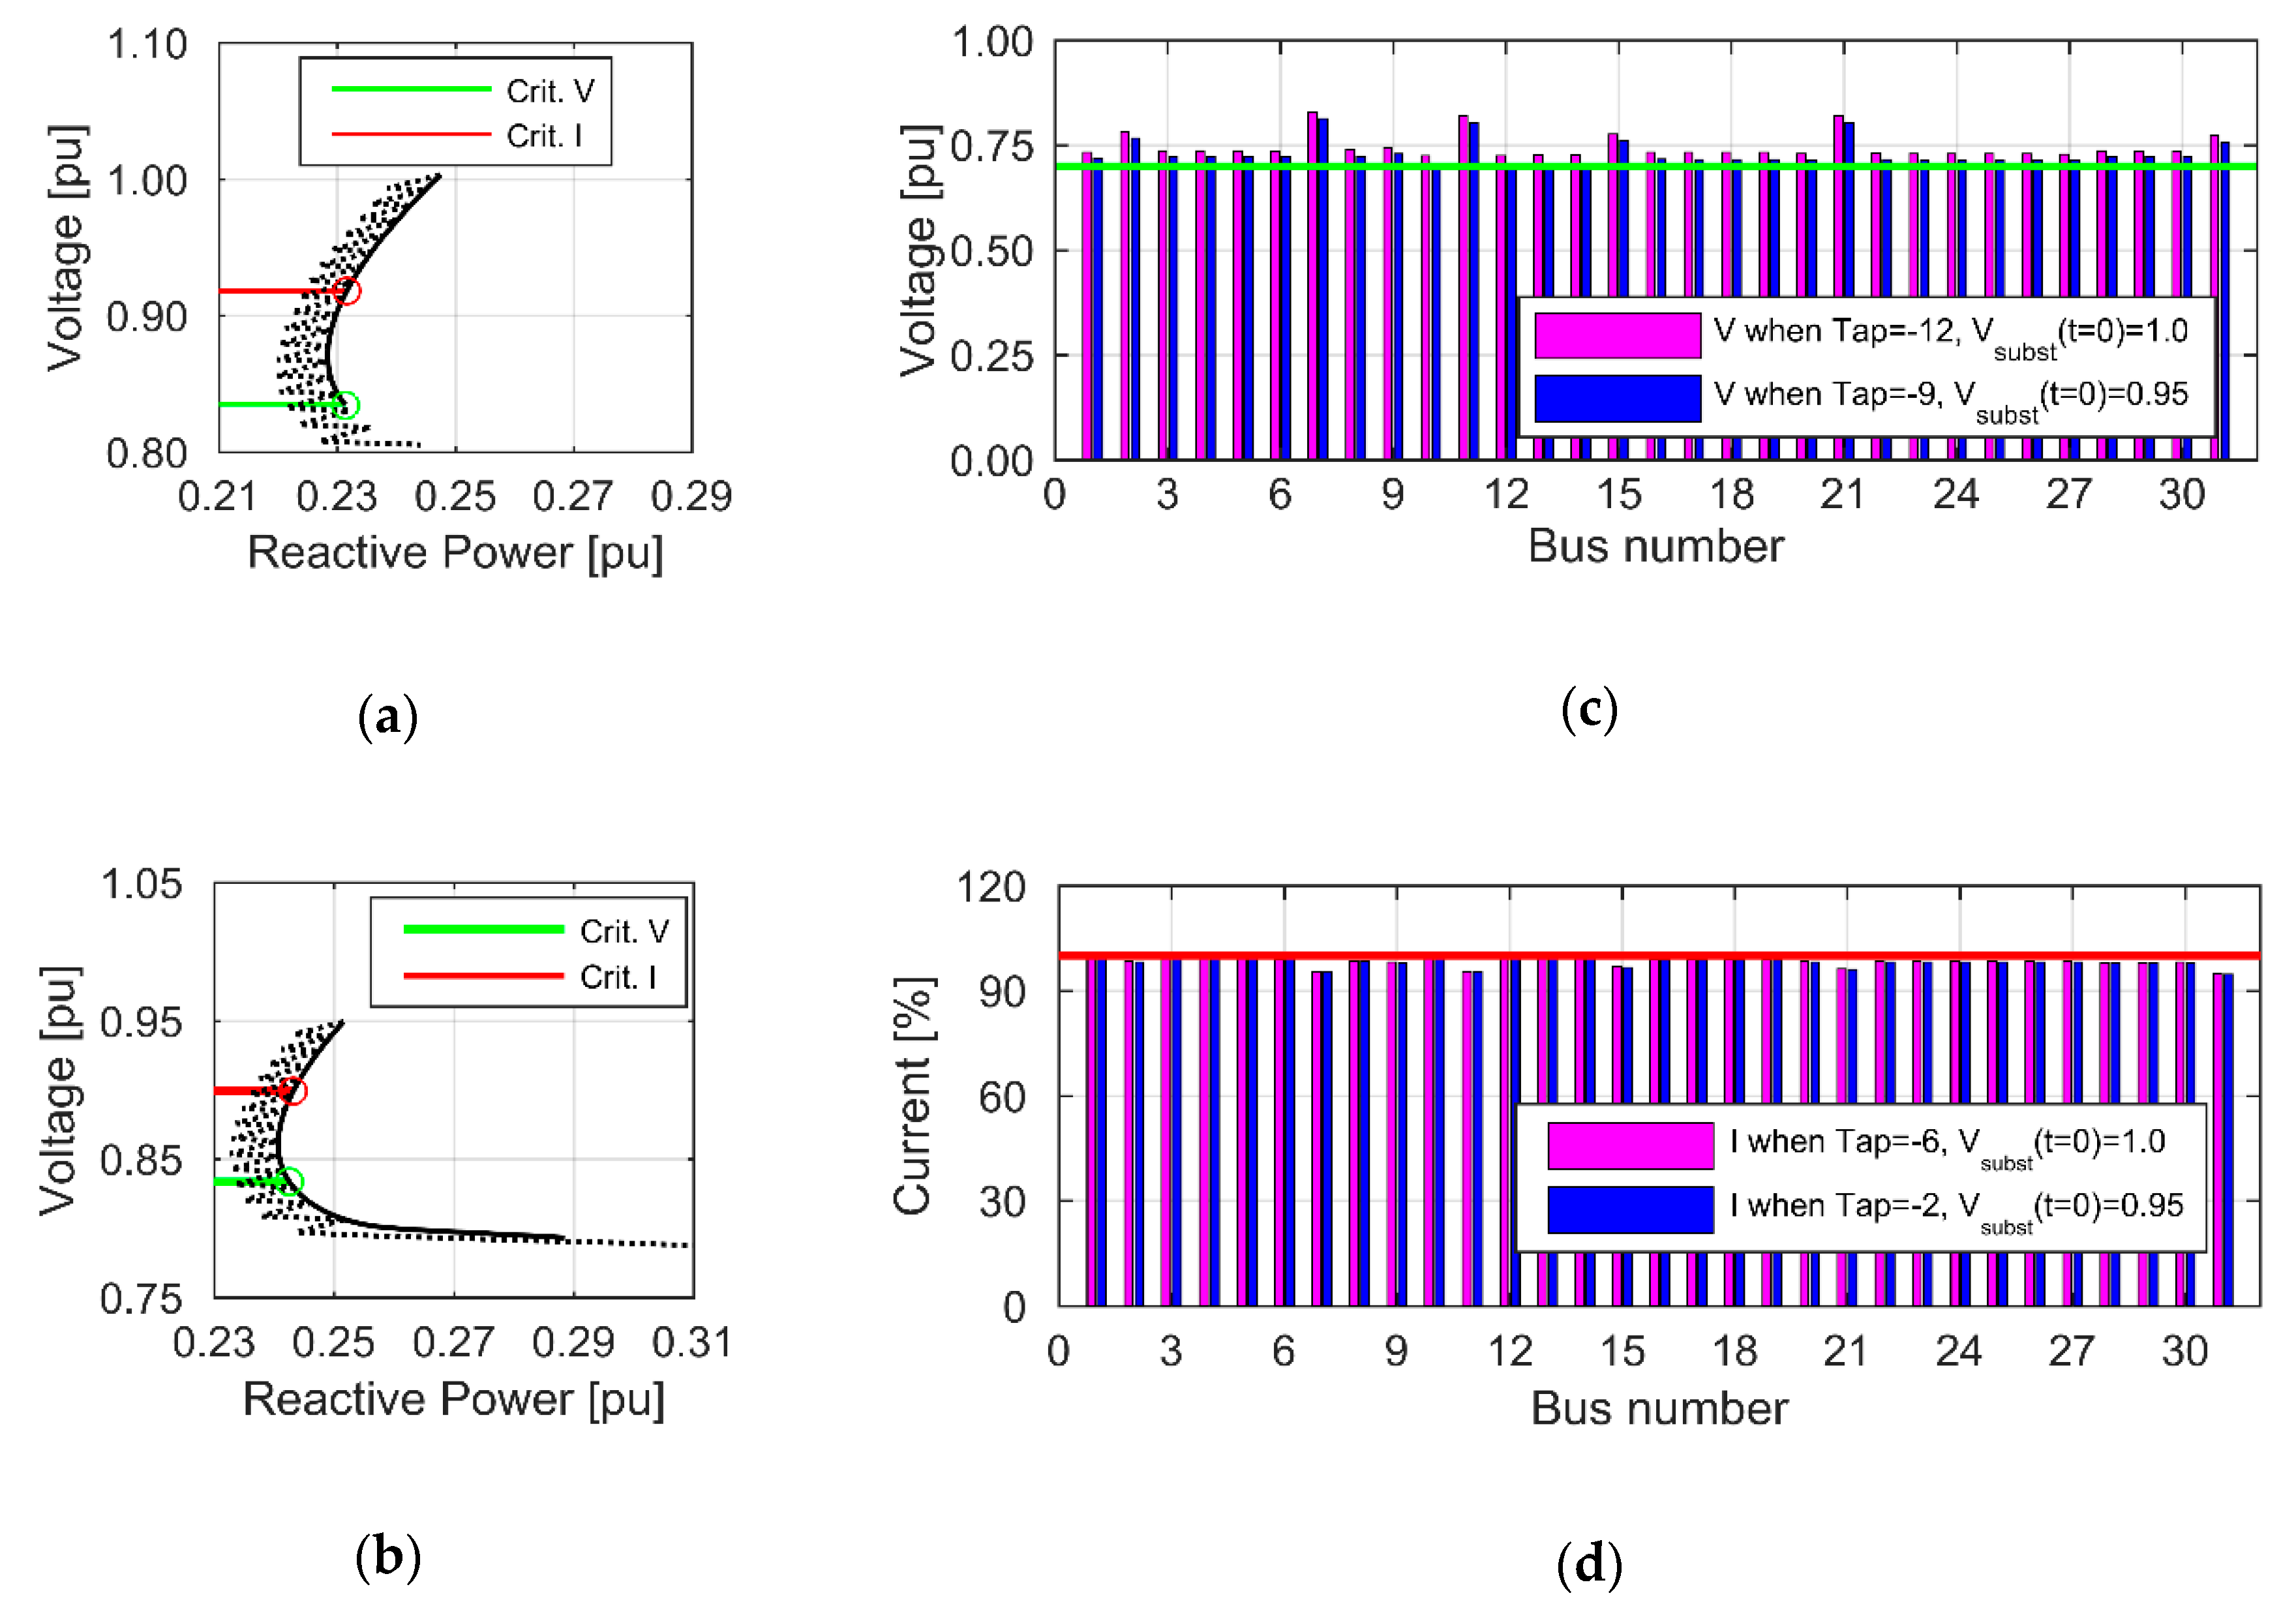
VMV(t = 0) = 0.95 pu. The taps were changed until a voltage collapse was triggered. The obtained characteristics for a network with a 15-percent proportion of induction machines are shown in
Figure 10.
These figures show the obtained voltage characteristics, where the bold black solid line represents the trajectory of voltage variation for the linear variation of MV voltage. Two characteristic points are highlighted in
Figure 10a,b. They indicate the levels of voltages, at which the network experiment should be aborted. A further change in the voltage ratio of the power transformer would threaten with an emergency trip of the drives due to the exceeding of the rated current value of the machine (denoted as “Crit. I”, assuming
Imax = 1 pu), or because of too low voltage (denoted as “Crit. V”, assuming
V ≤ 0.85
Vn).
Figure 10c shows voltage levels at individual load nodes, including the maximum number of the tap, which would not cause the activation of the undervoltage protection. Similarly,
Figure 10d shows the drive load level, including the maximum number of the tap, which would not cause the activation of overcurrent protection.
Based on the obtained graphs of
V and
Q, points for plotting the static characteristics were determined (
Figure 11).
The numerical values correspond to successive tap numbers, while the range of data (defined as the tap number) used for determining a specific curve is given in parentheses. The characteristics were obtained by approximation with a third-order polynomial (
i = 3), which limits the number of required measurement points while maintaining the acceptable accuracy of determining the value of
Vext. If the number of measurement points “
j” is equal to the degree of the polynomial, “
j =
i”, then one has an approximated function defined at “
i + 1” points and an approximating polynomial of degree “
i” is searched for. In this case, one deals with an interpolation, in which the mean-square error equals 0. It is obvious that measurement data obtained from tests on a real object can be burdened with large errors; therefore, in order to reduce them, a possibly large number of measurement points should be used. If a limited number of measurement points is available, it is preferable to adopt points of the lowest voltage. Having the above in mind and also comparing the characteristics shown in
Figure 11a,b, a conclusion can be drawn that the test under discussion is best carried out in the conditions of the lowest possible voltage.
6.3. Simulations Studies to Verify the Effectiveness of the Proposed Algorithm
To verify the effectiveness of action of the proposed algorithm (
Figure 8), a series of simulation studies were carried out using the network model described above (
Figure 9). A disturbance to be modelled was the linear variation of electric power system voltage. Sample results are illustrated in
Figure 12 and
Figure 13.
At the first step, the parametrization of the model had to be made. The following settings were adopted: tap changer switchover opening time, top = 7 s; time lag associated with the decay of transient processes and the establishment of measurements values, tdb = 1 s; independent lag delay value, τ = 180 s (which corresponds to the actual switch-off time at a deviation of ΔV = 0.2%∙Vn). Three variants of the transformer controller algorithm were considered, namely:
“TCS”, meaning that the transformer controller algorithm is identical with the algorithm of the commercial controller, manufactured by a renowned manufacturer of power systems automation;
“New (
Vref = var)”, or the proposed algorithm (
Figure 8);
“New(ϑfreeze)”, or the reference variant, which uses an algorithm compatible with the proposed algorithm, except that the voltage ration process was withheld until the condition V2(t) ≤ Vext. had been met. The adopted assumption results, in the first phase of the process, in a natural reduction of reactive load power following from the characteristic V = f(Q).
The driving force was a linear variation in supply voltage on the HV side. The rate and depth of the voltage drop were selected to, on the one hand, bring about a situation that would cause the risk of occurring a voltage collapse, and, on the other hand, to enable the analysis of voltage ratio control effects. In the first case, the HV side voltage drop rate was approx. 2.5 kV/min, which corresponds to the adopted limiting value of
—it is about three times smaller than the one determined from Relationship (6). In the second case, the HV side voltage drop rate was at a level of 10 kV/min, corresponding to the value that occurred during the system failure describe in the study [
46].
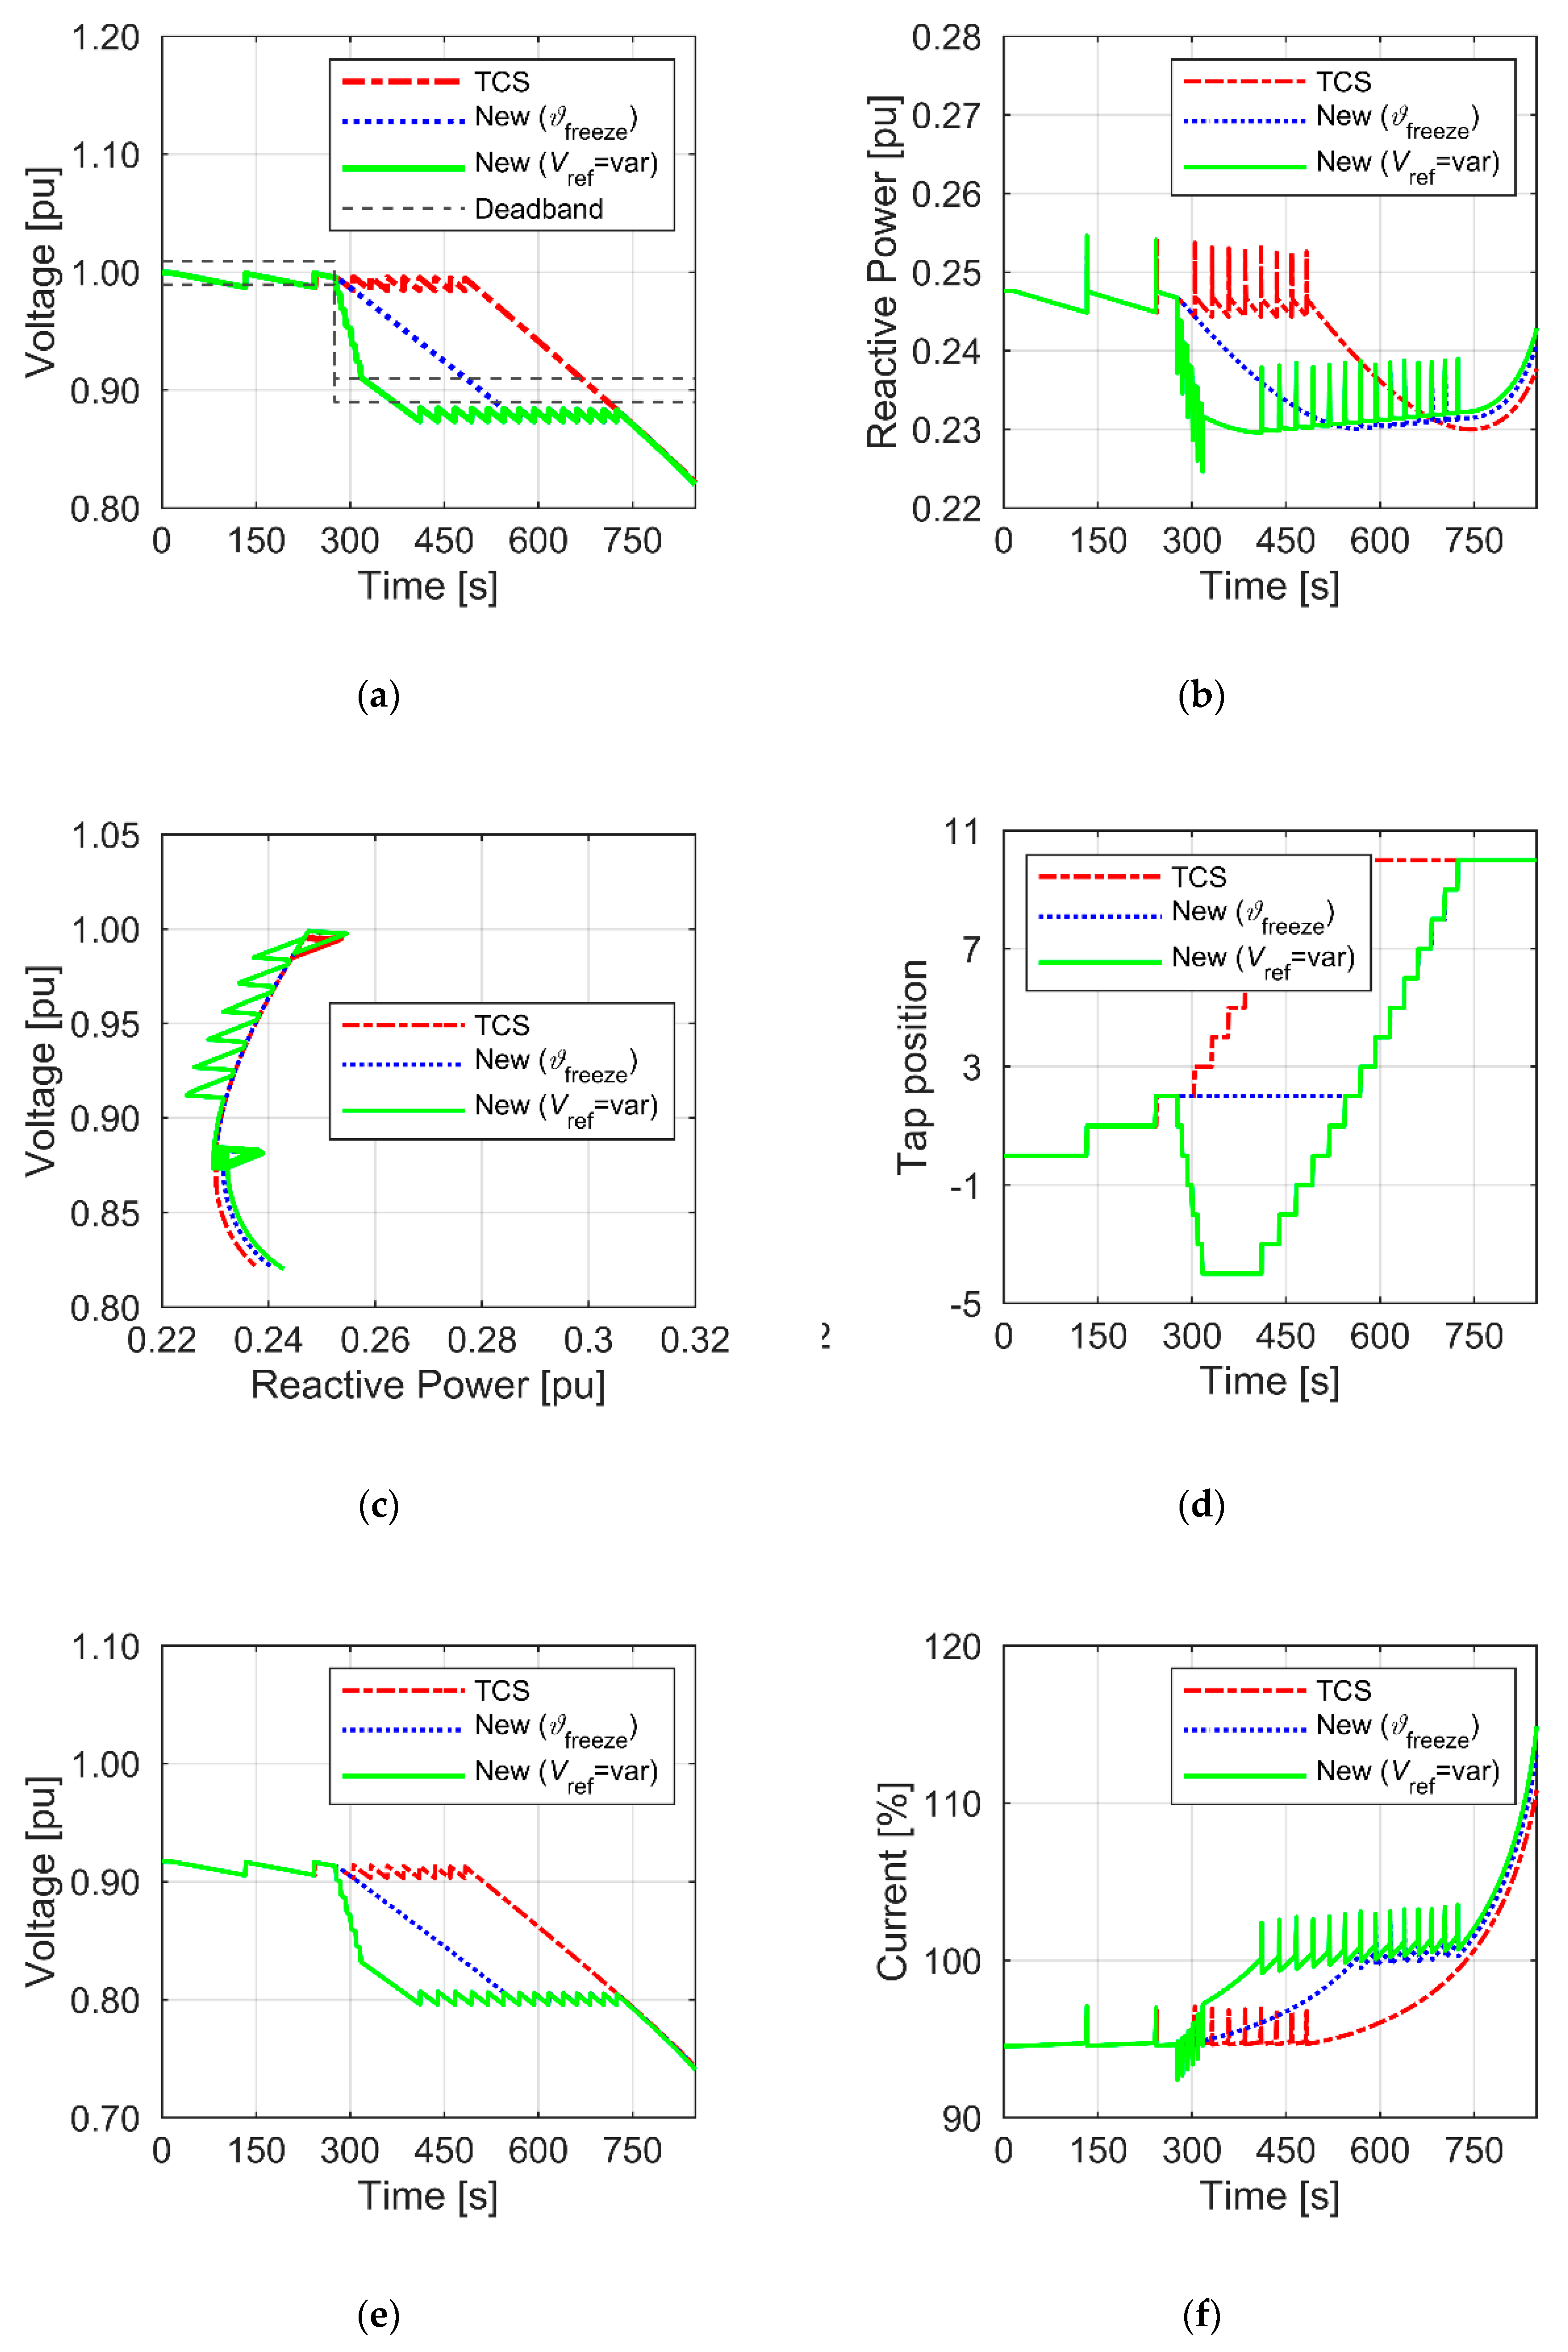
The analysis of the simulation study results (
Figure 12 and
Figure 13) shows that the proposed authors’ solution brings about expected positive results. It should also be noted that the correction (reduction) of the preset voltage value, when the coefficient d
Q/d
V > 0, is an advantageous solution. Because of this operation, a reduction in reactive power demand by the HV/MV substations occurs, which is faster than resulting from the voltage decrease rate, and the time of operation with lower power increases (
Figure 12b and
Figure 13b). The time increase is associated with the increase in the transformer control range due to the opposite directions of tap change in individual operation phases. In the first phase, the reduction of the preset voltage value is followed by a tap change towards negative tap numbers; in the second phase, when d
Q/d
V < 0, the taps are switched over in the direction opposite to the initial direction (
Figure 12d and
Figure 13d). It should be noted that, although the power changes in the network under examination are not big, assuming that the proposed solution would be implemented in the majority of transformer controllers in HV/MV substations, the total value of reduced power can be significant from the point of view of stable network operation. An undesirable effect resulting from the reduction of the HV/MV substation’s preset voltage value is a voltage drop in load nodes (
Figure 12e and
Figure 13e—the voltage variations are determined in the node of the lowest voltage).
In the network under analysis, the attained values do not exceed the threshold values typical of undervoltage protection settings. A consequence of voltage reduction in load nodes is an increase in the induction machines’ current. However, the attained current magnitudes will not cause a fast shutdown of the equipment. The applied overcurrent protections make use of time-dependent characteristics with a large trip delay set value, in the order of several minutes. In the case under analysis, the maximum overload value did not exceed 2% for the case illustrated in
Figure 12f and 10%, as shown in
Figure 13f.
With the correct settings of the protection devices, the possible risk of disconnection of the devices connected to the MV grid is small. Please note that the issues discussed in this paper concern the regulation of power transformers supplying the distribution network in conditions of voltage collapse. That’s why the incidental disconnection of single devices, in a situation of saving the network from a catastrophic failure, ceases to be relevant.
6.4. Tests on the Physical Model
To make an additional verification of the operational effectiveness and to explore the possibility of implementing the proposed solution in a real facility, tests were carried out in the laboratory using a physical model to simulate the operation of the HV/MV substation. A simplified equivalent circuit diagram is shown in
Figure 14. The object of control was the transformer of a functional unit, LOAD1. The disturbance was a change in the voltage
V1 (Bus 4) caused by a linear variation in the reactive power uptake of receivers LOAD2 and LOAD3. The test system was power supplied from a 15 kV network of the Gdańsk University of Technology (GUT) via a power transformer of
SnT = 630 kVA.
Three algorithm variants, identical to the ones used in the simulation studies, were implemented in the transformer controller. Three cases of average initial voltage decrease rate were emulated, namely:
Variant A—much smaller than the limiting value determined from Relationship (6) for the data Δv = 0.2%, tΣ = 8 s; however, causing the activation of the author’s algorithm;
Variant B—close (±5%) to the limiting value determined from Relationship (6);
Variant C—greater by approx. 10% than the limiting value determined from Relationship (6);
Variant D—approx. 30 times greater than the limiting value determined for the previous variants, Δv = 0.2%, tΣ = 300 ms.
In view of the fact that the transformed tested was equipped with a power electronic tap changer, tests were carried out to demonstrate its regulation capabilities, as well as to show the versatility of the proposed solution. In variant D, an assumption was made that switchovers were done without delay in all of the algorithms examined. The preliminary tests showed that a stable tap changing process was attained at a rate of switching between adjacent taps in the range of (300–400) ms.
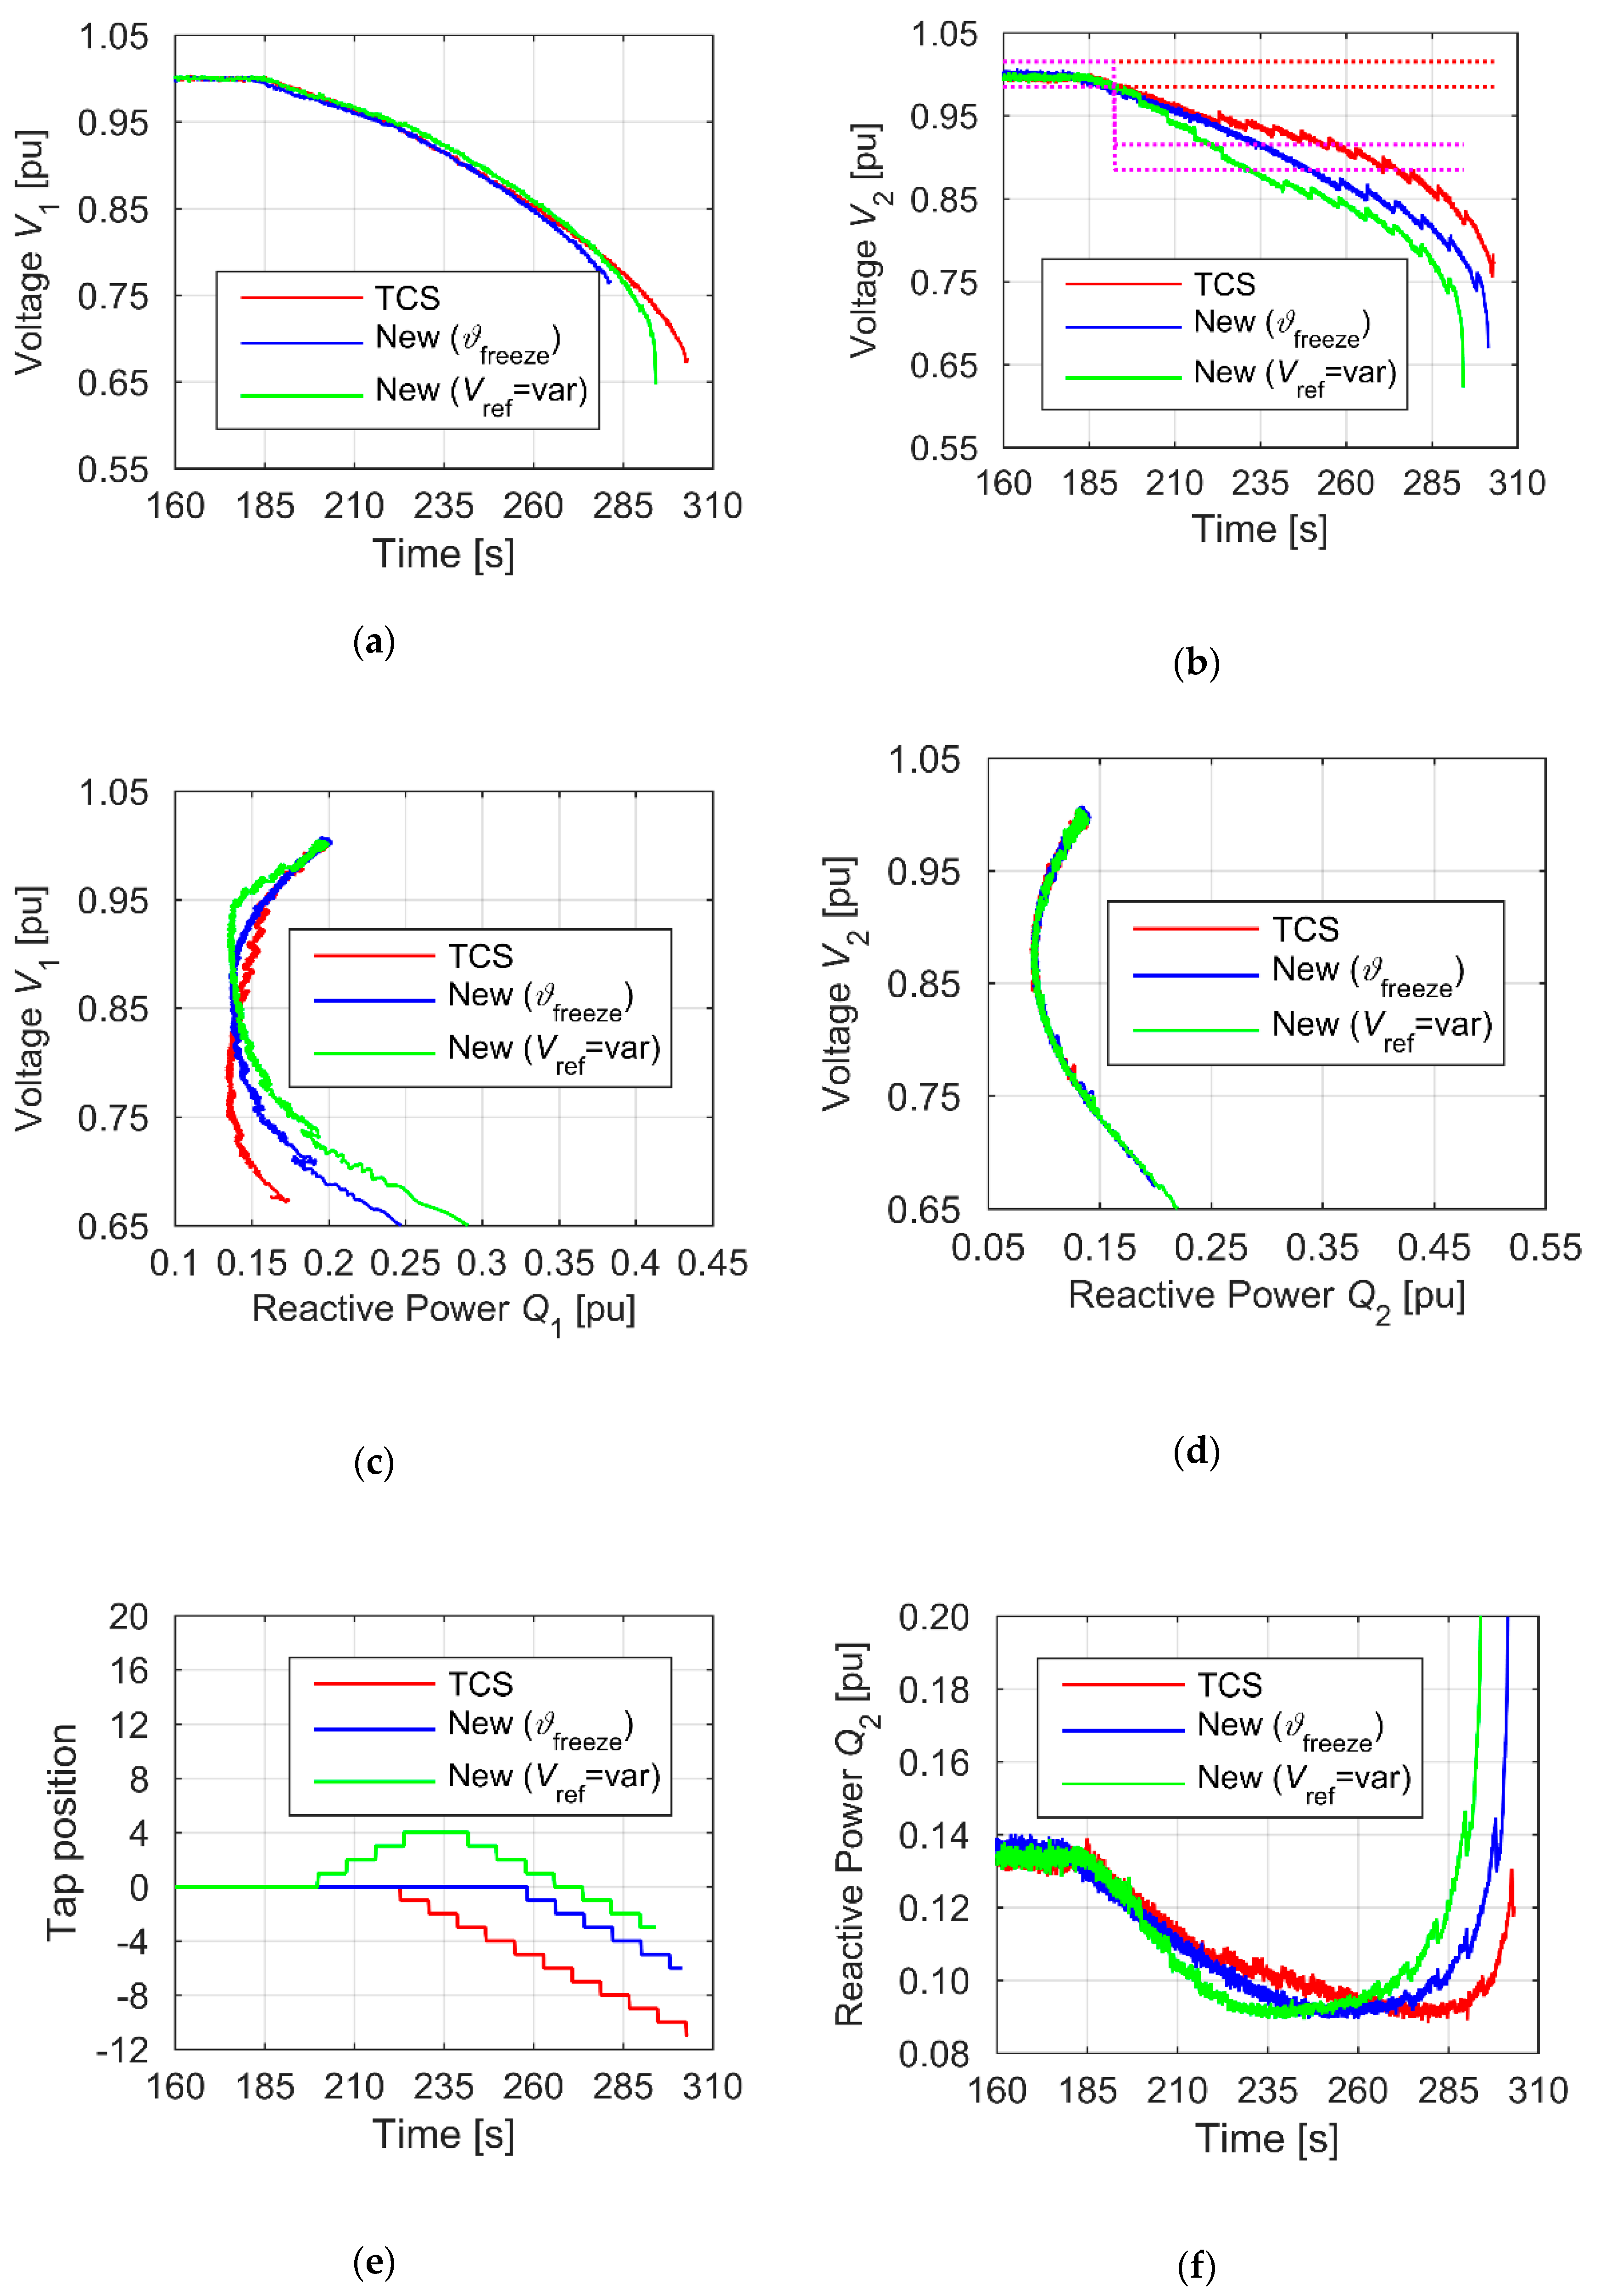
The positive effect of the application of the proposed solution is best visible in the situation, where the voltage decrease rate is significantly smaller than the rate of the voltage ratio regulation process (
Figure 15). With a typical HV/MV substation transformer voltage regulation algorithm (here called TCS—Transformer Control System), a stable preset value on the secondary transformer side is maintained (
Figure 15b, the voltage
V2). From the point of view of the quality of the supply of consumers, this is a desirable action. Unfortunately, in a situation of power deficit in the system, maintaining this control criterion results in a decrease in the limit of voltage stability on the primary transformer side (
Figure 15c). Much more advantageous effects are achieved by using the proposed solution (
Figure 8). The activation of one of the algorithm’s elements results in a change in the preset voltage value, which causes an abrupt increase in deviation, resulting in a change in voltage ratio towards voltage reduction. Because, in the initial phase of the disturbance under examination, the d
Q/d
V coefficient is positive, a fast reduction of reactive power flowing through the transformer follows (
Figure 15f). As a consequence, an increase in the reserve of voltage stability in the supply network is obtained (
Figure 15c).
The reduction of the reactive power input also results in a decreased drop of the voltage
V1 (
Figure 15a). An added positive effect of the preset value adjustment is a change in tap switching direction (
Figure 15e). As a result, the present regulation capabilities increase, which results in a longer time of maintaining reduced power. So, positive effects are observed for cases in which the voltage decrease rate is lower than the limiting value described by Relationship (6).
The confirmation is provided also by graphs shown in
Figure 16. In a situation, where the voltage decrease rate exceeds the limiting value (
Figure 17), a positive effect of reducing the preset value to the value of
Vref =
Uext. +
ε is only observed in the first voltage decrease phase, when
V ≤
Vext (
Figure 17c). Due to the high voltage decrease rate, the voltage drop is not compensated for by the change of the voltage ratio, which leads to a dramatic increase in reactive power uptake by the HV/MV substation. Because, as a result of changing the critical preset voltage value, the critical voltage value has been attained sooner, the voltage collapse will also come up sooner (
Figure 17a,b).
The emulated change rate of the supply voltage
V1 in variant D was, more or less, 30 times greater compared to the remaining variants. As the regulation process rate, resulting from the use of the power electronic tap changer, was almost 20 times greater, the results obtained by applying the proposed solution are equally positive as those obtained from the system with the emulated power electronic tap changer (with the respectively lower voltage decrease rate). Just like for variants A and B, an increase in the voltage stability reserve (
Figure 18c), a reduction in the decrease rate of the supply voltage
V1 (
Figure 18a), and an increase in the present regulation range (
Figure 18f) were obtained.
The effects of the operation of the “New (
ϑfreeze)” algorithm taken for reference should be regarded as moderate for each of the A-D cases under consideration. With the exception of the case, where the voltage decrease rate exceeds the transformer’s regulation capacities, the performance of the reference algorithm is always poorer than the proposed author’s algorithm and, at the same time, better than the algorithm currently in use. As the effects of the operation of the reference algorithm are noticeably lower compared to the author’s algorithm, the solution shown in
Figure 8 should be taken as recommended.
7. Conclusions
The test results presented in this paper have confirmed both the effectiveness and versatility of the operation of the proposed algorithm. The change of the preset voltage value, made in the appropriate moment of the test disturbance, reduced the reactive power input at very low voltages. In a real electric power system, in the situation of an existing reactive power deficit resulting in a voltage drop, such a result of regulation would be very desirable
One of the reasons for the reactive power deficit in the HV network is the simultaneous increase in the demand for reactive power in many HV/MV substations in a given area. This deficit is manifested by a significant increase in the speed of voltage drop in the HV network and its extremely low level. As described in
Section 6.1, both of these factors activate the algorithm proposed in the article. Should the proposed solution be implemented in the majority of HV/MV substations, a significant increase in the level of its positive influence on the HV grid could be expected. Simultaneous reduction of reactive power consumption in many HV/MV substations may significantly reduce the risk of voltage collapse in the HV supply network.
The authors are currently conducting multi-variant simulation studies with the use of the real HV grid model, which will prove the correctness of the above statement. The research results will be published in the next paper.
To sum up, the author’s algorithm is effective and owing to its simplicity, it has a high potential of practical application, as confirmed by the tests using a real transformer with a capability to change the voltage ratio under loading. The implementation of the algorithm makes it possible to increase the reserve of the voltage stability of the node, in which it is applied, thus mitigating the risk of a voltage collapse occurring.


