Abstract
High quality of solar radiation data is essential for solar resource assessment. For remote areas this is a challenge, as often only satellite data with low spatial resolution are available. This paper presents an interpolation method based on topographic data in digital elevation model format to improve the resolution of solar radiation maps. The refinement is performed with a data mining method based on first-order Sugeno type Adaptive Neuro-Fuzzy Inference System. The training set contains topographic characteristics such as terrain aspect, slope and elevation which may influence the solar radiation distribution. An efficient sampling method is proposed to obtain representative training sets from digital elevation model data. The proposed geographic information system based approach makes this method reproducible and adaptable for any region. A case study is presented on the remote Amhara region in North Shewa, Ethiopia. Results are shown for interpolation of solar radiation data from 10 km × 10 km to a resolution of 1 km × 1 km and are validated with data from the PVGIS and SWERA projects.
1. Introduction
Solar energy yield is related to the quantity of radiation received at a specific geographical location which in turn depends on a number of environmental factors. There are other factors such as temperature, but still, estimation of solar radiation is fundamental requisite for siting of photovoltaic and solar thermal installations. These estimations are calculated from radiation data obtained in meteorological stations or on-site measurements but satellite data is gaining more and more importance. Good estimates are obtained combining long-term satellite-based time series with a short-term measuring campaign of at least one year. However, there are many countries with an insufficient network of meteorological stations and on-site measurements are costly, especially in remote areas. This is a major obstacle for reliable estimates of solar resources for policy makers and regional planning in these countries.
Accurate modeling of solar radiation is a difficult job due to the high number of atmospheric parameters and their spatio-temporal variations. It received special attention over the last three decades due to the rise of solar applications worldwide. Three main groups of models can be identified from the literature:
- Classical models with physical or empirical methods, based on astrophysical, atmosphere and geometrical measurements,
- Geographic information system (GIS) based models which usually combine ground measurements with physical models and
- Image processing models based on data obtained from satellite observations with ground measurement validation.
1.1. Classical Solar Resource Data Modeling Approaches
These classical methods commonly apply indirect approaches and empirical relationships like Angstrom [1], Glover and McCulloch [2], Paulescu [3], and Almorox [4]. Improved methods have been described by Perez [5], and Kamali [6]. Models which in addition use ground measurements of global radiation and its components are described in Kumar [7], and Monteiro [8]. Munkhammar [9] uses a statistical model based on copula to represent the dependence among solar radiation data at several locations. Currently huge progress has been achieved in this field. Several approaches exist to estimate solar radiation at a global scale for any application from simple to in-depth. In any case, ground measurements are the fundamental basis of all classical methods. Chelbi [10] and Robaa [11] estimate the solar radiation in developing countries with different models in countries where it is difficult to obtain measurement data as Tunisia and Egypt.
1.2. Solar Resource Modeling Based on GIS
GIS-based solar assessment has become more and more attractive as modern desktop computers are able to manage large amounts of data and many powerful GIS software tools are available. Rich [12] and Dubayah [13] aimed to estimate the diffuse irradiance of the sky in the absence of clouds with the sky image obtained from a point and assuming isotropic conditions (equivalent to view shed operation in GIS). Kumar [7] and Gueymard [14] presented algorithms to estimate radiation over a large area under clear sky conditions, they use digital elevation and latitude data to evaluate radiation changes in different aspects, slopes and positions of adjacent surfaces. Voivontas [15] developed a solar model using GIS that provides some tools to deal with spatial and temporal differences in solar radiation and demand. Monteiro [16] developed a model for calculating solar radiation maps under real-sky conditions using adaptive triangular meshes, specifically focusing on focusing on accurately defining the terrain surface and the generated shadows. The model can be used as a local server to interface with GIS tools. Piedallu [17] presented GIS-based programs to calculate solar radiation with and without clouds. Shortwave radiation components are calculated considering three sets of parameters—atmospheric attenuation, topographic parameters from the digital elevation model (DEM), and geometric relationship between the earth’s surface and the sun, Charabi [18] analyses the influence of the sun in the DEM during a time period using ArcGIS tools. These methods combine ground measurements with physical models. Measurement data availability depends on location and the algorithms are simplifications of physical processes.
1.3. Solar Resource Modeling Based on Satellite Data
Currently, several institutions have implemented their own solar data bases, based on satellite measurement data. Data grids provided is based on cells with a size between and . Data values are given as average over the area of each cell. Its purpose is to fill the gap where ground measurements are missing, although spatial resolution is low.
An outstanding example of a worldwide solar data base is the SWERA project [19]. It provides data freely available to the public and is the result of a cooperation of renowned organizations such as DLR, NASA, NREL, DTU and UNEP.
The input consisting of high resolution direct normal irradiation (DNI) and global horizontal (GHI) is checked for data quality and repaired by DLR and SUNY methodologies, and has a coarse resolution of 10 km × 10 km.
In the data set the primary component of information for the estimation of irradiation is a digital imagery for cloud detection. The cloud index of 10 km × 10 km resolution is extracted from half-hourly data from Meteosat satellites. The second part of information holds the physical atmospheric data set (including Aerosol Optical Thickness, Total Ozone, Transmission of Raleigh Atmosphere and Mixed Gases, water vapor etc.). The final data set is compiled using satellite imagery and ground measurements provided by the project countries. Furthermore, for the solar radiation data processing data sets from previous processes are combined into geo-referenced maps and site specific hourly time series of GHI and DNI using the methodologies of DLR for Direct Radiation and SUNY for Global Radiation.
Another example of free-access database is PVGIS of the European Joint Research Center (JRC). It contains solar resource data for Europe, Africa, and South-West Asia [20].
Other databases provide specific regional data, such as the Renewable Resource Data Center (RReDC) from NREL for the USA [21], Natural Resources Canada [22], Australian Bureau of Meteorology [23].
Finally, there are of course commercial products such as Vaisala [24] or SolarGIS [25].
Therefore, in regions where no ground measurements are available, several institutions have implemented their own climatological data modeling systems, based on satellite data and integrated on GIS platforms [7,8,13,15,26]. Huld [27] recently developed PVMAPS a set of computational tools and climate data for GRASS GIS to calculate solar radiation on large areas.
1.4. Proposed Resource Modeling with Data Mining
Satellite data is the solution for regions where no ground measurements are available. The main drawback is the coarse spatial resolution. Here is where this work is proposing a refining method based on data mining techniques. The method is explained in general and illustrated with a study case.
The presented method aims to provide a low-cost tool which can be applied even by entities with very limited budget, in order to assess solar development options for remote regions. It is considered especially useful if no reliable data is available from meteorological stations.
The paper is structured in the following way—in the introduction the motivation of the present work is presented. Section 2 describes the proposed geo-statistical data mining methodology. The method is illustrated in Section 3 with a case study. Within this section, aspects such as definition of Adaptive Neuro-Fuzzy Inference System (ANFIS) training parameters, sampling process for training data, and finally results are shown. A summary and concluding remarks are given in Section 4.
2. Geo-Statistical Data Mining Methodology
2.1. General Considerations
As seen before, ground measurements are the fundamental basis for reliable solar resource estimation. However, especially for remote and poor regions, the initial cost of this approach is too high. Furthermore, the conventional approach extrapolating known solar radiation data from reference sites is not feasible. Large distances between meteorological stations render extrapolations too uncertain to be useful.
From existing models such as PVGIS, irradiation data is available with coarse resolution of 10 km × 10 km for example. At the same time, topographic data from high resolution DEM is available for almost any location [20]. Consequently, the objective of this work is to develop a method to increase the spatial resolution of available solar radiation maps combining coarse irradiation data (GHI) with high-resolution topographic data.
The method is based on the hypothesis that atmospheric parameters such as cloud index, water vapor, aerosol and ozone are already incorporated in the initial low-resolution solar irradiation data. In addition, it is assumed that solar irradiation is largely influenced by the local terrain.
Some authors introduce the terrain conditions to improve the calculation of the solar radiation received in a certain area [10,18,28,29]. On flat terrain with clear-sky, solar radiation is almost the same over relatively large areas [7]. In hilly and mountainous terrains, altitude and slope distribution has a greater effect on local climate [30]. Surface radiation can change a lot depending on the frequency and thickness of the clouds [31]. As a result, terrain parameters such as elevation are related to solar radiation because they have a direct impact on cloud covers.
Therefore, the present methodology combines topographic data with geo-referenced GHI values. Geo-statistical information is captured from GHI data available in lower resolution (e.g., cell size of 10 km × 10 km) using ANFIS to estimate data with higher resolution (e.g., 1 km × 1 km).
The ANFIS is trained with a reduced representative training set, which is obtained based on statistical analysis of the original data. With a show case, it is demonstrated that the obtained ANFIS model is valid for the whole region under study.
This novel approach constitutes a fundamental difference with regard to the above mentioned models as it represents an indirect assessment. It is not a complete model in itself, but it is a tool to enhance existing model output considering topographical information.
2.2. Data Mining Using ANFIS
Artificial intelligence techniques, such as the well known heuristic method ANFIS have been used successfully in different renewable energy applications [32,33,34,35].
The basic steps of the proposed geo-statistical data mining methodology are:
- Definition of training parameters for data mining model,
- Representative data sampling for training parameters,
- Training of data mining model,
- Estimation of high-resolution radiation data using the trained data mining model,
- Validation of results.
In summary, the relationship of spatial variation of global solar radiation (available in low resolution) and terrain parameters (available in high resolution) is captured in a data mining model. This model is later applied to generate a solar radiation map with considerably higher resolution.
The steps mentioned above are illustrated in the next section with a case study from a remote region in Ethiopia.
3. Case Study: Amhara Region Ethiopia
In order to illustrate the proposed method, a study case is presented for the Amhara region in North Shewa, Ethiopia. As input, publicly available long-term data of GHI is used from SWERA project [19] having a coarse resolution of 10 km × 10 km ( cell size). Further, a high-resolution DEM was obtained from GeoCommunity™ website [36]. In Figure 1 geo-referenced maps of elevation (above) and irradiation (below) are shown for the studied Amhara region.
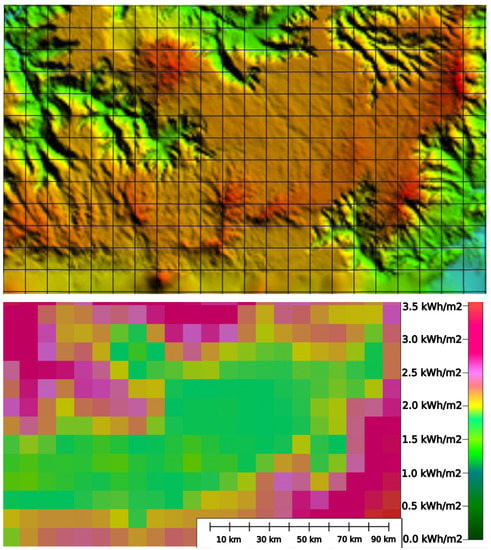
Figure 1.
High-resolution elevation map (above) and low-resolution daily solar radiation map with cell size (below) of Amhara region, North Shewa (Ethiopia).
In the following sections, the case study is developed following step by step the proposed method. At the end, the result is a refined map of GHI with a resolution of 1 km × 1 km.
3.1. Definition of ANFIS Training Parameters
The topographical terrain parameters used to describe the study region are terrain elevation, slope and terrain aspect, as proposed in Reference [7].
It may be mentioned here that the terminology used here is based on GIS standards. Translated to commonly used terms in solar energy assessment, aspect would be azimuth () and slope would be tilt (). Nevertheless, it is preferred here to maintain the GIS terminology, as these parameters are referred exclusively to the terrain and not to the solar energy capturing system.
In addition, values of standard deviation (STD) of elevation and slope are added to the training set. Tests (not shown here) have shown that by including these additional parameters the stability of model outputs can be improved. For example, estimated negative radiation values are avoided.
Using GIS Global Mapper platform raster maps of 1 km × 1 km resolution are obtained directly from DEM data [36] for elevation and slope and their corresponding standard deviation for each cell.
A continuous raster of the terrain aspect was created in order to facilitate data sampling (see Section 3.2. This was attained using the built-in shader function for slope direction of the GIS platform of Global Mapper software [37]. In order to obtain useful data, the default grayscale has been adapted. As a simplification of more complex natural phenomena, it is assumed that east and west orientation have the same effect on radiation. Therefore, the scale is defined ranging from 0 (black = north) to 255 (white = south). West and east are equally represented by the value 127 (gray). As a result, a circular scaling is obtained. From the GIS data an average aspect value is calculated for each square kilometer of the region extension. The resulting map is shown in Figure 2.
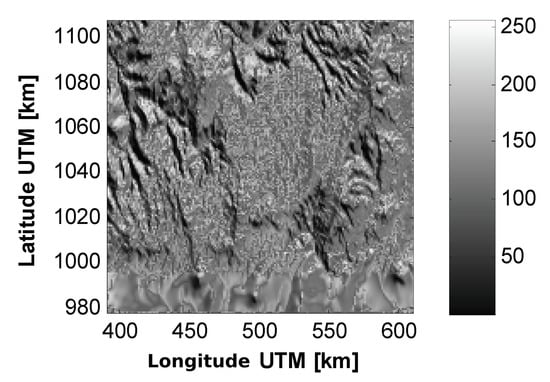
Figure 2.
Full grayscale bitmap of aspect of the region terrain.
As a result five parameters compose the input for the training session: terrain elevation, slope (inclination), aspect (orientation) and STD of elevation and slope. The output is solar radiation (see Table 1).

Table 1.
Ranges of Adaptive Neuro-Fuzzy Inference System (ANFIS) training data (matrix of 219 columns and 130 rows).
3.2. Representative Data Sampling for ANFIS Training
Solar radiation data of the region under study is only available with a resolution of 10 km × 10 km. It is given in a matrix of 13 rows and 22 columns, covering a surface of 130 km × 220 km. On the other hand, terrain data (elevation, slope, aspect) are available with a resolution of 1 km × 1 km. In order to obtain a representative training sample which establishes a relationship between terrain data and solar radiation, an adequate sampling method is required.
Therefore, in a first step, the resolution of solar data is increased to 1 km × 1 km, such as the terrain layers (see Figure 3). Notice that in this step, only the number of data points is increased and no information is added. This step is merely for convenience for the following steps, as all four matrices M (one for solar radiation and three for terrain properties) have the same size and each cell is geo-referenced to the same location.
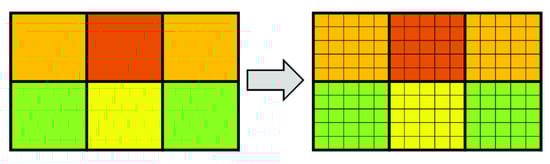
Figure 3.
Illustration of the increase of solar radiation data resolution from 10 km × 10 km to 1 km × 1 km.
In a second step a simple sampling method is applied, which makes sure that all solar radiation data is included and a representative selection of terrain data is obtained. This sampling method consists in extracting every tenth row of each matrix M. Hence, the new dataset contains exactly 10% of the original data. In the presented show case, 28,470 values are reduced to 2847 values for every training parameter.
The same procedure is repeated for all five matrices and a training set of five reduced matrices is obtained. With this procedure, ten different training sets can be generated, depending on the row where the selection is started.
It can be expected that any of these sets are suitable as training set. In order to verify if the obtained reduced datasets are representative for the original data and to select the best training set, two additional steps are proposed here. Notice that the representativeness for solar radiation data is given automatically, as exactly one line (ten identical values) is extracted from each cell of 10 km × 10 km. First, histograms are computed for all reduced matrices of terrain data. An example is given in Figure 4, where the histograms of the ten possible training sets for terrain elevation, slope, aspect as well as for the STD of elevation and aspect are shown.
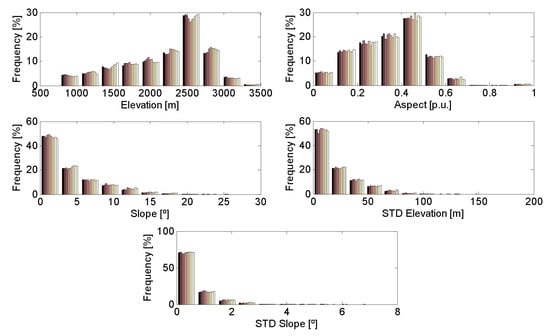
Figure 4.
Histograms of the ten possible training sets of terrain parameters from top to bottom: elevation, slope, aspect, STD of elevation, STD of Slope.
In order to evaluate the representativeness of the extracted training sets, in a second step the root mean square error () is computed for each histogram compared to the histogram of the whole dataset.
where and f are vectors of 10 values, representing the frequency in the 10 bins of the histogram.
The results for all five terrain variables are shown in Figure 5. The numbering of the histograms is related to the first line i of extraction. In addition, the average of all 5 curves is shown. From this average, it can be derived that the most representative training sets would be those with index 1, 2 and 9. Nevertheless, it can also be concluded that any training set is suitable, as all sets have distributions which are very similar to each other, with deviations of less than 1%.
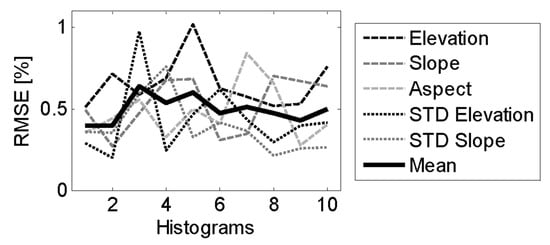
Figure 5.
RMSE of the histograms of the ten extracted possible training sets from terrain aspect data.
In order to illustrate the obtained training data set, in Figure 6, a cross-correlation plot of available data and the extracted training data for radiation and elevation is shown. The strong correlation of these two parameters can be observed easily.
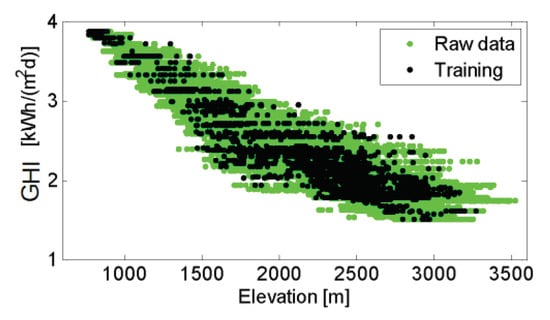
Figure 6.
Cross-correlation plot of available (raw) data and the extracted training data for radiation and elevation.
3.3. Training of Neuro-Fuzzy Network
The data mining model has been implemented with Matlab ANFIS. The sub-clustering architecture in combination with hybrid optimization was chosen, because this combination offered the fastest and best approximation of the solar radiation estimation algorithm.
The training procedure used for the selected data is using Matlab built-in ANFIS editor, where a common modeling technique is implemented. After appropriate data sampling (as explained in Section 3.2), the obtained training set can be imported in text format into the ANFIS editor. For effective ANFIS training, the structure of the neuro-fuzzy network should be as simple as possible and be able to capture the desired information. In a first step, the numbers of membership functions are assigned arbitrarily. Then, a hybrid optimization method optimises the ANFIS structure and parameters until a correct reproduction of the training data is achieved. The number of epochs selected was 80–300 and the training population size is 2144 data sets with 5 to 8 alternative runs. At the end of this learning process, it was possible to tailor a membership function such that adequate inference and rule surfaces were obtained. For example, the Fuzzy Inference System (FIS) rule surface in Figure 7 shows that radiation values remain defined for all possible combinations of elevation and slope.
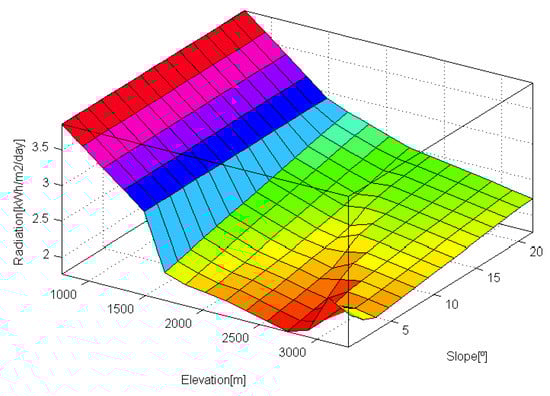
Figure 7.
Fuzzy Inference System (FIS) Rule surface of elevation and slope for the estimation of radiation.
3.4. Estimation of High-Resolution Radiation Data
With the trained ANFIS model, solar radiation is estimated for the entire region under study with a resolution of 1 km × 1 km. For convenience, the result is exported to a text file with grid format (x, y, radiation). This file can be imported and represented as another layer for the geo-referenced region in any GIS tool.
In Figure 8 the result of the ANFIS model is compared with original coarse resolution data from the study region of Northern Ethiopia. Both maps are generated with the raster extrapolation tool of ArcGIS software.
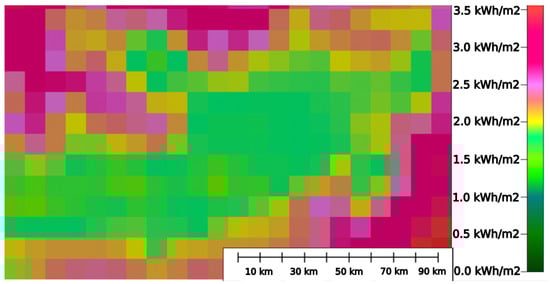
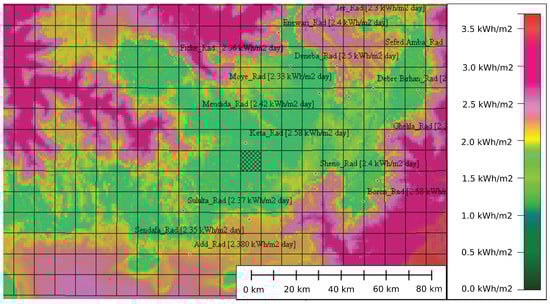
Figure 8.
Comparison of coarse daily solar radiation data (top) and refined data of 1 km × 1 km (bottom), applying ANFIS estimation model.
Comparing the two maps, the refined resolution of solar radiation data in the lower map is evident. Especially the strong correlation with elevation data can be noticed.
3.5. Validation of Results
In order to give an idea of the validity of the estimation, two validation steps are presented in this section. First, the consistency of training data and estimation results is evaluated. In a second step, results are compared with two benchmark data sources (PVGIS and SWERA).
The consistency of the ANFIS output with original data is demonstrated representing the data in several different plots.
In Figure 9, the effect of the modification of solar radiation data can be observed. Raw data (coarse radiation) is compared with ANFIS estimation for every 1 km × 1 km grid cell. The graph represents a sequential scan of the map from the upper left corner down to the lower right corner. On the horizontal axis all the pixels of the map are represented in order. Training data is represented at the same position as raw data. Therefore, training data (black dots) is separated into 13 almost vertical lines which represent the 13 rows of the coarse radiation data set. This way it can be seen how three-dimensional data has been represented in a two-dimensional plot. It can be observed how minimum and maximum radiation limits are widely respected and much more intermediate values are generated. In addition, it can be seen how few training data values of solar radiation were employed.
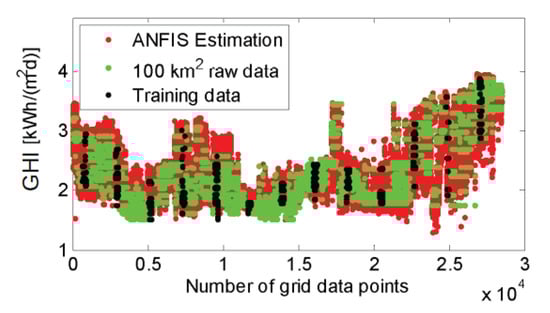
Figure 9.
ANFIS radiation extrapolation compared to average (raw) and training data.
In Figure 10 a correlation plot is shown of original (10 km × 10 km) against estimated refined data (1 km × 1 km) of GHI for the training set (black) and the final estimate of the entire region (red). Representativeness of training data becomes evident as it covers the complete range of results. In addition, the final estimate shows almost no outliers, which demonstrates the stability of the model.
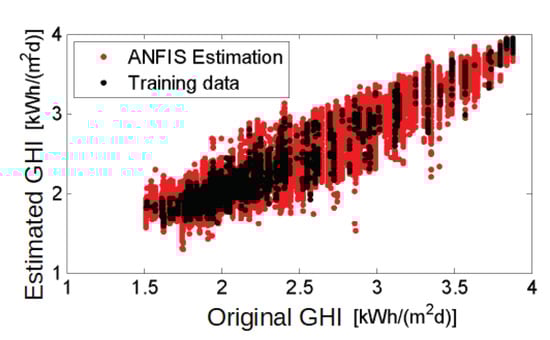
Figure 10.
Correlation between radiation data and resolution estimated radiation.
Following the same procedure, in Figure 11 three different radiation data sets are represented against the terrain elevation—Original GHI with coarse resolution, refined GHI from the training set and from the final estimate of the entire region. Again, the consistency of the model output becomes visible. Also, a remarkable correlation pattern can be observed between elevation and GHI. This pattern is captured by the ANFIS model and as a result estimated data are much more correlated with terrain elevation than original low-resolution input data.
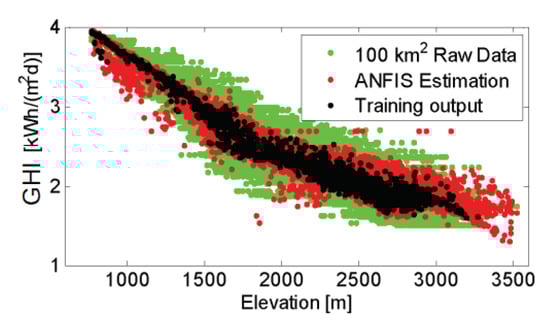
Figure 11.
Comparison of raw radiation data versus ANFIS training and final ANFIS estimation as a function of terrain elevation.
It must be pointed out here that the observed pattern is a specific feature of the region under study. This by itself is a valuable result of the model, as it indicates an interesting subject, which is worth to be further investigated. Additional studies may determine if this pattern also can be found in regions with different climates and elevation patterns.
The presented correlation plots give plausible evidence that ANFIS estimation has been able to capture the behaviour of the input data to be assessed and produces coherent results. The next step is a validation with available GHI data for some specific locations within the region under study.
The best way to validate the model would be with random samples of long-term on-site measurements. But as these measurements are not available, the validation is carried out with existing data from PVGIS and SWERA as benchmarks. PVGIS was chosed as it is a standard freely available online database and SWERA in order to illustrate the modification which the ANFIS model made at certain locations compared to the original data.
In Table 2, values of GHI are shown for some selected locations within the studied region of Ethiopia (sorted in alphabetical order). ANFIS estimation is compared with original data from SWERA (mean value of 10 × 10 km cell) and PVGIS.
Table 2.
Comparison of ANFIS model output with global horizontal (GHI) obtained from SWERA and PVGIS for selected locations.
The difference of ANFIS output compared to PVGIS (Average difference: 45% is slightly higher than the difference to SWERA (Average difference: 18%). This is mainly due to the fact that SWERA data was used to train the ANFIS model.
It is worth noticing that for some locations a large difference of GHI can be observed when data from SWERA is compared to PVGIS. The average deviation is with 45% in a similar range as the deviations of the ANFIS results compared to both models (18% and 45% respectively).
It is evident that only on-site measurements can determine with more clarity the degree of accuracy the proposed model is providing.
4. Conclusions
The comparison of ANFIS estimation results against SWERA, and PVGIS values for specific validation sites shows a reasonable approximation to both benchmark validation data sets. Both data sets are produced using remote sensed data in combination with NWP and validated by local meteorological stations. Seeing the correlation plots of the parameters it could be demonstrated that the ANFIS technique produces a robust model which follows very well the patterns of the training data. On the other hand it can be noted that with the proposed methodology, good results could be achieved in-spite of limited input data. Finally, it can be said that this methodology is creative and unique in its approach on GIS-based solar assessment as well its application to the case study in Ethiopia.
The main contributions of this work are:
- A GIS-based data mining methodology using Sugeno ANFIS is proposed to interpolate global solar irradiation.
- A clear and reproducible statistical method is proposed to create a reduced and representative training set.
- The proposed model may be easily adapted for any geographical location with limited solar data records.
The presented case study is a simplified training procedure for ANFIS estimation of radiation, even though this procedure is reproducible at any scale and able to contain more parameters in order to improve its performance.
Author Contributions
Conceptualization, B.A.W. and J.A.D.-N.; methodology, B.A.W.; software, B.A.W.; validation, B.A.W. and H.B.; writing—original draft preparation, B.A.W. and H.B.; writing—review and editing, J.A.D.-N.; supervision, J.A.D.-N. All authors have read and agree to the published version of the manuscript.
Funding
This research received no external funding.
Conflicts of Interest
The authors declare no conflict of interest.
Abbreviations
The following abbreviations are used in this manuscript:
| ANFIS | Adaptive Neuro Fuzzy Inference System |
| DEM | Digital Elevation Model |
| FIS | Fuzzy Inference System |
| GHI | Global Horizontal Irradiation |
| GIS | Geographic Information System |
| PVGIS | Photovoltaic Geographical Information System |
| RMSE | Root Mean Square Error |
| STD | Standard Deviation |
| SWERA | Solar Wind Energy Resource Assessment |
References
- Ångström, A.; Angstrom, A. On Radiation and Climate. Geogr. Ann. 1925, 7, 122. [Google Scholar] [CrossRef]
- Glover, J.; McCulloch, J.S.G. The empirical relation between solar radiation and hours of sunshine. Q. J. R. Meteorol. Soc. 1958, 84, 172–175. [Google Scholar] [CrossRef]
- Paulescu, M.; Stefu, N.; Calinoiu, D.; Paulescu, E.; Pop, N.; Boata, R.; Mares, O. Ångström–Prescott equation: Physical basis, empirical models and sensitivity analysis. Renew. Sustain. Energy Rev. 2016, 62, 495–506. [Google Scholar] [CrossRef]
- Almorox, J.; Arnaldo, J.; Bailek, N.; Martí, P. Adjustment of the Angstrom-Prescott equation from Campbell-Stokes and Kipp-Zonen sunshine measures at different timescales in Spain. Renew. Energy 2020, 154, 337–350. [Google Scholar] [CrossRef]
- Perez, R.; Ineichen, P.; Seals, R.; Michalsky, J.; Stewart, R. Modeling daylight availability and irradiance components from direct and global irradiance. Sol. Energy 1990, 44, 271–289. [Google Scholar] [CrossRef]
- Kamali, G.A.; Moradi, I.; Khalili, A. Estimating solar radiation on tilted surfaces with various orientations: A study case in Karaj (Iran). Theor. Appl. Climatol. 2006, 84, 235–241. [Google Scholar] [CrossRef]
- Kumar, L.; Skidmore, A.K.; Knowles, E. Modelling topographic variation in solar radiation in a GIS environment. Int. J. Geogr. Inf. Sci. 1997, 11, 475–497. [Google Scholar] [CrossRef]
- Monteiro, C.; Saraiva, J.; Miranda, V. Evaluation of electrification alternatives in developing countries-the SOLARGIS tool. In Proceedings of the MELECON ’98 9th Mediterranean Electrotechnical Conference, Tel-Aviv, Israel, 18–20 May 1998; Volume 2, pp. 1037–1041. [Google Scholar]
- Munkhammar, J.; Widén, J.; Hinkelman, L. A copula method for simulating correlated instantaneous solar irradiance in spatial networks. Sol. Energy 2017, 143, 10–21. [Google Scholar] [CrossRef]
- Chelbi, M.; Gagnon, Y.; Waewsak, J. Solar radiation mapping using sunshine duration-based models and interpolation techniques: Application to Tunisia. Energy Convers. Manag. 2015, 101, 203–215. [Google Scholar] [CrossRef]
- Robaa, S. Validation of the existing models for estimating global solar radiation over Egypt. Energy Convers. Manag. 2009, 50, 184–193. [Google Scholar] [CrossRef]
- Rich, P.; Dubayah, R.; Hetrick, W.; Saving, S. Using Viewshed Models to Calculate Intercepted Solar Radiation: Applications in Ecology; American Society for Photogrammetry and Remote Sensing Technical Papers; American Society of Photogrammetry and Remote Sensing: Bethesda, MD, USA, 1994; pp. 524–529. [Google Scholar]
- Dubayah, R.; Loechel, S. Modeling Topographic Solar Radiation Using GOES Data. J. Appl. Meteorol. 1997, 36, 141–154. [Google Scholar] [CrossRef]
- Gueymard, C.A. Clear-sky irradiance predictions for solar resource mapping and large-scale applications: Improved validation methodology and detailed performance analysis of 18 broadband radiative models. Sol. Energy 2012, 86, 2145–2169. [Google Scholar] [CrossRef]
- Voivontas, D.; Tsiligiridis, G.; Assimacopoulos, D. Solar potential for water heating explored by GIS. Sol. Energy 1998, 62, 419–427. [Google Scholar] [CrossRef]
- Montero, G.; Escobar, J.; RodrÃ-guez, E.; Montenegro, R. Solar radiation and shadow modelling with adaptive triangular meshes. Sol. Energy 2009, 83, 998–1012. [Google Scholar] [CrossRef]
- Piedallu, C.; Gégout, J.C. Efficient assessment of topographic solar radiation to improve plant distribution models. Agric. For. Meteorol. 2008, 148, 1696–1706. [Google Scholar] [CrossRef]
- Charabi, Y.; Gastli, A. GIS assessment of large CSP plant in Duqum, Oman. Renew. Sustain. Energy Rev. 2010, 14, 835–841. [Google Scholar] [CrossRef]
- Schillings, C.; Meyer, R.; Trieb, F. Solar and Wind Energy Resource Assessment (SWERA); DLR report to UNEP; 2004. Available online: http://www.en.openei.org/wiki/SWERA/Data (accessed on 24 June 2020).
- JRC. PVGIS. 2012. Available online: http://re.jrc.ec.europa.eu/pvgis/ (accessed on 24 June 2020).
- NREL. NREL, National Renewable Energy Laboratory. 2018. Available online: http://www.nrel.gov/rredc/ (accessed on 24 June 2020).
- NCR. NCR, Natural Resources Canada. 2018. Available online: https://www.nrcan.gc.ca/18366 (accessed on 24 June 2020).
- BOM. Australian Government, Bureau of Meteorology. 2018. Available online: http://www.bom.gov.au/climate/maps/ (accessed on 24 June 2020).
- VAISALA. VAISALA. 2018. Available online: https://www.vaisala.com/en/wind-and-solar-online-tools (accessed on 24 June 2020).
- SolarGIS. SolarGIS. 2018. Available online: http://solargis.info/ (accessed on 24 June 2020).
- Martínez-Durbán, M.; Zarzalejo, L.; Bosch, J.; Rosiek, S.; Polo, J.; Batlles, F. Estimation of global daily irradiation in complex topography zones using digital elevation models and meteosat images: Comparison of the results. Energy Convers. Manag. 2009, 50, 2233–2238. [Google Scholar] [CrossRef]
- Huld, T. PVMAPS: Software tools and data for the estimation of solar radiation and photovoltaic module performance over large geographical areas. Sol. Energy 2017, 142, 171–181. [Google Scholar] [CrossRef]
- Ertekin, C.; Yaldiz, O. Comparison of some existing models for estimating global solar radiation for Antalya (Turkey). Energy Convers. Manag. 2000, 41, 311–330. [Google Scholar] [CrossRef]
- Duzen, H.; Aydin, H. Sunshine-based estimation of global solar radiation on horizontal surface at Lake Van region (Turkey). Energy Convers. Manag. 2012, 58, 35–46. [Google Scholar] [CrossRef]
- Oumbe, A.; Wald, L. A parameterisation of vertical profile of solar irradiance for correcting solar fluxes for changes in terrain elevation. In Proceedings of the Earth Observation and Water Cycle Science Conference, Frascati, Italy, 18–20 November 2010; p. S05. [Google Scholar]
- Sen, Z. Solar Energy Fundamentals and Modeling Techniques; Springer: Berlin/Heidelberg, Germany, 2008; p. 276. [Google Scholar]
- Mellit, A.; Kalogirou, S. Neuro-Fuzzy Based Modeling for Photovoltaic Power Supply System. In Proceedings of the 2006 IEEE International Power and Energy Conference, Putra Jaya, Malaysia, 28–29 November 2006; pp. 88–93. [Google Scholar]
- Mohammadi, K.; Shamshirband, S.; Kamsin, A.; Lai, P.; Mansor, Z. Identifying the most significant input parameters for predicting global solar radiation using an ANFIS selection procedure. Renew. Sustain. Energy Rev. 2016, 63, 423–434. [Google Scholar] [CrossRef]
- Güçlü, Y.S.; Öner Yeleğen, M.; İsmail, D.; Şişman, E. Solar irradiation estimations and comparisons by ANFIS, Angström–Prescott and dependency models. Sol. Energy 2014, 109, 118–124. [Google Scholar] [CrossRef]
- Olatomiwa, L.; Mekhilef, S.; Shamshirband, S.; Petković, D. Adaptive neuro-fuzzy approach for solar radiation prediction in Nigeria. Renew. Sustain. Energy Rev. 2015, 51, 1784–1791. [Google Scholar] [CrossRef]
- OpenDEM. OpenDEM home page. 2018. Available online: https://opendem.info/link_geodata.html (accessed on 24 June 2020).
- Marble, B. Global Mapper Software; 2018. Available online: http://www.bluemarblegeo.com/products/global-mapper.php (accessed on 24 June 2020).
Publisher’s Note: MDPI stays neutral with regard to jurisdictional claims in published maps and institutional affiliations. |
© 2020 by the authors. Licensee MDPI, Basel, Switzerland. This article is an open access article distributed under the terms and conditions of the Creative Commons Attribution (CC BY) license (http://creativecommons.org/licenses/by/4.0/).