Abstract
The installation of smart meters at customer premises provides opportunities for the monitoring of distribution grids. This paper addresses the problem of improving the observability of low-voltage distribution grids using smart metering infrastructure. In particular, this paper deals with the application of state estimation algorithm using smart meter measurements for near-real-time monitoring of low-voltage distribution grids. This application is proposed to use a nonlinear weighted least squares method-based algorithm for estimating the node voltages from minimum number of smart meter measurements. This paper mainly deals with sensitivity analysis of the state estimation algorithm with respect to multiple uncertainties for, e.g., measurements errors, line parameter errors, and pseudo-measurements. Simulation studies are conducted to estimate the accuracy of the DSSE under various operating scenarios of a real-life low-voltage grid, and cost-effective ways to improve the accuracy of the state estimation algorithm are also evaluated. The paper concludes that by using smart meter measurements from few locations, voltage profiles of the low-voltage grid can be estimated with reasonable accuracy in near-real-time.
1. Introduction
Power distribution systems are undergoing a radical change from passive power consumption mode to active participation of loads and generators [1]. An active distribution grid experiences wide variations in the power flows and voltage profiles making its monitoring and control a challenging task [2,3]. In the past, distribution system operators (DSOs) were not monitoring the low-voltage (LV) distribution grids as there were no requirements and operational challenges. Furthermore, the technical reason for poor observability of LV grids was the unavailability of measuring devices, except at primary and secondary distribution substations [4]. However, the recent operational scenarios with widespread residential PVs and increasing power intensive loads such as electric vehicles are causing bottlenecks in the grid operation [5,6]. In order to take corrective actions and maintain the quality of power at all times, close to real-time monitoring of LV grids is becoming more and more important [7].
Residential customers of LV grids are provided only three-phase supply connection in Nordic countries, while in some countries in Europe and the rest of the world, those customers have single- or three-phase connections. Load imbalances at LV grids could be high due to the increasing presence of single-phase loads such as heat, ventilation, and air-conditioning systems (HVAC) systems; electric vehicles (EVs); etc. Smart meters are being deployed at many countries around the world. The roll-out of smart meters is not evenly distributed across Europe. Nordic countries have achieved almost 100% deployment of smart meters, while in other countries the numbers are increasing. At present, smart meters are used mainly for billing, although DSOs are starting to analyze the historical smart meter data to gain knowledge on their infrastructure. The existing AMI in Nordic countries is a bottleneck for real-time monitoring of LV grids due to the data collection mechanisms and the players involved [8]. Data from smart meters are first collected in data concentrators, which are communicated to a head-end server and then to the respective DSO control center. It may take about six hours or even more to get data from all smart meters to the DSO control center depending on the communication network and associated infrastructure [9].
Smart meters can be utilized with the required modifications in the AMI set-up to improve the grid observability [10]. The present day smart meters have the capability to accurately measure various electrical parameters along with the energy consumption and communicate the information to the DSO’s control center [11]. Smart meters can record and communicate measured data at time steps of few minutes (typically 15 min) which improves the time resolution of the recorded data [9]. This paper deals with employing a state estimation technique that uses smart meter data for estimating the grid voltages with reasonable accuracy. In the next subsections, the state-of-the-art, assumptions, and contributions of this paper are provided.
Distribution system state estimation (DSSE) is an important tool for DSOs to monitor the grid variables (voltages, currents, and powers) and grid assets such as cables and transformers. A state-of-the-art review of DSSE can be found in [12,13,14]. In [12], the technological barriers and challenges for implementation of the DSSE are analyzed. While in [13], various mathematical formulations, meter placement techniques, and cyber-security issues related to DSSE implementation are elaborated. Some of the advanced theoretical formulations that provide optimal solutions of the DSSE algorithm are reviewed in [14]. In all the review papers above, the importance of state estimation algorithm to improve grid observability is clearly illustrated. However, a detailed study about the sensitivity of the DSSE algorithm applied to monitoring of a practical LV grid using smart meter data is missing in the literature, which will be addressed in this paper.
The works in [10,11] deal with utilizing smart metering infrastructure for state estimation in LV grids. It is pointed out in [10,11,12,13] that the accuracy of the DSSE is of utmost concern for the estimated results to be useful to DSOs. Estimation of grid voltages/currents by the DSSE algorithm is affected by uncertainty in measurement data and grid topology data. To study the impacts of the uncertainty, a sensitivity analysis of the state estimation algorithm from a power system point of view is presented in [15,16]. The above references acknowledge that measurement errors, poor knowledge of grid parameters, and using pseudo-measurements deteriorate the accuracy of the DSSE. The line parameters are difficult to obtain with high accuracy because the cable data are missing in most cases, the database of cable information is not properly maintained, cable lengths are not exactly known, and the aging phenomenon of cables. However, the ways to improve accuracy of the DSSE with additional voltage/current measurements by smart meters, using pseudo-measurements at nodes where smart meters are unavailable, and additional measurement devices such as RTUs are not studied. This paper tries to address the above problem by considering the assumptions stated below.
In this paper, uncertainty in smart meter measurements and grid parameters are assumed to be bounded. In other words, the meters are assumed to be in good working condition ruling out bad data, loss of communication, and cyber-attacks. The errors in grid parameters are assumed to be within a known interval, which means that the grid topology is known.
Although smart meter measurements can be utilized for a variety of smart grid applications, real-time monitoring of distribution grids is one of the important requirements of DSOs at present. This is possible by implementation of a DSSE algorithm using the available smart meter measurements to estimate grid voltages with reasonable accuracy. Keeping this in mind, this paper makes the following main contributions.
- Application of a DSSE algorithm for near-real-time monitoring of LV grids by using fewer smart meter measurements. It is to be noted that the proposed DSSE algorithm takes voltage measurements from few nodes thus avoiding installation of additional measurement devices such as RTUs making the deployment of the DSSE easier and uses pseudo-measurements at locations in which smart meter measurements are either unavailable or cannot be accessed close to real-time.
- Sensitivity analysis of the DSSE algorithm with respect to uncertainty in measurement errors, number and type of measurements, and grid parameters.
- Proposal for practical deployment and utilization of DSSE algorithm for near-real-time monitoring.
This paper is organized as follows. Architecture of the grid along with ICT infrastructure is discussed in Section 2. In Section 3, details of the DSSE algorithm, such as its challenges, types, methods, comparisons, and applications, are provided. An application of the DSSE algorithm, namely, the near-real-time monitoring of LV grids is explained in Section 4. Sensitivity analysis of the proposed DSSE algorithm with respect to uncertainty in measurements and parameters are carried out in Section 5. Simulation studies conducted on a Danish LV network using the proposed DSSE algorithm are also presented in this section. A discussion about the implementation of DSSE in a real-life LV grid is provided in Section 6 and the paper concludes in Section 7.
2. System Architecture and AMI Utilization at Present
A detailed knowledge of the grid architecture with underlying infrastructure for measurements, communications, and control is required to implement new functionalities such as state estimation. In this section, a high level structure of a typical LV distribution grid with an ICT infrastructure typical for Nordic countries is studied whose schematic diagram is shown in Figure 1. It is to be noted that the advanced metering infrastructure (AMI) acts as the backbone of the data collection mechanism from the customer premises to the DSO control centre [9].
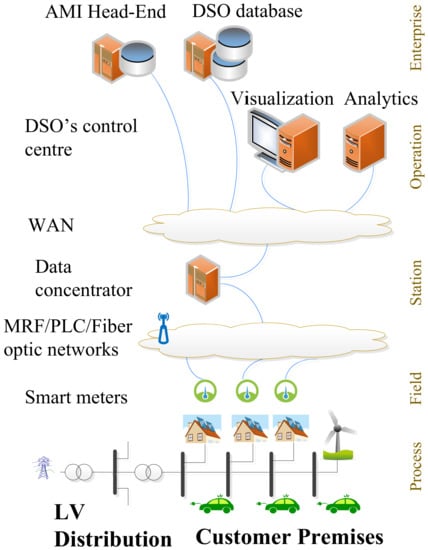
Figure 1.
Schematic layout of a typical advanced metering infrastructure (AMI) infrastructure in Nordic countries.
As shown in Figure 1, the AMI comprises smart meters, data concentrators, communication channels, and data management systems that enable communication between customers and the DSO. Measurements from smart meters of a particular LV grid are collected at a data concentrator which is usually present at the distribution substation. The collected data are then sent to the AMI head-end via a wide-area network (WAN) [8]. The control center hosts the human–machine interface (HMI), visualization applications, and a data analytics module. The analytics module processes the received measurement data and displays the required information to the operators using the visualization tools. The communication technologies could be of many types such as cellular, meshed radio-frequency (MRF) networks, or PLC. In order to minimize the cost of the ICT infrastructure, the DSOs, particularly in Europe, deploy RM networks instead of the fastest Ethernet or fiber based networks. Moreover, these networks are designed to measure only the power consumption of customers for billing purposes only [17].
In the following sections, recommendations on how to use existing AMI infrastructure and smart meter measurements for grid monitoring and their details are provided.
3. DSSE Algorithm
As explained in Section 2, high-resolution data from multiple locations of a LV grid can be obtained using the AMI. However, the measured data are prone to uncertainty which need filtering and further processing. It is pointed out in Section 1 that a DSSE algorithm is able to process the measurement information and estimate the grid states reliably.
3.1. Challenges of DSSE
Challenges in estimating the grid states are mainly related to uncertainty in the line parameters, errors in smart meter measurements, number, type, and location of smart meter measurements [2]. The following are to be considered while designing a proper DSSE algorithm to overcome the above said challenges are provided below.
- Time required to get measurements from smart meters: It is to be noted that smart meter data need to be collected and communicated to the headend server and then to the DSO control center. If radio-meshed communication networks are part of the AMI, it may take about six hours or more to collect data from all smart meters in a typical LV grid [9]. For near-real-time monitoring of LV grid, it may be desirable to obtain data from few smart meters and utilize pseudo-measurements for the rest of the locations [8].
- Line parameters: There is an uncertainty with respect to line parameters, due to lack of complete knowledge of cable type, aging of cables, changes in grid topology, etc. [18]. Parametric uncertainty may have an impact on the DSSE accuracy which has to be assessed [16].
- State variables of DSSE: Typically voltage phasors are considered as state variables in DSSE algorithm. However, for asset management application of DSSE, choosing branch currents in rectangular coordinates may be more convenient and have less computational burden compared to voltage phasors [19].
- Method of DSSE: The nonlinear weighted least squares method may be more appropriate for asset management application because of its simplicity and accuracy [20]. For near-real-time monitoring, either recursive least squared method of Kalman filter may be preferred, as the data available for processing will not be static and the method should be able to accept sequential data from sensors [21].
- Type of DSSE: Single-phase DSSE may be performed if the LV grid is assumed to be balanced which is preferable for near real-time monitoring application for its fast execution. For asset management application, three-phase DSSE may be considered for better accuracy and accounting the inherent unbalancing in LV grids with residential loads [22,23].
3.2. Applications of DSSE
In a typical distribution grid, DSSE may be used for the following applications.
- Near real-time monitoring: The objective of this application is to achieve full observability of distribution grids close to real-time. To minimize the communication bandwidth, only the critical smart meter measurements could be made available to the DSO control center. These measurements in addition to pseudo measurements can be used by the DSSE algorithm to estimate the node voltage phasors. The voltage violations will become detectable prompting the DSO to activate suitable control measures.
- Asset management: Primary responsibility of a DSO is to monitor the health of grid assets and manage their utilization optimally. The power consumption data communicated from smart meters are stored in a database. From this data, the DSO can perform offline power flow analysis using the DSSE algorithm. The aim of such analysis is to estimate the energy efficiency of the grid, loading of the grid assets such as cables and transformer.
Comparison of the requirements of the proposed DSSE algorithm for the above applications are summarized in Table 1. Let M be the number of measurements which includes smart meter and pseudo-measurements and S be the number of grid states which are typically the node voltage magnitudes and phase-angles.

Table 1.
Comparison of requirements of DSSE algorithm.
3.3. Inputs to the DSSE Algorithm
Figure 2 shows the block diagram of the DSSE algorithm for improving the observability of distribution grids. The inputs to the DSSE are the grid topology and the line parameters along with power measurements from smart meters. The grid topology information is obtained from the database of the respective DSO. It may not be an easy task to gather these data unless the DSO maintains all the grid information in a single database with a standard format such as the common information model (CIM) [24]. The line parameters are obtained from the information about the cable types and respective data sheets. The measurements are assumed to be provided by smart meters. There could be other devices such as RTUs and PMUs whose measurements can also be used to improve accuracy. The work reported in this paper is limited to the usage of smart meter measurements for the DSSE algorithm. Some of the measurements given as inputs to the DSSE may be virtual, if they are generated from the historical data and are called pseudo-measurements.
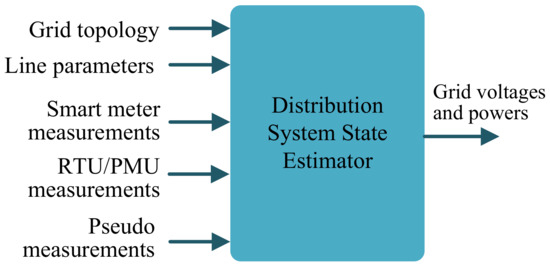
Figure 2.
Block diagram of the DSSE algorithm.
The DSSE estimates the grid voltages and power flows which can be further processed and used for many applications including power loss calculation and voltage regulation. The discussions in this paper are limited to inputs from smart meter measurements only. To minimize the communication overhead, pseudo-measurements are considered in this work in some of the LV grid nodes.
As mentioned in Section 1, this paper focuses on the near-real-time monitoring application of the DSSE algorithm. Taking the above into account, in this work, the nonlinear WLS method is chosen for the DSSE algorithm because it is a simple method and its accuracy is similar to that of Kalman filter [25] and its details are provided below.
3.4. Nonlinear Weighted Least Squares Based DSSE Algorithm
This paper employs nonlinear weighted least squares (NWLS) method [26] for the state estimation with synchronized measurements from smart meters for estimation of grid voltage phasors by single-phase DSSE. Let us assume that there are M number of smart meters measuring the active and reactive powers represented by the vector . Let us assume that there are N nodes in the LV grid and the system states be the voltage magnitudes and phase angles be the state variables represented by the vector . The measurements and state variables are related by the expression in (1).
where is a vector-valued nonlinear function, and the vector of size denotes the random measurement noise, which is assumed to be white with the normal probability distribution . The measurement covariance matrix is assumed to be constant.
Let the expected measurement be expressed as and let us define the residual vector as provided in (2).
The objective of the WLS method is defined to be minimizing the sum of squares of the residuals as provided in (3).
The weighting matrix is defined as follows.
The diagonal elements of the above matrix are the inverse of the variances of the errors ( is the variance of the error between the true value and the smart meter measurement). The solution to (3) is obtained by application of Gauss–Newton method which involves solving iterative equations in (5a)–(5c).
where, k is the iteration index, is the Jacobian matrix computed from . Utilization of this method for near-real-time monitoring application of the DSSE is described in the following section.
4. DSSE for Near-Real-Time Monitoring
This paper focuses on the near real-time monitoring application of the DSSE algorithm using nonlinear WLS method. The other applications of the DSSE such as asset management are reserved for our future works. A flowchart showing the inputs and the data flow in the proposed DSSE is provided in Figure 3.
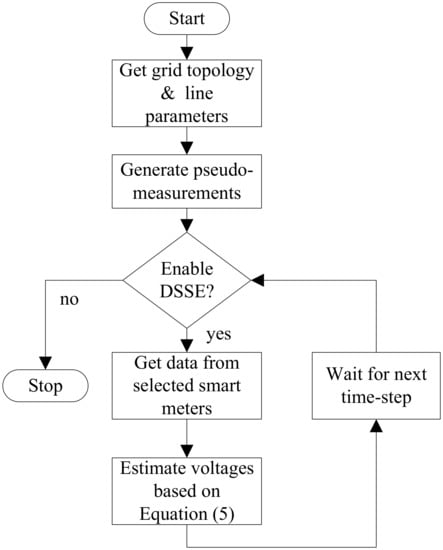
Figure 3.
Flowchart of the proposed smart meter data-based DSSE.
Grid topology and line parameters are obtained from the database maintained by the DSO. In order to generate pseudo measurements for some of the nodes of the LV grid, either load profiles from historical database or a standard load profile can be used. Artificial intelligence techniques can be applied on historical load data to forecast load consumption that can be used as pseudo measurements [27,28]. A standard load profile represent the power consumption behavior of a particular consumer category (e.g., residential, industrial, and commercial) [29]. The standard load profile can be used as a pseudo-measurement for that category of customers if their measurements cannot be obtained in near real-time or if we want to deliberately avoid their measurements to minimize communication overhead.
A Danish LV grid which has smart meters installed at all customer premises is chosen for the case studies conducted in this paper. The details of the LV grid, modeling, and simulation setup are provided in the below subsections.
4.1. Details of the LV Grid Used for Case Study
Figure 4 shows the schematic diagram of the LV distribution grid in Thisted, Denmark, which is used in this study. This LV grid consists of a secondary substation with 5 feeders. The main and the longest feeder, named Feeder 5, with 13 nodes can be seen in Figure 4, while the other four feeders are represented as a lump load at the secondary side of the 10/0.4 kV, 630 KVA substation transformer. Feeder 5 caters to 23 customers who belong to the categories of residential loads and non-residential loads such as a school, farm, pumping station, etc.
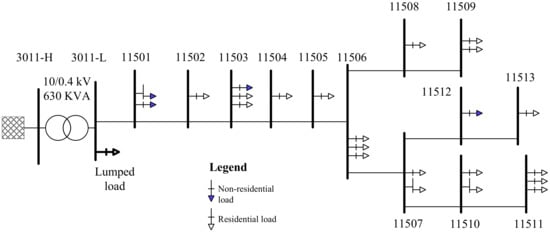
Figure 4.
Schematic diagram of a simplified radial LV feeder in Thisted, Denmark.
4.2. Grid Model for DSSE Simulations
The LV grid shown in Figure 4 is assumed to be balanced. This assumption is based on the analysis of one year data of node voltages. Phase voltage unbalance rates () were calculated and it was found that for more than of the time. Therefore, a single-phase equivalent model of the LV grid is considered in this paper. The parameters of the cables of the LV grid are provided in Table 2.
Table 2.
Cable parameters of the LV grid.
The cables from the substation to node 11503 are of type 1, while those from 11503 to 11509 are of type 2, and the remaining cables are of type 3. The average lengths of the type 1 cable is 0.057 km, type 2 cable is 0.08 km, and that of type 3 cable is 0.082 km. The cable parameters provided in Table 2 are obtained from the respective cable datasheets. There is an uncertainty in the cable parameters as the actual parameters may be different due to inaccuracy in the cable lengths, aging of cable, and so on. The private cables of the customers from each node to the respective load terminals are ignored in the grid model, which introduces additional errors. The data of these cables are generally not known to the DSOs as they are laid in the customer premises.
The cables may be represented using a lumped -model [30] as shown in Figure 5 which includes the cable shunt admittances. As seen from Table 2, the shunt admittances are so small that their inclusion in the grid model may not cause a significant error in the power flow calculations.
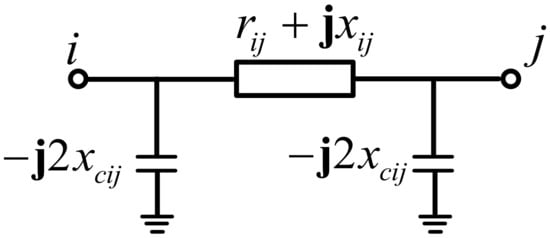
Figure 5.
Single-phase equivalent circuit diagram of the lumped -model of a cable between two nodes.
To verify the effect of shunt admittance parameter in the grid modeling, a load flow study was conducted using the Newton–Raphson method on the LV grid. A typical daily load profile of time-step 15 min is used for the study with and without the shunt admittance parameters. The results of the load flow and their comparison are shown in Figure 6. It can seen from Figure 6 that the inclusion of cable shunt admittance in the grid modeling has very less impact on the calculated node voltages.
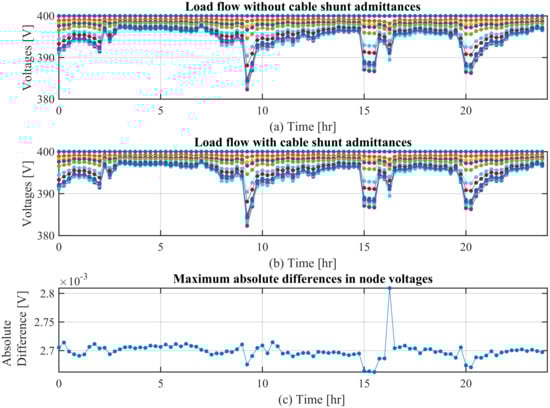
Figure 6.
Plot of node voltages obtained from load flow results (a) without including cable shunt admittances and (b) with cable shunt admittances.
Therefore, in this study the shunt admittances of the cables are ignored in the grid model.
4.3. Simulation Set-Up
The simulation set-up to numerically validate the DSSE algorithm involves the two steps shown in Figure 7. The first step that involves calculating the node voltages from smart meter power measurements and it is required in this work because the smart meters are not configured to measure voltages in the LV grid under study. If the node voltages are measured simultaneously with powers this step can be skipped.
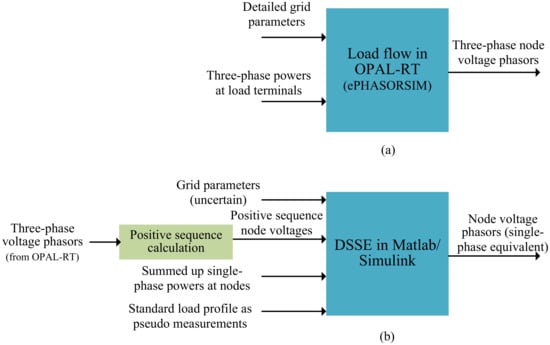
Figure 7.
(a) Offline simulation using smart meter data in OPAL-RT and (b) simulation of DSSE in Matlab/Simulink.
As mentioned above, in the first step, the true values of the system states (i.e., node voltages) are found from simulations using ePHASORsim module of OPAL-RT real-time simulator. A detailed three-phase circuit model that includes shunt admittances of the cables and private cables from the connection box to the point of connection of the customer loads is used in the ePHASORsim to perform load flow studies. Historical smart meter data of one year duration with 15 min time step measured on all three phases at all customer locations are fed as inputs for the load flow analysis. Load flow analysis was performed in offline mode to get the grid states, i.e., voltage magnitudes and phase angles at all three phases in the connection boxes, i.e., nodes. If there are two or more customers connected to the same node, the net active, and reactive power consumption are computed at each node. These values are assumed to be the true values for comparison with the results of the DSSE.
The grid model used in the DSSE algorithm is developed using the modeling approach described in Section 4.2. The positive sequence voltages at all nodes are calculated from the three-phase voltages which are compared with the estimated values from DSSE algorithm. The three-phase active and reactive powers at the connection boxes obtained from the OPAL-RT offline simulations are summed up and fed as single-phase equivalent power inputs to the DSSE algorithm.
A sensitivity analysis of the DSSE algorithm is done to study the impact of uncertainty on its estimation accuracy in the next section.
5. Sensitivity Analysis of DSSE
In this paper, the transformer tap settings and states of reactive power compensators such as capacitor banks are assumed to be known. Therefore, their influence on the accuracy of the DSSE algorithm are not evaluated. Performance of the DSSE algorithm is dependent on the type and accuracy of inputs and model parameters [16]. To assess the impact of inaccuracies in inputs and parameters on the DSSE, errors of known magnitudes are added to the measurements and line parameters.
Sensitivity analysis of the DSSE algorithm is carried out using the inputs that contain errors with respect to various uncertainties such as measurement errors, pseudo measurements and grid parameters in the next subsections. In order to quantify the accuracy of the DSSE, two metrics—percentage absolute error (PAE) and mean absolute error (MAE)—with the below expressions are used.
where is the time instant, is the true value of node voltage obtained from OPAL-RT offline simulation, and is the estimated voltage by DSSE algorithm from Matlab/Simulink simulation. It is to be noted that PAE is calculated using the results of DSSE at each time instant and at each node. On the other hand, MAE is calculated over a period N of the results of the DSSE for every node.
5.1. Sensitivity of DSSE to Measurementm Errors
Measurement devices such as smart meters do have some errors in their measurements. As per the European measurement instruments directive, the maximum permissible errors for electricity meters are and at the minimum and maximum current flows, respectively [31].
In this paper, a stochastic model of the measurement noise is employed by adding a Gaussian white noise with a standard deviation () of 0.01 to the smart meter energy measurements. The value corresponds to a maximum error of 0.03 pu in the magnitude of energy values.
DSSE algorithm is executed using the active and reactive power measurements from smart meters of the year 2018 with and without measurement errors and the PAE in estimated node voltages are calculated at each time step. Three test cases are conducted with no errors in power measurements, with Gaussian noise of and a fixed systematic error of pu. The last case is conducted to calculate the PAE of the DSSE algorithm if a hypothetical systematic error of pu magnitude is added to measurements. The results of all three cases are tabulated in Table 3. The probability of PAE to be equal to or higher than 0.5 pu and 1.0 pu are provided in the last two columns, respectively.
Table 3.
Performance of DSSE with measurement errors for the year 2018 data.
The above results show that the more noise present in measurements, the higher the errors in voltage estimation, though the increase in errors are not significant. It is to be noted that in Case 1, although there are no measurement errors, the PAE is above 2%. This is due many factors that are included in the DSSE algorithm such as simplified grid model based on single phase equivalent circuit, ignoring the private cables from node terminal to load connection point which contribute to the errors in voltages estimation.
Figure 8 shows the results of a simulation done with measurements made on 7 January 2018, the day which recorded the peak power consumption in the LV grid. A white Gaussian noise () was added to the measurement values for this simulation. It can be seen that the PAE is high when the power consumption is high. The maximum MAE for this day is calculated to be pu at node 11511.
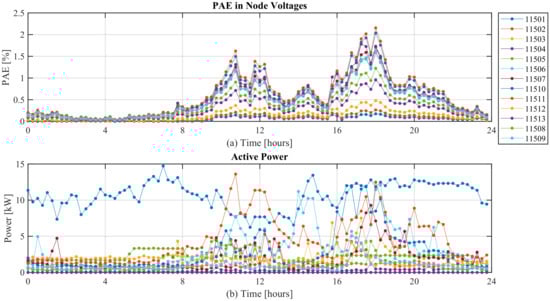
Figure 8.
Plot of DSSE simulation with measurement errors (a white Gaussian noise of ) using measurements recorded on 7 January 2018 (a) PAE in node voltages and (b) node active powers.
5.2. Sensitivity of DSSE to Pseudo Measurements
As pointed out in Section 3 and Section 4, not all smart meter measurements may be available to the DSSE for near-real-time monitoring. Therefore, pseudo-measurements will be used as a substitution for the load connection points from which near-real-time measurements are not available. Impact on the accuracy of the DSSE algorithm due to usage of pseudo-measurements has to be estimated.
In order to study the sensitivity of DSSE to pseudo measurements, it is assumed that measurements of all residential loads connected from node 11506 to 11513 (i.e., around 60% of loads in the LV grid shown in Figure 4) are pseudo-measurements to the DSSE. Standard load profile for the residential customers of the LV grid was obtained from the respective DSO. The typical active and reactive powers of the standard power profile of residential customers are shown in Figure 9.
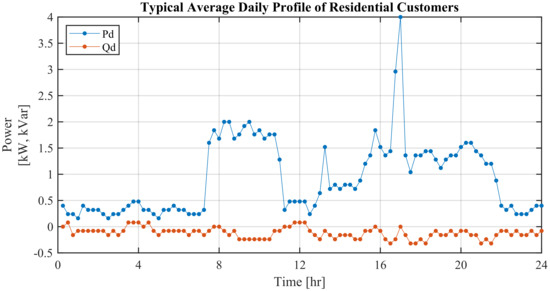
Figure 9.
Plot of standard power profiles of residential customers on a typical day.
In Figure 10, the results of the simulation with standard profile as pseudo measurements for the year 2018 is shown. The maximum PAE is increased from 2.09 pu (refer to the base case without pseudo-measurements in Section 5.1) to 7.9 pu with pseudo-measurements. Compared to the cases with measurement errors, pseudo-measurements affects the accuracy of DSSE to a larger extent.
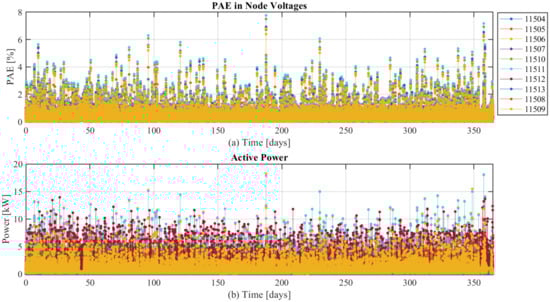
Figure 10.
Plot of percentage absolute error in node voltages estimation with standard load profile as pseudo-measurements.
5.3. Sensitivity of DSSE to Grid Parameters
The sensitivity of DSSE to variations in the line parameters (line resistances and reactances) are studied in this subsection. A simulation was done with uniform distribution of errors with a standard deviation pu which corresponds to a maximum variation of % in the line resistances and reactances. Another simulation with a 10% increase in line resistances and reactances was conducted. The results of both cases are compared with the base case (without errors) in Table 4.
Table 4.
Performance of DSSE with grid parameters for the year 2018 data.
Compared to the simulation case with pseudo-measurements, variations in grid parameters have less effect on the results of state estimation. However, the results show that DSSE algorithm is more sensitive to grid parameters than the measurement errors.
5.4. Sensitivity of DSSE to Multiple Uncertainties Including Pseudo-Measurements
In the previous subsections, simulations cases that assessed the performance of DSSE to individual uncertainty were presented. In reality, there could be several type of uncertainties impacting the accuracy of the DSSE algorithm simultaneously. Therefore, a simulation case is performed to study the combined effect of uncertainty in measurements and line parameters and pseudo-measurements on the accuracy of the DSSE algorithm. The results of this simulation plotted in Figure 11 show that the maximum PAE is around 8.3%.
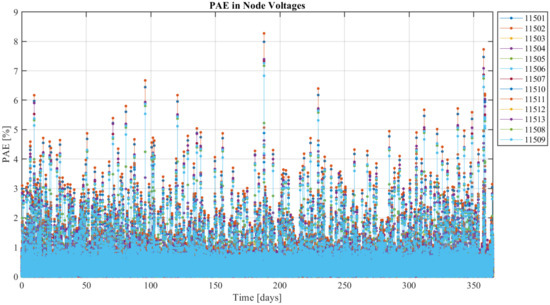
Figure 11.
Plot of PAE for the simulation of DSSE with multiple uncertainties.
For most of the voltage control applications, the above errors in voltage estimation are not acceptable. Moreover, the demand response programs that control the power consumption of flexible resources such as heat pumps and EVs are dependent on the highly accurate results of the state estimation as mentioned in [32]. The maximum voltage deviation allowed in distribution grids as per EN50160 standard [33] is %. If the voltage estimation error is higher (≥1%), the voltage control algorithms and demand response control may not function properly. The methods to improve the accuracy of the DSSE algorithm is investigated in the next subsection.
5.5. Improving Accuracy of the DSSE
Accuracy of the DSSE algorithm can be improved by having additional measurements which could be node voltages/currents or branch voltages/currents. Some possible ways of increasing the measurements as per the works in [34,35,36] are (i) installing RTUs/PMUs at nodes where smart meter measurements cannot be obtained in real-time, (ii) additional voltage and/or current measurements by smart meters along with active and reactive energy values, and (iii) generation of pseudo-measurements using more accurate methods instead of using standard power profiles.
As pointed out in [34], additional measurements in the form branch voltages or currents are not possible in LV grids as the cables are laid underground. Furthermore, installation of additional measurement devices (RTUs/PMUs) involves costs which the DSOs may not be able to afford. Smart meters can be configured to measure voltages or currents along with power measurements which involves no costs.
This paper proposes to measure voltages close to the far end nodes using the existing smart metering infrastructure and use them as additional inputs to the DSSE algorithm. Instead of currents, voltage measurements are preferred because of two reasons: (i) accuracy of current measurements highly depend on the sensors used and presence of harmonics may have an impact on the accuracy, and (ii) voltage measurements can be easily accommodated in the formulation of the nonlinear WLS method.
Simulation cases were conducted with voltage measurements at the end nodes 11509, 11511 and 11513 as additional inputs to the DSSE algorithm. A simulation case, assuming the standard deviation of the errors for the voltage measurements equal to that of the power measurements (i.e., pu), was performed. The value of is an important parameter as it acts as a weight to the objective function of the DSSE algorithm (please refer to Equation (3)). Although, the accuracy of the DSSE is improved from 8.32 % to 0.98%, a reasonable value should be chosen for . In general, the smart meters are more accurate in measuring voltages compared to the powers, therefore variances of errors in their measurements in Equation (3) should be considered lesser than that of the errors in power measurements. Due to above reason, another simulation case was done assuming the standard deviation of errors of the voltage measurements equal to 0.01 pu, the value that is used also in [16]. Figure 12 shows the PAE of the estimated node voltages for this case.
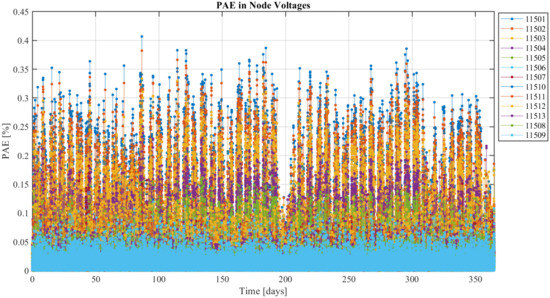
Figure 12.
Plot of PAE in estimated node voltages for the case with mixed errors and standard deviation of voltage measurements .
The numerical analysis of the above simulation cases are provided in Table 5. It is evident from the results that DSSE algorithm becomes more accurate with additional voltage measurements as inputs in spite of the errors in measurements and line parameters.
Table 5.
Evaluation of the DSSE algorithm with multiple uncertainties using the 2018 data.
6. Discussion
From the results of the sensitivity analysis of the DSSE algorithm conducted in this paper with respect to measurement errors, type and location of additional measurements, pseudo-measurements, and grid parameters, the following facts are revealed.
- Sensitiveness of DSSE to uncertainties in the order from high to low level can be stated as (1) location and type of measurements as inputs (e.g., voltage measurements at end nodes), (2) pseudo-measurements, (3) grid parameters, and (4) measurement errors in smart meters.
- Voltage measurements from selected few nodes (the end nodes of the feeder) as additional inputs are highly valuable to minimize the sensitivity of DSSE to multiple uncertainties.
In LV grids where smart meters are not installed on all customer premises, installation of RTUs or PMUs at key locations is recommended. The method used for generation of pseudo-measurements plays a critical role in the quality of the prediction and the accuracy of the DSSE. Short-term load forecasting using artificial intelligence techniques can be used for generating pseudo-measurements. In case of smart meter failures or constraints on communication network bandwidth, pseudo-measurements play an important role in LV grids to provide estimates of the missing measurements. Smart meters have the capability to detect voltage violation and send an alarm signal to the control center. This feature can be used to execute DSSE algorithm on ad hoc basis to estimate the voltage problems and take corrective actions.
Referring to Figure 1, if DSSE has to be implemented for near real-time monitoring application, the most suitable place will be at the data concentrator at the LV substation for the following reason. Smart meter data can be quickly communicated to the data concentrator than to the DSO’s control center and they can be immediately processed for near real-time estimation of node voltages (once in 15 min). The expected time delay for the data transfer from smart meters to the data concentrator is about 1–2 min. The execution time of the DSSE algorithm is negligible and it will be around few seconds. The above time delays are not considered in our work as the objective is to monitor the LV grids and the above time delays are not critical.
Implementation of the DSSE at data concentrators needs collaboration between DSOs who have the knowledge of the grid topology, customers and other related parameters and AMI providers who owns the communication infrastructure and access to smart meter measurements. DSSE can be gradually implemented starting with those substations facing challenges such as voltage unbalances or transformer overloading etc.
Some points for future exploration on this topic are as follows.
- The impact on the accuracy of DSSE algorithm due to significant errors in line parameters and grid topology.
- The performance of the DSSE algorithm with abnormal communication network conditions (such as failure of communication, delays in communication, cyber-attacks, etc.).
- The possibilities to use DSSE for asset management which includes power loss calculation, monitoring the loading of cables and transformers.
- The development of adapters responsible for accessing and collect required information from the existing databases and making it available for the DSO to implement many smart grid applications.
- The scalability and applicability of the DSSE algorithm to thousands of secondary substations.
7. Conclusions
In this paper, the possibility of using a DSSE algorithm with smart meter data for real-monitoring of LV grids is explored. It is pointed out that the existing AMI infrastructure based on the communication network may be a bottleneck for the above-mentioned application. The proposed DSSE algorithm takes smart meter measurements as inputs and makes use of a simplified single-phase model of the grid and the nonlinear weighted least squares method to compute the node voltages. Simulation studies of the DSSE algorithm using one year smart meter data are performed to evaluate the sensitiveness towards various types of uncertainties. Sensitivity analysis of the DSSE algorithm is done using the model of a small-scale Danish LV grid and it reveals that accuracy of the DSSE algorithm is affected to about 8.3% (worst case scenario) by the use of pseudo-measurements followed by uncertainty in line parameters and smart meter measurements. It is found that including voltage measurements from end nodes as inputs drastically improves the accuracy of the DSSE algorithm to about 0.5%.
From the practical deployment point of view, it is recommended to implement the DSSE algorithm in the data concentrator to get the measurements from smart meters which enables to monitor the node voltages close to real-time. Though the discussion in this paper is limited to using the DSSE for near real-time monitoring of LV grids, the estimated states can be used for control purposes (e.g., coordinated control of flexible resources and demand response). Future works include extending the DSSE algorithm for other smart grid applications such as demand response, automatic voltage regulation, asset management, etc.
Author Contributions
K.N., the main author of this article, prepared the draft. F.I., the co-author, has provided technical inputs, reviewed the draft and supervised the work. F.I. was also responsible for the administration and funding acquisition of the projects “RemoteGRID and Net2DG”. All authors have read and agreed to the published version of the manuscript.
Funding
This research was funded by the RemoteGRID project funded through ForskEL programme, grant no. 12399 and the Net2DG project European Union’s Horizon 2020 research and innovation programme under grant agreement no. 774145.
Acknowledgments
The authors would like to thank Rolf Kirk and Michael Lyhne from Thy-Mors Energi A/S, Denmark for providing smart meter data and the LV grid data for use in the study reported in this paper.
Conflicts of Interest
The authors declare no conflict of interest.
Abbreviations
The following abbreviations are used in this manuscript.
| DSO | Distribution system operator |
| DSSE | Distribution system state estimation |
| ICT | Information and communication technologies |
| MAE | Mean absolute error |
| PAE | Percentage absolute error |
| PMU | Phasor measurement unit |
| RTU | Remote terminal unit |
References
- McDonald, J. Adaptive intelligent power systems: Active distribution networks. Energy Policy 2008, 36, 4346–4351. [Google Scholar] [CrossRef]
- Ruben, S.; Iov, F.; Kemal, M.S.; Løvenstein Olsen, R. Observability of low voltage grids: Actual DSOs challenges and research questions. In Proceedings of the 2017 52nd International Universities Power Engineering Conference (UPEC), Heraklion, Greece, 28–31 August 2017. [Google Scholar]
- Olivier, F.; Aristidou, P.; Ernst, D.; Van Cutsem, T. Active Management of Low-Voltage Networks for Mitigating Overvoltages Due to Photovoltaic Units. IEEE Trans. Smart Grid 2016, 7, 926–936. [Google Scholar] [CrossRef]
- Pilo, F.; Silvestro, F.; Mauri, G.; Taylor, J.; Bak-Jensen, B.; Braun, M.; Kampf, E. Control and Automation Systems at the TSO-DSO interface: A survey on the actual functionalities and DSO requirements. In Proceedings of the Cigrè Symposium 2017, Dublin, Irland, 29 May–2 June 2017; CIGRE: Dublin, Ireland, 2017; pp. 1–10, CIGRE WG C6.25. [Google Scholar]
- Bollen, M.; Hassan, F. Integration of Distributed Generation in the Power System; John Wiley & Sons: Hoboken, NJ, USA, 2011. [Google Scholar]
- Martinenas, S.; Knezovic, K.; Marinelli, M. Management of Power Quality Issues in Low Voltage Networks using Electric Vehicles: Experimental Validation. IEEE Trans. Power Deliv. 2016, 32, 971–979. [Google Scholar] [CrossRef]
- Ahmad, F.; Rasool, A.; Ozsoy, E.; Sekar, R.; Sabanovic, A.; Elitaş, M. Distribution system state estimation—A step towards smart grid. Renew. Sustain. Energy Rev. 2018, 81, 2659–2671. [Google Scholar] [CrossRef]
- Kemal, M.S.; Olsen, R.L.; Schwefel, H.P. Optimized scheduling of smart meter data access for real-time voltage quality monitoring. In Proceedings of the 2018 IEEE International Conference on Communications (ICC), Kansas City, MO, USA, 20–24 May 2018. [Google Scholar]
- Kemal, M.S.; Ruben, S.; Olsen, R.L.; Iov, F.; Schwefel, H.P. On the trade-off between timeliness and accuracy for low voltage distribution system grid monitoring utilizing smart meter data. Int. J. Electr. Power Energy Syst. 2020, 121, 106090. [Google Scholar] [CrossRef]
- Abdel-Majeed, A.; Braun, M. Low voltage system state estimation using smart meters. In Proceedings of the 2012 47th International Universities Power Engineering Conference (UPEC), London, UK, 4–7 September 2012; pp. 1–6. [Google Scholar]
- Pau, M.; Patti, E.; Barbierato, L.; Estebsari, A.; Pons, E.; Ponci, F.; Monti, A. Low voltage system state estimation based on smart metering infrastructure. In Proceedings of the 2016 IEEE International Workshop on Applied Measurements for Power Systems (AMPS), Aachen, Germany, 28–30 September 2016; pp. 1–6. [Google Scholar]
- Primadianto, A.; Lu, C.N. A review on distribution system state estimation. IEEE Trans. Power Syst. 2017, 32, 3875–3883. [Google Scholar] [CrossRef]
- Dehghanpour, K.; Wang, Z.; Wang, J.; Yuan, Y.; Bu, F. A survey on state estimation techniques and challenges in smart distribution systems. IEEE Trans. Smart Grid 2019, 10, 2312–2322. [Google Scholar] [CrossRef]
- Wang, G.; Giannakis, G.B.; Chen, J.; Sun, J. Distribution system state estimation: An overview. Front. Inf. Technol. Electron. 2019, 20, 4–17. [Google Scholar] [CrossRef]
- Mínguez, R.; Conejo, A.J. State estimation sensitivity analysis. IEEE Trans. Power Syst. 2007, 22, 1080–1091. [Google Scholar] [CrossRef]
- Molin, A.; Sandberg, H.; Johansson, M. A study on the sensitivity matrix in power system state estimation by using sparse principal component analysis. In Proceedings of the 2016 IEEE 55th Conference on Decision and Control (CDC), Las Vegas, NV, USA, 12–14 December 2016. [Google Scholar]
- Kemal, M.S.; Olsen, R.L.; Schwefel, H.P. Optimized scheduling of smart meter data access: A parametric study. In Proceedings of the 2018 IEEE International Conference on Communications, Control, and Computing Technologies for Smart Grids (SmartGridComm), Aalborg, Denmark, 29–31 October 2018. [Google Scholar]
- Prostejovsky, A.M.; Member, G.S.; Gehrke, O.; Kosek, A.M.; Strasser, T.; Member, S.; Bindner, H.W. Distribution line parameter estimation under consideration of measurement tolerances. IEEE Trans. Ind. Inform. 2016, 12, 726–735. [Google Scholar] [CrossRef]
- Baran, M.E.; Kelley, A.W. A branch-current based state estimation method for distribution systems. IEEE Trans. Power Syst. 1995, 10, 483–491. [Google Scholar] [CrossRef]
- Baran, M.E.; Kelley, A.W. State estimation for real-time monitoring of distribution systems. IEEE Trans. Power Syst. 1994, 9, 1601–1609. [Google Scholar] [CrossRef]
- Huang, M.; Wei, Z.; Zhao, J.; Jabr, R.A.; Pau, M.; Sun, G. Robust Ensemble Kalman Filter for Medium-Voltage Distribution System State Estimation. IEEE Trans. Instrum. Meas. 2020, 69, 4114–4124. [Google Scholar] [CrossRef]
- Ranković, A.; Maksimović, B.M.; Sarić, A.T. A three-phase state estimation in active distribution networks. Int. J. Electr. Power Energy Syst. 2014, 54, 154–162. [Google Scholar] [CrossRef]
- Soares, T.M.; Bezerra, U.H.; De Lima Tostes, M.E. Full-observable three-phase state estimation algorithm applied to electric distribution grids. Energies 2019, 12, 1327. [Google Scholar] [CrossRef]
- Popović, D.S.; Varga, E.; Perlić, Z. Extension of the common information model with a catalog of topologies. IEEE Trans. Power Syst. 2007, 22, 770–777. [Google Scholar] [CrossRef]
- Hernandez, C.; Maya-Ortiz, P. Comparison between WLS and Kalman Filter method for power system static state estimation. In Proceedings of the 2015 International Symposium on Smart Electric Distribution Systems and Technologies (EDST), Vienna, Austria, 8–11 September 2015; pp. 47–52. [Google Scholar] [CrossRef]
- Bertsekas, D.P.; Hager, W.; Mangasarian, O. Nonlinear programming; Athena Scientific: Belmont, MA, USA, 1998. [Google Scholar]
- Hippert, H.; Pedreira, C.; Souza, R. Neural networks for short-term load forecasting: A review and evaluation. IEEE Trans. Power Syst. 2001, 16, 44–55. [Google Scholar] [CrossRef]
- Quan, H.; Srinivasan, D.; Khosravi, A. Short-term load and wind power forecasting using neural network-based prediction intervals. IEEE Trans. Neural Networks Learn. Syst. 2014, 25, 303–315. [Google Scholar] [CrossRef] [PubMed]
- Scholz, D.; Musgens, F. How to improve standard load profiles: Updating, regionalization and smart meter data. In Proceedings of the 2017 14th International Conference on the European Energy Market (EEM), Dresden, Germany, 6–9 June 2017; pp. 1–5. [Google Scholar] [CrossRef]
- Kersting, W.H. Distribution System Modeling and Analysis; CRC Press: Boca Raton, FL, USA, 2012; p. 455. [Google Scholar]
- Cetina, R.Q.; Roscoe, A.J.; Wright, P.S. A review of electrical metering accuracy standards in the context of dynamic power quality conditions of the grid. In Proceedings of the 2017 52nd International Universities Power Engineering Conference (UPEC), Heraklion, Greece, 28–31 August 2017; pp. 1–5. [Google Scholar]
- Nainar, K.; Pillai, J.R.; Bak-Jensen, B.; Simpson-Porco, J.W. Predictive control of flexible resources for demand response in active distribution networks. IEEE Trans. Power Syst. 2019, 34, 2957–2969. [Google Scholar] [CrossRef]
- De Tandt, B. Voltage Characteristics of Electricity Supplied by Public Distribution Systems; EN50160; Cenelec: Brussels, Belgium, 1999. [Google Scholar]
- Waeresch, D.; Brandalik, R.; Wellssow, W.H.; Jordan, J.; Bischler, R.; Schneider, N. Linear state estimation in low voltage grids based on smart meter data. In Proceedings of the 2015 IEEE Eindhoven PowerTech, PowerTech 2015, Eindhoven, The Netherlands, 29 June–2 July 2015; pp. 1–6. [Google Scholar]
- Jovicic, A.; Jereminov, M.; Pileggi, L.; Hug, G. A Linear Formulation for Power System State Estimation including RTU and PMU Measurements. In Proceedings of the 2019 IEEE PES Innovative Smart Grid Technologies Europe (ISGT-Europe), Bucharest, Romania, 29 September–2 October 2019; pp. 1–5. [Google Scholar] [CrossRef]
- Teixeira, H.; Pereira Barbeiro, P.; Pereira, J.; Bessa, R.; Matos, P.; Lemos, D.; Morais, A.; Mathieu, C.; Sebastian-Viana, M. A state estimator for LV networks: Results from the EVOLVDSO project. In Proceedings of the CIRED Workshop 2016, Helsinki, Finland, 14–15 June 2016; pp. 1–4. [Google Scholar]
Publisher’s Note: MDPI stays neutral with regard to jurisdictional claims in published maps and institutional affiliations. |
© 2020 by the authors. Licensee MDPI, Basel, Switzerland. This article is an open access article distributed under the terms and conditions of the Creative Commons Attribution (CC BY) license (http://creativecommons.org/licenses/by/4.0/).