A Novel Data-Driven Method to Estimate Methane Adsorption Isotherm on Coals Using the Gradient Boosting Decision Tree: A Case Study in the Qinshui Basin, China

 ,
,
Abstract
1. Introduction
2. Materials and Methods
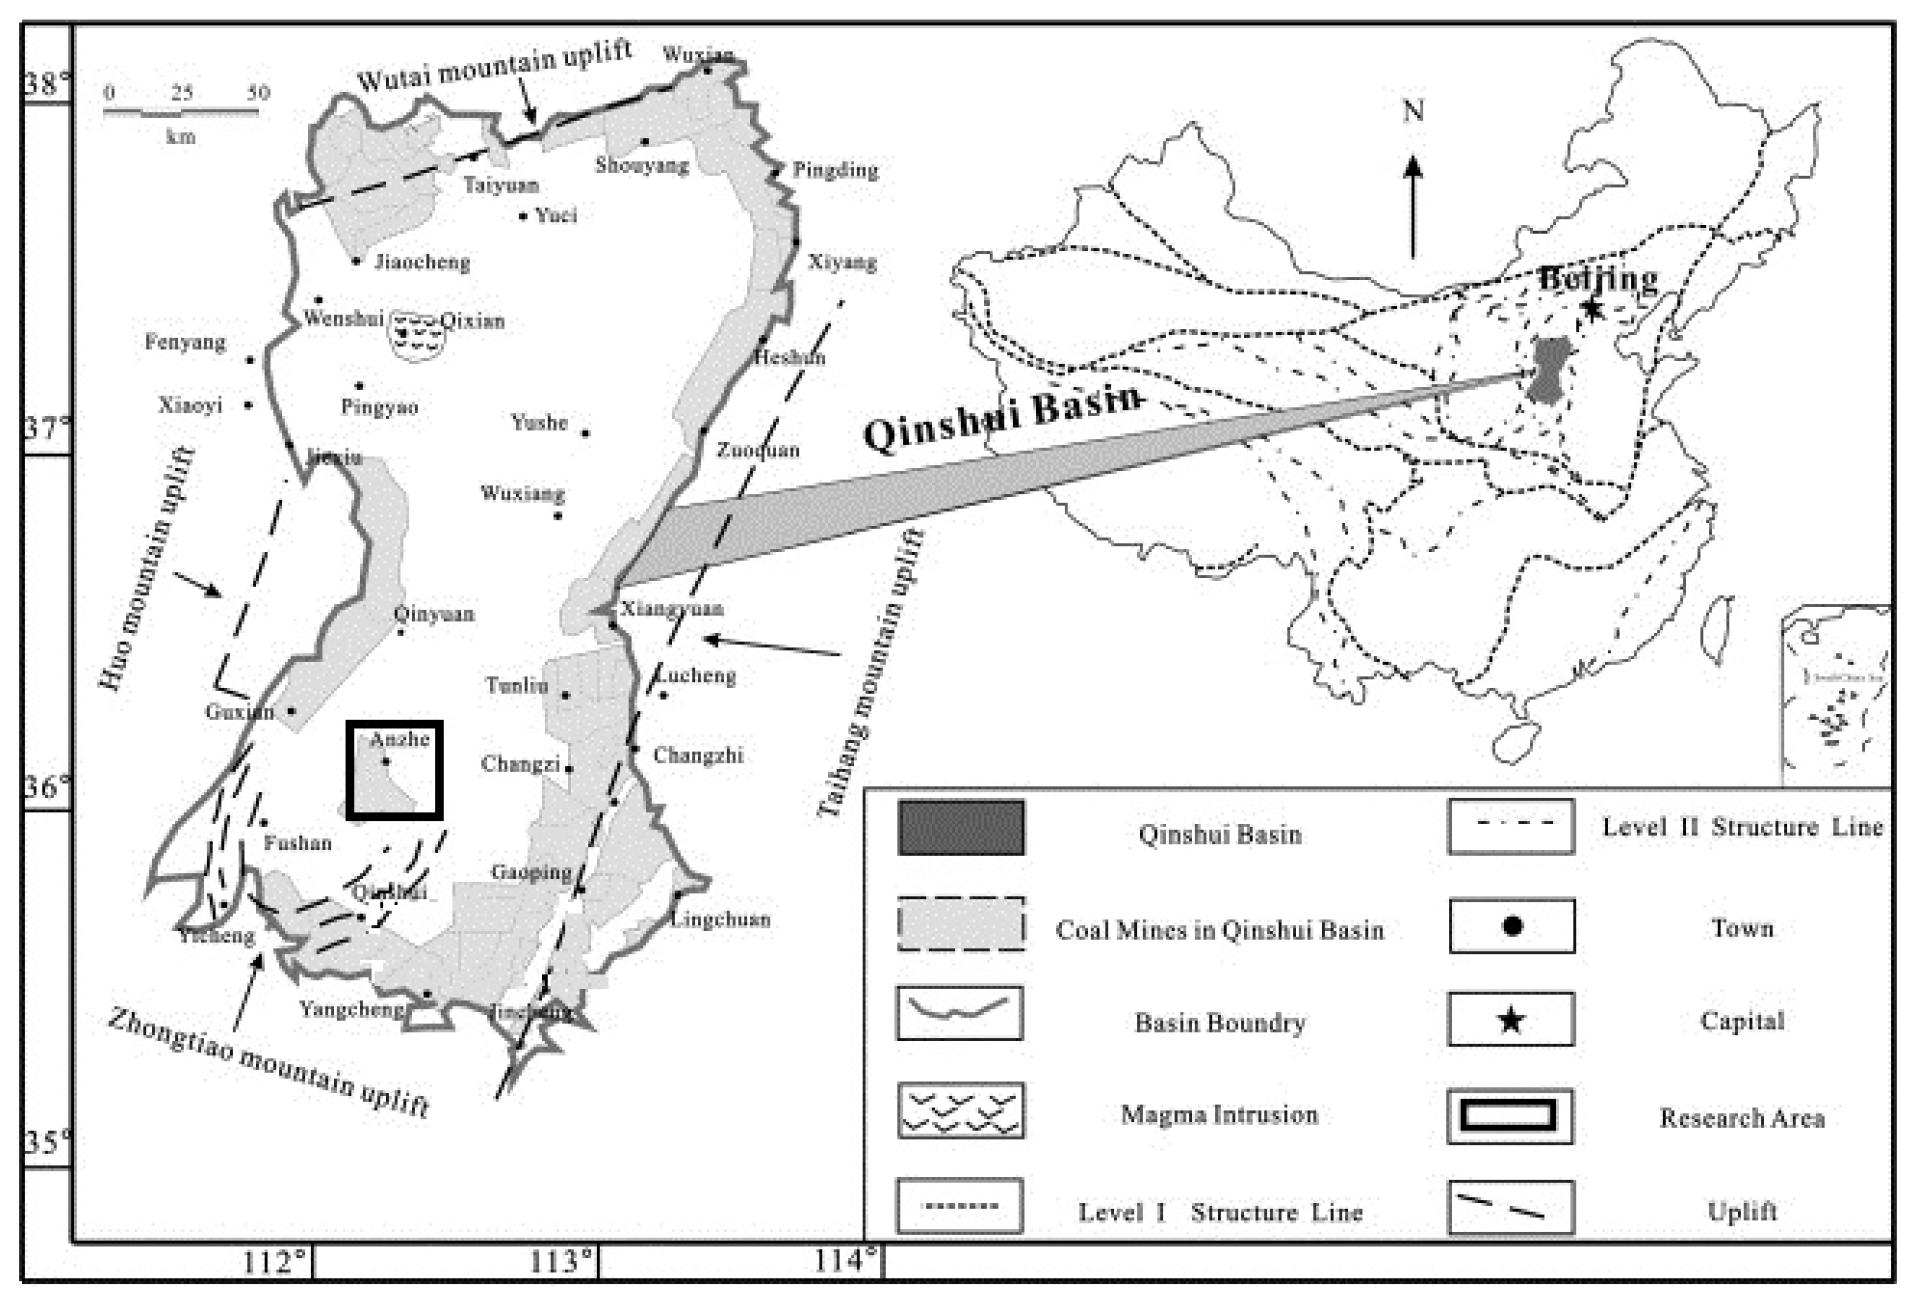
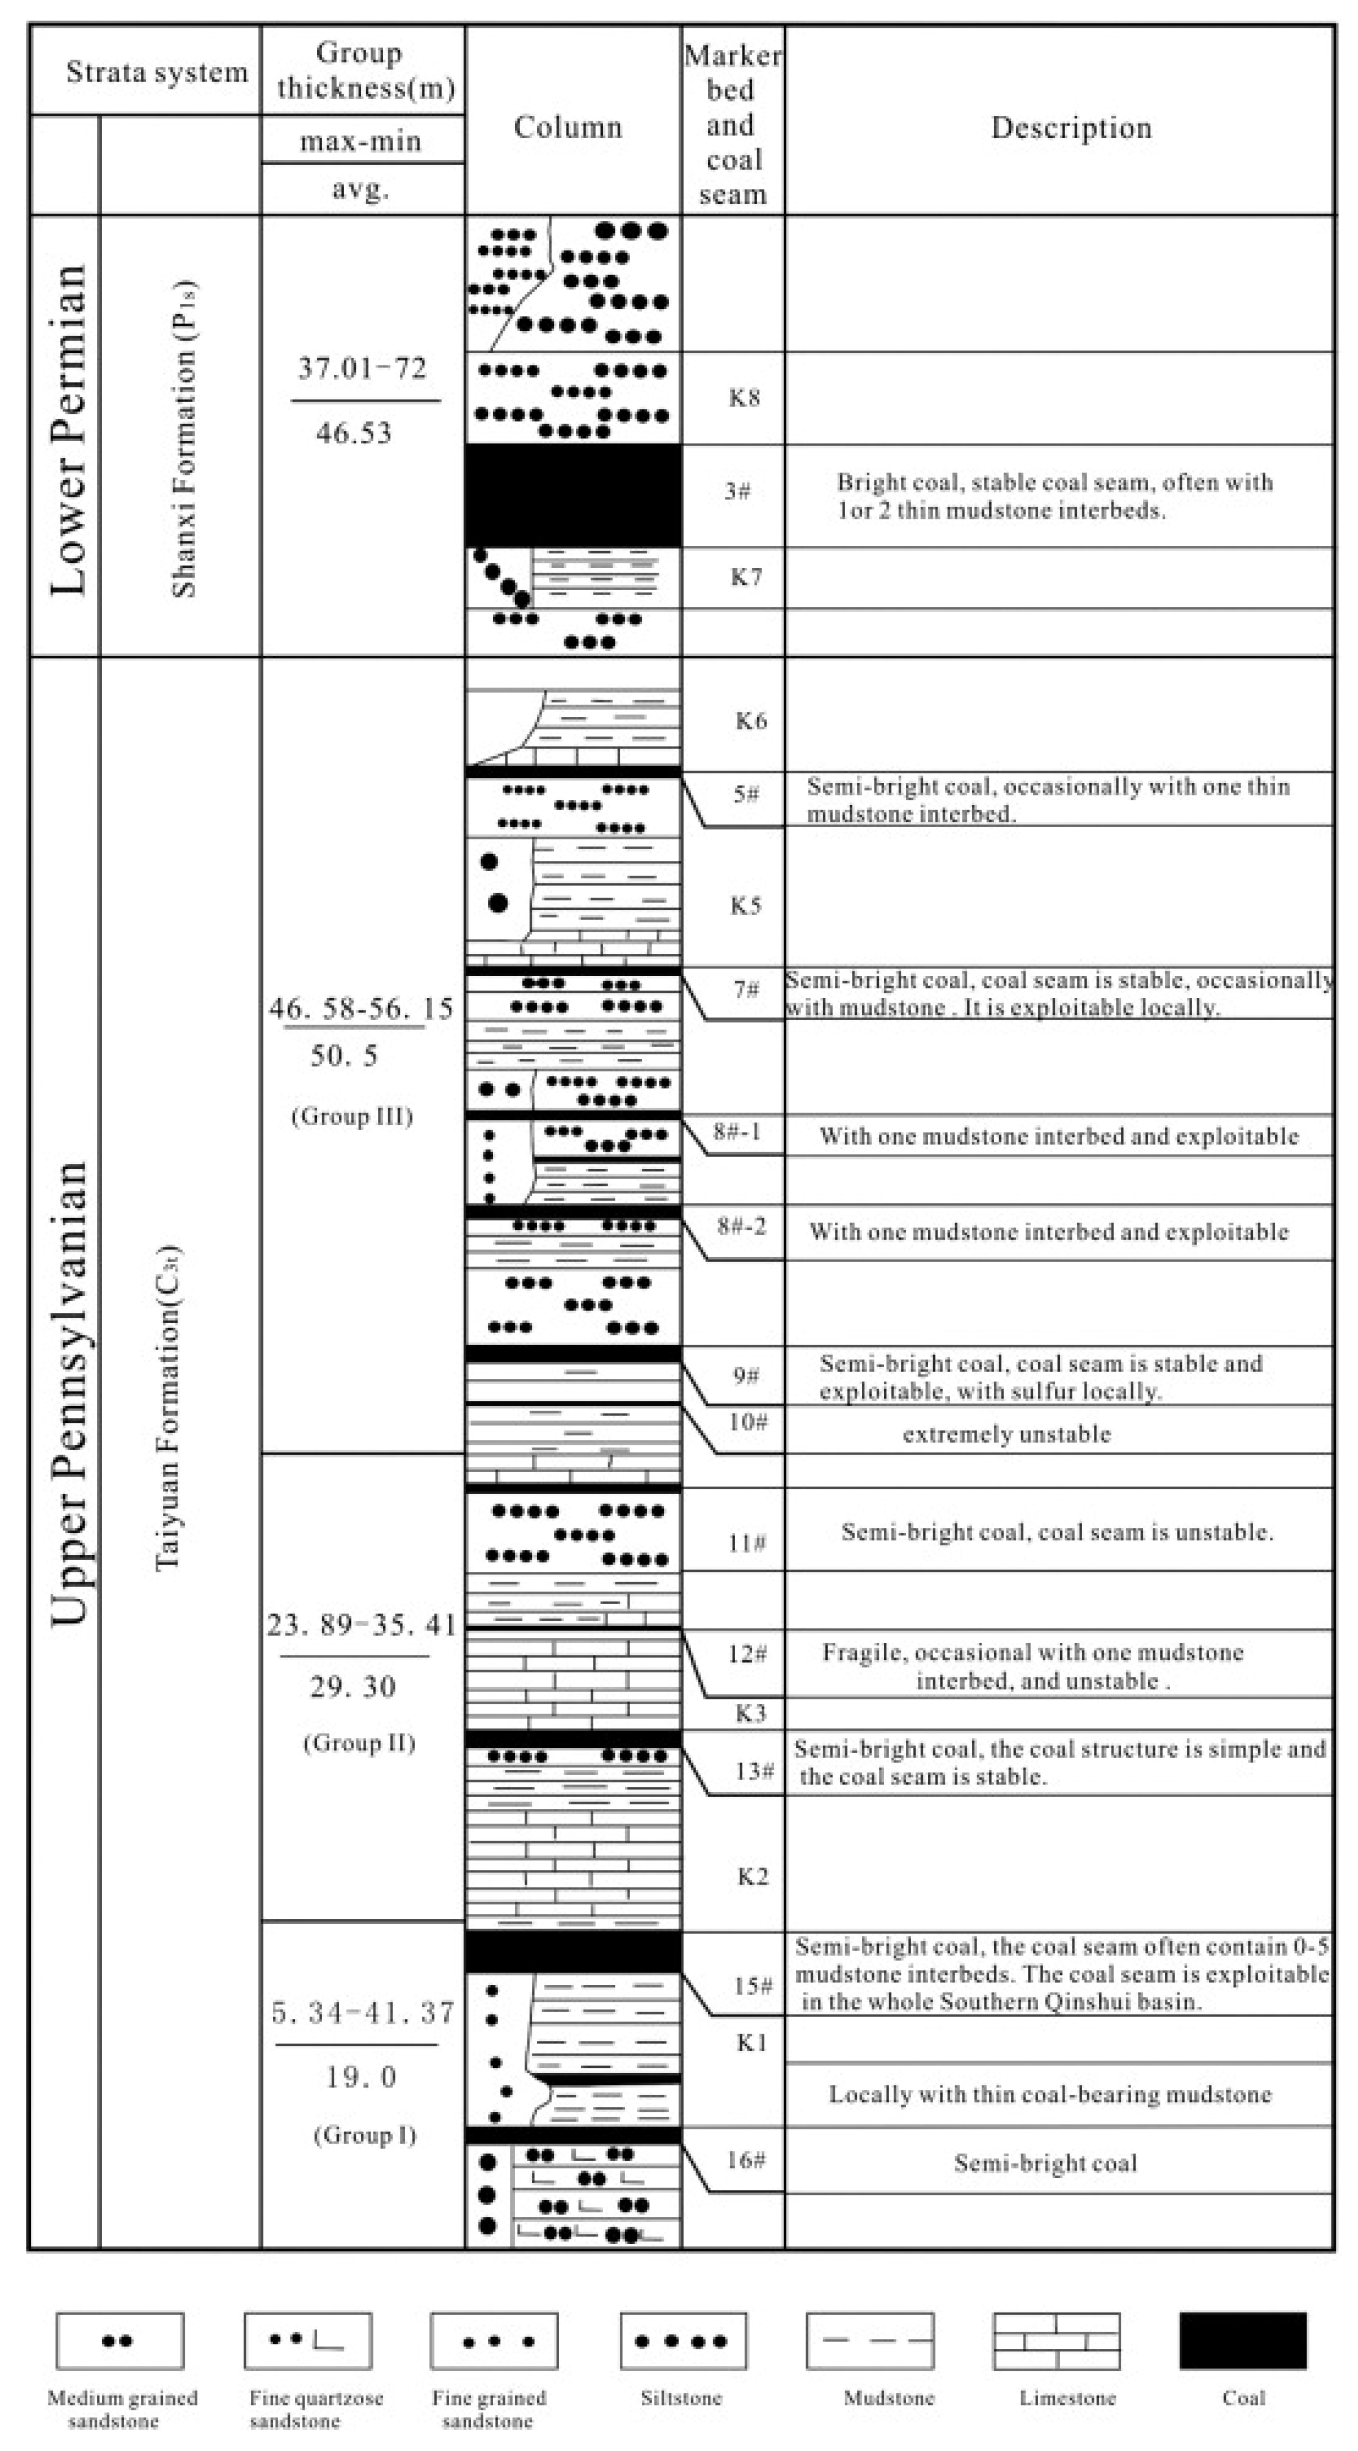
2.1. Geological Background of the Study Area
2.2. Samples and Experiments
2.3. Basics of GBDT
2.4. Construction of the GBDT Estimation Model
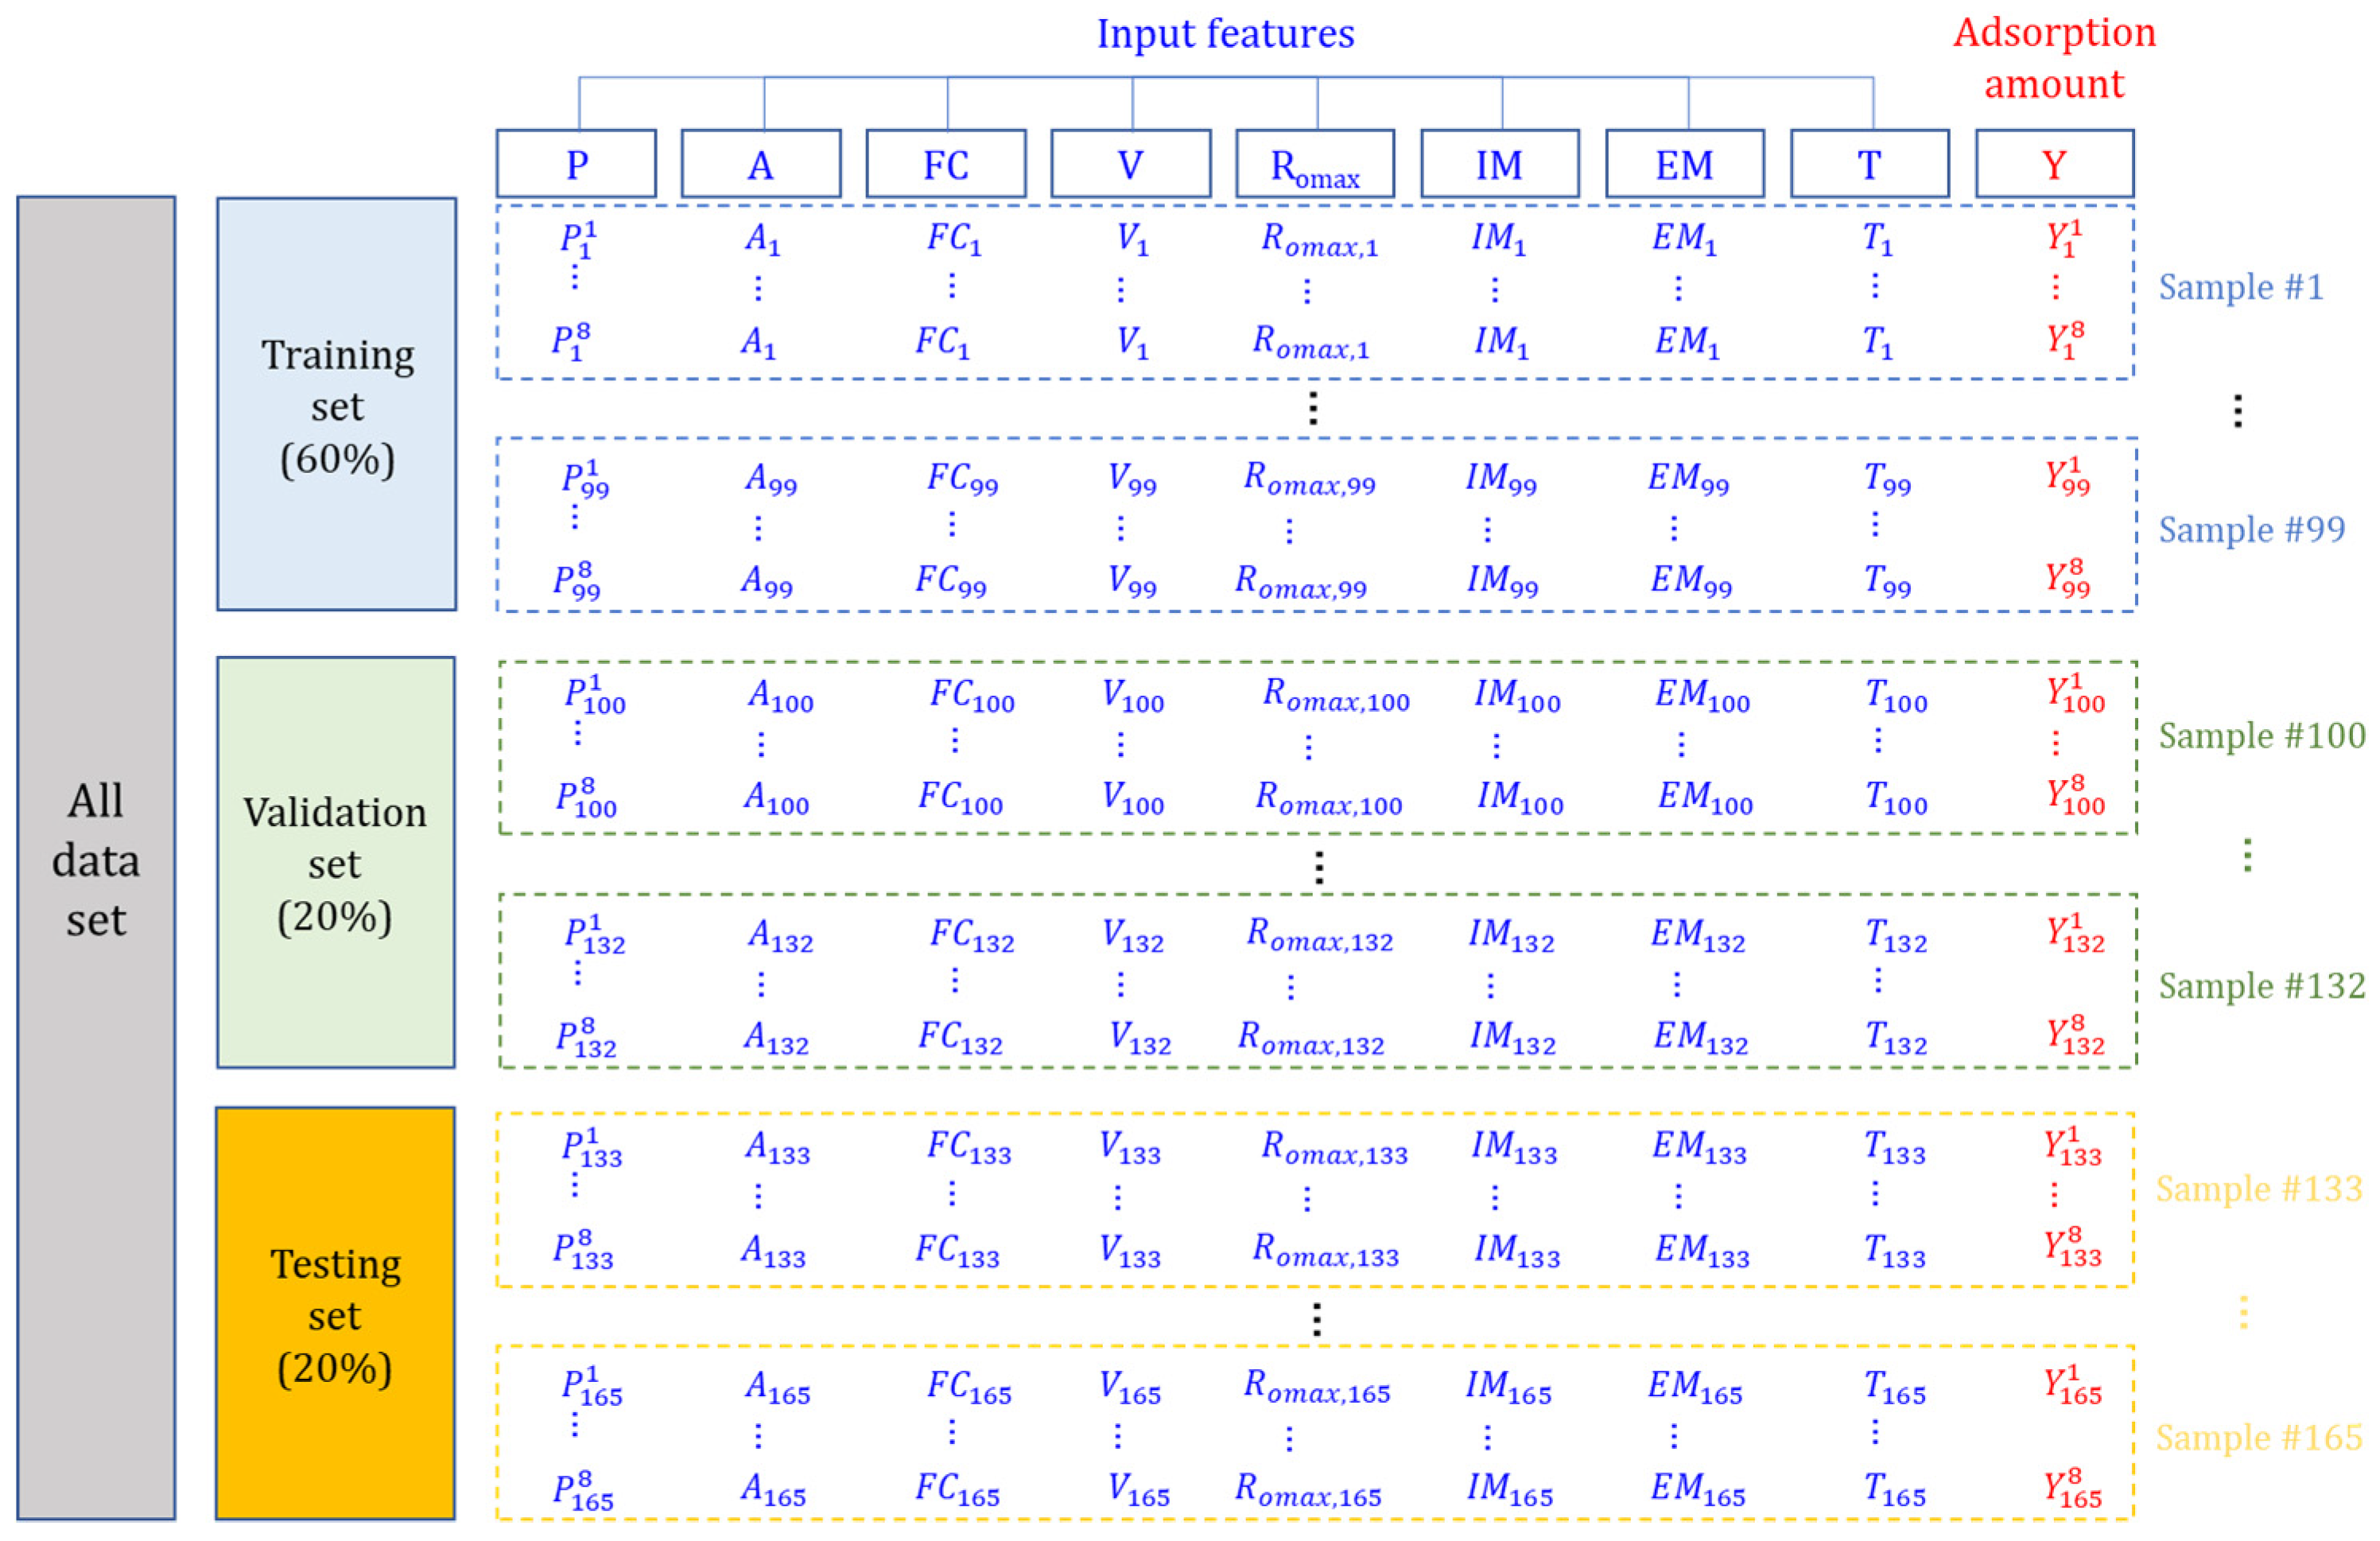
2.4.1. Input Features
2.4.2. Determination of Optimal GBDT Hyperparameters
2.4.3. Evaluation Matrices
2.5. Comparison with BP-ANN and SVM
3. Results
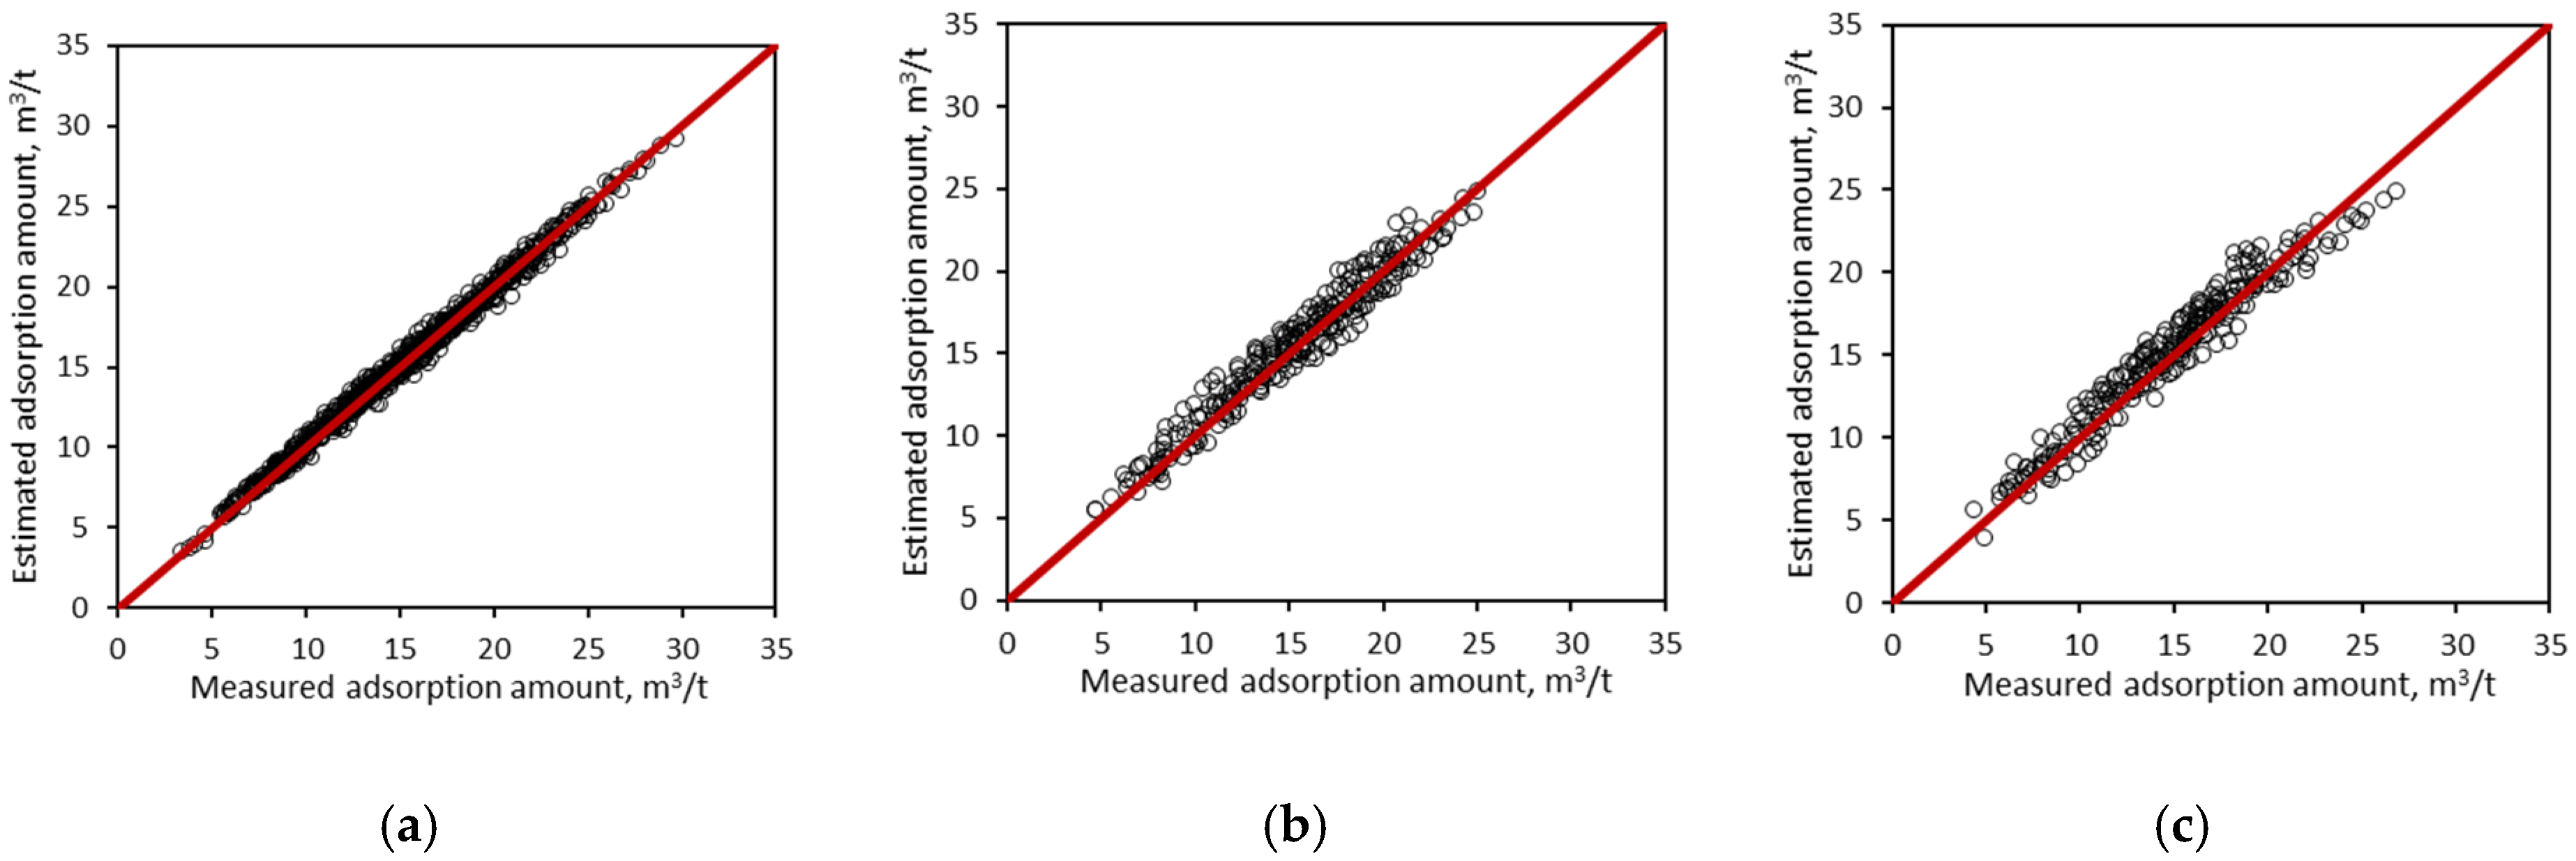
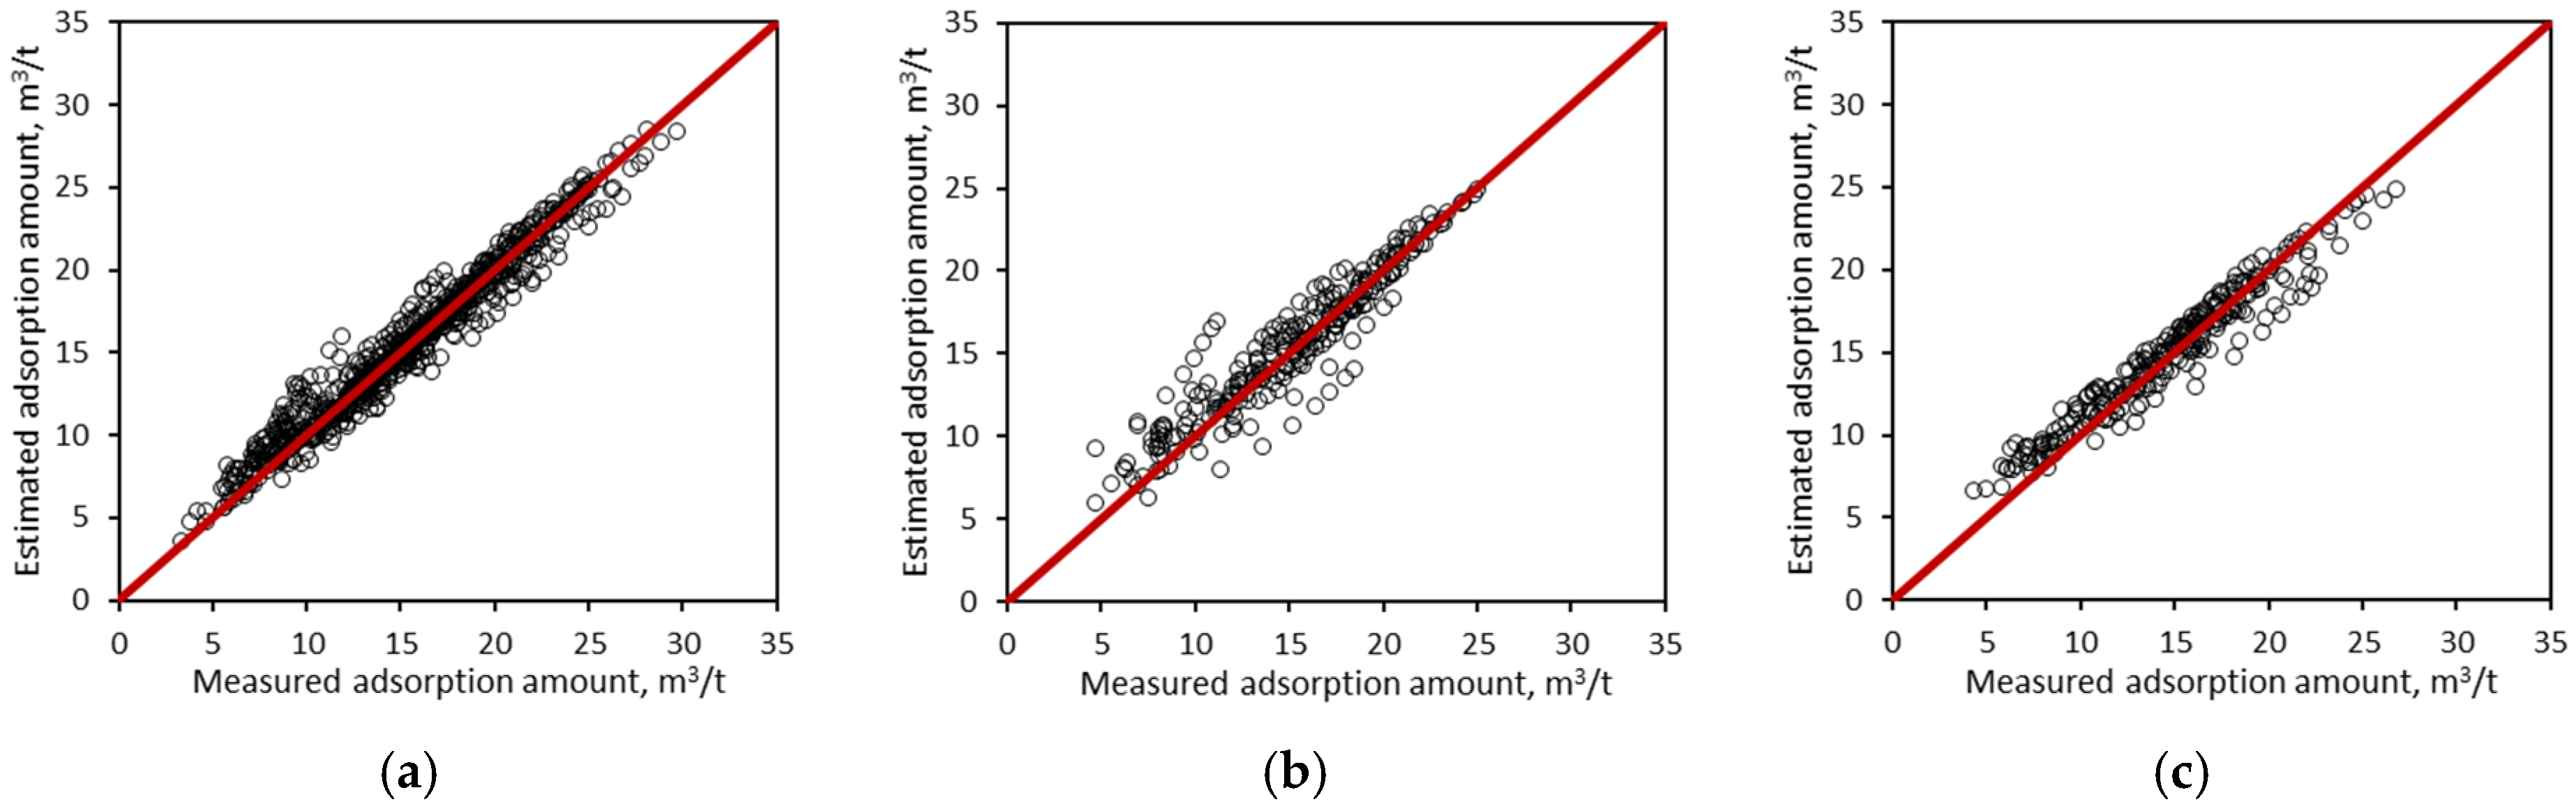
3.1. Performance of the GBDT Estimation Model
3.2. Comparison with BP-ANN and SVM
4. Discussion
4.1. Analyses of Effects of Input Features on Adsorption Isotherms
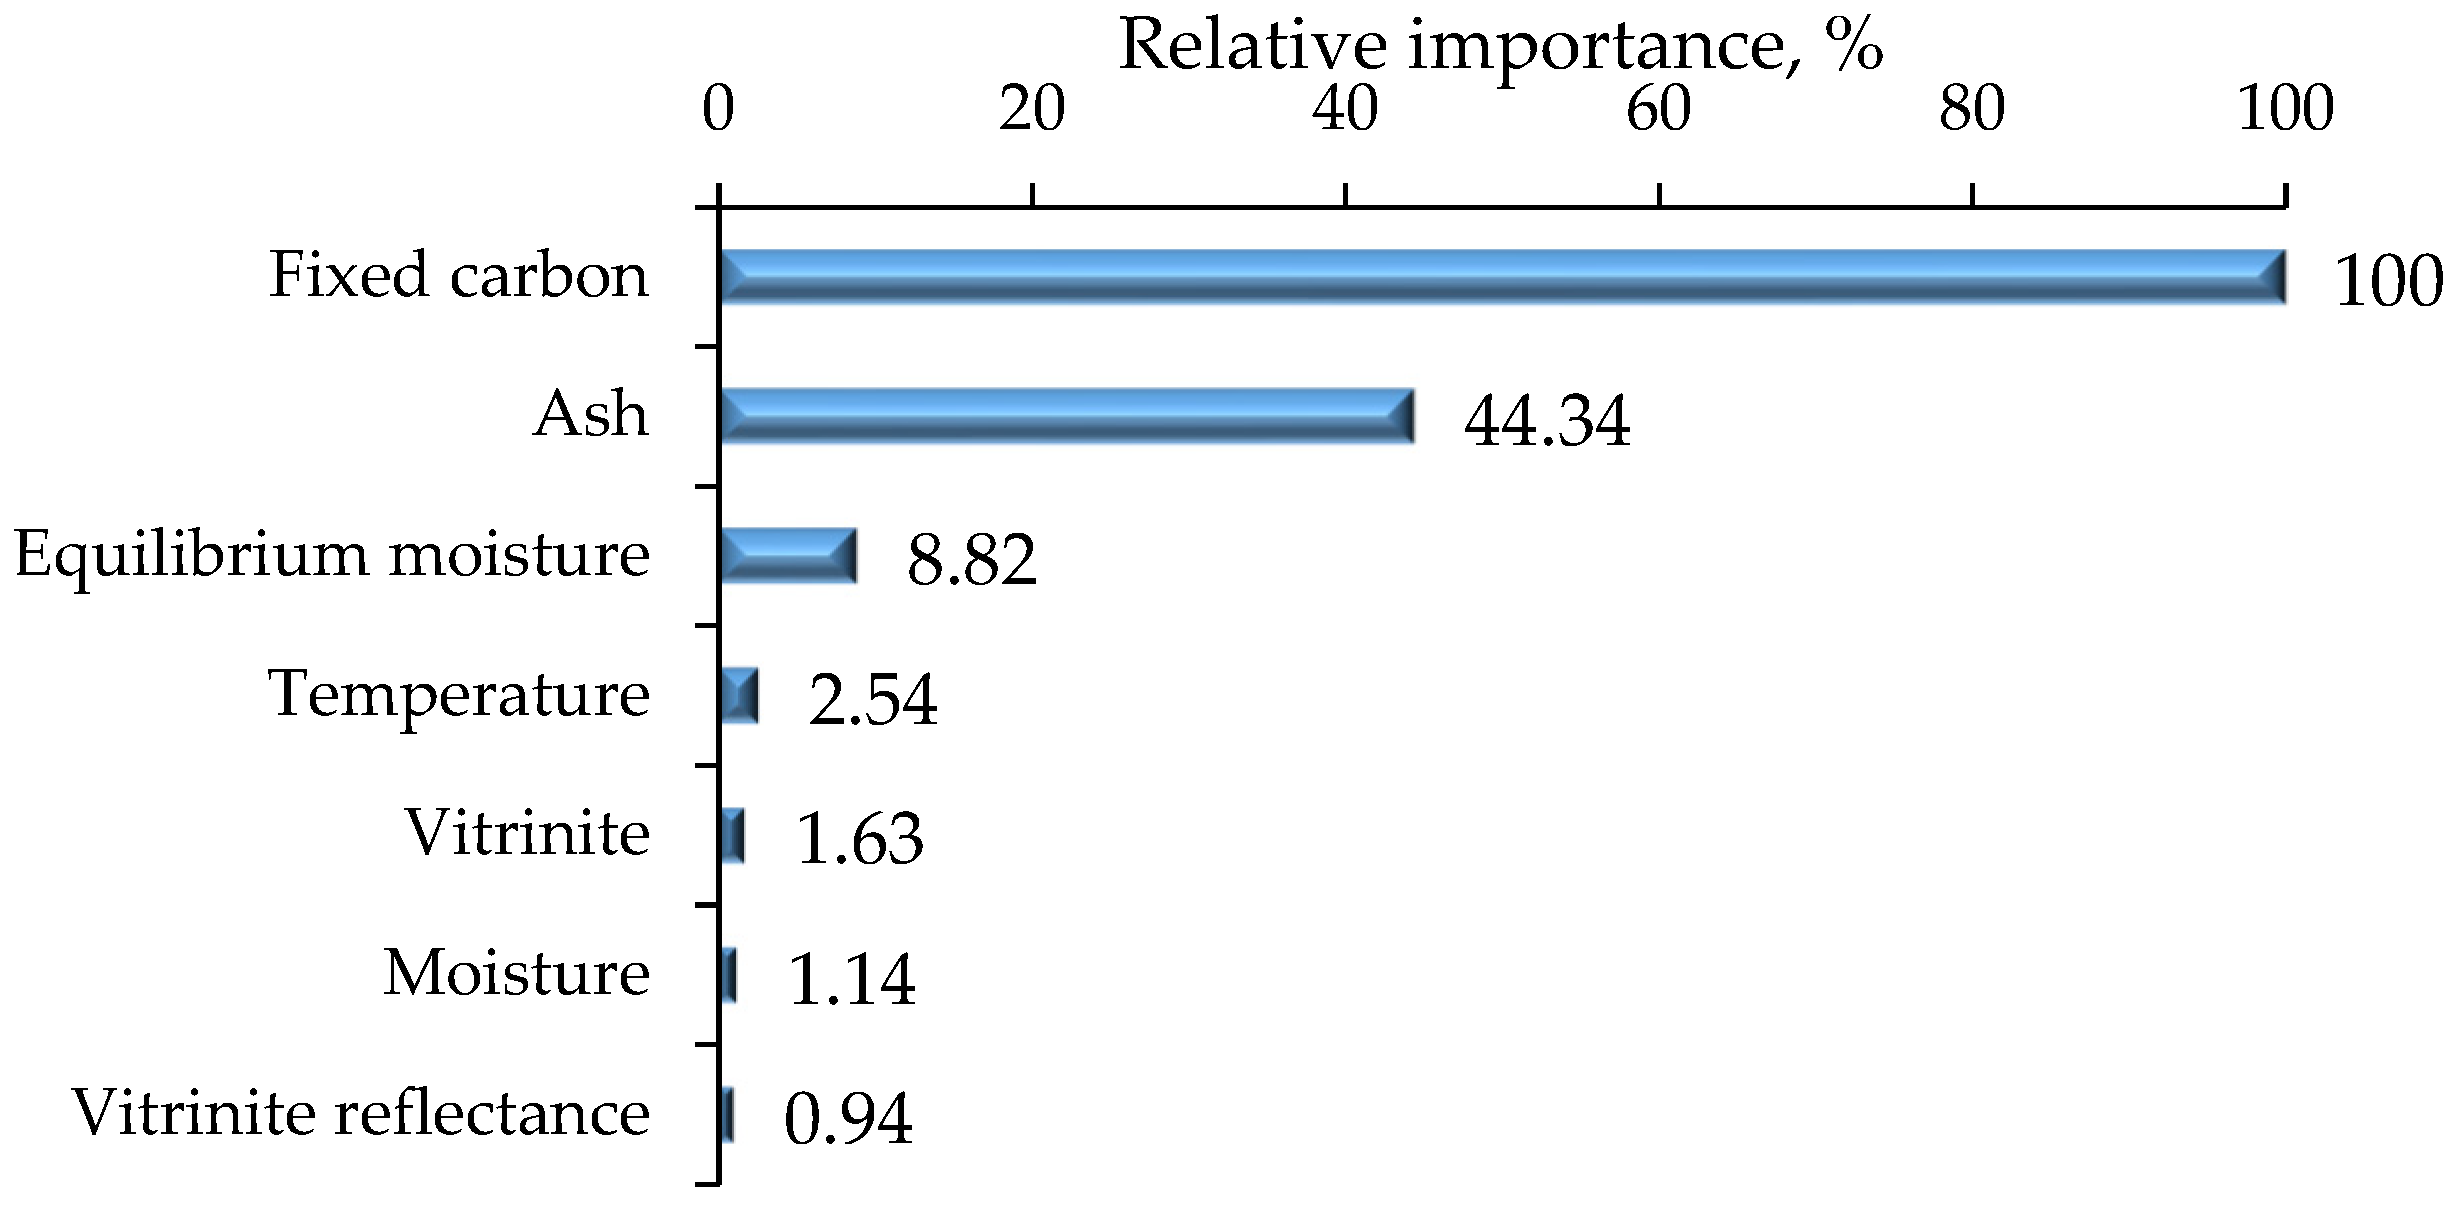
4.1.1. Relative Importance of Input Features
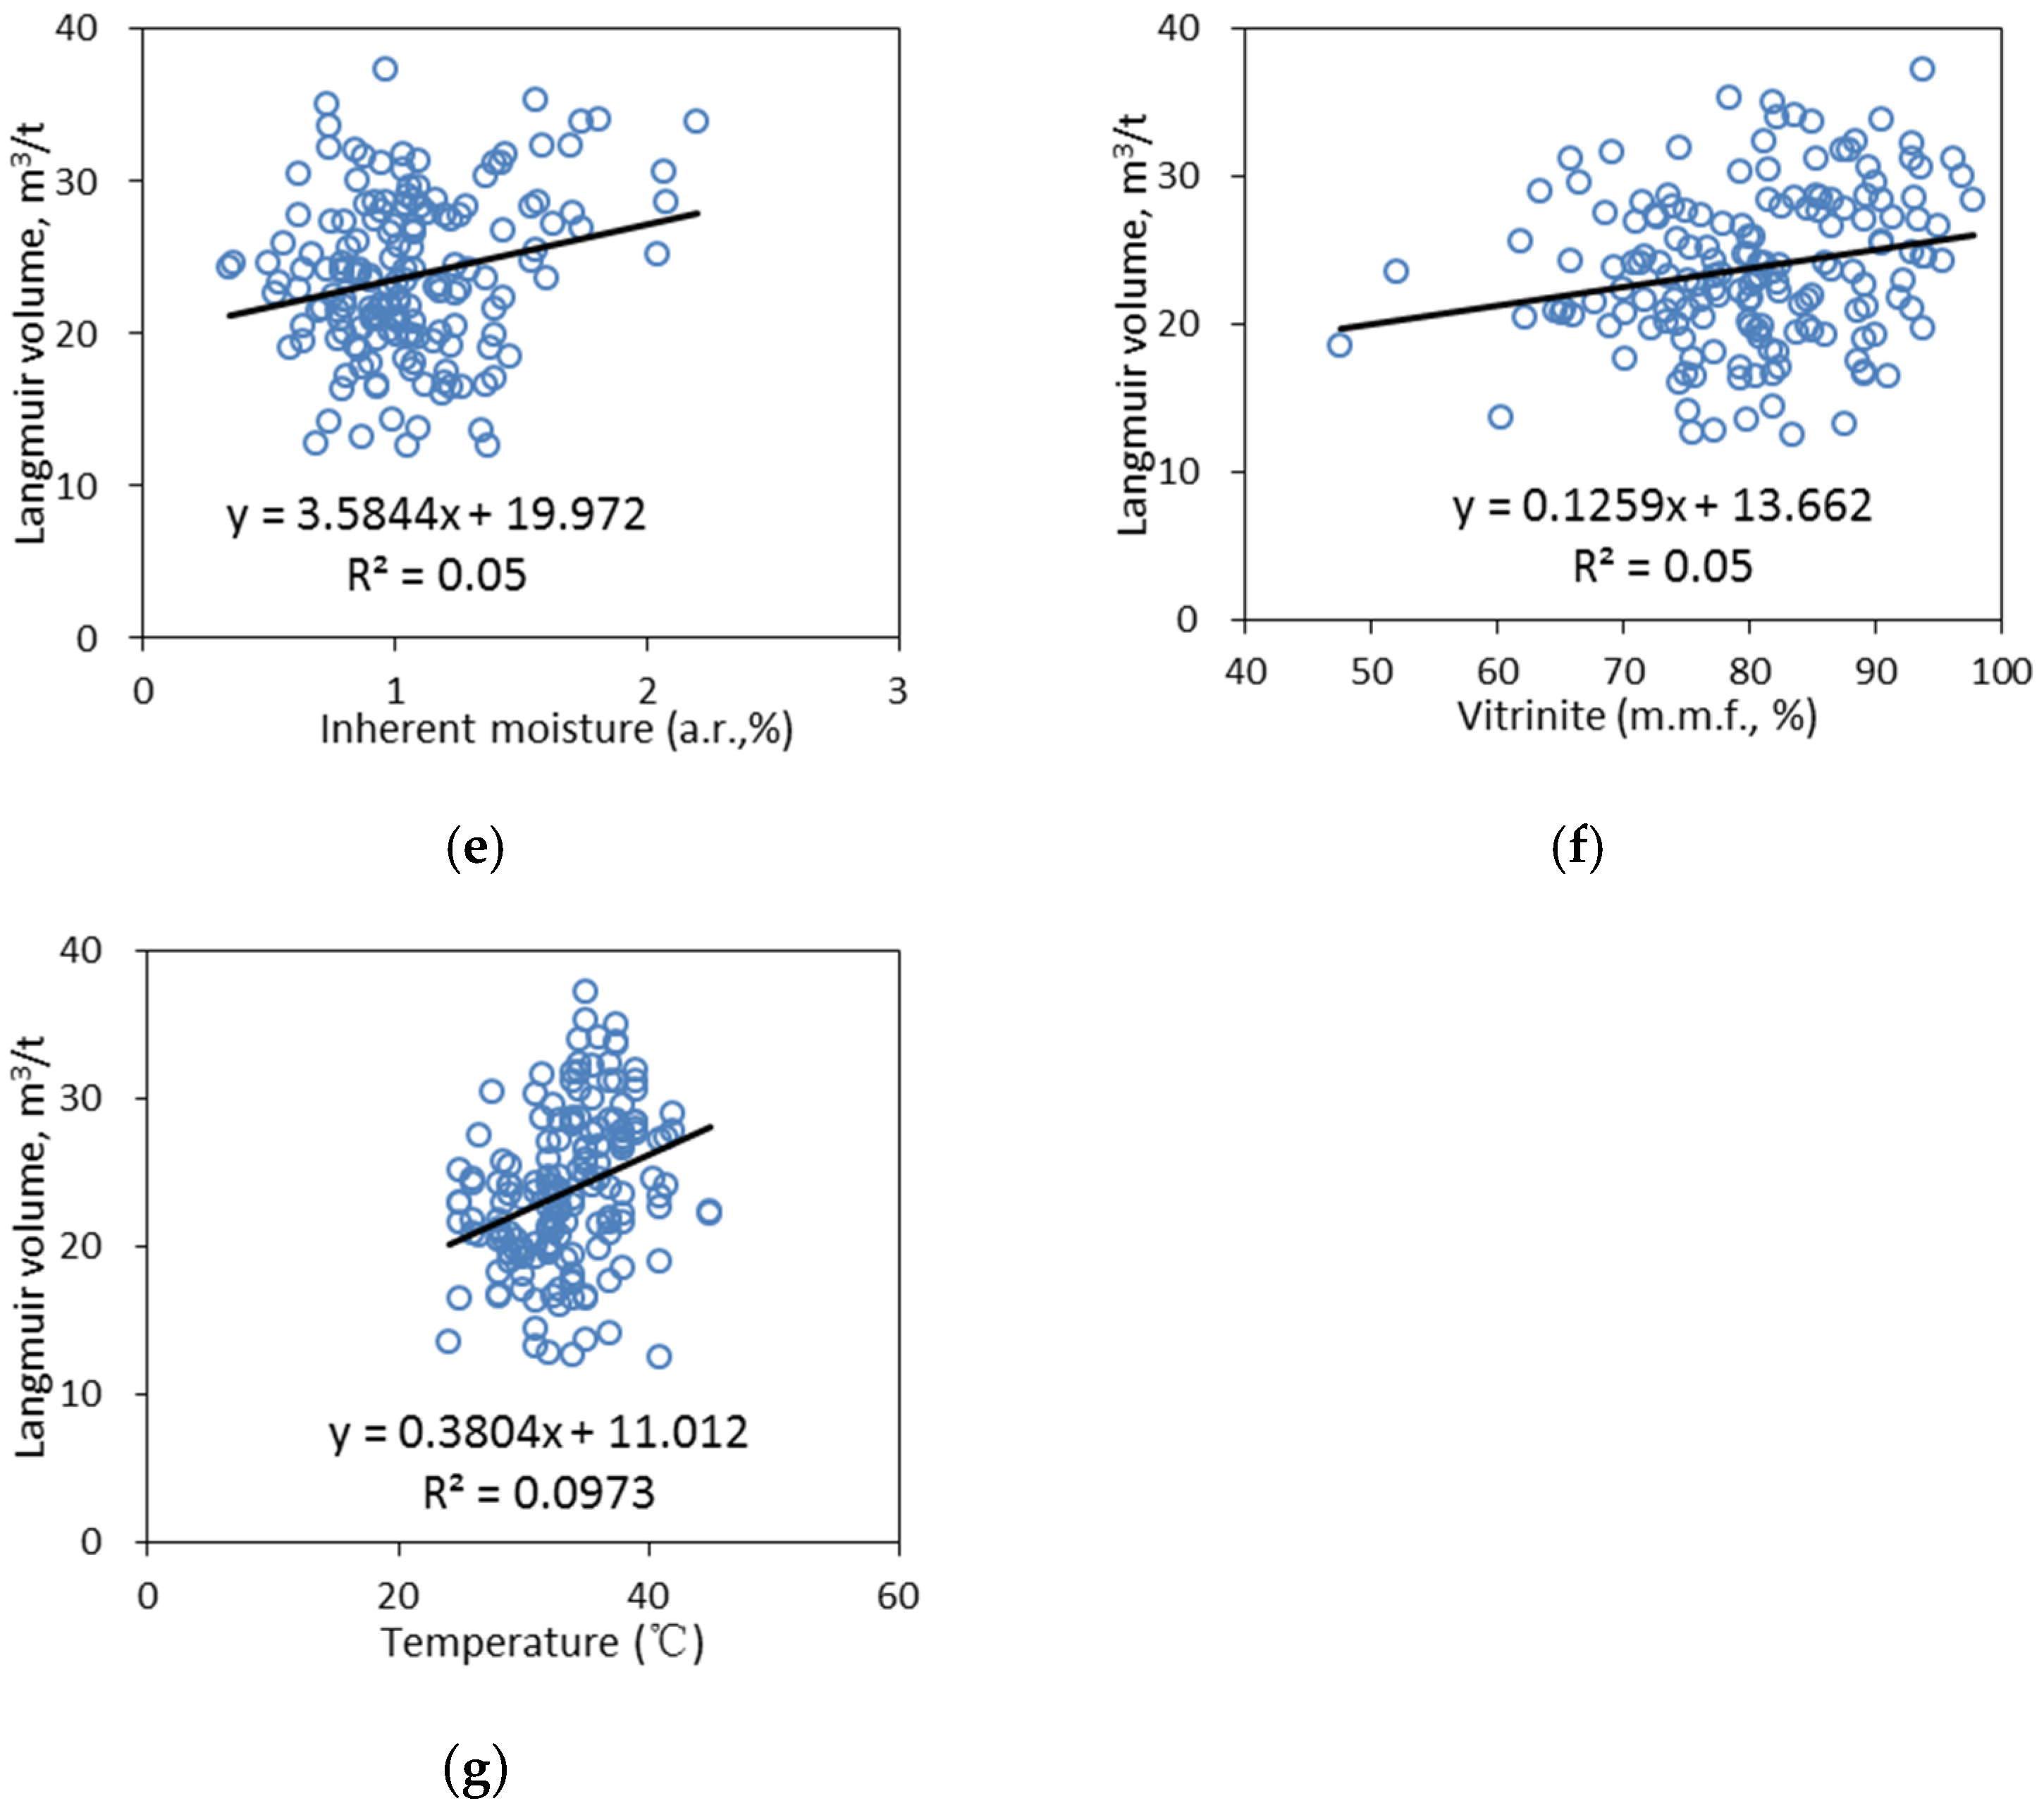
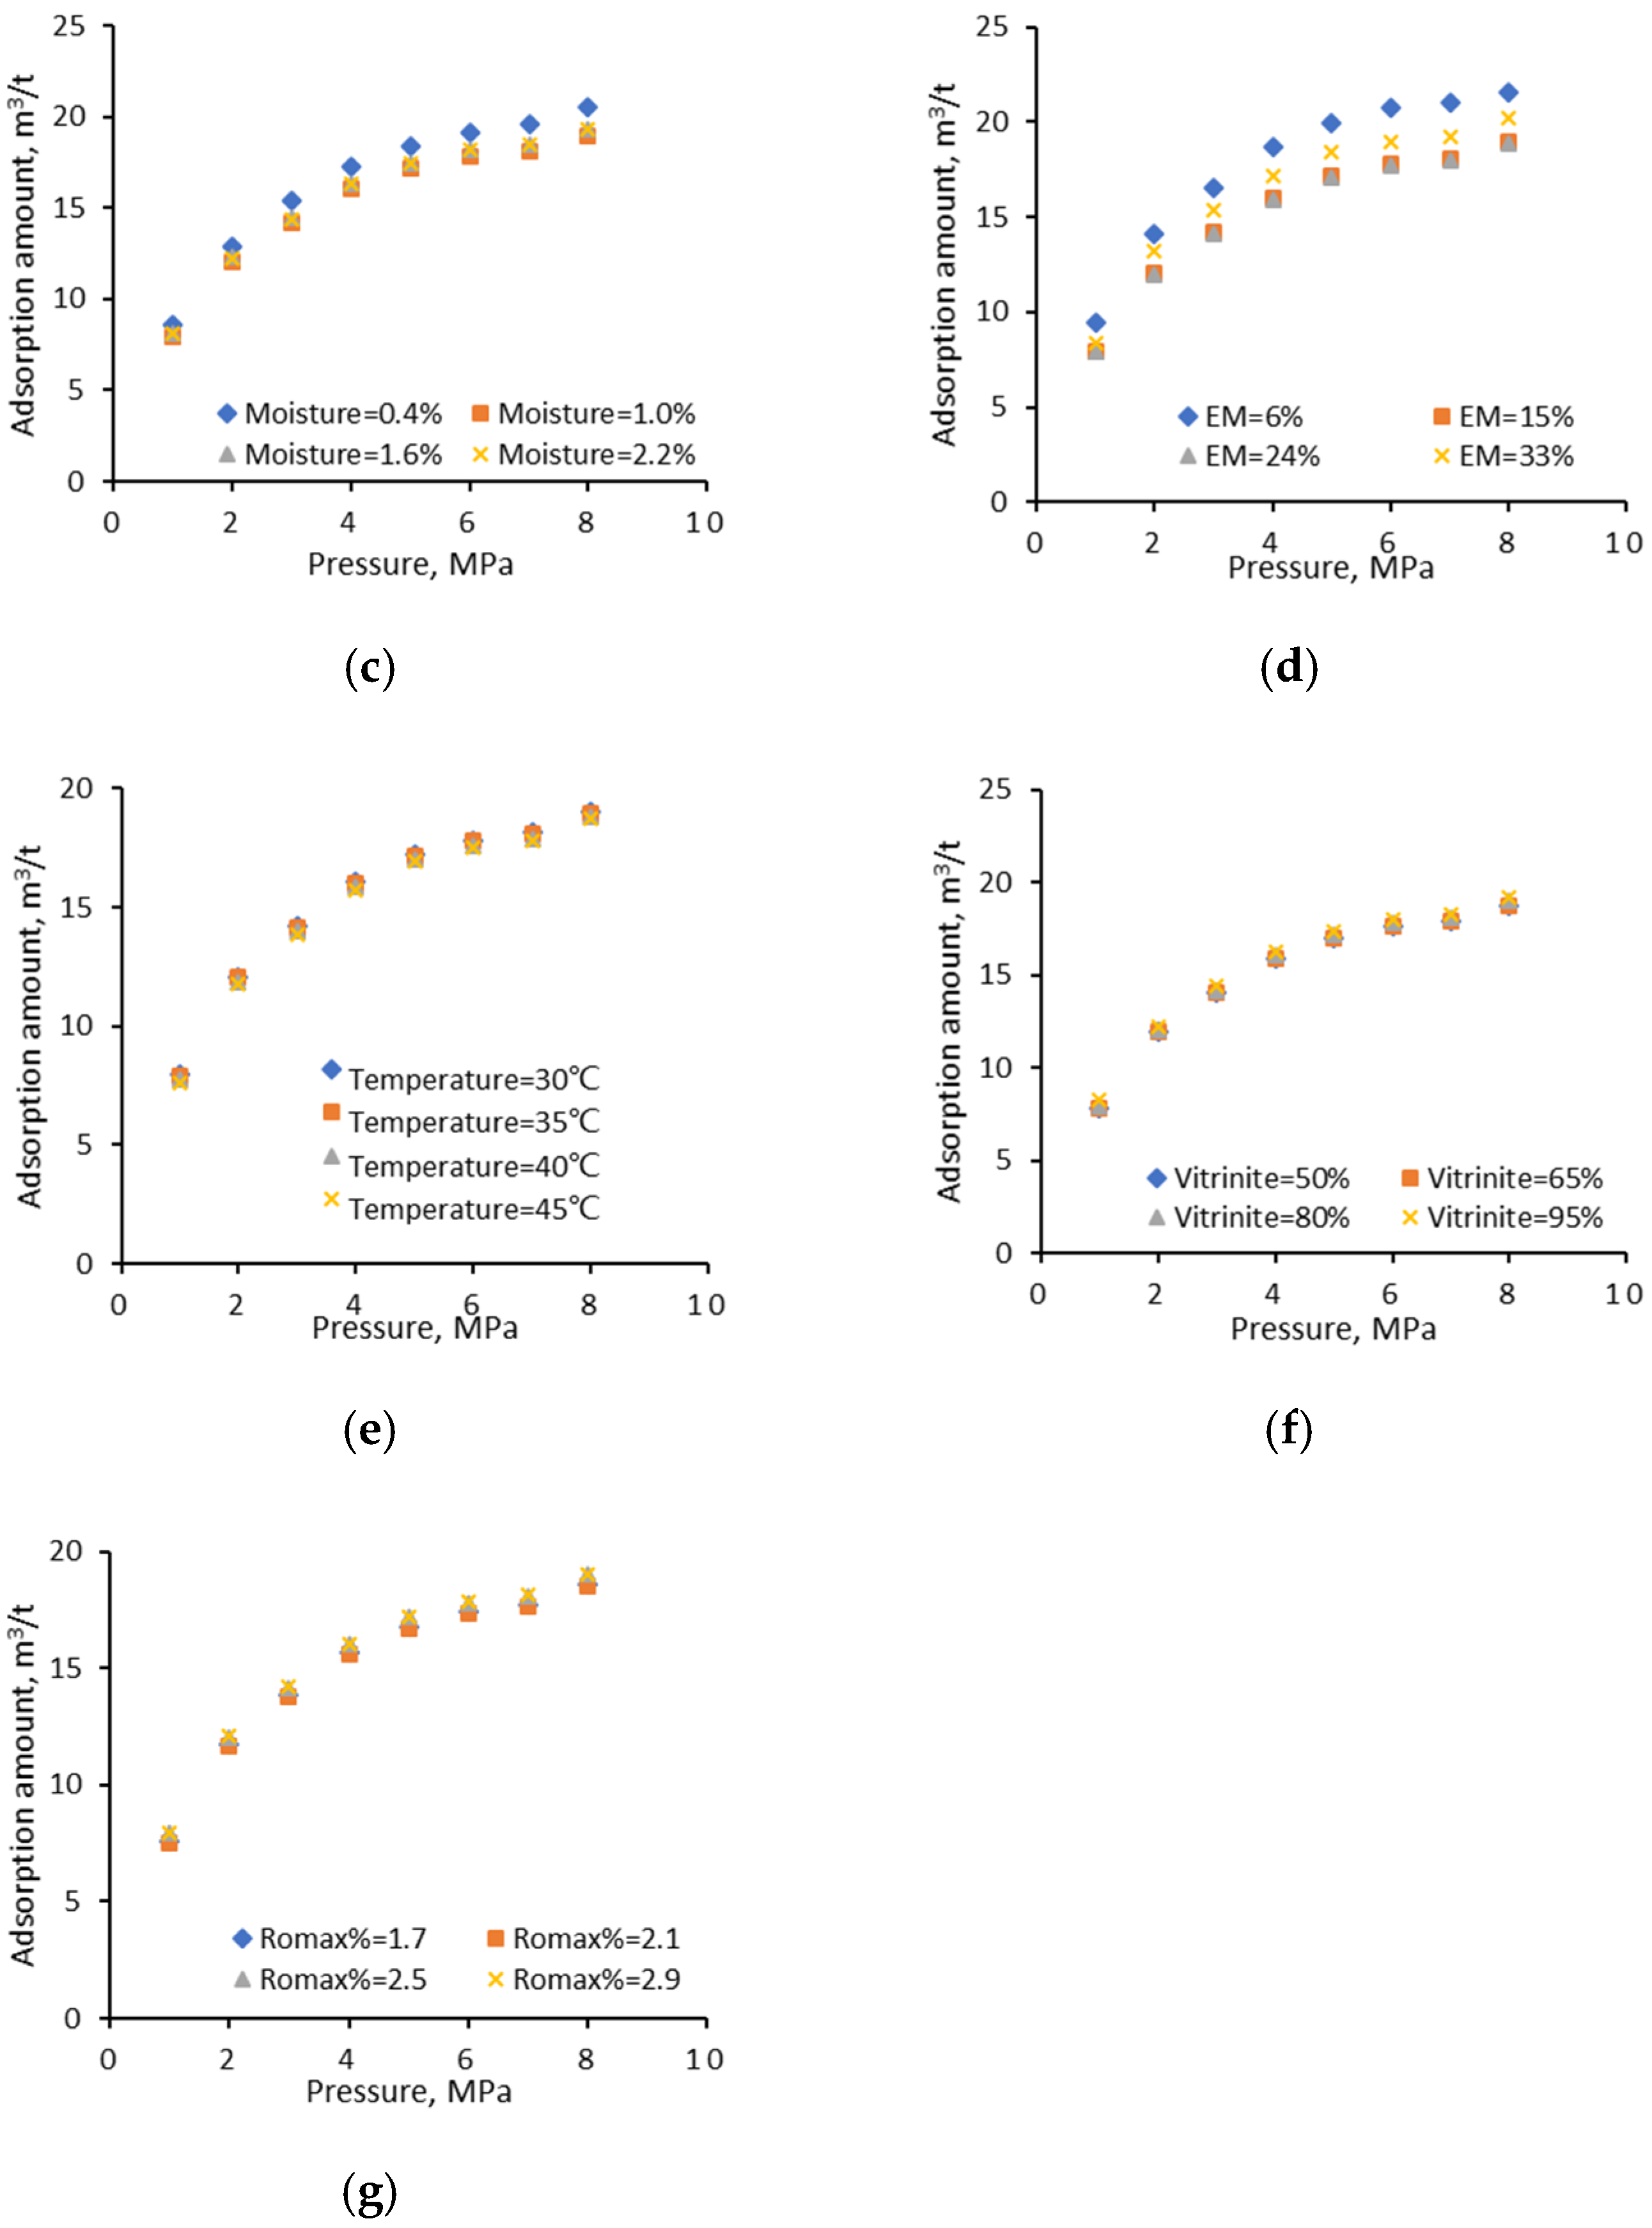
4.1.2. Univariate Analyses
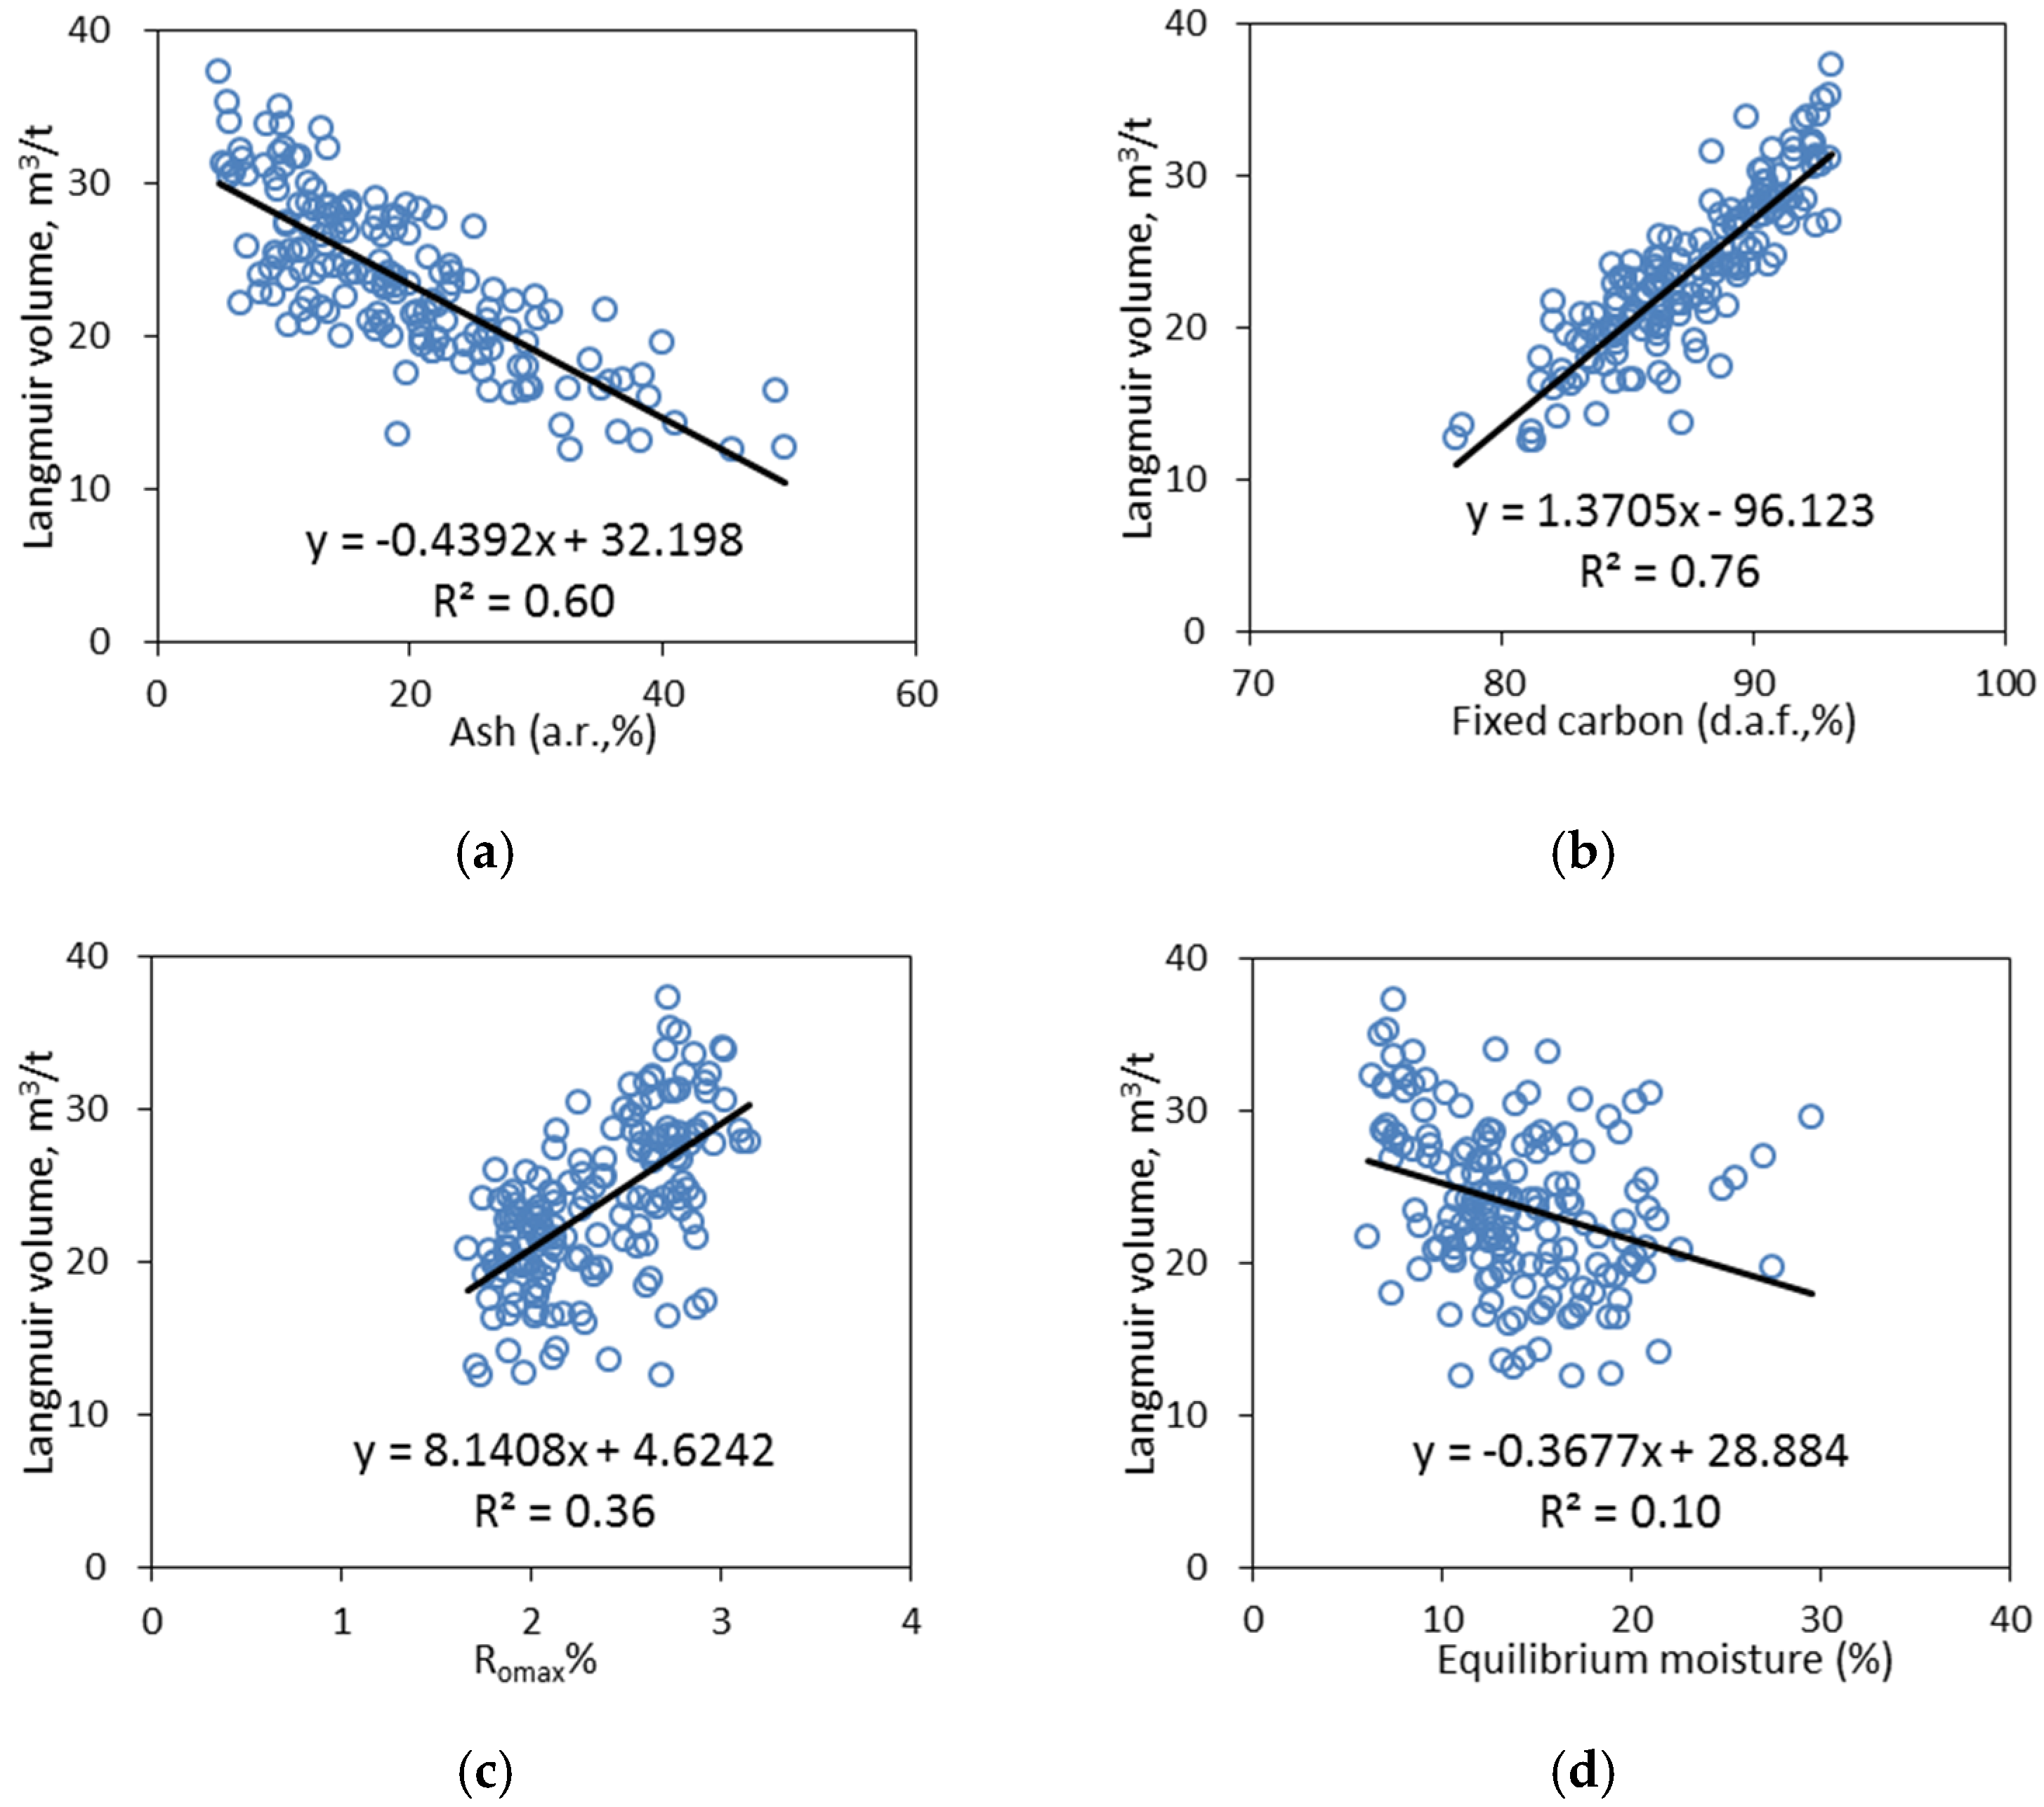
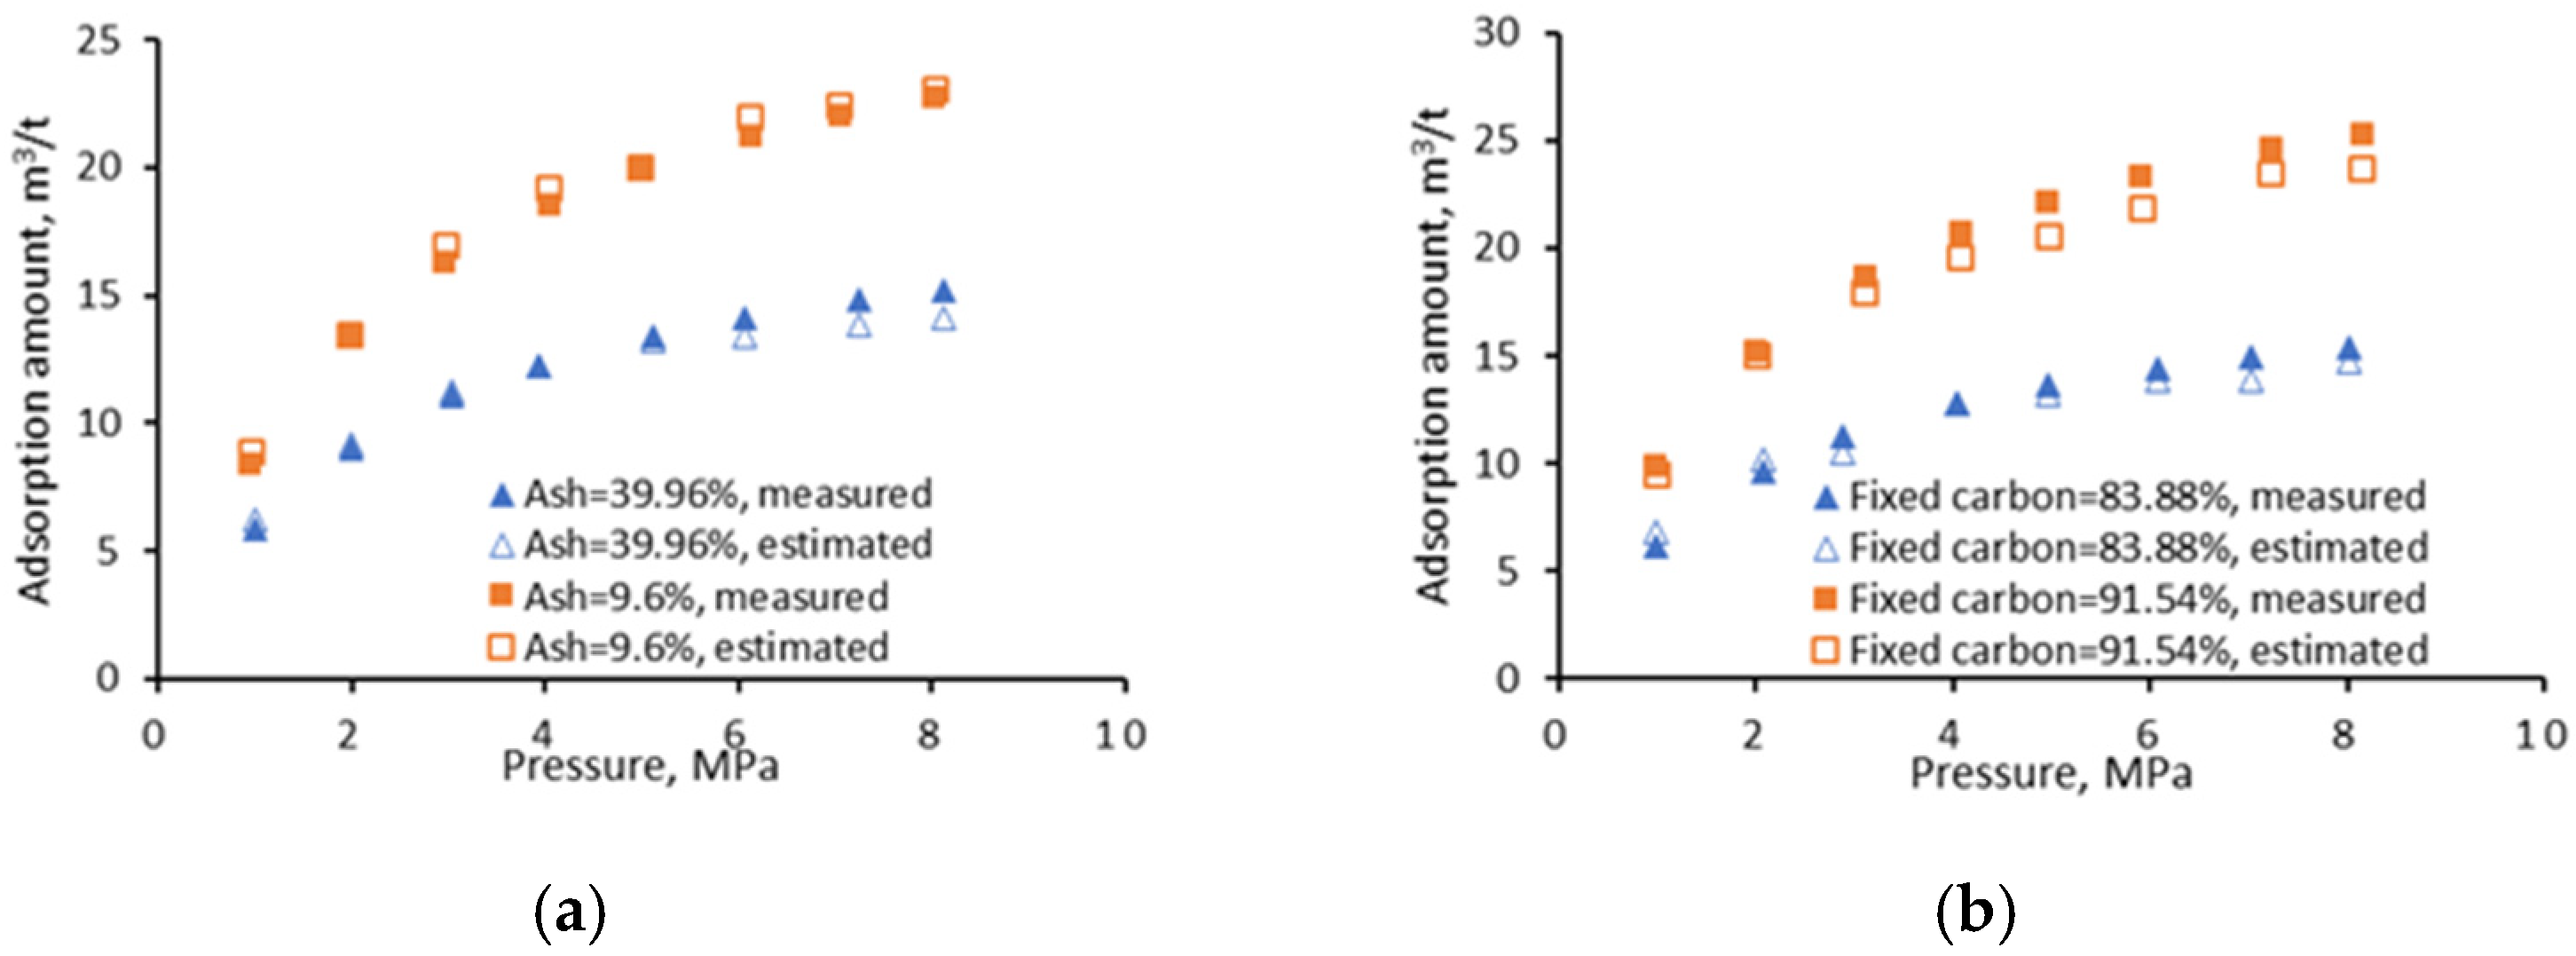
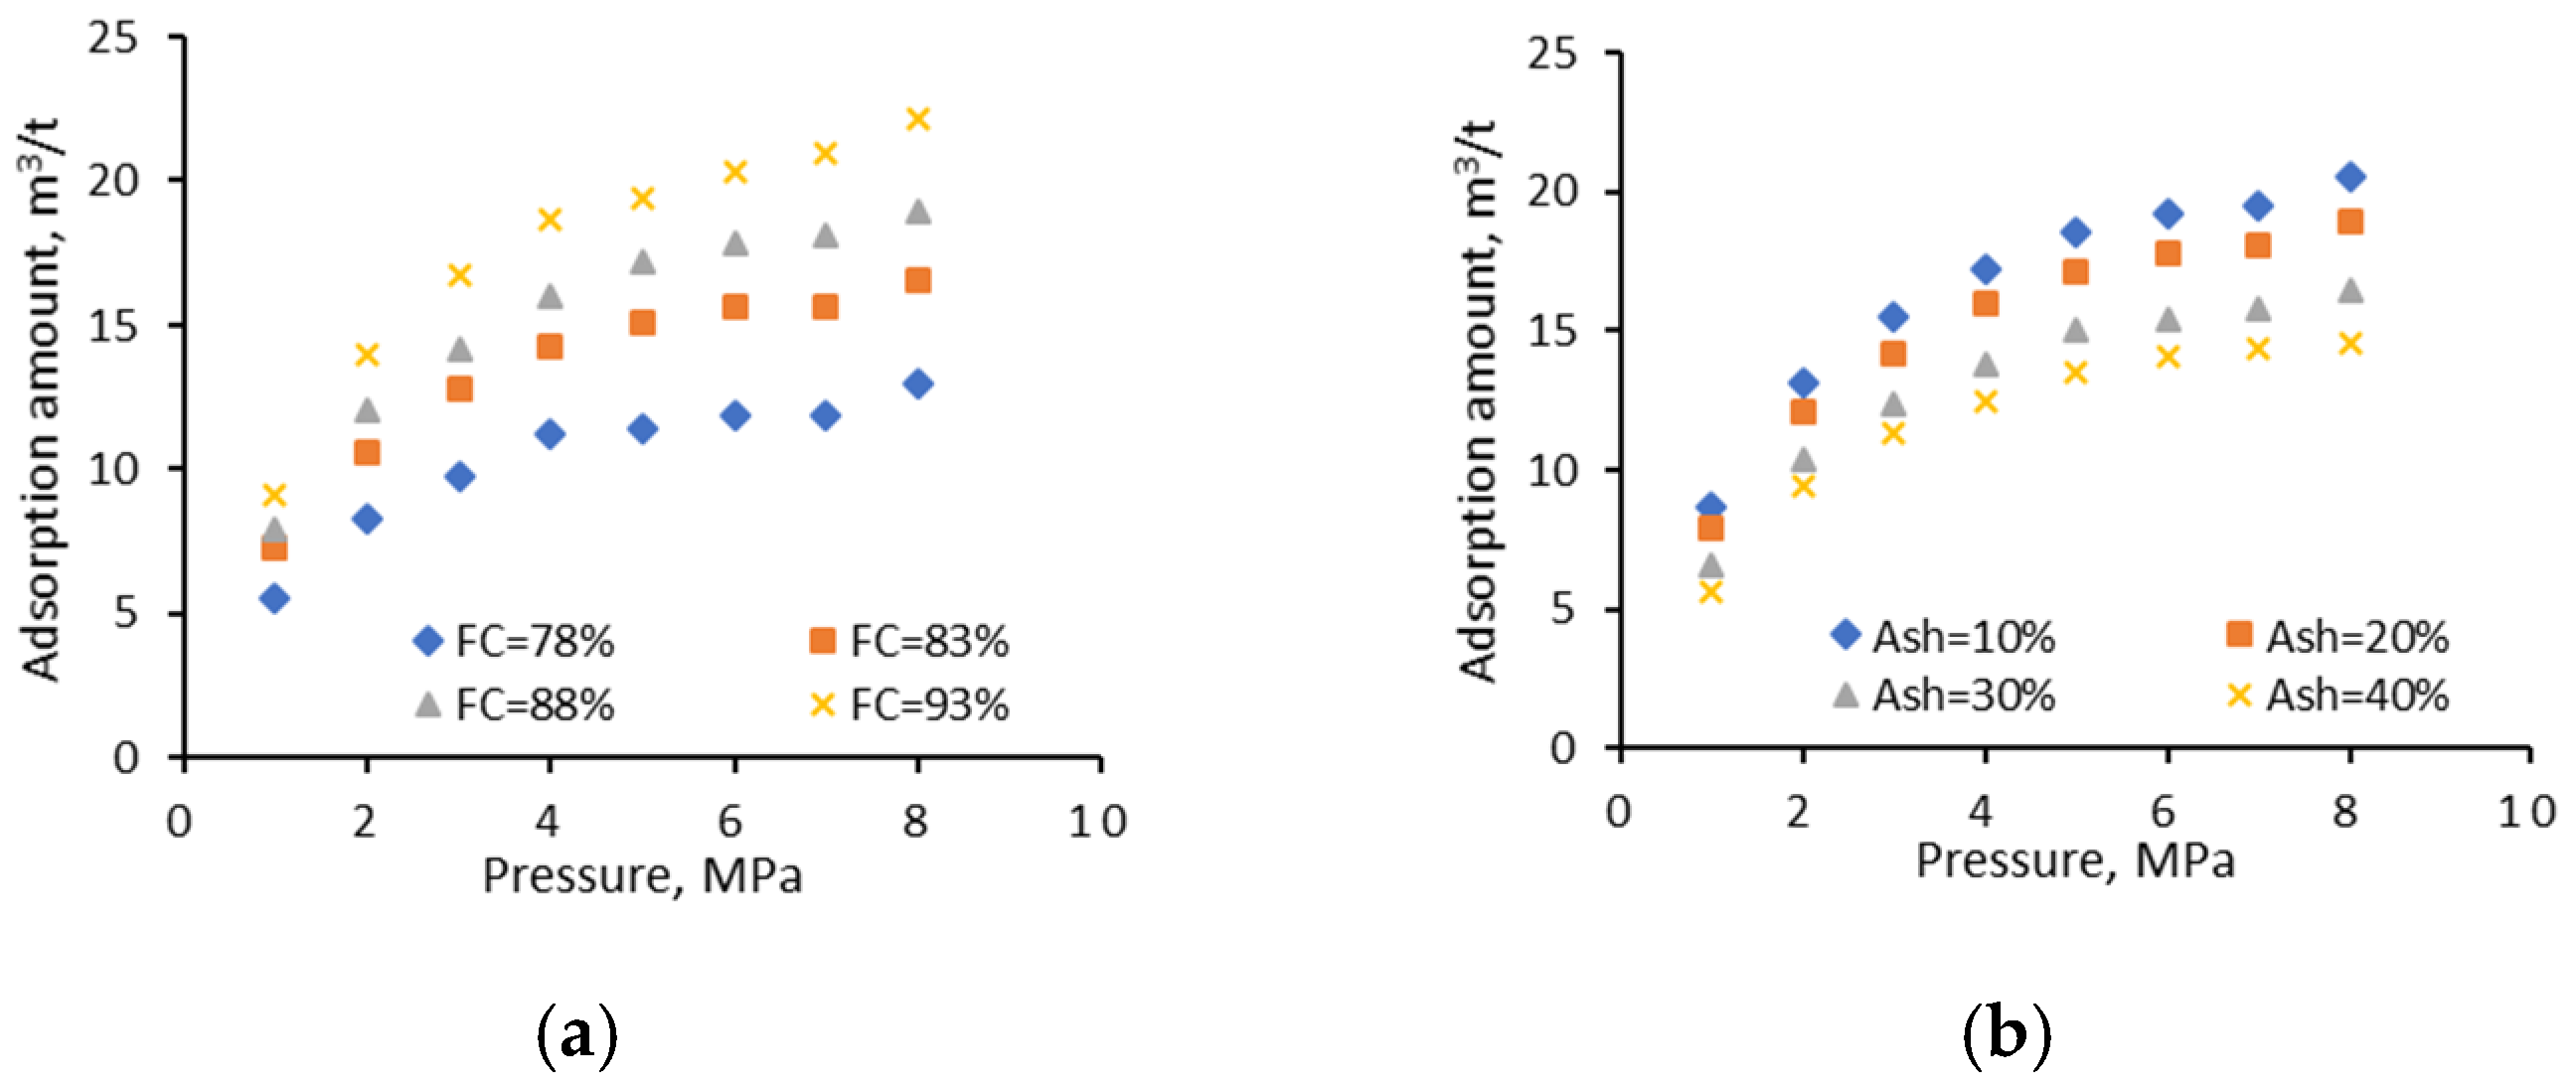
- Fixed carbon
- Ash
- Moisture
- Temperature
- Vitrinite
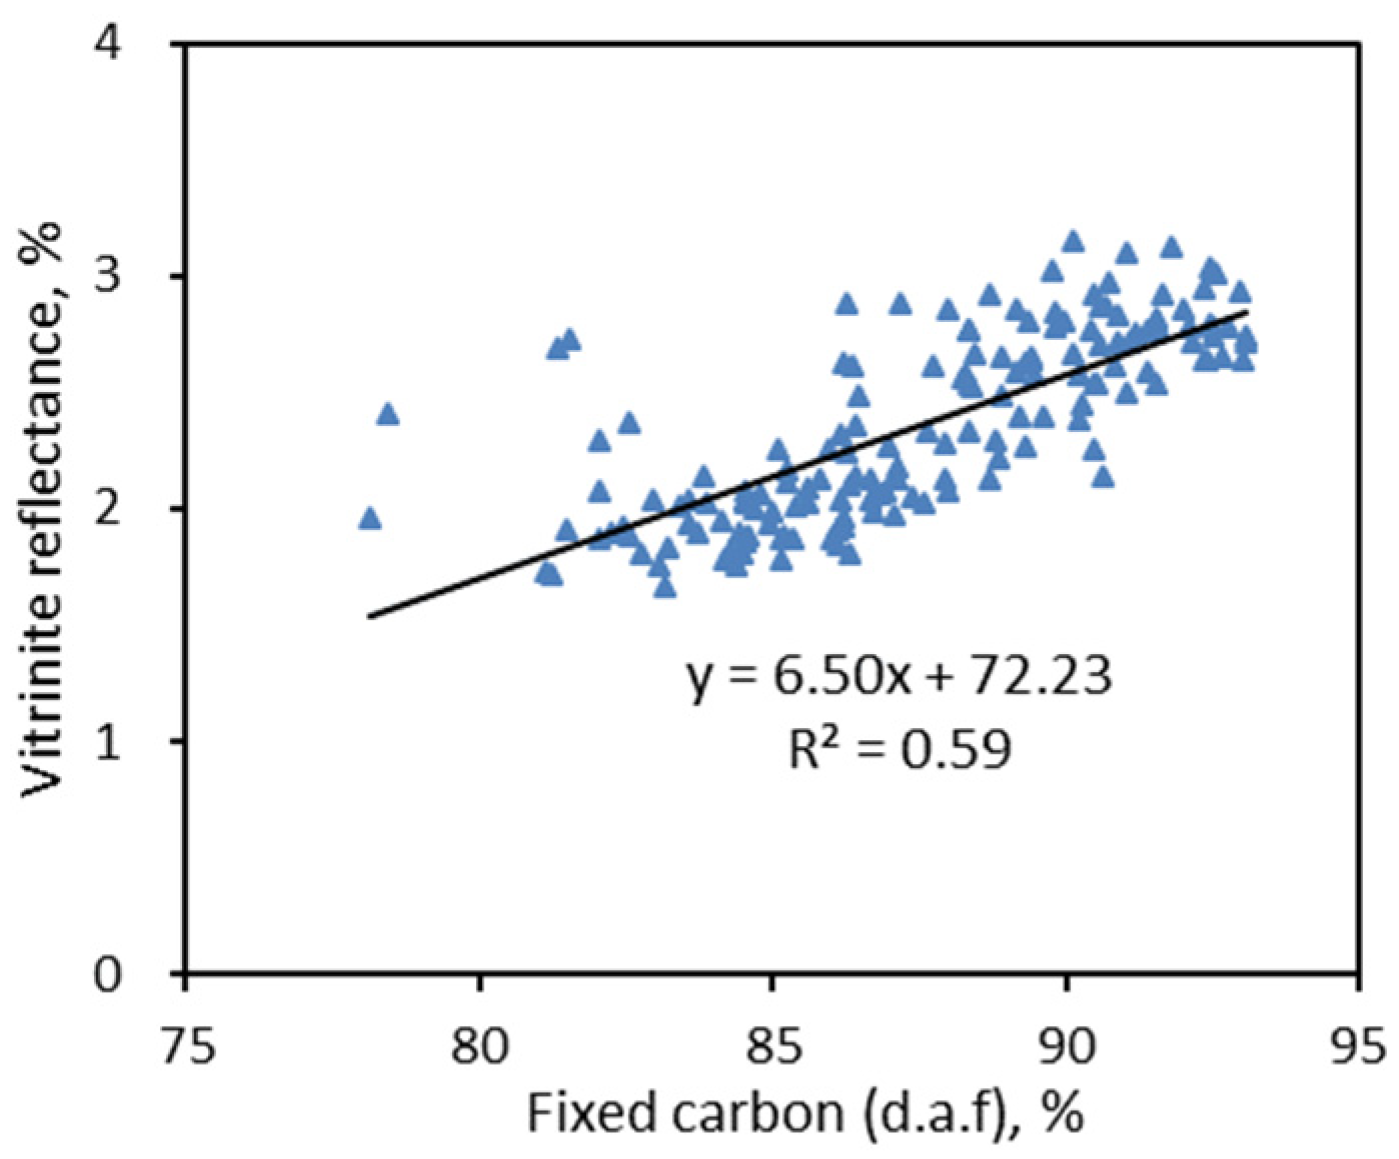
- Vitrinite reflectance
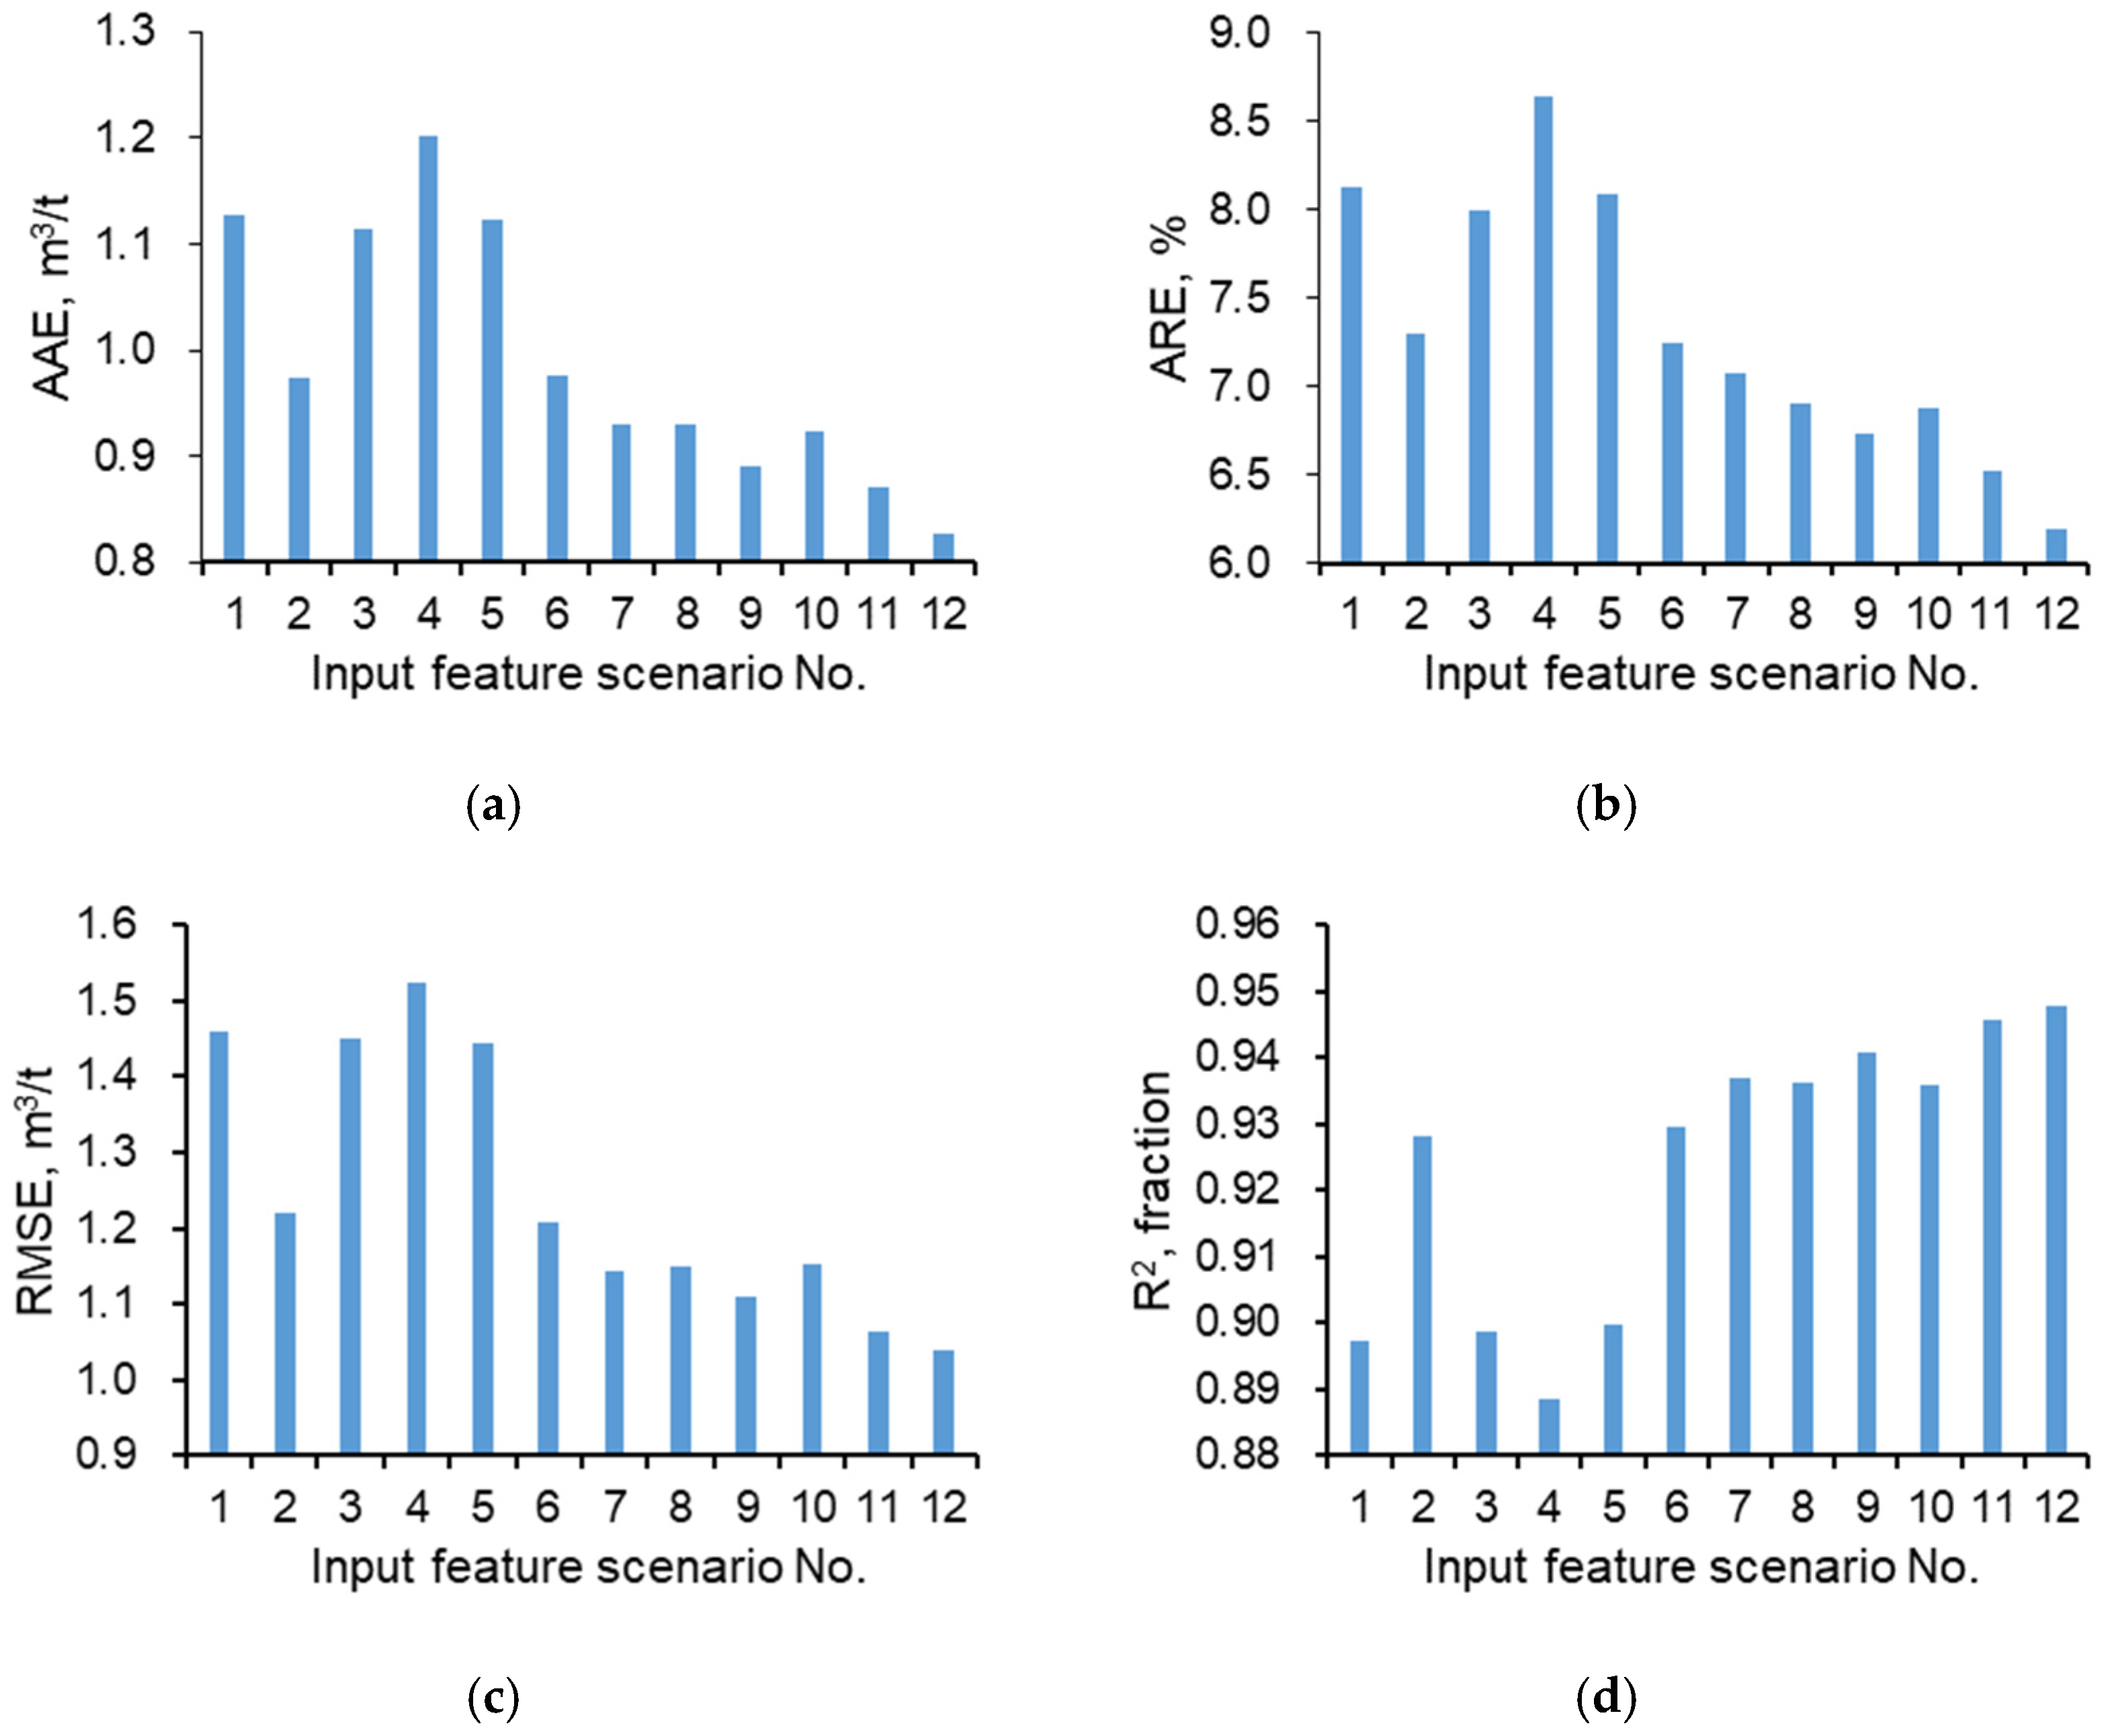
4.2. Influence of Input Features on the Model Accuracy
5. Conclusions
Author Contributions
Funding
Conflicts of Interest
References
- Chattaraj, S.; Mohanty, D.; Kumar, T.; Halder, G.; Mishra, K. Comparative study on sorption characteristics of coal seams from Barakar and Raniganj formations of Damodar Valley Basin, India. Int. J. Coal Geol. 2019, 212, 103202. [Google Scholar] [CrossRef]
- Zhang, J.; Feng, Q.; Zhang, X.; Hu, Q.; Wen, S.; Chen, D.; Zhai, Y.; Yan, X. Multi-fractured horizontal well for improved coalbed methane production in eastern Ordos basin, China: Field observations and numerical simulations. J. Pet. Sci. Eng. 2020, 194, 107488. [Google Scholar] [CrossRef]
- Zhang, J.; Feng, Q.; Zhang, X.; Bai, J.; Karacan, C.Ö.; Wang, Y.; Elsworth, D. A two-stage step-wise framework for fast optimization of well placement in coalbed methane reservoirs. Int. J. Coal Geol. 2020, 225. [Google Scholar] [CrossRef]
- Crosdale, P.J.; Beamish, B.B.; Valix, M. Coalbed methane sorption related to coal composition. Int. J. Coal Geol. 1998, 35, 147–158. [Google Scholar] [CrossRef]
- Kim, D.; Seo, Y.; Kim, J.; Han, J.; Lee, Y. Experimental and simulation studies on adsorption and diffusion characteristics of coalbed methane. Energies 2019, 12, 3445. [Google Scholar] [CrossRef]
- Peng, Z.; Liu, S.; Li, Y.-J.; Deng, Z.; Feng, H. Pore-scale lattice Boltzmann simulation of gas diffusion–adsorption kinetics considering adsorption-induced diffusivity change. Energies 2020, 13, 4927. [Google Scholar] [CrossRef]
- Busch, A.; Gensterblum, Y. CBM and CO2-ECBM related sorption processes in coal: A review. Int. J. Coal Geol. 2011, 87, 49–71. [Google Scholar] [CrossRef]
- Gasparik, M.; Rexer, T.F.; Aplin, A.C.; Billemont, P.; De Weireld, G.; Gensterblum, Y.; Henry, M.; Krooss, B.M.; Liu, S.; Ma, X.; et al. First international inter-laboratory comparison of high-pressure CH4, CO2 and C2H6 sorption isotherms on carbonaceous shales. Int. J. Coal Geol. 2014, 132, 131–146. [Google Scholar] [CrossRef]
- Gensterblum, Y.; van Hemert, P.; Billemont, P.; Battistutta, E.; Busch, A.; Krooss, B.M.; De Weireld, G.; Wolf, K.-H. European inter-laboratory comparison of high pressure CO2 sorption isotherms ii: Natural coals. Int. J. Coal Geol. 2010, 84, 115–124. [Google Scholar] [CrossRef]
- Mavor, M.J.; Hartman, C.; Pratt, T.J. Uncertainty in sorption isotherm measurements. In Proceedings of the International Coalbed Methane Symposium, Tuscaloosa, AL, USA, 12–14 May 2004. [Google Scholar]
- van Hemert, P.; Rudolph-Floter, S.; Wolf, K.-H.A.; Bruining, J. Estimate of equation of state uncertainty for manometric sorption experiments: Case study with Helium and carbon dioxide. SPE J. 2010, 15, 146–151. [Google Scholar] [CrossRef]
- Zlotea, C.; Moretto, P.; Steriotis, T. A round robin characterisation of the hydrogen sorption properties of a carbon based material. Int. J. Hydrogen Energy 2009, 34, 3044–3057. [Google Scholar] [CrossRef]
- Busch, A.; Han, F.; Magill, C.R. Paleofloral dependence of coal methane sorption capacity. Int. J. Coal Geol. 2019, 211. [Google Scholar] [CrossRef]
- Day, S.; Sakurovs, R.; Weir, S. Supercritical gas sorption on moist coals. Int. J. Coal Geol. 2008, 74, 203–214. [Google Scholar] [CrossRef]
- Weniger, P.; Kalkreuth, W.; Busch, A.; Krooss, B.M. High-pressure methane and carbon dioxide sorption on coal and shale samples from the Paraná Basin, Brazil. Int. J. Coal Geol. 2010, 84, 190–205. [Google Scholar] [CrossRef]
- Feng, Q.; Zhang, J.; Zhang, X.; Shu, C.; Wen, S.; Wang, S.; Li, J. The use of alternating conditional expectation to predict methane sorption capacity on coal. Int. J. Coal Geol. 2014, 121, 137–147. [Google Scholar] [CrossRef]
- Laxminarayana, C.; Crosdale, P.J. Role of coal type and rank on methane sorption characteristics of Bowen Basin, Australia coals. Int. J. Coal Geol. 1999, 40, 309–325. [Google Scholar] [CrossRef]
- Dutta, P.; Bhowmik, S.; Das, S. Methane and carbon dioxide sorption on a set of coals from India. Int. J. Coal Geol. 2011, 85, 289–299. [Google Scholar] [CrossRef]
- Zhang, Z.; Schott, J.A.; Liu, M.; Chen, H.; Lu, X.; Sumpter, B.G.; Fu, J.; Dai, S. Prediction of carbon dioxide adsorption via deep learning. Angew. Chem. Int. Ed. 2019, 131, 265–269. [Google Scholar] [CrossRef]
- Friedman, J.H. Greedy function approximation: A gradient boosting machine. Ann. Stat. 2001, 29, 1189–1232. [Google Scholar] [CrossRef]
- Friedman, J.H. Stochastic gradient boosting. Comput. Stat. Data Anal. 2002, 38, 367–378. [Google Scholar] [CrossRef]
- Luo, Z.; Sun, Z.; Ma, F.; Qin, Y.; Ma, S. Power Optimization for Wind Turbines Based on Stacking Model and Pitch Angle Adjustment. Energies 2020, 13, 4158. [Google Scholar] [CrossRef]
- Amar, M.; Shateri, M.; Hemmati-Sarapardeh, A.; Alamatsaz, A. Modeling oil-brine interfacial tension at high pressure and high salinity conditions. J. Petrol. Sci. Eng. 2019, 183, 106413. [Google Scholar] [CrossRef]
- Cai, Y.; Liu, D.; Yao, Y.; Li, J.; Qiu, Y. Geological controls on prediction of coalbed methane of No. 3 coal seam in Southern Qinshui Basin, North China. Int. J. Coal Geol. 2011, 88, 101–112. [Google Scholar] [CrossRef]
- Song, Y.; Ma, X.; Liu, S.; Jiang, L.; Hong, F.; Qin, Y. Accumulation conditions and key technologies for exploration and development of Qinshui coalbed methane field. Pet. Res. 2018, 3, 320–335. [Google Scholar] [CrossRef]
- Chinese National Standard GB/T 212-2008. Proximate Analysis of Coal; Standardization Administration of China: Beijing, China, 2008. [Google Scholar]
- Chinese National Standard GB/T 8899-2013. Determination of Maceral Composition and Minerals in Coal; Standardization Administration of China: Beijing, China, 2013. [Google Scholar]
- Chinese National Standard GB/T 6948-2008. Method of Determining Microscopically the Reflectance of Vitrinite in Coal; Standardization Administration of China: Beijing, China, 2008. [Google Scholar]
- Sanders, M.; Rimmer, S. Revisiting the thermally metamorphosed coals of the Transantarctic Mountains, Antarctica. Int. J. Coal Geol. 2020, 228, 103550. [Google Scholar] [CrossRef]
- Zhang, J.; Feng, Q.; Zhang, X.; Shu, C.; Wang, S.; Wu, K. A supervised learning approach for accurate modeling of CO2-Brine interfacial tension with application in identifying the optimum sequestration depth in saline aquifers. Energy Fuel. 2020, 34, 7353–7362. [Google Scholar] [CrossRef]
- Cai, J.; Luo, J.; Wang, S.; Yang, S. Feature selection in machine learning: A new perspective. Neurocomputing 2018, 300, 70–79. [Google Scholar] [CrossRef]
- Feng, Q.; Zhang, J.; Zhang, X.; Wen, S. Proximate analysis based prediction of gross calorific value of coals: A comparison of support vector machine, alternating conditional expectation and artificial neural network. Fuel Process. Technol. 2015, 129, 120–129. [Google Scholar] [CrossRef]
- Beker, W.; Gajewska, E.P.; Badowski, T.; Grzybowski, B.A. Prediction of major regio-, site-, and diastereoisomers in diels-alder reactions by using machine-learning: The importance of physically meaningful descriptors. Angew. Chem. Int. Ed. 2019, 58. [Google Scholar] [CrossRef]
- An, F.H.; Cheng, Y.P.; Wu, D.M.; Wang, L. The effect of small micropores on methane adsorption of coals from Northern China. Adsorption 2013, 19, 83–90. [Google Scholar] [CrossRef]
- Clarkson, C.R.; Bustin, R.M. The effect of pore structure and gas pressure upon the transport properties of coal: A laboratory and modeling study. 1. Isotherms and pore volume distributions. Fuel 1999, 78, 1333–1344. [Google Scholar] [CrossRef]
- Liu, X.; He, X. Effect of pore characteristics on coalbed methane adsorption in middle-high rank coals. Adsorption 2017, 23, 3–12. [Google Scholar] [CrossRef]
- Hao, S.; Wen, J.; Yu, X.; Wei, C. Effect of the surface oxygen groups on methane adsorption on coals. Appl. Surf. Sci. 2013, 264, 433–442. [Google Scholar] [CrossRef]
- Jiang, J.; Yang, W.; Cheng, Y.; Zhao, K.; Zheng, S. Pore structure characterization of coal particles via MIP, N2 and CO2 adsorption: Effect of coalification on nanopores evolution. Powder Technol. 2019, 354, 136–148. [Google Scholar] [CrossRef]
- Li, Z.; Liu, D.; Cai, Y.; Ranjith, P.; Yao, Y. Multi-scale quantitative characterization of 3-D pore-fracture networks in bituminous and anthracite coals using FIB-SEM tomography and X-ray μ-CT. Fuel 2017, 209, 43–53. [Google Scholar] [CrossRef]
- Zhang, R.; Liu, S.; Bahadur, J.; Elsworth, D.; Melnichenko, Y.; He, L.; Wang, Y. Estimation and modeling of coal pore accessibility using small angle neutron scattering. Fuel 2015, 161, 323–332. [Google Scholar] [CrossRef]
- Elith, J.; Leathwick, J.R.; Hastie, T. A working guide to boosted regression trees. J. Anim. Ecol. 2008, 77, 802–813. [Google Scholar] [CrossRef]
- Ridgeway, G. Generalized Boosted Models: A Guide to the GBM Package. Available online: http://citeseerx.ist.psu.edu/viewdoc/summary?doi=10.1.1.151.4024 (accessed on 27 September 2020).
- Pedregosa, F.; Varoquaux, G.; Gramfort, A.; Michel, V.; Thirion, B.; Grisel, O.; Blondel, M.; Prettenhofer, P.; Weiss, R.; Dubourg, V.; et al. Scikit-learn: Machine learning in python. J. Mach. Learn. Res. 2012, 12, 2825–2830. [Google Scholar]
- Zhang, J.; Feng, Q.; Wang, S.; Zhang, X.; Wang, S. Estimation of CO2–brine interfacial tension using an artificial neural network. J. Supercrit. Fluid 2016, 107, 31–37. [Google Scholar] [CrossRef]
- Dixit, N.; McColgan, P.; Kusler, K. Machine learning-based probabilistic lithofacies prediction from conventional well Logs: A case from the Umiat Oil Field of Alaska. Energies 2020, 13, 4862. [Google Scholar] [CrossRef]
- Jadidi, M.; Kostic, S.; Zimmer, L.; Dworkin, S.B. An artificial neural network for the low-cost prediction of soot emissions. Energies 2020, 13, 4787. [Google Scholar] [CrossRef]
- Chang, C.; Lin, C. LIBSVM: A library for support vector machines. ACM Trans. Intell. Syst. Technol. 2019, 2, 1–27. [Google Scholar] [CrossRef]
- Khan, P.W.; Byun, Y.-C.; Lee, S.-J.; Kang, D.-H.; Kang, J.-Y.; Park, H.-S. Machine learning-based approach to predict energy consumption of renewable and nonrenewable power sources. Energies 2020, 13, 4870. [Google Scholar] [CrossRef]
- Memon, Z.A.; Trinchero, R.; Manfredi, P.; Canavero, F.G.; Stievano, I.S. Compressed machine learning models for the uncertainty quantification of power distribution Networks. Energies 2020, 13, 4881. [Google Scholar] [CrossRef]
- Busch, A.; Gensterblum, Y.; Krooss, B.M. Methane and CO2 sorption and desorption measurements on dry Argonne premium coals: Pure components and mixtures. Int. J. Coal Geol. 2003, 55, 205–224. [Google Scholar] [CrossRef]
- Li, D.; Liu, Q.; Weniger, P.; Gensterblum, Y.; Busch, A.; Krooss, B.M. High-pressure sorption isotherms and sorption kinetics of CH4 and CO2 on coals. Fuel 2010, 89, 569–580. [Google Scholar] [CrossRef]
- Breiman, L.; Friedman, J.; Stone, C.J.; Olshen, R.A. Classification and Regression Trees; Chapman & Hall (Wadsworth, Inc.): New York, NY, USA, 1984. [Google Scholar]
- Louppe, G. Understanding Random Forests: From Theory to Practice. Ph.D. Thesis, University of Liège, Liège, Belgium, 2014. [Google Scholar]
- Zhang, J.; Sun, Y.; Shang, L.; Feng, Q.; Gong, L.; Wu, K. A unified intelligent model for estimating (gas + n-alkane) interfacial tension. Fuel 2020, 282, 118783. [Google Scholar] [CrossRef]
- Tomaschek, F.; Hendrix, P.; Baayen, R.H. Strategies for addressing collinearity in multivariate linguistic data. J. Phon. 2018, 71, 249–267. [Google Scholar] [CrossRef]
- Levy, J.H.; Day, S.J.; Killingley, J.S. Methane capacities of Bowen Basin coals related to coal properties. Fuel 1997, 76, 813–819. [Google Scholar] [CrossRef]
- Chalmers, G.R.; Bustin, R.M. On the effects of petrographic composition on coalbed methane sorption. Int. J. Coal Geol. 2007, 69, 288–304. [Google Scholar] [CrossRef]
- Clarkson, C.R.; Bustin, R.M. Binary gas adsorption/desorption isotherms: Effect of moisture and coal composition upon carbon dioxide selectivity over methane. Int. J. Coal Geol. 2000, 42, 241–271. [Google Scholar] [CrossRef]
- Weniger, P.; Franců, J.; Hemza, P.; Krooss, B.M. Investigations on the methane and carbon dioxide sorption capacity of coals from the SW Upper Silesian Coal Basin, Czech Republic. Int. J. Coal Geol. 2012, 93, 23–39. [Google Scholar] [CrossRef]
- Crosdale, P.J.; Moore, T.A.; Mares, T.E. Influence of moisture content and temperature on methane adsorption isotherm analysis for coals from a low-rank, biogenically-sourced gas reservoir. Int. J. Coal Geol. 2008, 76, 166–174. [Google Scholar] [CrossRef]
- Krooss, B.V.; Van Bergen, F.; Gensterblum, Y.; Siemons, N.; Pagnier, H.J.M.; David, P. High-pressure methane and carbon dioxide adsorption on dry and moisture-equilibrated Pennsylvanian coals. Int. J. Coal Geol. 2002, 51, 69–92. [Google Scholar] [CrossRef]
- Pan, J.; Hou, Q.; Ju, Y.; Bai, H.; Zhao, Y. Coalbed methane sorption related to coal deformation structures at different temperatures and pressures. Fuel 2012, 102, 760–765. [Google Scholar] [CrossRef]
- Guan, C.; Liu, S.; Li, C.; Wang, Y.; Zhao, Y. The temperature effect on the methane and CO2 adsorption capacities of Illinois coal. Fuel 2018, 211, 241–250. [Google Scholar] [CrossRef]
- Clarkson, C.R.; Bustin, R.M. Variation in micropore capacity and size distribution with composition in bituminous coal of the Western Canadian Sedimentary Basin: Implications for coalbed methane potential. Fuel 1996, 75, 1483–1498. [Google Scholar] [CrossRef]
- Carroll, R.E.; Pashin, J.C. Relationship of sorption capacity to coal quality: CO2 sequestration potential of coalbed methane reservoirs in the Black Warrior basin. In Proceedings of the International Coalbed Methane Symposium, University of Alabama, Tuscaloosa, AL, USA, 5–7 May 2003. [Google Scholar]
- Faiz, M.; Saghafi, A.; Sherwood, N.; Wang, I. The influence of petrological properties and burial history on coal seam methane reservoir characterisation, Sydney Basin, Australia. Int. J. Coal Geol. 2007, 70, 193–208. [Google Scholar] [CrossRef]
- Laxminarayana, C.; Crosdale, P.J. Controls on methane sorption capacity of Indian coals. AAPG Bull. 2002, 86, 201–212. [Google Scholar] [CrossRef]
- Guo, X.; Huan, X.; Huan, H. Structural characteristics of deformed coals with different deformation degrees and their effects on gas adsorption. Energy Fuel. 2017, 31, 13374–13381. [Google Scholar] [CrossRef]


| Property | Maximum | Minimum | Average |
|---|---|---|---|
| Ash (a.d.), % | 49.59 | 4.85 | 18.70 |
| Moisture (a.r.), % | 2.20 | 0.34 | 1.10 |
| Fixed carbon (d.a.f.), % | 93.08 | 78.15 | 87.74 |
| Vitrinite (m.m.f), % | 97.80 | 47.50 | 80.77 |
| Vitrinite reflectance, % | 3.18 | 1.67 | 2.39 |
| Equilibrium moisture, % | 33.90 | 6.00 | 14.22 |
| Temperature, °C | 45.0 | 24.0 | 33.71 |
| Langmuir volume, m3/t | 37.26 | 12.53 | 24.25 |
| Langmuir pressure, MPa | 2.90 | 1.52 | 2.03 |
| Method | Property | Value |
|---|---|---|
| BP-ANN | No. of hidden layers | 1 |
| No. of nodes in each hidden layer | 20 | |
| Activation function for hidden layer(s) | Tangent | |
| Activation function for output layer | Linear | |
| SVM | Activation function | RBF |
| Regulation parameter | 86 | |
| Error goal parameter | 0.005 |
| Data Set | Error Matrices | GBDT | ANN | SVM |
|---|---|---|---|---|
| Training set | AAE, m3/t | 0.33 | 0.21 | 0.71 |
| ARE, % | 2.31 | 1.62 | 5.58 | |
| RMSE, m3/t | 0.42 | 0.28 | 1.01 | |
| R2, fraction | 0.993 | 0.997 | 0.959 | |
| Validation set | AAE, m3/t | 0.83 | 1.14 | 1.11 |
| ARE, % | 5.97 | 8.10 | 9.12 | |
| RMSE, m3/t | 1.00 | 1.45 | 1.57 | |
| R2, fraction | 0.950 | 0.895 | 0.877 | |
| Testing set | AAE, m3/t | 0.85 | 1.26 | 0.96 |
| ARE, % | 6.35 | 9.25 | 7.81 | |
| RMSE, m3/t | 1.06 | 1.81 | 1.23 | |
| R2, fraction | 0.946 | 0.842 | 0.927 | |
| Whole set | AAE, m3/t | 0.53 | 0.61 | 0.84 |
| ARE, % | 3.85 | 4.44 | 6.74 | |
| RMSE, m3/t | 0.73 | 1.06 | 1.19 | |
| R2, fraction | 0.977 | 0.952 | 0.940 |
| Scenario No. | Input Features * |
|---|---|
| 1 | P, A, Ro, FC |
| 2 | P, A, Ro, FC, EM |
| 3 | P, A, Ro, FC, IM |
| 4 | P, A, Ro, FC, V |
| 5 | P, A, Ro, FC, T |
| 6 | P, A, Ro, FC, EM, IM |
| 7 | P, A, Ro, FC, EM, V |
| 8 | P, A, Ro, FC, EM, T |
| 9 | P, A, Ro, FC, EM, IM, V |
| 10 | P, A, Ro, FC, EM, IM, T |
| 11 | P, A, Ro, FC, EM, V, T |
| 12 | P, A, Ro, FC, EM, IM, V, T |
Publisher’s Note: MDPI stays neutral with regard to jurisdictional claims in published maps and institutional affiliations. |
© 2020 by the authors. Licensee MDPI, Basel, Switzerland. This article is an open access article distributed under the terms and conditions of the Creative Commons Attribution (CC BY) license (http://creativecommons.org/licenses/by/4.0/).
Share and Cite
Zhang, J.; Feng, Q.; Zhang, X.; Hu, Q.; Yang, J.; Wang, N. A Novel Data-Driven Method to Estimate Methane Adsorption Isotherm on Coals Using the Gradient Boosting Decision Tree: A Case Study in the Qinshui Basin, China. Energies 2020, 13, 5369. https://doi.org/10.3390/en13205369
Zhang J, Feng Q, Zhang X, Hu Q, Yang J, Wang N. A Novel Data-Driven Method to Estimate Methane Adsorption Isotherm on Coals Using the Gradient Boosting Decision Tree: A Case Study in the Qinshui Basin, China. Energies. 2020; 13(20):5369. https://doi.org/10.3390/en13205369
Chicago/Turabian StyleZhang, Jiyuan, Qihong Feng, Xianmin Zhang, Qiujia Hu, Jiaosheng Yang, and Ning Wang. 2020. "A Novel Data-Driven Method to Estimate Methane Adsorption Isotherm on Coals Using the Gradient Boosting Decision Tree: A Case Study in the Qinshui Basin, China" Energies 13, no. 20: 5369. https://doi.org/10.3390/en13205369
APA StyleZhang, J., Feng, Q., Zhang, X., Hu, Q., Yang, J., & Wang, N. (2020). A Novel Data-Driven Method to Estimate Methane Adsorption Isotherm on Coals Using the Gradient Boosting Decision Tree: A Case Study in the Qinshui Basin, China. Energies, 13(20), 5369. https://doi.org/10.3390/en13205369