Article

Projecting the Price of Lithium-Ion NMC Battery Packs Using a Multifactor Learning Curve Model

by
Xaviery N. Penisa
1,2,
Michael T. Castro
1,
Jethro Daniel A. Pascasio
1,
Eugene A. Esparcia, Jr.
1,
Oliver Schmidt
3 and
Joey D. Ocon
1,2,*
1
Laboratory of Electrochemical Engineering (LEE), Department of Chemical Engineering, College of Engineering, University of the Philippines Diliman, Quezon City 1101, Philippines
2
Energy Engineering Program, National Graduate School of Engineering, College of Engineering, University of the Philippines Diliman, Quezon City 1101, Philippines
3
Centre for Environmental Policy, Imperial College London, London SW7 1NE, UK
*
Author to whom correspondence should be addressed.
Energies 2020, 13(20), 5276; https://doi.org/10.3390/en13205276
Submission received: 3 September 2020 / Revised: 1 October 2020 / Accepted: 2 October 2020 / Published: 11 October 2020
(This article belongs to the Section A1: Smart Grids and Microgrids)

Abstract

:
Renewable energy (RE) utilization is expected to increase in the coming years due to its decreasing costs and the mounting socio-political pressure to decarbonize the world’s energy systems. On the other hand, lithium-ion (Li-ion) batteries are on track to hit the target 100 USD/kWh price in the next decade due to economy of scale and manufacturing process improvements, evident in the rise in Li-ion gigafactories. The forecast of RE and Li-ion technology costs is important for planning RE integration into existing energy systems. Previous cost predictions on Li-ion batteries were conducted using conventional learning curve models based on a single factor, such as either installed capacity or innovation activity. A two-stage learning curve model was recently investigated wherein mineral costs were taken as a factor for material cost to set the floor price, and material cost was a major factor for the battery pack price. However, these models resulted in the overestimation of future prices. In this work, the future prices of Li-ion nickel manganese cobalt oxide (NMC) battery packs - a battery chemistry of choice in the electric vehicle and stationary grid storage markets - were projected up to year 2025 using multi-factor learning curve models. Among the generated models, the two-factor learning curve model has the most realistic and statistically sound results having learning rates of 21.18% for battery demand and 3.0% for innovation. By year 2024, the projected price would fall below the 100 USD/kWh industry benchmark battery pack price, consistent with most market research predictions. Techno-economic case studies on the microgrid applications of the forecasted prices of Li-ion NMC batteries were conducted. Results showed that the decrease in future prices of Li-ion NMC batteries would make 2020 and 2023 the best years to start investing in an optimum (solar photovoltaic + wind + diesel generator + Li-ion NMC) and 100% RE (solar photovoltaic + wind + Li-ion NMC) off-grid energy system, respectively. A hybrid grid-tied (solar photovoltaic + grid + Li-ion NMC) configuration is the best grid-tied energy system under the current net metering policy, with 2020 being the best year to deploy the investment.

1. Introduction

Renewable energy (RE) utilization is considered as one of the best solutions to combat climate change and other environmental concerns such as land and air pollution and carbon footprint [1,2,3]. However, their deployment into existing energy infrastructure is hampered by the intermittent nature of RE technologies such as solar photovoltaics (PV) and wind turbines [4]. Integrating energy storage technologies is important as they mitigate the intermittency of RE and perform additional functions such as load arbitrage, contingency reserves, and ramping [5]. Lithium-ion (Li-ion) batteries are attractive energy storage options for the power and transportation sectors [5,6]. This battery has six commercially available chemistries: lithium cobalt oxide (LCO), lithium manganese oxide (LMO), and lithium titanate (LTO) for low- to medium-power applications; and lithium iron phosphate (LFP), lithium nickel cobalt aluminum oxide (NCA), and lithium nickel manganese cobalt oxide (NMC) for medium- to high-power applications [7]. Among its chemistries, NMC is considered as the most financially sound, widely suitable, and environmentally friendly option. Moreover, the NMC market share is increasing for energy storage applications, electric vehicles (EV), and other high-power applications [8,9].
One of the key drivers towards the shift of Li-ion battery chemistry preference is the immense problem concerning cobalt (Co) metal due to its high price, market inelasticity, and associated socio-political issues [10]. Innovations in the NMC battery chemistry have therefore focused on reducing Co content while increasing nickel (Ni) content, which would further improve the energy density and reduce the price of the battery [10,11]. However, increasing Ni content promotes thermal runaway [12] due to localized oxidation which is prevented by the addition of manganese (Mn) in NMC [13,14]. Over the years, the Ni to Co ratio in NMC has been increased from NMC111 (33% Ni, 33% Mn, 33% Co) to NMC532 (50% Ni, 30% Mn, 20% Co), and then NMC622 (60% Ni, 20% Mn, 20% Co). Research and development (R&D) efforts are now focusing on NMC811 (80% Ni, 10% Mn, 10% Co) to further increase the battery capacity and reduce the material cost [15]. Recycling valuable materials such as Li and Co metals could also contribute to reducing the raw material and battery manufacturing costs, but the large-scale global recycling rate so far is less than 5%. Due to the technical, economic, and political barriers towards battery recycling, researchers have focused on developing lower-cost batteries with higher capacities and longer lifespans [16]. The material costs are also considered in the experience curve based on cost vs. units produced.
The price outlook for Li-ion batteries is encouraging as the battery pack volume-weighted average price is falling annually by 20% [14]. This price improvement is attributed to innovations in material science, increase in production, and increase in demand for energy storage technologies [17,18,19,20]. Previous works projected the future prices of Li-ion batteries using empirical models, including learning by scaling [17,18,19,20,21] and learning by innovation [19], to provide reasonable estimates. A modified two-stage learning curve model considered the practical limit on price reduction due to metal cost [10]. However, these models overestimated the actual price of a Li-ion battery pack, which was observed to be falling faster than the models’ predictions [14]. The overestimation occurs because the models do not account for the dynamic nature of supply and demand. In addition, Li-ion battery price estimates are typically agnostic to battery chemistries, thereby failing to consider that different elements have different supply chain dynamics, material costs, and synthesis costs. The specificity of the use-cases of each battery chemistry may yield different results. To the best of our knowledge, there are no published works yet on a chemistry-specific Li-ion battery pack price projection.
In this work, different learning curve models were developed to capture the effects of the factors and their interactions that contribute to the decline of Li-ion NMC battery pack prices. The factors incorporated are: (1) the demand for energy storage; (2) innovation; and (3) the price of raw metals. The future prices from the best model, based on statistical soundness and realistic results, were used to determine the levelized cost of electricity (LCOE) from 2020 to 2025 of an off-grid island and a commercial establishment. The LCOE determines the year in which investing in a RE system would be economically competitive.

2. Materials and Methods

2.1. General Approach

The general methodology is summarized in Figure 1. Historical data on the prices, cumulative demand, Patent Cooperation Treaty (PCT) applications, and raw material costs of Li-ion NMC are obtained. The future cost of Li-ion NMC is then forecasted from this data using different learning curve models. Cost projections from the best model are then taken as the Li-ion NMC capital cost in the HOMER Pro® microgrid optimization software. The software then calculates the optimum LCOE of energy systems in an off-grid island and a grid-tied commercial facility. The LCOE determines the best year for RE transition in both systems.

2.2. Learning Curves

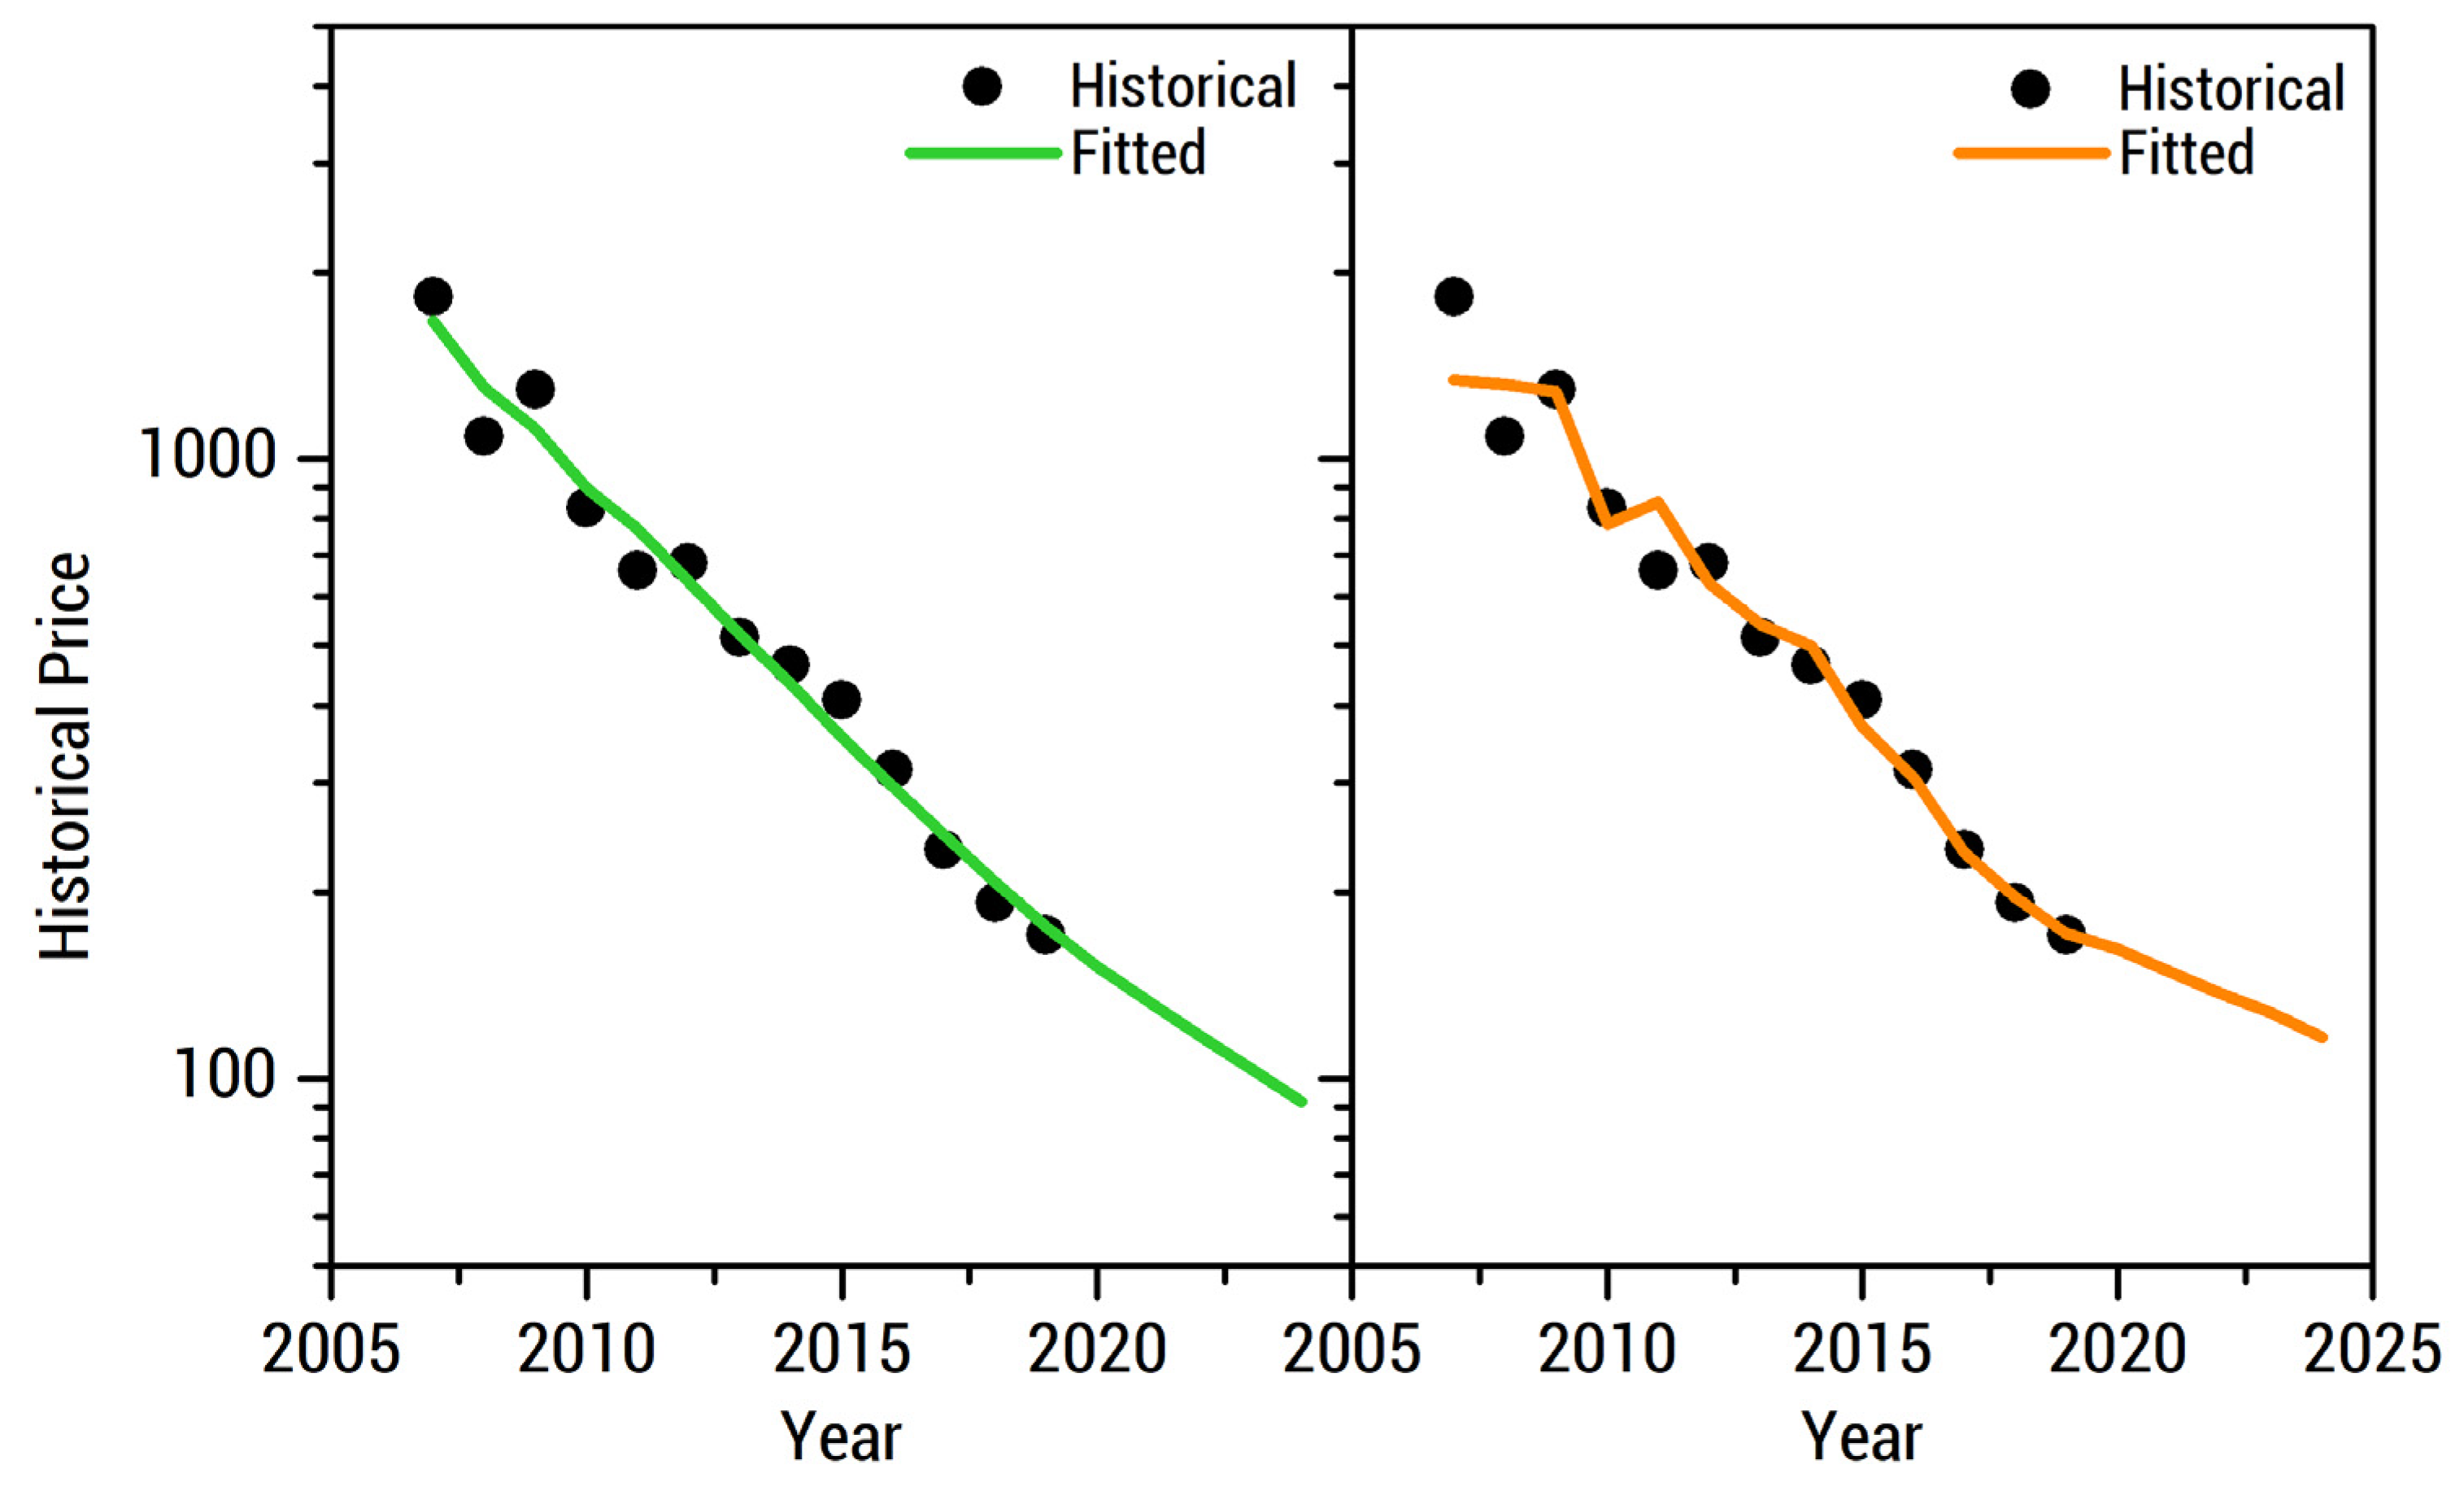
2.2.1. Single-Factor Learning Curve Models

The conventional learning curve model simplifies the price reduction dynamics of a new technology by aggregating closely related drivers into a single factor. The linearized form of this model is presented in Equation (1), wherein y is the dependent variable, x is a factor, and a i are the coefficients.
log y = α 0 + α 1 log x
This work considers price reductions due to the increasing demand for energy storage (learning by using) and R&D (learning by innovation). Application of the conventional learning curve yields Equations (2) and (3) wherein P is the battery price, D is the cumulative demand for Li-ion NMC, and I is the number of PCT applications.
log P = β 0 + β 1 log D
log P = κ 0 + κ 1 log I
Learning by using is represented by the cumulative demand for Li-ion NMC batteries, capturing both EV and stationary applications to consider the consumer side of the supply chain. It was assumed that NMC accounted for 53% of global shares, which is equal to its global EV market share [8]. The actual produce that yielded revenue is dictated by the magnitude of the demand as manufacturers tend to meet the supply-demand balance. R&D is geared towards increasing the energy density and reducing the battery price [11]. This is quantified by the number of PCT applications to avoid double counting similar patents and to only include high-value innovations [22]. Moreover, previous works in the energy sector have established that patent count is a valid indicator of technological progress [23,24].

2.2.2. Multi-Factor Learning Curve Models

A major issue about the conventional learning curve is that it fails to consider the relationship between two independent factors. Increasing battery storage demand is mainly driven by the transition into RE. The high energy density of Li-ion NMC batteries widens their applications from the EV market to energy systems, which contribute to its increased demand [25]. On the other hand, pertinent improvements on a technology are realized during actual product utilization [26].
This issue on conventional learning curve models is addressed by accounting for the price reduction contribution of the relationship of the independent factors in a multi-factor learning curve model. When multiple factors are considered, Equation (1) extends into Equation (4), wherein x i are the factors.
log y = a 0 + a 1 log x 1 + a 2 log x 2 + + a N log x N
Equation (4) can be truncated into two-factor and four-factor equations as shown in Equations (5) and (6), respectively. In these equations, the battery price is dependent on the cumulative demand for Li-ion NMC batteries, PCT count, Li metal price P L i , and Co price P C o [27,28].
log P = a 0 + a 1 log D + a 2 log I
log P = a 0 + a 1 log D + a 2 log I + a 3 log P L i + a 4 log P C o
The demand for both battery and PCT counts may both be increasing over the analysis period and this could result in a false correlation between the two. This correlation is removed by introducing a residual variable η defined in Equation (7) [27,28].
log I = b 0 + b 1 log D + η
Applying the residual variable in the two-factor and four-factor models yield Equations (8) and (9), respectively.
log P = c 0 + c 1 log D + c 2 η
log P = c 0 + c 1 log D + c 2 η + c 3 log P L i + c 4 log P C o

2.2.3. Cost Projection

The coefficients are determined by fitting the historical Li-ion NMC cumulative demand, PCT count, and raw material costs to the historical Li-ion NMC prices. The Li-ion NMC prices are then projected by evaluating the fitted model using the forecasted cumulative demand, PCT count, and raw material costs. The pertinent data is presented in Appendix A. The best cost projection model is selected using statistical tests and agreement with industry predictions.

2.3. Techno-Economic Case Study

Two case studies are analyzed in this work: the off-grid Sabtang Island in Batanes, Philippines and a grid-tied commercial shopping mall in the Philippines. Each case study involves multiple scenarios outlined in Table 1. In the off-grid case study, solar PV and wind were considered due to the low cost [4] and high energy potential of these technologies [29]. Philippine laws encourage the use of RE for off-grid generation [30,31]. As for the grid-tied case study, solar PV generation was employed because it potentially minimizes the energy costs compared to solely drawing power from the grid [32]. The LCOE in each year for each scenario was calculated in HOMER Pro® using the projected battery prices from 2020 to 2025 as the capital cost of the Li-ion battery. The schematic diagrams of the case studies are presented in Figure 2. The pertinent techno-economic parameters for the simulations are detailed in Appendix B, while the generation and demand profiles are shown in Appendix C.

3. Results

3.1. Learning Curves

3.1.1. Single-Factor Learning Curve Models

The conventional learning curve is fitted to historical data in Figure 3. This yields the learning rates, which are 25.28% and 35.88% for learning by using and learning by innovation, respectively. The projections based on the learning rates are shown in Figure 4. In both projections, the decrease in Li-ion NMC price is predicted to slow down. Bloomberg New Energy Finance (BNEF) predicted that the price of Li-ion battery packs in general would fall below the 100 USD/kWh benchmark price by 2024 at 94 USD/kWh. The price predictions of the single-factor learning curve models deviate from this forecast since the predicted price from learning by using is 115.14 USD/kWh, while learning by innovation resulted in 164.39 USD/kWh by 2024. Furthermore, the prices from the two single-factor learning curve models do not fall below the 100 USD/kWh benchmark within the analysis period, contrary to expert predictions in the Li-ion NMC battery industry [33].

3.1.2. Multi-Factor Learning Curve Models

The projections based on the two-factor and four-factor learning curve models are shown in Figure 5. Both cumulative Li-ion NMC battery demand and PCT count have a high correlation of 0.9684, which raises a multicollinearity issue on the multiple regression technique [34]. This is confirmed by the variance inflation factor (VIF) of 16.08. The correlation issue was resolved by introducing a residual variable, which resulted in an almost zero correlation and a VIF of 1. The two-factor learning curve model resulted in a 21.18% learning rate for Li-ion NMC battery demand and a 3% price decrease for every 100 PCT patents filed. Lower forecast error on prices was observed, especially from 2015 to 2019, compared to that of the single-factor learning curve model.
The four-factor learning curve examined the omitted variable bias using Li and Co metal prices. The costs of other vital components of batteries such as Ni and graphite can also be considered, but Li and Co were primarily chosen due to their immediate supply chain concerns [10]. Regardless of the battery components considered as factors on the model, it is expected that the increasing costs of any battery component would result in higher predicted prices of battery packs. The model resulted in a 25.94% learning rate for the doubling of demand, a 0.3% increase for every 100 PCT patents filed, and an 8.25% increase and a 6.46% decrease when the price of Li and Co, respectively, is doubled. Although econometric analysis is in the context of hypothesis generation instead of hypothesis testing and analysis using the p-value may provide inferential limitations [35], all variables are statistically insignificant, suggesting that the whole model is insignificant. This model might lead to inaccurate results when used for price prediction.
The future prices of Li-ion NMC batteries were overestimated using the conventional single-factor learning curve models (Figure 4). Meanwhile, the cost prediction of the two-factor learning curve model is relatively lower because the contributions of both factors were accounted in the battery pack price reduction. Considering the four-factor learning curve model resulted in higher predicted prices, but did not follow an increasing trend, contrary to the BNEF report [20]. Although there will be contributions to the battery pack price when Li and Co metal prices increase, these are still less than the weight of the demand for battery storage and innovation. The results agree with the BNEF market research that doubling the prices of both metals would only increase battery pack prices by 5–10% [36].
As discussed earlier, the BNEF report predicted that the price of Li-ion battery packs would fall below the 100 USD/kWh benchmark price by 2024 at 94 USD/kWh. The results of the two-factor learning curve are comparable with this projection among tested models. Note that battery prices may still fall lower than the projected prices [20]. The forecasts of the two-factor learning curve model would be more plausible, especially if the demand for Li-ion NMC batteries continues to accelerate. If the demand for Li-ion NMC batteries were to increase by 33% each year, then its price would be less than 100 USD/kWh by 2023.

3.2. Case Studies

3.2.1. Off-Grid Electrification of Sabtang Island

This case study applies the results of the two-factor learning curve model to determine the future LCOE of the two different off-grid energy systems—optimum and 100% RE. The calculated future LCOE are then compared with the future generation cost of a diesel-only system to determine the year in which investing in the optimum or 100% RE system would be economically competitive. The generation cost of the diesel-only system is highly dependent on volatile diesel fuel prices. The average price of diesel in the Philippines is 0.9 USD/L in 2019 and is assumed to increase at an average annual inflation rate of 3.8% in the country. With a 24.91 PHP/kWh (~0.50 USD/kWh) true cost of generation rate (TCGR) in Sabtang Island as of 2019 [37], the future generation cost of the diesel-only system was determined using the relationship between the diesel price and diesel electrification cost [38] as shown in Figure 6, together with the LCOE of the optimum and 100% RE energy systems from 2020 to 2025. The optimum energy system, which utilizes solar PV, wind, Li-ion NMC, and a diesel generator, yielded a LCOE lower than that of the diesel-only system as early as 2020. A LCOE reduction of more than 50% is expected when RE technologies and Li-ion NMC are integrated into the existing diesel systems. This is more than the 20% average cost reduction when only solar PV and batteries are utilized [38]. In the 100% RE scenario, only solar PV, wind, and Li-ion NMC are utilized. The LCOE of this system will fall below that of the diesel-only system in 2023 at 0.43 USD/kWh. In either case, the decreasing LCOE up to 2025 can be attributed to the decreasing Li-ion NMC battery price.
The results suggest that integrating the optimum system can be achieved in 2020, while investing in the 100% RE system can be achieved by 2023. Both scenarios also suggest investing in the succeeding years to lower the required investment. The results of both scenarios agree with previous work, stating that integrating solar PV, wind, and battery storage into the current diesel-powered energy system would reduce the investment, maintenance, and diesel consumption costs [39]. LCOE reduction in the following years is attributed to the decreasing prices of Li-ion NMC batteries and solar PV, which improve the economic competitiveness [38] and rapid adoption of RE resources.

3.2.2. Grid-Tied Electrification of a Commercial Mall in the City of Manila

This case study applies the predicted prices of Li-ion NMC battery packs based on the two-factor learning curve model. The future LCOE of the different scenarios presented in Table 1 were compared with the average cost of electricity from the grid (0.20 USD/kWh). Figure 7 shows the LCOE of each grid-tied scenario throughout the analysis period (2020 to 2025). The results show that the NM-100 kW and NM-Open scenarios do not require batteries, in agreement with market reports from solar PV producers [40,41] for a grid-tied and net-metered solar PV system. The net-metered, open capacity (NM-Open) scenario resulted in the lowest LCOE throughout the analysis period. However, this scenario is not possible with the current policies in the Philippines. Thus, the only possible scenario for the mall is the NoNM-Open solar PV-battery (hybrid grid-tied) system. It would require the establishment to install 262 kW of solar PV and 25 kWh of Li-ion NMC, which would save 12% on electricity costs in the year 2020. Using this system, the annual energy generation of the PV-battery system would be 2.40 GWh, which is 95.7% of the annual grid purchases of the mall. The scenario is feasible because the roof area of the mall can hold a maximum solar PV capacity of 1745 kW.

4. Discussion

Econometric models such as the learning curves used in this work are very useful tools for short-term price projection due to their simplicity and wide data availability. Learning by doing and economies of scale are considered to be among the most applicable learning curve models in predicting future prices of new and emerging technologies [26]. Learning by doing performs slightly better than economies of scale because of the inherent learning effect from the exponential increase in cumulative production with respect to time [42]. Learning by innovation is represented by patent data due to its correlation with R&D investment and financial output. PCT count is a more appropriate indicator because it accounts for high quality R&D outputs [43]. Data availability is less of an issue for patents because of the wide range of market reports and patent databases. In contrast, using R&D expenditure as a metric does not directly provide insights on the technological and economic quality of R&D outputs. One of the main limitations of the single-factor learning curve is that it aggregates the price reduction effects of different independent factors [26]. Previous work indicates that providing more historical data and including additional factors, such as R&D and patent applications, improve the forecasting power of a conventional learning curve model [44]. However, collinearity emerges among the independent variables of a multi-factor learning curve model, mimicking the said limitation of the single-factor learning curve and resulting in imprecise coefficient values in the model [45]. This issue was addressed in the two-factor learning curve model by introducing a residual variable [46], decreasing the VIF, and removing the correlation between the two factors. The four-factor learning curve model performed the worst as it was too complex for the given historical data and resulted in overfitting. The model fails to generalize the available dataset and yields misleading predicted values [47,48].
The two-factor learning curve model suggests that the price of Li-ion NMC battery packs will fall below the 100 USD/kWh benchmark by 2024, following the average annual 11% demand growth for Li-ion NMC. The economic feasibility and competitiveness of new energy storage technologies in the EV market and energy systems, among other applications, can be determined at this price point [49,50]. In 2016, only pumped heat electrical storage and compressed-air energy storage fell below 100 USD/kWh while flooded and valve regulated lead-acid batteries nearly reached the price point [51]. These energy storage technologies have limited applicability, which is why Li-ion batteries are gaining market demand despite the elevated prices. The market share of Li-ion NMC is expected to continue increasing in the following years due to its versatility and high learning rate.
The projection given by the two-factor learning curve model is expected to occur as demand from the EV and power industries continue to increase. Based on a McKinsey and Co. study, the global EV market is growing at 60% per year as competition among manufacturers is increasing and the relevant policies and regulations are becoming more stringent [52]. In the power industry, RE capacity continues to increase and currently accounts for a third of the total global energy capacity wherein hydropower, wind energy, and solar energy are the top contributors. Solar energy utilization increased globally by 94 GW (+24%) from 2018 to 2019, with 70% coming from Asia while capacity increase of 49 GW was realized for wind energy [53]. As of 2018, solar and wind energy account for 3% of the global energy capacity, but the rate of deployment has been around ten-fold since the past decade. In the next five years, a 50% increase in the total RE capacity is expected due to the falling prices of solar PV and technological advancements in wind energy. Sixty percent of the expected capacity growth is attributed to the increasing solar PV installations in Europe and Asia, and 30% is due to onshore and offshore wind energy [54]. Both solar and wind energy will continue to expand their global energy share at increasing rates.
Market reports show that recent developments on Li-ion batteries have focused on improving NMC characteristics. Composite electrodes of NMC-based cathodes are believed to have a major role in the performance of Li-ion batteries in EV and energy storage applications [55]. Tesla was recently granted a patent for dioxazolones and nitrile sulfites as electrolyte additives [56]. Manufacturers are also keen on reducing Co content by commercializing Ni-rich NMC 811, which LG Chem claimed to have already successfully manufactured [57]. Some market leaders such as Contemporary Amperex Technology Co. Limited (CATL) have even claimed to reach the 100 USD/kWh Li-ion NMC battery pack price point already [33], which is far from the results of the model in this work. This discrepancy can be attributed to the use of a weighted average battery price in the model and/or non-transparent pricing information from battery manufacturers. This is the main limitation of learning curve models as prices greatly vary among manufacturers. Price reduction will support the market growth of Li-ion NMC batteries in power systems where the increasing solar PV and wind energy deployment is observed [58]. Li-ion NMC will continue being the top choice for energy storage applications for nearly another decade with a 35% market share, followed by LFP and NCA with a 40% combined market share [11,58].
The case studies presented in this work introduced an application of battery price predictions, which is to determine the most economical year to invest in an energy system integrated with RE. In the off-grid electrification study, results showed that the future LCOE of the optimum (solar PV + wind + diesel generator + Li-ion NMC) and 100% RE (solar PV + wind + Li-ion NMC) systems would be lower than the generation cost of the diesel-only system within the analysis period. The best year to start investing in either system is then determined. This agrees with a previous study on off-grid islands that integrating RE into diesel-only systems would result in reduced generation costs [38,59]. Due to the similarities between the techno-economic characteristics of neighboring islands in the Philippines, clustering can be performed in future off-grid studies [60,61]. The application of the model-based simulations presented in this work may also be extended in studying interconnected microgrid systems. Furthermore, this model can be used to analyze energy-intensive technologies such as desalination for water generation in off-grid islands [62]. The economic viability of integrating solar PV to grid-tied energy systems was also presented in this work. Given the net metering policy limitations in the Philippines, the results showed that hybrid grid-tied (solar PV + Li-ion NMC) systems without net metering would be the best system to invest in, and the best year to start investing falls within the analysis period. Lower generation costs are realized with a high-capacity solar PV system with net metering, but this would require amendments on the current net metering policy [32].

5. Conclusions

This work investigated the different learning curve models considering the demand for Li-ion NMC battery, R&D, and Li and Co metal prices as cost reduction factors. Among the generated models, the two-factor learning curve model has the most statistically sound and realistic results. Using this model, the future prices of Li-ion NMC battery packs are comparable to the projected in Li-ion battery prices as reported by market experts. Results also suggest that the prices of Li and Co metals have little effect on the price movement of the battery pack within the analysis period. It was found that other econometric factors, such as RE investment and related policies, could also contribute to the price reduction of this Li-ion battery chemistry. The techno-economic analysis on an off-grid island showed that investing in an optimum system (solar PV + wind + diesel generator + Li-ion NMC) and 100% RE system (solar PV + wind + Li-ion NMC) would be economically competitive with the existing diesel-only systems in off-grid islands within the analysis period. In a grid-tied system, integrating a non-net metered solar PV + Li-ion NMC system would be economically competitive by 2020, which would result in reduced electricity costs for grid-tied systems. Future work will focus on investigating other econometric factors and combinations thereof, interaction models, and learning curve model modifications, to further improve the forecasting accuracy. Other use-case applications can be also explored as they could yield different results.

Author Contributions

Conceptualization, methodology, validation, and formal analysis was conducted by X.N.P., O.S. and J.D.O. Writing—original draft preparation was done by X.N.P. and M.T.C. Writing—review and editing and supervision was conducted by M.T.C., J.D.A.P., E.A.E.J. and J.D.O. Funding acquisition was conducted by J.D.O. All authors have read and agreed to the published version of the manuscript.

Funding

This research is part of the Energy Research Fund (ERF) project entitled “ElectriPHI—Electrification Planning in Small Off-grid Islands in the Philippines” funded through the University of the Philippines Office of the Vice-President for Academic Affairs (UP OVPAA) and the Senate Committee on Energy led by Sen. Sherwin T. Gatchalian.

Acknowledgments

J.D.O. would like to acknowledge the Federico Puno Professorial Chair Award and the US-ASEAN Science & Technology Fellowship. X.N.P. and M.T.C. would like to acknowledge the Department of Science and Technology Engineering Research and Development for Technology (DOST-ERDT) program for the graduate scholarship support.

Conflicts of Interest

The authors declare no conflict of interest.

Appendix A

The historical and projected data used in the study are presented in Table A1, while the basis of the data and projections are discussed in Table A2.
Table A1. Historical and forecasted values of the different factors in the learning curve models.
YearPrice
[USD2018/kWh]
NMC Cumulative Demand [GWh]Cumulative PCT CountLi Metal Price
[USD/t]
Co Metal Price [USD/t]
20071824.4121424321.9174,832.08
20081087.2242585237.05109,980.50
20091294.0663635364.6696,238.51
2010834.42115065070.3754,760.50
2011661.17167304371.0143,291.51
2012680.232610464668.2934,552.50
2013514.504114504784.5826,618.75
2014464.926119315417.2229,072.89
2015407.959624186965.7036,290.42
2016314.9914129007830.4524,996.06
2017234.0521133239318.4038,243.72
2018192.49311377016,500.0080,490.68
2019170.62441424010,492.2735,993.58
2020 585475711,060.9734,089.25
2021 745523311,629.6732,184.92
2022 923575612,198.3730,280.58
2023 1121633212,767.0728,376.25
2024 1340696513,335.7726,471.92
2025 1583766113,904.4724,567.59
Table A2. Sources of the historical and forecasted data.
DataMethodology
Historical Li-ion NMC PriceConverted prices from journals and market reports [20,50] to USD2018 using the consumer price index (CPI), then averaged.
Historical Cumulative DemandFrom [63].
Historical
PCT Count
Data from 2007 to 2016 was obtained from [64]. Data from 2017 to 2019 was extrapolated using simple regression analysis.
Historical Raw Material CostFrom [65].
Projected
Cumulative Demand
Based on the compound annual growth rate of 11% in demand of Li-ion battery in the EV market [63].
Projected
PCT Count
Based on the average growth rate (10%) of PCT applications form 2007–2017 [64].
Projected
Material Cost
Based on regression analysis.

Appendix B

The techno-economic parameters are shown in Table A3. Variable parameters are shown in Table A4.
Table A3. Techno-economic parameters used in the case studies.
ComponentParameterUnitValue
Solar PVCapExUSD/kWVariable
OpExUSD/kW-y140
Derating%80
Lifetimey25
WindCapExUSD/kWVariable
OpExUSD/kW-y140
Lifetimey20
Li-ionCapExUSD/kWVariable
OpExUSD/kW-y0.10
Min. SOC%20
C-ratekW/kWh1
Lifetimey15
DieselCapExUSD/kW0
(Island only)OpExUSD/kWh0.11
RepExUSD/kW600
Fuel CostUSD/L0.9
Lifetimeh15,000
ProjectCapExUSDFootnote 1
Inflation%3.19
Lifetimey25
1 +50% of total component capital cost.
Table A4. Sources of the historical and forecasted data.
YearSolar PV 1
[USD/kW]
Wind 2
[USD/kW]
202020003051
202118103147
202216203462
202314303635
202412403817
202510504007
1 The 2020 price is based on a local supplier of solar PV panels. This should decrease to 1430 USD/kW in four years with a learning rate of 28.5 [66]. 2 The 2019 price is 3000 USD/kW [59] and this is expected to increase by 5% after 2 years due to increasing costs for wind turbine manufacture [67].

Appendix C

Appendix C.1. Sabtang Island

The global horizontal irradiance (GHI) and wind speed in the island are shown in Figure A1. These were downloaded via HOMER Pro® from the National Renewable Energy Laboratory (NREL) and the National Aeronautics and Space Administration (NASA), respectively. The hourly and monthly average energy consumption is shown in Figure A2. These were obtained from the Batanes Electric Cooperative, Inc.
Figure A1. Renewable energy data in Sabtang Island—GHI (top) and wind speed (bottom).
Energies 13 05276 g0a1
Figure A2. Hourly (left) and monthly (right) average load consumption in Sabtang Island.
Energies 13 05276 g0a2

Appendix C.2. Commercial Mall

The GHI in the commercial mall is shown in Figure A3. This was downloaded via HOMER Pro® from NREL. The hourly and monthly average energy consumption is shown in Figure A4. This was obtained from the utility company, Manila Electric Co. (MERALCO).
Figure A3. Solar energy (GHI) data in Metro Manila where the commercial mall is situated.
Energies 13 05276 g0a3
Figure A4. Hourly (left) and monthly (right) average load consumption in the commercial mall.
Energies 13 05276 g0a4

References

  1. Phuangpornpitak, N.; Tia, S. Opportunities and challenges of integrating renewable energy in smart grid system. Energy Procedia 2013, 34, 282–290. [Google Scholar] [CrossRef] [Green Version]
  2. Panwar, N.L.; Kaushik, S.C.; Kothari, S. Role of renewable energy sources in environmental protection: A review. Renew. Sustain. Energy Rev. 2011, 15, 1513–1524. [Google Scholar] [CrossRef]
  3. Singh, D.; Sharma, N.K.; Sood, Y.R.; Jarial, R.K. Global status of renewable energy and market: Future prospectus and target. IET Conf. Publ. 2011, 2011, 171–176. [Google Scholar] [CrossRef]
  4. Tafarte, P.; Kanngießer, A.; Dotzauer, M.; Meyer, B.; Grevé, A.; Millinger, M. Interaction of electrical energy storage, flexible bioenergy plants and system-friendly renewables in wind- or solar PV-dominated Regions. Energies 2020, 13, 1133. [Google Scholar] [CrossRef] [Green Version]
  5. Denholm, P.; Ela, E.; Kirby, B.; Milligan, M. The Role of Energy Storage with Renewable Electricity Generation; Technical Report NREL/TP-6A2-47187; National Renewable Energy Laboratory: Golden, CO, USA, 2010. [Google Scholar] [CrossRef] [Green Version]
  6. Mehr, T.H.; Masoum, M.A.S.; Jabalameli, N. Grid-connected Lithium-ion battery energy storage system for load leveling and peak shaving. In Proceedings of the Australas. Universities Power Engineering Conference AUPEC, Hobart, Australia, 29 September–3 October 2013. [Google Scholar] [CrossRef]
  7. Buchmann, I. Types of Lithium-Ion Batteries. 2019. Available online: https://batteryuniversity.com/learn/article/types_of_lithium_ion (accessed on 30 April 2020).
  8. Tsiropoulos, I.; Tarvydas, D.; Lebedeva, N. Li-Ion Batteries for Mobility and Stationary Storage Applications; Publications Office of the European Union: Petten, The Netherlands, 2018; ISBN 978-92-79-97254-6. [Google Scholar]
  9. Jürgens, J. This Is Why NCM Is the Preferable Cathode Material for Li-Ion Batteries. 2019. Available online: https://lghomebatteryblog.eu/en/this-is-why-ncm-is-the-preferable-cathode-material-for-li-ion-batteries (accessed on 30 April 2020).
  10. Hsieh, I.Y.L.; Pan, M.S.; Chiang, Y.M.; Green, W.H. Learning only buys you so much: Practical limits on battery price reduction. Appl. Energy 2019, 239, 218–224. [Google Scholar] [CrossRef]
  11. Baes, K.; Carlot, F.; Ito, Y.; Kolk, M.; Merhaba, A. Future of Batteries. Winner Takes All? 2018. Available online: https://www.adlittle.com/sites/default/files/viewpoints/adl_future_of_batteries-min.pdf (accessed on 30 April 2020).
  12. Ouyang, D.; Chen, M.; Huang, Q.; Weng, J.; Wang, Z.; Wang, J. A Review on the thermal hazards of the lithium-ion battery and the corresponding countermeasures. Appl. Sci. 2019, 9, 2483. [Google Scholar] [CrossRef] [Green Version]
  13. Ouyang, M.; Dueñas-Osorio, L. Multi-dimensional hurricane resilience assessment of electric power systems. Struct. Saf. 2014, 10, 933. [Google Scholar] [CrossRef]
  14. Scot, L. A Behind the Scenes Take on Lithium-Ion Battery Prices. 2019. Available online: https://about.bnef.com/blog/behind-scenes-take-lithium-ion-battery-prices/ (accessed on 30 April 2020).
  15. Li, B.M.; Lu, J. Cobalt in lithium-ion batteries. Science 2020, 367, 979–980. [Google Scholar] [CrossRef]
  16. Jacoby, M. It’s time to recycle lithium-ion batteries. CEn Glob. Enterp. 2019, 97, 29–32. [Google Scholar] [CrossRef] [Green Version]
  17. Schmidt, O.; Hawkes, A.; Gambhir, A.; Staffell, I. The future cost of electrical energy storage based on experience rates. Nat. Energy 2017, 2, 1–8. [Google Scholar] [CrossRef]
  18. Nykvist, B.; Nilsson, M. Rapidly falling costs of battery packs for electric vehicles. Nat. Clim. Chang. 2015, 5, 329–332. [Google Scholar] [CrossRef]
  19. Kittner, N.; Lill, F.; Kammen, D.M. Energy storage deployment and innovation for the clean energy transition. Nat. Energy 2017, 2, 1–6. [Google Scholar] [CrossRef]
  20. Bloomberg New Energy Finance. 2018 Lithium-ion battery price survey. Propr. Inf. 2019.
  21. Berckmans, G.; Messagie, M.; Smekens, J.; Omar, N.; Vanhaverbeke, L.; Mierlo, J. Van Cost projection of state of the art lithium-ion batteries for electric vehicles up to 2030. Energies 2017, 10, 1314. [Google Scholar] [CrossRef] [Green Version]
  22. Van pottelsberghe de la potterie, B. The quality factor in patent systems. Ind. Corp. Chang. 2011, 20, 1755–1793. [Google Scholar] [CrossRef] [Green Version]
  23. Lindman, Å.; Söderholm, P. Wind energy and green economy in Europe: Measuring policy-induced innovation using patent data. Appl. Energy 2016, 179, 1351–1359. [Google Scholar] [CrossRef]
  24. Margolis, R.M.; Kammen, D.M. Underinvestment: The energy technology and RandD policy challenge. Science 1999, 285, 690–692. [Google Scholar] [CrossRef] [Green Version]
  25. GlobeNewswire. Research and Markets Global $94+ Bn Lithium-Ion Battery Market by Type, Power Capacity, Industry, Voltage and Region—Forecast to 2025. 2020. Available online: https://www.globenewswire.com/news-release/2020/04/21/2019319/0/en/Global-94-Bn-Lithium-Ion-Battery-Market-by-Type-Power-Capacity-Industry-Voltage-and-Region-Forecast-to-2025.html (accessed on 11 May 2020).
  26. Wiesenthal, T.; Dowling, P.; Morbee, J.; Thiel, C.; Schade, B.; Russ, P.; Simoes, S.; Peteves, S.; Schoots, K.; Londo, M. Technology Learning Curves for Energy Policy Support; European Commisson: Seville, Spain, 2012; ISBN 9789279256769. [Google Scholar]
  27. Qiu, Y.; Anadon, L.D. The price of wind power in China during its expansion: Technology adoption, learning-by-doing, economies of scale, and manufacturing localization. Energy Econ. 2012, 34, 772–785. [Google Scholar] [CrossRef]
  28. Zheng, C.; Kammen, D.M. An innovation-focused roadmap for a sustainable global photovoltaic industry. Energy Policy 2014, 67, 159–169. [Google Scholar] [CrossRef]
  29. International Renewable Energy Agency. Renewables Readiness Assessment: The Philippines; IREA: Abu Dhabi, UAE, 2017; ISBN 9789292600037. [Google Scholar]
  30. Congress of the Philippines Republic Act No. 9513—Renewable Energy Act of 2008. Available online: https://www.officialgazette.gov.ph/2008/12/16/republic-act-no-9513/ (accessed on 13 May 2020).
  31. Department of Energy Omnibus Guidelines on Enhancing Off-Grid Power Development and Operation 2019. Available online: https://www.doe.gov.ph/sites/default/files/pdf/issuances/dc2019-01-0001.PDF (accessed on 13 May 2020).
  32. Jara, P.G.; Castro, M.; Esparcia, E.; Odulio, C.M.; Ocon, J.D. Cost Saving Potential of Grid-tied Solar Photovoltaic-based Hybrid Energy System in the Philippine Industrial Sector. Chem. Eng. Trans. 2019, 76, 937–942. [Google Scholar] [CrossRef]
  33. Shirouzu, N.; Lienert, P. Tesla’s Secret Batteries Aim to Rework the Math for Electric Cars and the Grid. 2020. Available online: https://www.reuters.com/article/us-autos-tesla-batteries-exclusive/exclusive-teslas-secret-batteries-aim-to-rework-the-math-for-electric-cars-and-the-grid-idUSKBN22Q1WC (accessed on 6 June 2020).
  34. Shi, R.; Conrad, S.A. Correlation and regression analysis. Ann. Allergy Asthma Immunol. 2009, 103, 35–41. [Google Scholar] [CrossRef]
  35. Hirschauer, N.; Grüner, S.; Mußhoff, O.; Becker, C. Pitfalls of significance testing and p-value variability: An econometrics perspective. Stat. Surv. 2018, 12, 136–172. [Google Scholar] [CrossRef]
  36. Bloomberg NEF. Lithium Price Spike Has Moderate Effect on Batteries. 2017. Available online: https://about.bnef.com/blog/lithium-price-spike-has-moderate-effect-on-batteries/ (accessed on 5 June 2020).
  37. National Power Corporation. True Cost of Generation Rate of NPC-SPUG per Area. 2019. Available online: https://www.foi.gov.ph/requests/aglzfmVmb2ktcGhyIQsSB0NvbnRlbnQiFE5BUE9DT1ItMjM2Mjc1MzY0NzU1DA (accessed on 30 April 2020).
  38. Ocon, J.D.; Bertheau, P. Energy transition from diesel-based to solar photovoltaics-battery-diesel hybrid system-based island grids in the Philippines—Techno-economic potential and policy implication on missionary electrification. J. Sustain. Dev. Energy Water Environ. Syst. 2019, 7, 139–154. [Google Scholar] [CrossRef]
  39. Hong, Y.Y.; Lai, Y.M.; Chang, Y.R.; Lee, Y.D.; Liu, P.W. Optimizing capacities of distributed generation and energy storage in a small autonomous power system considering uncertainty in renewables. Energies 2015, 8, 2473–2492. [Google Scholar] [CrossRef] [Green Version]
  40. Laminar Smooth Transitions. Solar Panel Energy Flow to Grid—Net Metering. Available online: https://www.laminar.com/utility-interaction (accessed on 15 June 2020).
  41. Glenn, H. Can I Use Solar Panels without A Battery? 2018. Available online: https://www.solar.com/learn/can-i-use-solar-panels-without-a-battery/ (accessed on 15 June 2020).
  42. Nagy, B.; Farmer, J.D.; Bui, Q.M.; Trancik, J.E. Statistical Basis for Predicting Technological Progress. PLoS ONE 2013, 8, e52669. [Google Scholar] [CrossRef] [PubMed] [Green Version]
  43. Dang, J.; Motohashi, K. Patent statistics: A good indicator for innovation in China? Assessment of impacts of patent subsidy programs on patent quality. China Econ. Rev. 2015, 35, 137–155. [Google Scholar] [CrossRef]
  44. Farmer, J.D.; Lafond, F. How predictable is technological progress? Res. Policy 2016, 45, 647–665. [Google Scholar] [CrossRef] [Green Version]
  45. Yoo, W.; Mayberry, R.; Bae, S.; Singh, K.; He, Q.; Lillard, J. A Study of Effects of Multicollinearity in the Multivariable Analysis. Int. J. Appl. Sci. Technol. 2014, 4, 9–19. [Google Scholar] [PubMed]
  46. Fazal, R.; Rehman, S.A.U.; Rehman, A.U.; Bhatti, M.I.; Hussain, A. Energy-environment-economy causal nexus in Pakistan: A graph theoretic approach. Energy 2021, 214, 118934. [Google Scholar] [CrossRef]
  47. Ghojogh, B.; Crowley, M. The Theory Behind Overfitting, Cross Validation, Regularization, Bagging, and Boosting: Tutorial. arXiv 2019, arXiv:1905.127.87. [Google Scholar]
  48. Babyak, M. What You See May Not Be What You Get: A Brief, Nontechnical Introduction to Overfitting in Regression-Type Models. Psychosom Med. 2004, 66, 411–421. [Google Scholar] [CrossRef]
  49. Chaianong, A.; Bangviwat, A.; Menke, C.; Breitschopf, B.; Eichhammer, W. Customer economics of residential PV–battery systems in Thailand. Renew. Energy 2020, 146, 297–308. [Google Scholar] [CrossRef]
  50. Nykvist, B.; Sprei, F.; Nilsson, M. Assessing the progress toward lower priced long range battery electric vehicles. Energy Policy 2019, 124, 144–155. [Google Scholar] [CrossRef]
  51. World Energy Council. Energy Storage Monitor—Latest Trend in Energy Storage. 2019. Available online: https://www.worldenergy.org/assets/downloads/ESM_Final_Report_05-Nov-2019.pdf (accessed on 12 May 2020).
  52. Hertzke, P.; Müller, N.; Schaufuss, P.; Schenk, S.; Wu, T. Expanding Electric-Vehicle Adoption Despite EV Market Growing Pains. 2019. Available online: https://www.mckinsey.com/industries/automotive-and-assembly/our-insights/expanding-electric-vehicle-adoption-despite-early-growing-pains (accessed on 12 May 2020).
  53. International Renewable Energy Agency. Renewable Energy Now Accounts for a Third of Global Power Capacity. 2019. Available online: https://www.irena.org/newsroom/pressreleases/2019/Apr/Renewable-Energy-Now-Accounts-for-a-Third-of-Global-Power-Capacity (accessed on 12 May 2020).
  54. International Energy Agency. Renewables 2019. 2019. Available online: https://www.iea.org/reports/renewables-2019# (accessed on 12 May 2020).
  55. Smekens, J.; Gopalakrishnan, R.; Van den Steen, N.; Omar, N.; Hegazy, O.; Hubin, A.; Van Mierlo, J. Influence of electrode density on the performance of Li-ion batteries: Experimental and simulation results. Energies 2016, 9, 104. [Google Scholar] [CrossRef] [Green Version]
  56. Dahn, J.; Hall, D.; Hynes, T. Dioxazolones and nitrile sulfites as electrolyte additives for lithium-ion batteries. J. Electrochem. Soc. 2019, 165, A2961–A2967. [Google Scholar] [CrossRef]
  57. LeVine, S. A New Battery Breakthrough That Could Save Electric Vehicles During a Recession. 2020. Available online: https://marker.medium.com/a-new-battery-breakthrough-that-could-save-electric-vehicles-during-a-recession-c193ebdd3a5d (accessed on 12 May 2020).
  58. Zubi, G.; Dufo-López, R.; Carvalho, M.; Pasaoglu, G. The lithium-ion battery: State of the art and future perspectives. Renew. Sustain. Energy Rev. 2018, 89, 292–308. [Google Scholar] [CrossRef]
  59. Pascasio, J.D.A.; Esparcia, E.J.A.; Odulio, C.M.F.; Ocon, J.D. High Renewable Energy (Solar Photovoltaics and Wind) Penetration Hybrid Energy Systems for Deep Decarbonization in Philippine Off-grid Areas. Chem. Eng. Trans. 2019, 76, 1135–1140. [Google Scholar] [CrossRef]
  60. Agua, O.F.B.; Basilio, R.J.A.; Pabillan, M.E.D.; Castro, M.T.; Blechinger, P.; Ocon, J.D. Decentralized versus clustered microgrids: An energy eystem etudy for reliable off-grid electrification of small islands. Energies 2020, 13, 4454. [Google Scholar] [CrossRef]
  61. Meschede, H.; Esparcia, E.J.A.; Holzapfel, P.; Bertheau, P.; Ang, R.C.; Blanco, A.C.; Ocon, J.D. On the transferability of smart energy systems on off-grid islands using cluster analysis—A case study for the Philippine archipelago. Appl. Energy 2019, 251, 113290. [Google Scholar] [CrossRef]
  62. Castro, M.T.; Alcanzare, M.; Esparcia, E.J.A.; Ocon, J.D. A comparative techno-economic analysis of different desalination technologies in off-grid islands. Energies 2020, 13, 2261. [Google Scholar] [CrossRef]
  63. Pillot, C. Current Status and Future Trends of the Global Li-ion Battery Market. Avicenne Energy 2018, 4. Available online: https://www.charles-hatchett.com/public/images/documents/2018/dr_christophe_pillot_current_status_and_future_trends_of_the_global_li-ion_battery_market.pdf (accessed on 30 April 2020).
  64. KnowMade. NMC Lithium-Ion Batteries Patent Landscape Analysis. 2017. Available online: https://www.knowmade.com/wp-content/uploads/2017/07/NMC-Li-ion-Batteries-Patent-Landscape-2017-SAMPLE.pdf (accessed on 30 April 2020).
  65. Metalary. Price History of Lithium and Cobalt Metals. Available online: https://www.metalary.com (accessed on 30 April 2020).
  66. van der Leun, K. Solar PV Shows a Record Learning Rate: 28.5% Reduction in Cost per Watt for Every Doubling Cumulative Capacity. 2018. Available online: http://www.rapidshift.net/solar-pv-shows-a-record-learning-rate-28-5-reduction-in-cost-per-watt-for-every-doubling-of-cumulative-capacity/ (accessed on 12 May 2020).
  67. Totaro, P. Wind Turbine Prices to Recover 5% in the Next 2 Years. 2019. Available online: https://renewablesnow.com/news/analysis-wind-turbine-prices-to-recover-5-in-next-2-years-673526/ (accessed on 12 May 2020).
Figure 1. Flowchart of the general research approach. Li-ion nickel manganese cobalt oxide (NMC) prices, demand, patent applications, and raw material prices are used to generate the best cost projection model. The load profile of the off-grid island and commercial establishment, projected costs of energy generators and Li-ion NMC, and other techno-economic parameters are required in the analysis with HOMER Pro®. The results are then used to determine the optimum levelized cost of electricity (LCOE) and the best year to invest in renewable energy (RE)-based generation.
Energies 13 05276 g001
Figure 2. Architecture of the hybrid off-grid (top) and grid-tied (bottom) energy systems.
Energies 13 05276 g002
Figure 3. Learning rates using the single-factor learning curve model for Li-ion NMC battery storage. The figure shows learning by using (left) and learning by innovation (right).
Energies 13 05276 g003
Figure 4. Li-ion NMC battery pack historical prices and predicted prices according to a single-factor learning by using (left) and learning by innovation (right) model.
Energies 13 05276 g004
Figure 5. Li-ion NMC battery pack historical prices and predicted prices according to a two-factor (left) and four-factor (right) learning curve model. The two-factor model falls below the 100 USD/kWh price point in agreement with expert predictions. The four-factor model is overfitted and may lead to inaccurate results.
Energies 13 05276 g005
Figure 6. Calculated future LCOE of the optimum system and 100% RE system in comparison with the TCGR within the analysis period of 2020 to 2025. The LCOE of the optimum system is already lower than the diesel-only system in 2020, while the 100% RE system yields a lower LCOE than the diesel-only system in 2023.
Energies 13 05276 g006
Figure 7. Calculated future LCOE of different grid-tied scenarios in comparison with the average annual cost of electricity from the grid within the analysis period of 2020 to 2025. The NoNM-Open scenario is the least-cost scenario allowed by current Philippine policies.
Energies 13 05276 g007
Table 1. Energy system LCOE calculation scenarios.
Case StudyScenarioDescription
Off-gridOptimum Case
  • Solar PV, wind, Li-ion, and diesel
100% RE
  • Solar PV, wind, Li-ion
Grid-tiedNM-100 kW
  • Net metered system
  • Solar PV (<100 kW), Li-ion, and grid
  • Based on the Renewable Energy Act of 2008
NM-Open
  • Net metered system
  • Solar PV (no limit), Li-ion, and grid
  • Hypothetical extended policy
NoNM-Open
  • No net metering
  • Solar PV (no limit), Li-ion, and grid
NoNM-Max
  • No net metering
  • Solar PV (1745 kW), Li-ion, and grid
  • Utilizes the maximum roof capacity

