Modeling the Future California Electricity Grid and Renewable Energy Integration with Electric Vehicles
Abstract
1. Introduction
1.1. Policy Background
1.2. Previous Research
- Predicting the electricity grid mix of generators in California for 2030 that will meet the 60% goal of RPS eligible electricity consumed in the state;
- Simulating the electricity demand of PEVs in 2030 based on behavioral mobility studies of California residents, technology improvements of PEVs, and an increase in available private and public charging infrastructure and available power outputs;
- Analyzing annual grid operations and optimizing the influence of PEV charging and vehicle-to-grid (V2G) on daily grid operations with focus on integrating renewable electricity to mitigate curtailment and ramping needs.
2. Materials and Methods
- Develop clean base-year electricity demand profiles from PEV charging demands;
- Scale loads to 2030 demand forecast predictions;
- Simulate 2030 PEV charging demand;
- Run optimization software for 2030 grid investments;
- Optimize managed charging profiles to mitigate curtailment of renewable generators and ramping-constraints resulting from the 2030 grid.
2.1. Predict Unmanaged Charging Demands of the Base Year 2017
- Official PEV registration numbers in California in 2017;
- PEV data on battery capacity, power consumption and maximum charging power;
- Charging infrastructure availability in the state;
- Mobility behavior data.
2.2. PEV Data
2.3. Charging Infrastructure in California
2.4. Mobility Behavior
2.5. Scale Load Profiles to 2030 Using Demand Forecast
2.6. Predict Unmanaged Charging Demands for 2030 Using V2G-SIM
2.6.1. PEV Data for Year 2030
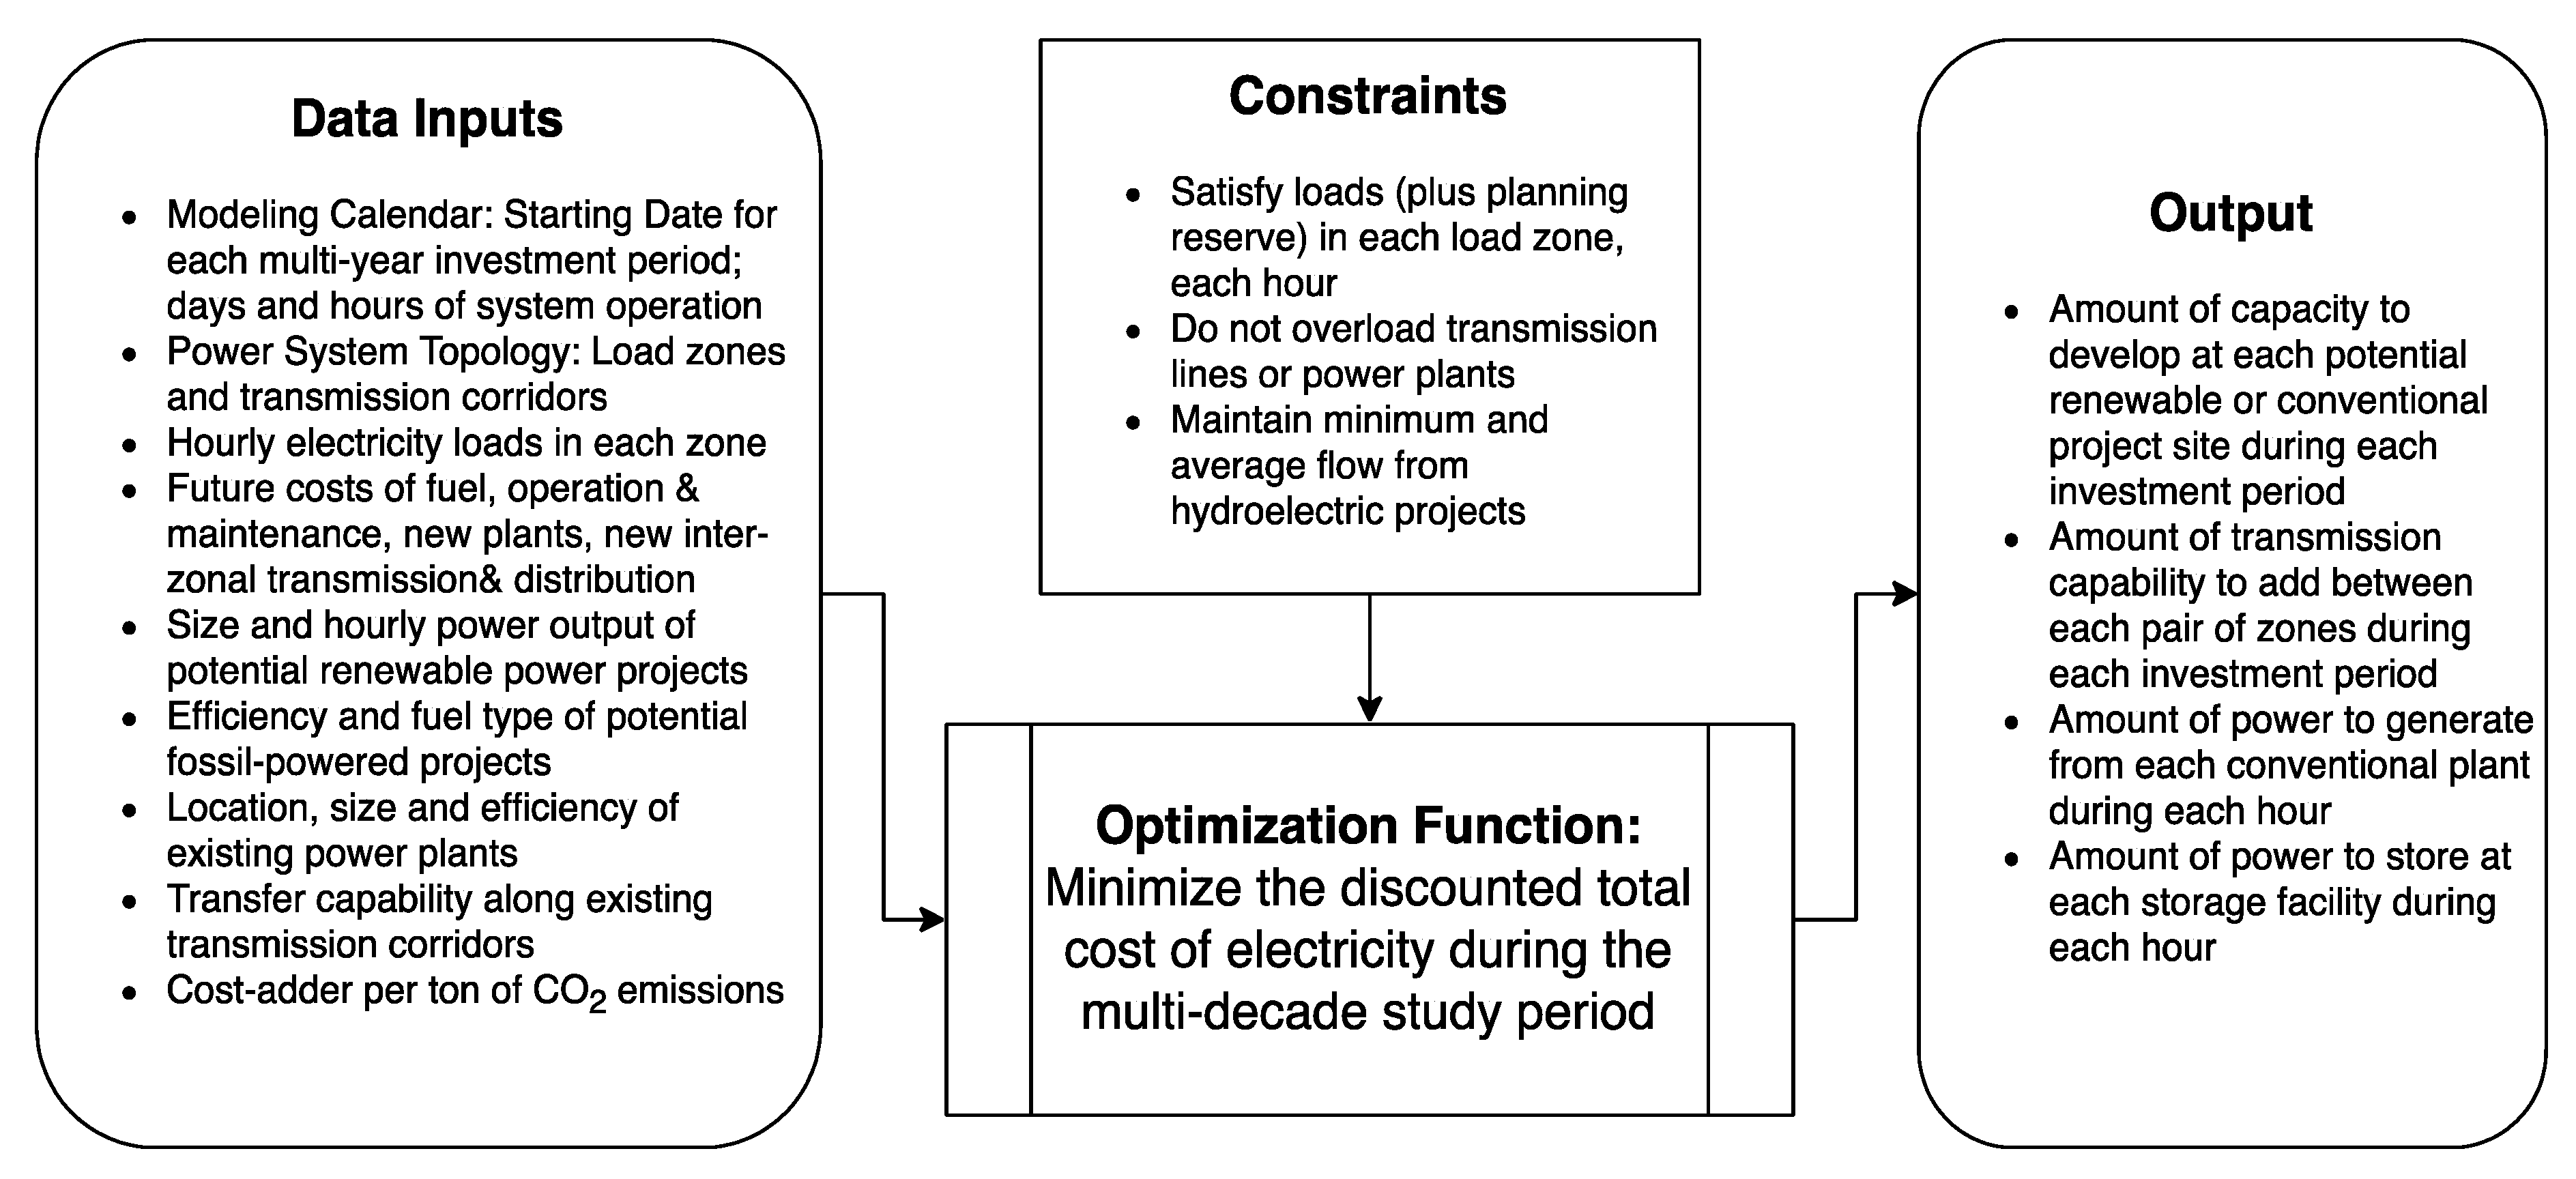
- Electricity load inputs (demand scenarios including vehicle loads)
- Existing generators and plants
- Potential new renewable generators
- Renewable share goals
- Planned retirements of generation technologies
- Plant costs/fuel costs/financial details
- Variable capacity factors of intermittent renewable generators (generation potential)
- Must-run hydroelectric generation profiles
- Transmission capacities
- Existing stationary storage
- New stationary storage investments
2.6.2. California Grid Modeling Results
2.7. Populate V2G-SIM Inputs for Managed Charging Scenarios
2.8. California Grid Modeling Results
- AC Level 2 7-kW V2G
- DC 24-kW V2G
2.9. Operate GridSim to Analyze Curtailment Scenarios
3. Results and Discussion
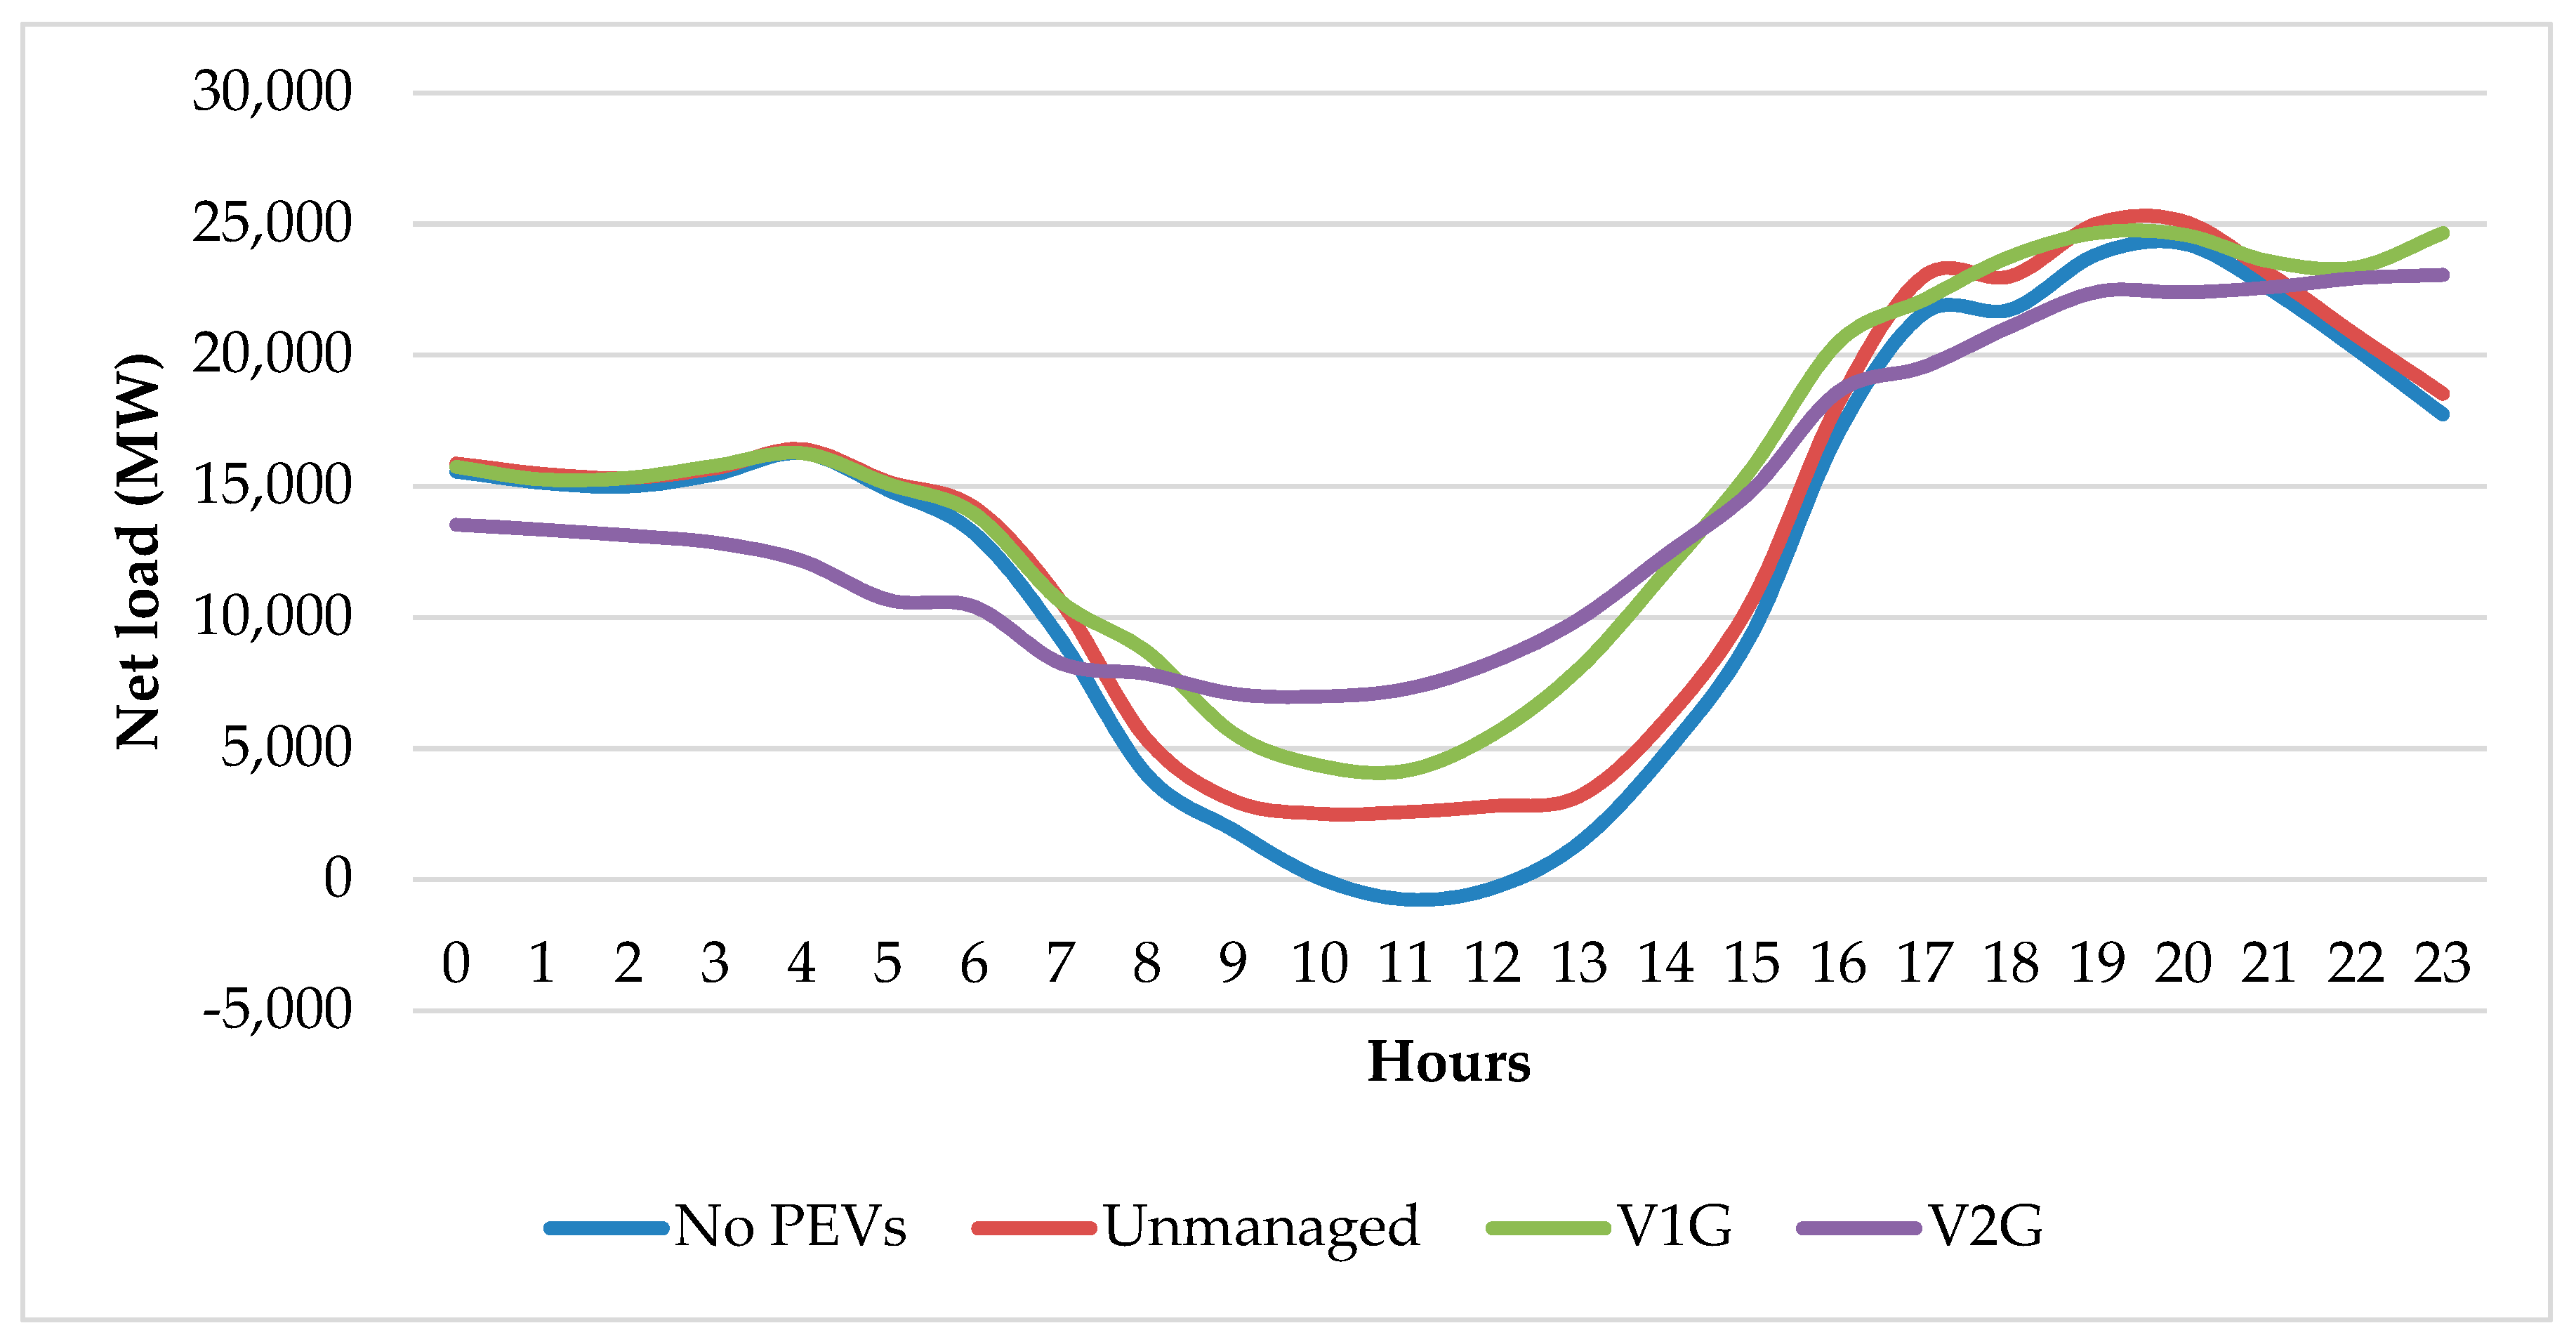
- Case 1—No ZEVs
- Case 2—Unmanaged Charging
- Case 3—Managed Charging—V1G
- Case 4—Managed Charging—V2G
Estimated Avoided Needs for Grid Storage
4. Conclusions
Author Contributions
Funding
Acknowledgments
Conflicts of Interest
Glossary
| Term | Definition |
| a (2030−2017) | annual growth rate of electricity consumption between 2017–2030 |
| AC | alternating current |
| BEV | battery electric vehicle |
| California ISO | California Independent System Operator |
| CEC | California Energy Commission |
| CP | equation term for capital cost of power in U.S. dollars per kilowatt |
| CS | equation term for capital cost of storage in U.S. dollars per kilowatt |
| DC | direct current |
| EG,2030 | generated electricity in 2030 |
| EL,2030 | system electricity consumption in 2030 |
| EOG,2030 | over-generated electricity in 2030 |
| ES,2030 | stored electricity in 2030 |
| ESt | equation term for storage capacity in kilowatt hours |
| EV | electric vehicle |
| FCEV | fuel cell electric vehicle |
| GHG | greenhouse gas |
| GW | gigawatt |
| GWh | gigawatt-hour |
| ISO | independent system operator |
| kW | kilowatt |
| kWh | kilowatt-hour |
| LBNL | Lawrence Berkeley National Laboratory |
| MW | megawatt |
| MWh | megawatt-hour |
| NHTS | National Highway Travel Survey |
| PEV | plug-in electric vehicle |
| PHEV | plug-in hybrid electric vehicle |
| Pi (t) | charging power of a single vehicle in kW |
| Pi,2030 | equation term for… |
| P(L-V),2017 | system electricity power demand—sum of vehicle charging loads in kW in 2017 |
| P(L-V),2030 | system electricity power demand—sum of vehicle charging loads in kW in 2030 |
| PL.2017 | system electricity power demand in 2017 |
| P(NL),2030 | net load in 2030 (electricity demand—solar and wind power) |
| P(NL-V),2030 | net load in 2030—sum of vehicle charging load |
| PS,2030 | solar power generation in 2030 |
| PSt | equation term for storage rated net power |
| PW,2030 | wind power generation in 2030 |
| RPS | renewable portfolio standard |
| t/T | equation term representing the variable time |
| TPC | equation term representing the total plant cost |
| TWh | terawatt hours |
| U.S. | United States |
| V1G | a term for smart charging of electric vehicles |
| V2G | vehicle to grid: a concept where electric vehicles can send electricity back into the grid as well as vary their charging rate |
| ZEV | zero-emission vehicle |
References
- Executive Orders on California Climate Change. Available online: https://www.climatechange.ca.gov/state/executive_orders.html (accessed on 17 February 2019).
- Climate Action Report 2017 on the German Government’s Climate Action Programme 2020; Bundesministerium für Umwelt, Naturschutz und nukleare Sicherheit (BMU): Berlin, Germany, 2019.
- California Energy Commission. Integrated Energy Policy Report; California Energy Commission: Sacramento, CA, USA, 2017.
- Governor’s Interagency Working Group on Zero-Emission Vehicles. 2018 ZEV Action Plan—Priorities Update; Office of Governor Edmund G. Brown Jr.: Sacramento, CA, USA, 2018.
- Office of Governor Edmund G. Brown Jr. Governor Brown Takes Action to Increase Zero-Emission Vehicles, Fund New Climate Investments. Available online: https://www.ca.gov/archive/gov39/2018/01/26/governor-brown-takes-action-to-increase-zero-emission-vehicles-fund-new-climate-investments/index.html (accessed on 21 February 2019).
- Office of Governor Edmund G. Brown Jr. Governor Brown Announces $120 Million Settlement to Fund Electric Car Charging Stations Across California. Available online: https://www.ca.gov/archive/gov39/2012/03/23/news17463/index.html (accessed on 11 January 2019).
- California Senate Bill SB-1090 (Monning); Diablo Canyon Nuclear Powerplant: San Luis Obispo County, CA, USA, 2019; p. 109.
- Energy and Environmental Economics. Investigating a Higher Renewables Portfolio Standard in California: Executive Summary. Available online: https://www.ethree.com/wp-content/uploads/2017/01/E3_Final_RPS_Report_2014_01_06_ExecutiveSummary-1.pdf (accessed on 15 January 2018).
- Fraunhofer-ISI. Model Forecast—REflex. Available online: http://reflex-project.eu/model-coupling/forecast-and-eload/ (accessed on 19 April 2020).
- SB-100 California Renewables Portfolio Standard Program: Emissions of Greenhouse Gases; California Energy Commission: Sacramento, CA, USA, 2018.
- Kammen, D.M. Switch-Wecc—Data, Assumptions, and Model Formulation; Renewable and Appropriate Energy Laboratory: Berkeley, CA, USA, 2013. [Google Scholar]
- Fripp, M. Switch: A Planning Tool for Power Systems with Large Shares of Intermittent Renewable Energy. Environ. Sci. Technol. 2012, 46, 6371–6378. [Google Scholar] [CrossRef] [PubMed]
- Das, P.; Chermakani, D.; Fripp, M. Development of SWITCH-Hawaii Model: Loads and Renewable Resources; Electric Vehicle Transportation Center: Honolulu, HI, USA, 2016. Available online: http://evtc.fsec.ucf.edu/publications/documents/HI-13-16.pdf (accessed on 15 April 2019).
- Coignard, J.; Saxena, S.; Greenblatt, J.; Wang, D. Clean Vehicles as an Enabler for a Clean Electricity Grid. Environ. Res. Lett. 2018, 13, 054031. [Google Scholar] [CrossRef]
- Szinai, J.K.; Sheppard, C.J.R.; Abhyankar, N.; Gopal, A.R. Reduced Grid Operating Costs and Renewable Energy Curtailment with Electric Vehicle Charge Management. Energy Policy 2020, 136, 111051. [Google Scholar] [CrossRef]
- Loisel, R.; Pasaoglu, G.; Thiel, C. Large-Scale Deployment of Electric Vehicles in Germany by 2030: An Analysis of Grid-To-Vehicle and Vehicle-To-Grid Concepts. Energy Policy 2014, 65, 432–443. [Google Scholar] [CrossRef]
- California Department of Motor Vehicles (DMV). Registered Vehicles by Fuel Type in California; CA Department of Motor Vehicles: Sacramento, CA, USA, 2018.
- EVAdoption. EV Statistics of the Week: Range, Price and Battery Size of Currently Available (in the US) BEVs—EVAdoption. Available online: http://evadoption.com/ev-statistics-of-the-week-range-price-and-battery-size-of-currently-available-in-the-us-bevs/ (accessed on 17 January 2019).
- EVAdoption. EV Statistics of the Week: PHEVs by the Numbers. Available online: http://evadoption.com/ev-statistics-of-the-week-phevs-by-the-numbers/ (accessed on 17 January 2019).
- EV Models—EVAdoption. Available online: https://evadoption.com/ev-models/ (accessed on 1 March 2019).
- California Energy Commission. Zero-Emission Vehicles and Infrastructure–Tracking Progress; California Energy Commission: Sacramento, CA, USA, 2018.
- National Household Travel Survey. 2017. Available online: https://nhts.ornl.gov/ (accessed on 6 April 2019).
- National Household Travel Survey 2017—User Guide. 2018. Available online: https://nhts.ornl.gov/assets/2017UsersGuide.pdf (accessed on 6 April 2019).
- California Energy Commission. Electricity Assessments Division, California Energy Demand 2018–2030 Revised Forecast, CEC-200-2018-002-CMF; California Energy Commission: Sacramento, CA, USA, 2018; p. 189.
- California Energy Commission. Transportation Energy Demand Forecast, 2018–2030; California Energy Commission: Sacramento, CA, USA, 2017.
- U.S. Department of Energy, Energy Information Agency. EIA—Electricity Data. Available online: https://www.eia.gov/electricity/monthly/epm_table_grapher.php?t=epmt_1_10_a (accessed on 8 April 2019).
- Bedir, A.; Crisostomo, N.; Allen, J.; Wood, E.; Rames, C. California Plug-In Electric Vehicle Infrastructure Projections: 2017–2025; California Energy Commission: Sacramento, CA, USA, 2018.
- Annual Generation—Plant Unit. Available online: https://www.energy.ca.gov/almanac/electricity_data/web_qfer/Annual_Generation-Plant_Unit.php (accessed on 17 December 2018).
- Western Wind and Solar Integration Study. National Renewable Energy Laboratory. Available online: https://www.nrel.gov/grid/wwsis.html (accessed on 8 April 2019).
- U.S. Energy Information Administration. Cost and Performance Characteristics of New Generating Technologies. Annual Energy Outlook 2018; U.S. Energy Information Administration: Washington, DC, USA, 2018.
- 2018 ATB, Utility-Scale PV–Plant Cost and Performance Projections Methodology. Available online: https://atb.nrel.gov/electricity/2018/index.html?t=su&s=md (accessed on 14 November 2018).
- Wiser, R.; Jenni, K.; Seel, J.; Baker, E.; Hand, M.; Lantz, E.; Smith, E. Expert Elicitation Survey on Future Wind Energy Costs. Nat. Energy 2016. [Google Scholar] [CrossRef]
- California Energy Commission. Tracking Progress-Energy Storage. 2018. Available online: https://www.energy.ca.gov/data-reports/tracking-progress (accessed on 4 June 2019).
- Bill Text—AB-2514 Energy Storage Systems. Available online: https://leginfo.legislature.ca.gov/faces/billNavClient.xhtml?bill_id=200920100AB2514 (accessed on 8 April 2019).
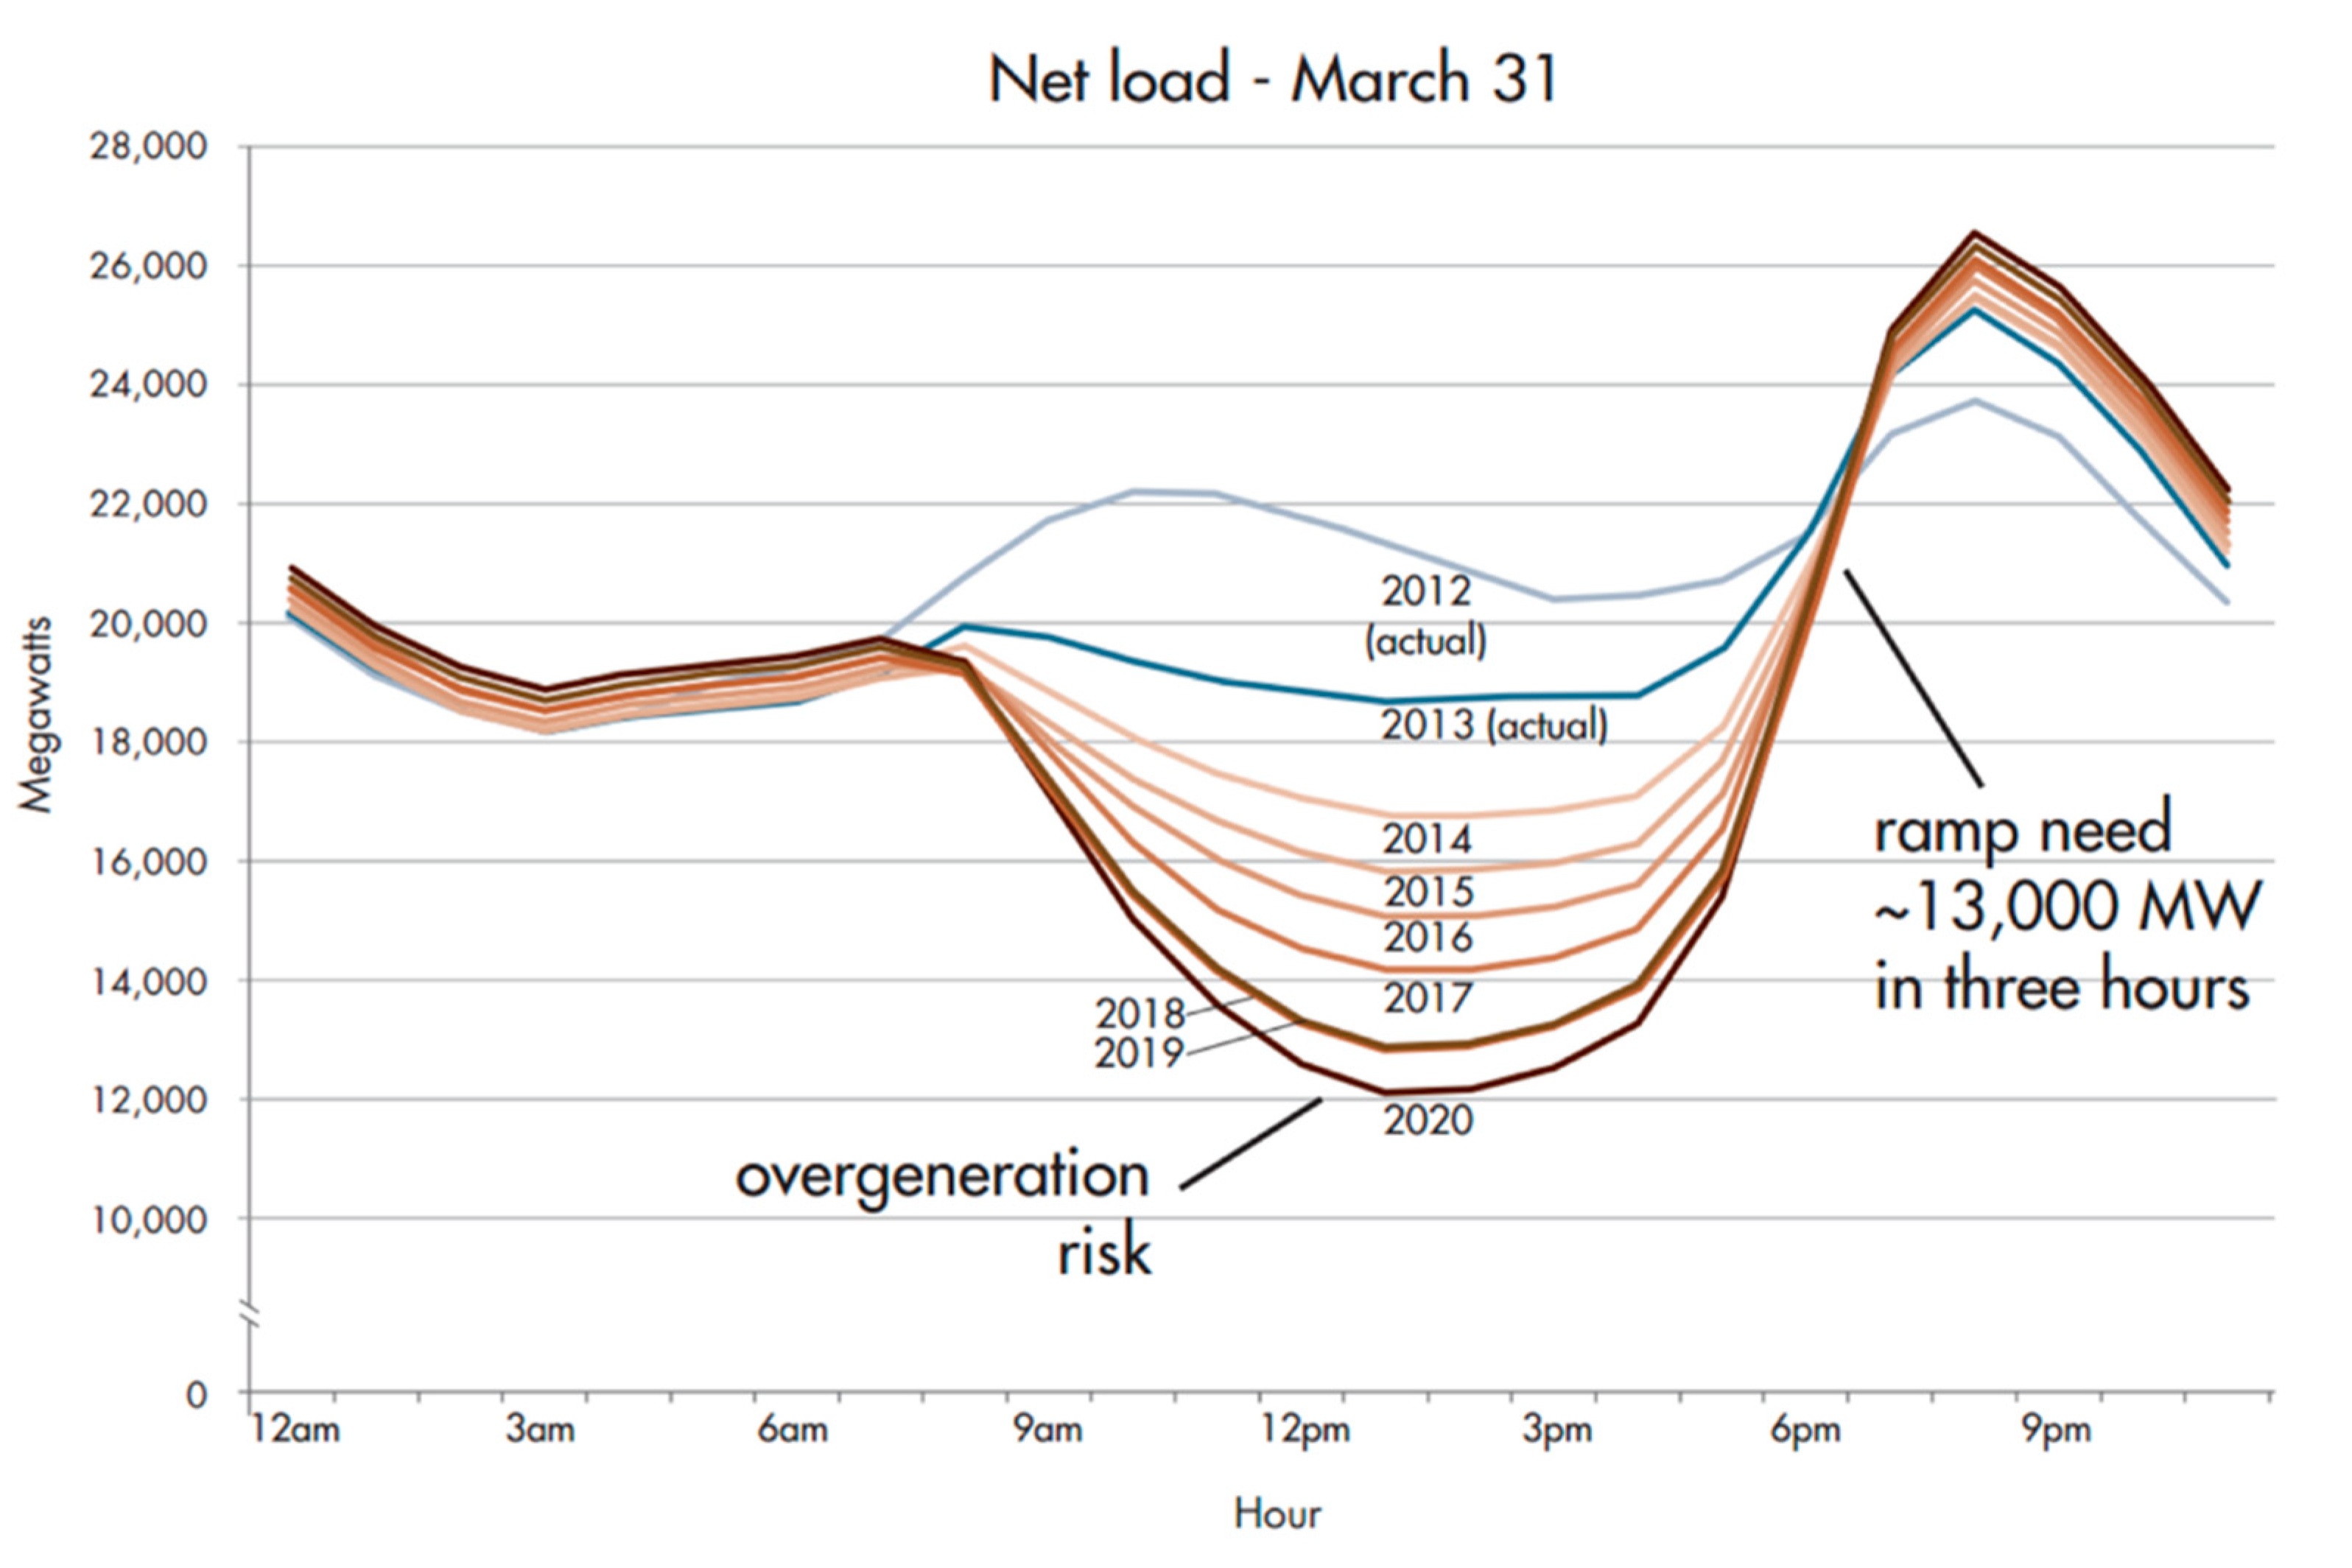
- California Independent System Operator. What the Duck Curve Tells Us about Managing a Green Grid-Fast Facts. 2016. Available online: http://caiso.com (accessed on 7 May 2019).
- Governor Edmund G. Brown Jr. Executive Order B-16-2012. Available online: https://www.ca.gov/archive/gov39/2012/03/23/news17472/index.html (accessed on 21 February 2019).
- International Renewable Energy Agency (IRENA). Electricity Storage and Renewables: Costs and Markets to 2030; International Renewable Energy Agency (IRENA): Masdar City, Abu Dhabi, 2017. [Google Scholar]
- Needell, Z.A.; McNerney, J.; Chang, M.T.; Trancik, J.E. Potential for widespread electrification of personal vehicle travel in the United States. Nat. Energy 2016, 1, 9. [Google Scholar] [CrossRef]
| Source | Date Effective | Content |
|---|---|---|
| EO B-16-2012 (Brown) | 23 March, 2012 |
|
| SB 350 (DeLeon) | 7 October 2015 |
|
| SB 32 (Pavley/Garcia) | 1 January 2017 |
|
| EO B-48-18 (Brown) | 26 January 2018 |
|
| SB100 (DeLeon) | 10 September 2018 |
|
| Air Resources Board | 1 January 2019 |
|
| Vehicle Type | Registered Vehicles | Percent of ZEVs | Percent of Total Stock |
|---|---|---|---|
| BEV | 178,000 | 51.9% | 0.73% |
| PHEV | 164,000 | 46.9% | 0.66% |
| FCEV | 5117 | 1.2% | 0.02% |
| All ZEVs/PHEVs | 432,480 | 100% | 1.41% |
| All Vehicles | 30,660,209 | 100% |
| Consumption (kWh/100 km) | Battery Pack Size (kWh) | Max Charging Power (kW) | Resulting Range (km) | |
|---|---|---|---|---|
| BEV | 17.73 | 40 | 120 | ~226 |
| PHEV | 28.46 | 7 | 7.2 | ~24.59 |
| No Charger | AC Level 1: 1.4 kW | AC Level 2: 7.2 kW | DC: 24 kW | DC: 50 kW | DC: 120 kW | |
|---|---|---|---|---|---|---|
| Home | 10% | 70% | 20% | - | - | - |
| Work | 60% | - | 30% | 5% | 5% | - |
| Other | 65% | - | 20% | 5% | 5% | 5% |
| Category | Value |
|---|---|
| Total PEVs | 342,000 |
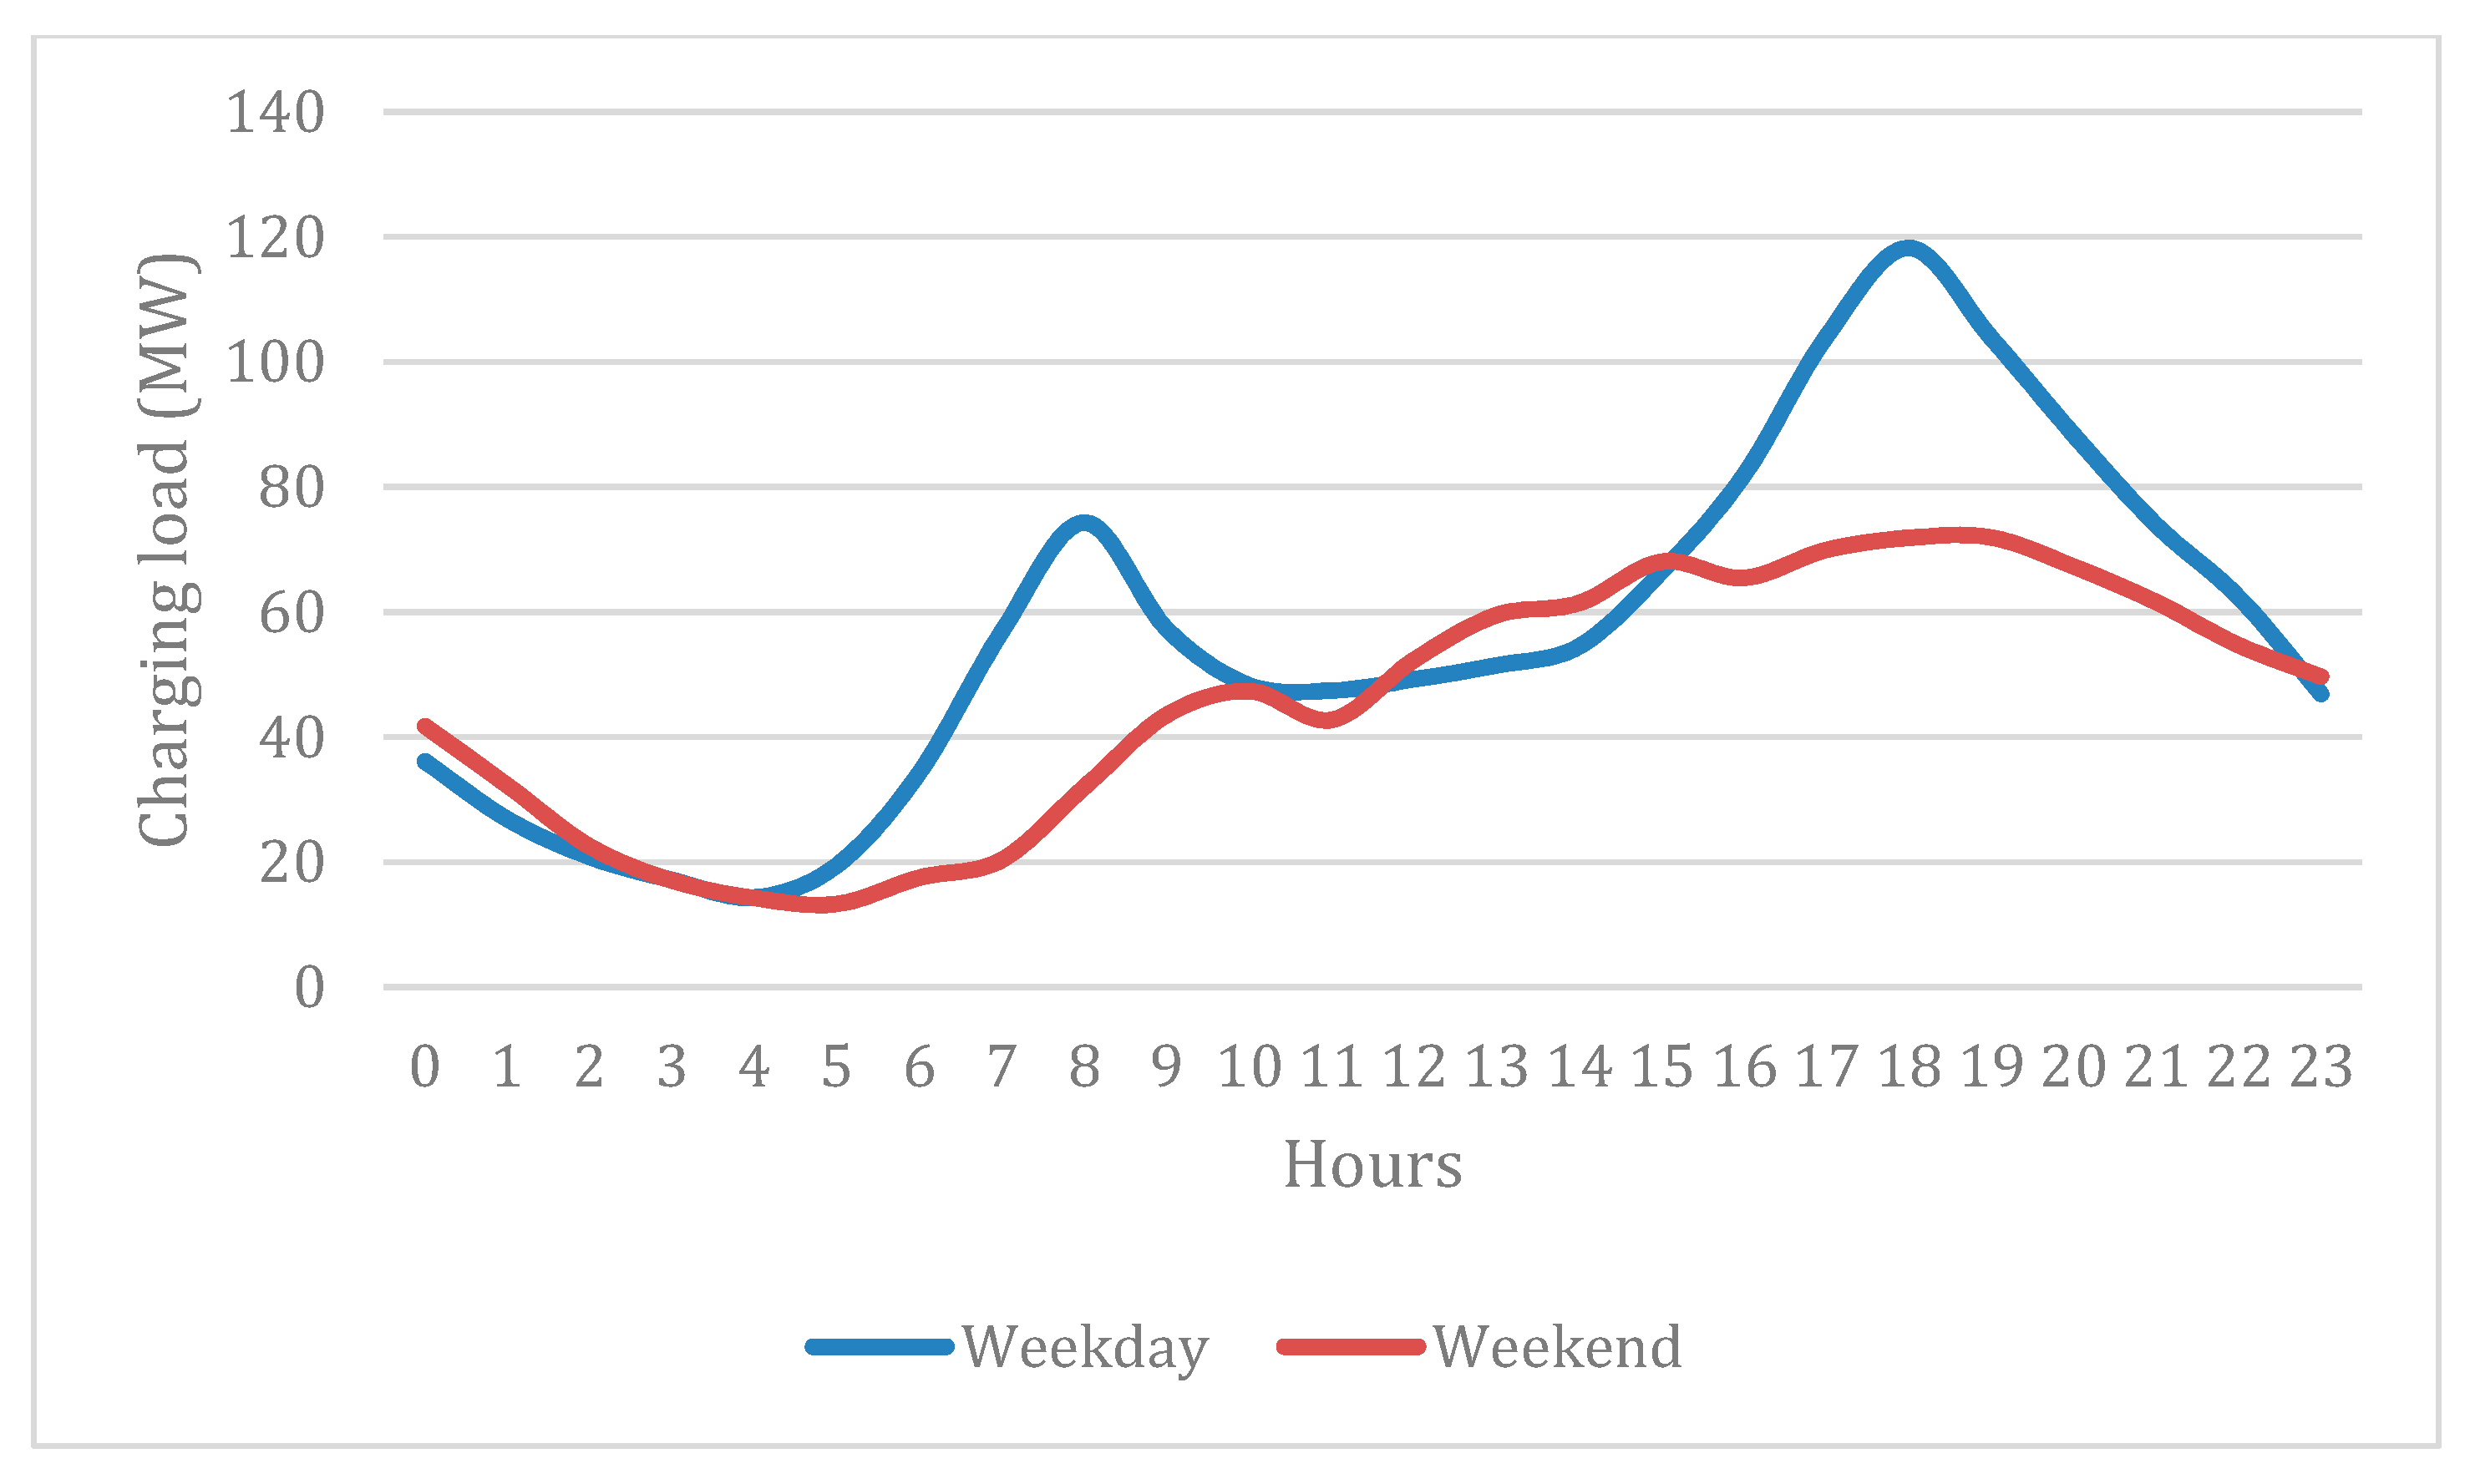
| Annual Charging Demand | 466.4 GWh |
| Annual Electricity Consumption in California | ~292 TWh |
| Percentage of Annual Total Consumption | ~0.16% |
| Average Annual Growth (%) | |||
|---|---|---|---|
| Low Demand Case | Mid Demand Case | High Demand Case | |
| 2017–2030 | 0.99% | 1.2% | 1.59% |
| Total Net Consumption (GWh) | |||
| 2030 | 326,026 | 339,160 | 354,209 |
| Number of PEVs (millions) | |||
| 2030 | 2.6 | 3.3 | 3.9 |
| Consumption (kWh/100 km) | Battery Pack Size (kWh) | Max Charging Power (kW) | Average Range (km) | |
|---|---|---|---|---|
| BEV | 17.73 | 88 | 350 | ~496 |
| PHEV | 28.46 | 15.4 | 22 | ~54 |
| Category | Assumption |
|---|---|
| BEV/PHEV Ratio | 60%/40% (all cases) |
| Low PEV Forecast | 2.6 million vehicles |
| Mid PEV Forecast | 3.3 million vehicles |
| High PEV Forecast | 3.9 million vehicles |
| No Charger | AC Level 1—1.4 kW | AC Level 2—7.2 kW | DC—24 kW | DC—50 kW | DC—120 kW | |
|---|---|---|---|---|---|---|
| Home | 10% | 30% | 60% | - | - | - |
| Work | 25% | - | 50% | 10% | 10% | 5% |
| Other | 25% | - | 50% | 10% | 10% | 5% |
| Scenario | Total PEVs (Million) | Total Charging Demand (TWh) |
|---|---|---|
| Low Charging Demand | 2.6 | 4.38 |
| Mid Charging Demand | 3.3 | 5.56 |
| High Charging Demand | 3.9 | 6.57 |
| Category | Estimate |
|---|---|
| Total ZEVs in 2030 | 3.3 million |
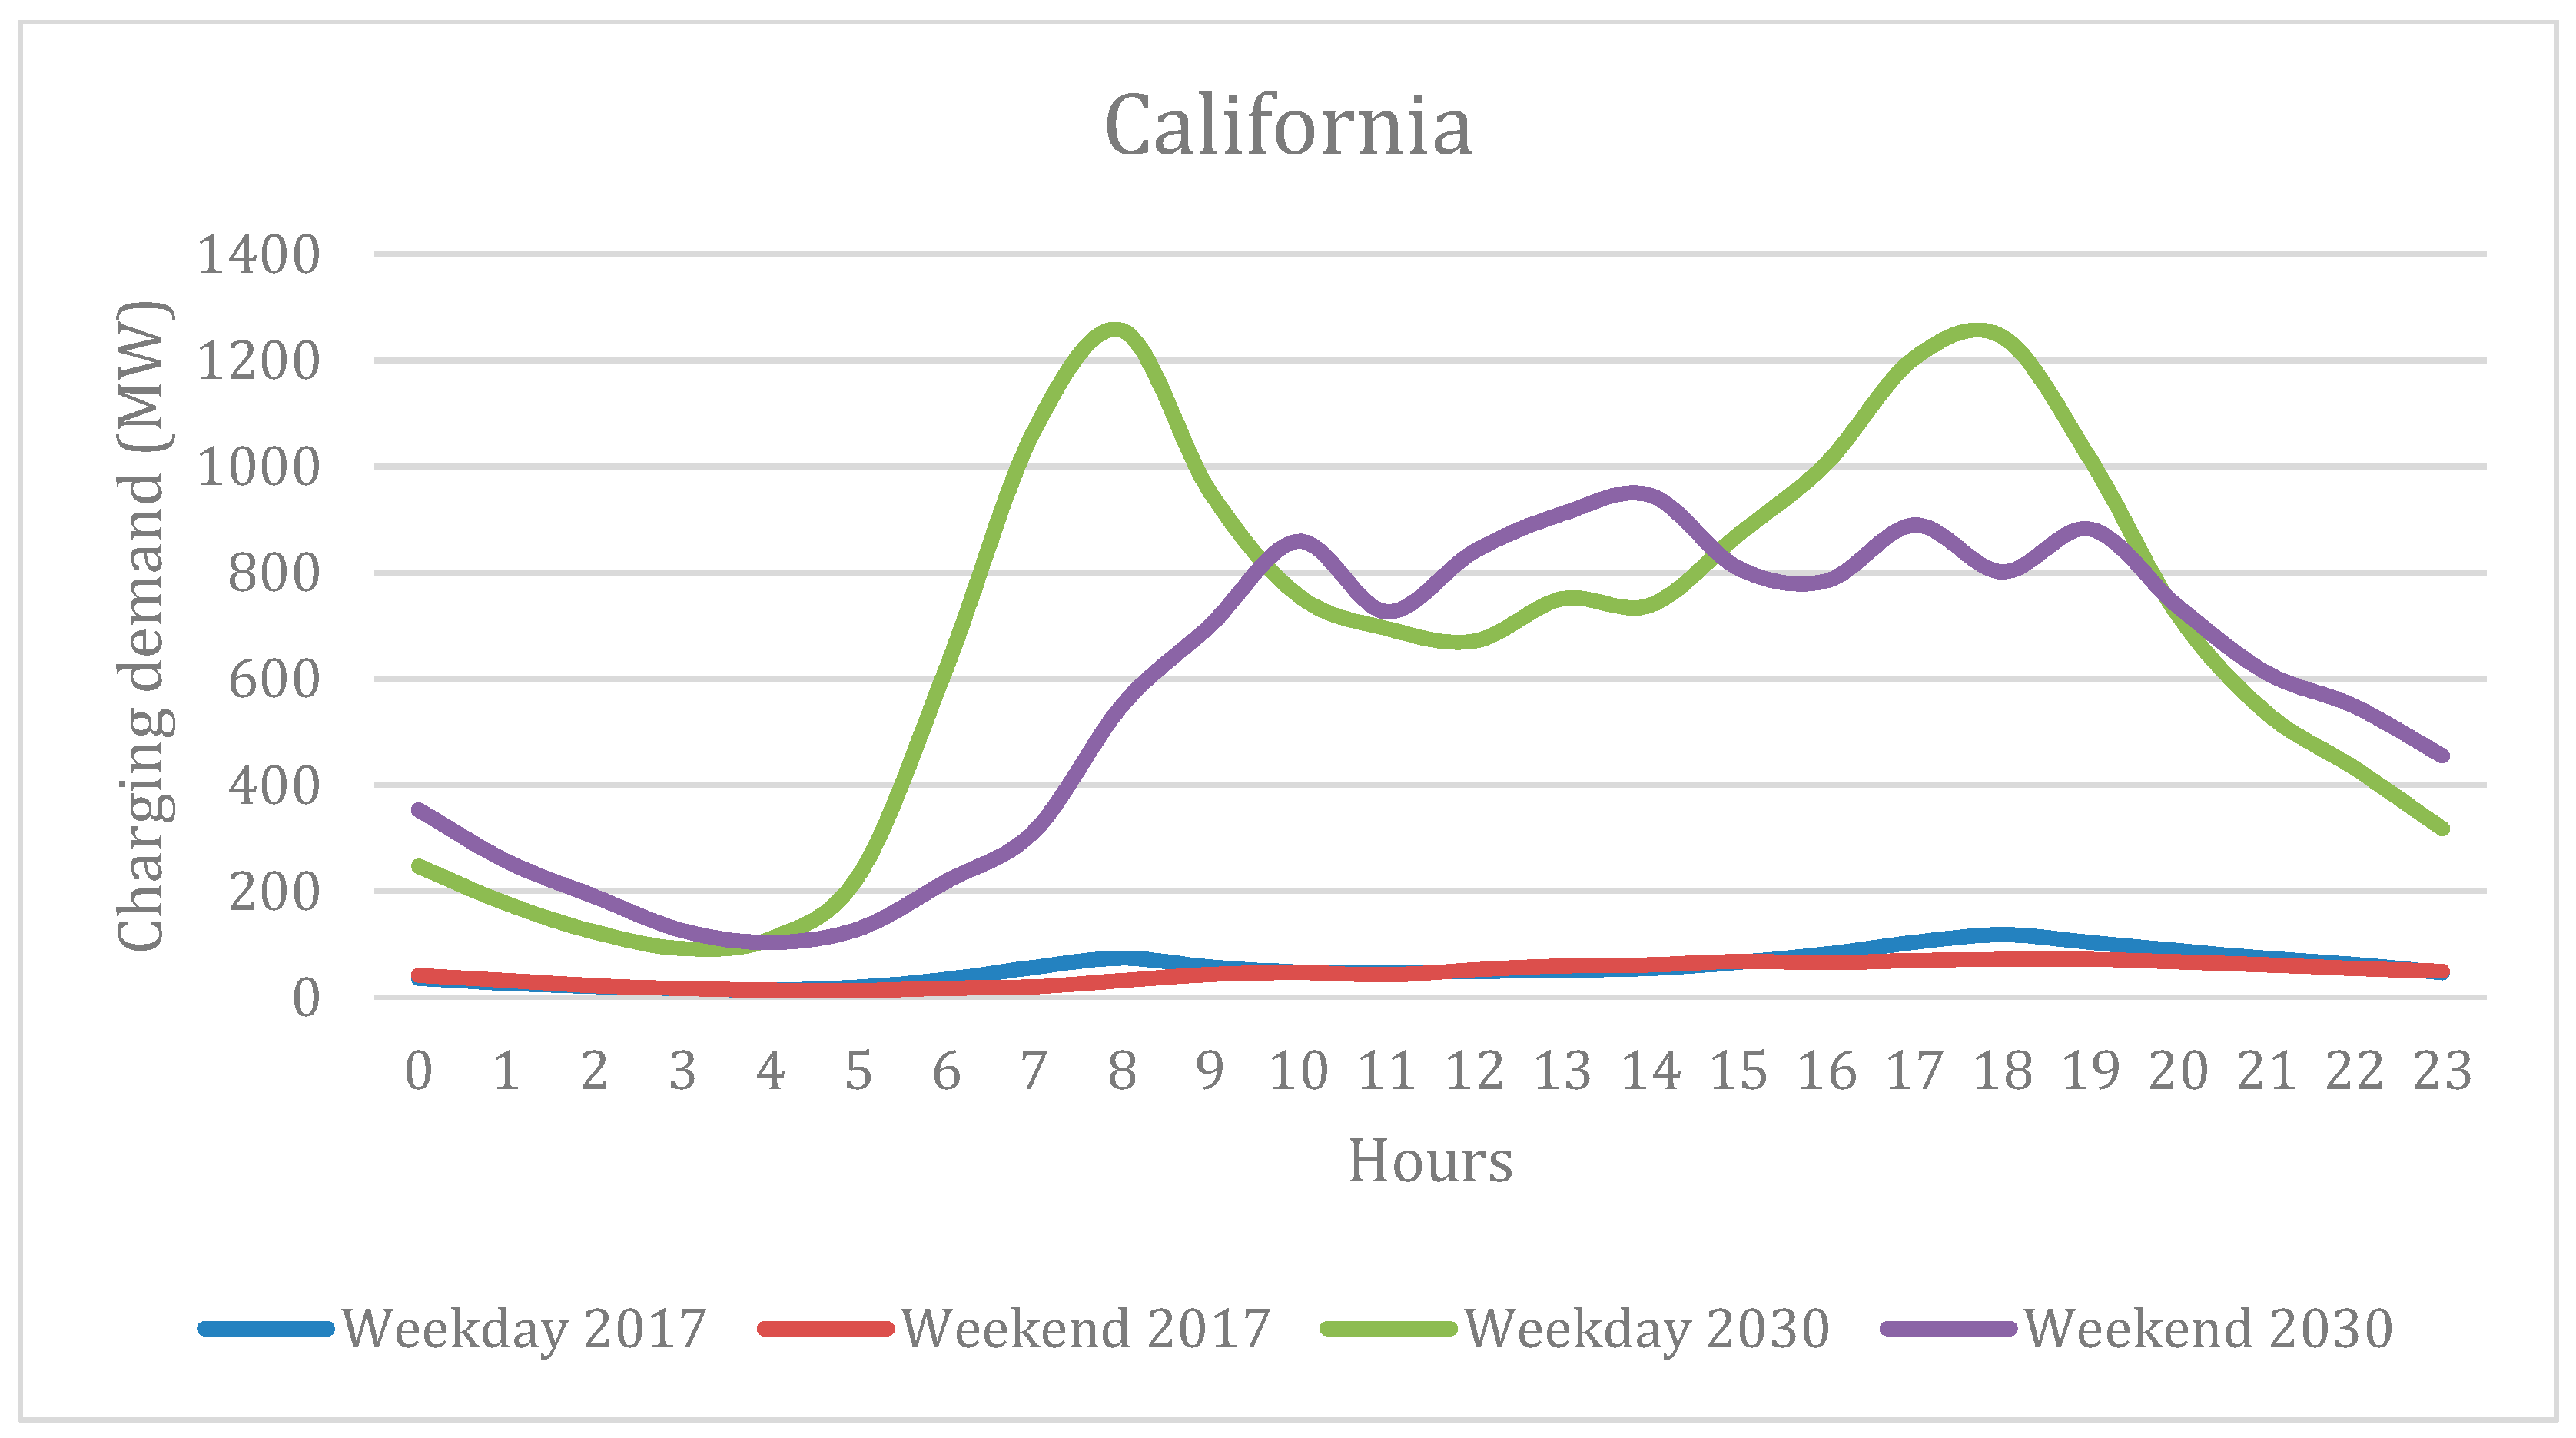
| Annual EV Charging Demand in 2030 | 5.56 TWh |
| Annual Electricity Consumption in 2030 | ~339 TWh |
| Percentage of Annual Total Consumption in 2030 | ~1.64% |
| Percentage of Annual Total Consumption in 2017 | ~0.16% |
| Generator Type | Overnight Capital Costs in 2020 ($/kW) | Percent Price Decline by 2030 | Resulting Overnight 2030 Price ($/kW) | Connection Costs ($/kW) | Operating Costs ($/kW/Year) |
|---|---|---|---|---|---|
| Solar Fixed Tilt | 1763 | 17% | 1463 | 74.2 | 22.02 |
| Solar Tracking | 2004 | 17% | 1663 | 74.2 | 22.02 |
| Wind On-shore | 1548 | 14% | 1331 | 74.2 | 47.47 |
| Year | Wind (GW) | Solar (GW) | Nat. Gas (GW) | Biomass (GW) | Geotherm. (GW) | Hydro. (GW) | Coal (GW) | Nuclear (GW) | Total (GW) |
|---|---|---|---|---|---|---|---|---|---|
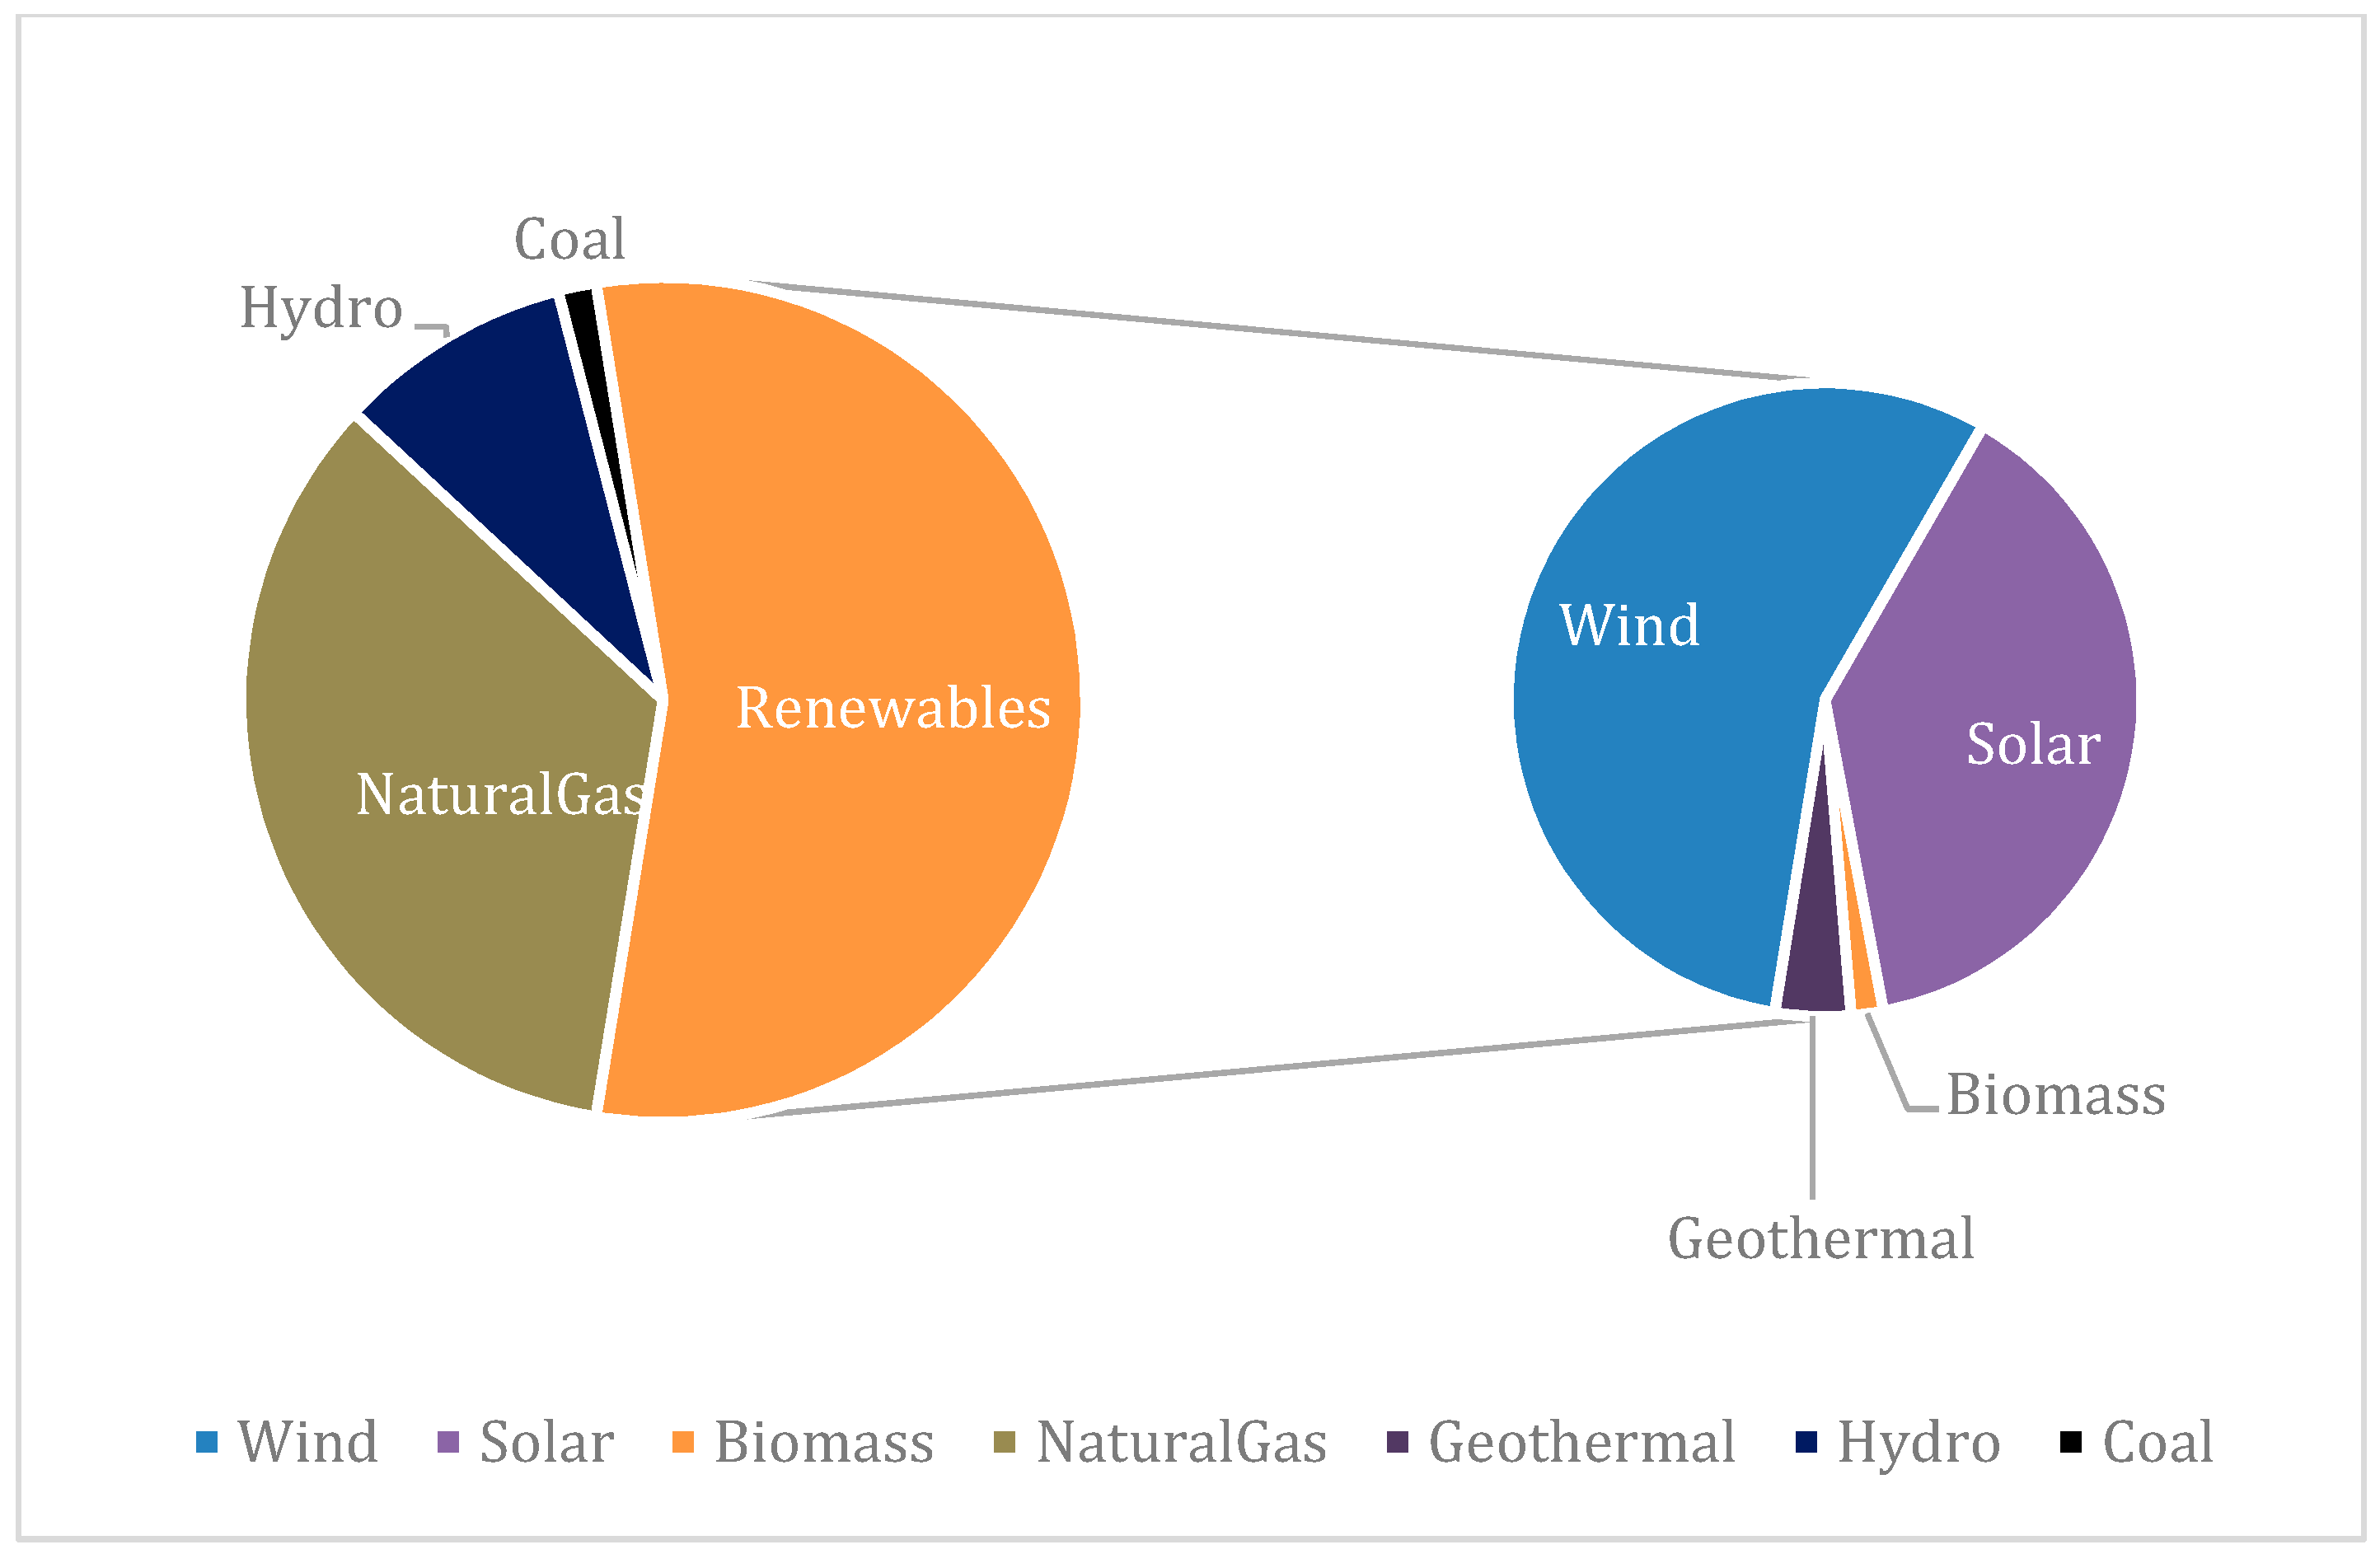
| 2017 | 6090 | 12,478 | 44,258 | 1168 | 2730 | 11,693 | 1898 | 2393 | 82,708 |
| 2030 | 39,572 | 27,473 | 44,258 | 1168 | 2730 | 11,693 | 1898 | 0 | 128,792 |
| Home | Work | Other | |
|---|---|---|---|
| No Charger | 10% | 25% | 25% |
| AC Level 1—1.4 kW | 30% | - | - |
| AC Level 2—7.2 kW (uncontrolled) | 20% | 20% | 50% |
| AC Level 2—7.2 kW (V1G) | 40% | 30% | - |
| DC—24kW (V1G) | - | 10% | 10% |
| DC—50 kW (V1G) | - | 10% | 10% |
| DC—120 kW (V1G) | - | 5% | 5% |
| Home | Work | Other | |
|---|---|---|---|
| No Charger | 10% | 15% | 25% |
| AC Level 1—1.4 kW | 20% | - | - |
| AC Level 2—7.2 kW (uncontrolled) | 10% | 20% | 50% |
| AC Level 2—7.2 kW (V1G) | 30% | 20% | - |
| AC Level 2—7.2 kW (V2G) | 20% | 10% | - |
| DC—24 kW (V1G) | - | 10% | 10% |
| DC—24 kW (V2G) | 10% | 10% | - |
| DC—50 kW (V1G) | - | 10% | 10% |
| DC—120 kW (V1G) | - | 5% | 5% |
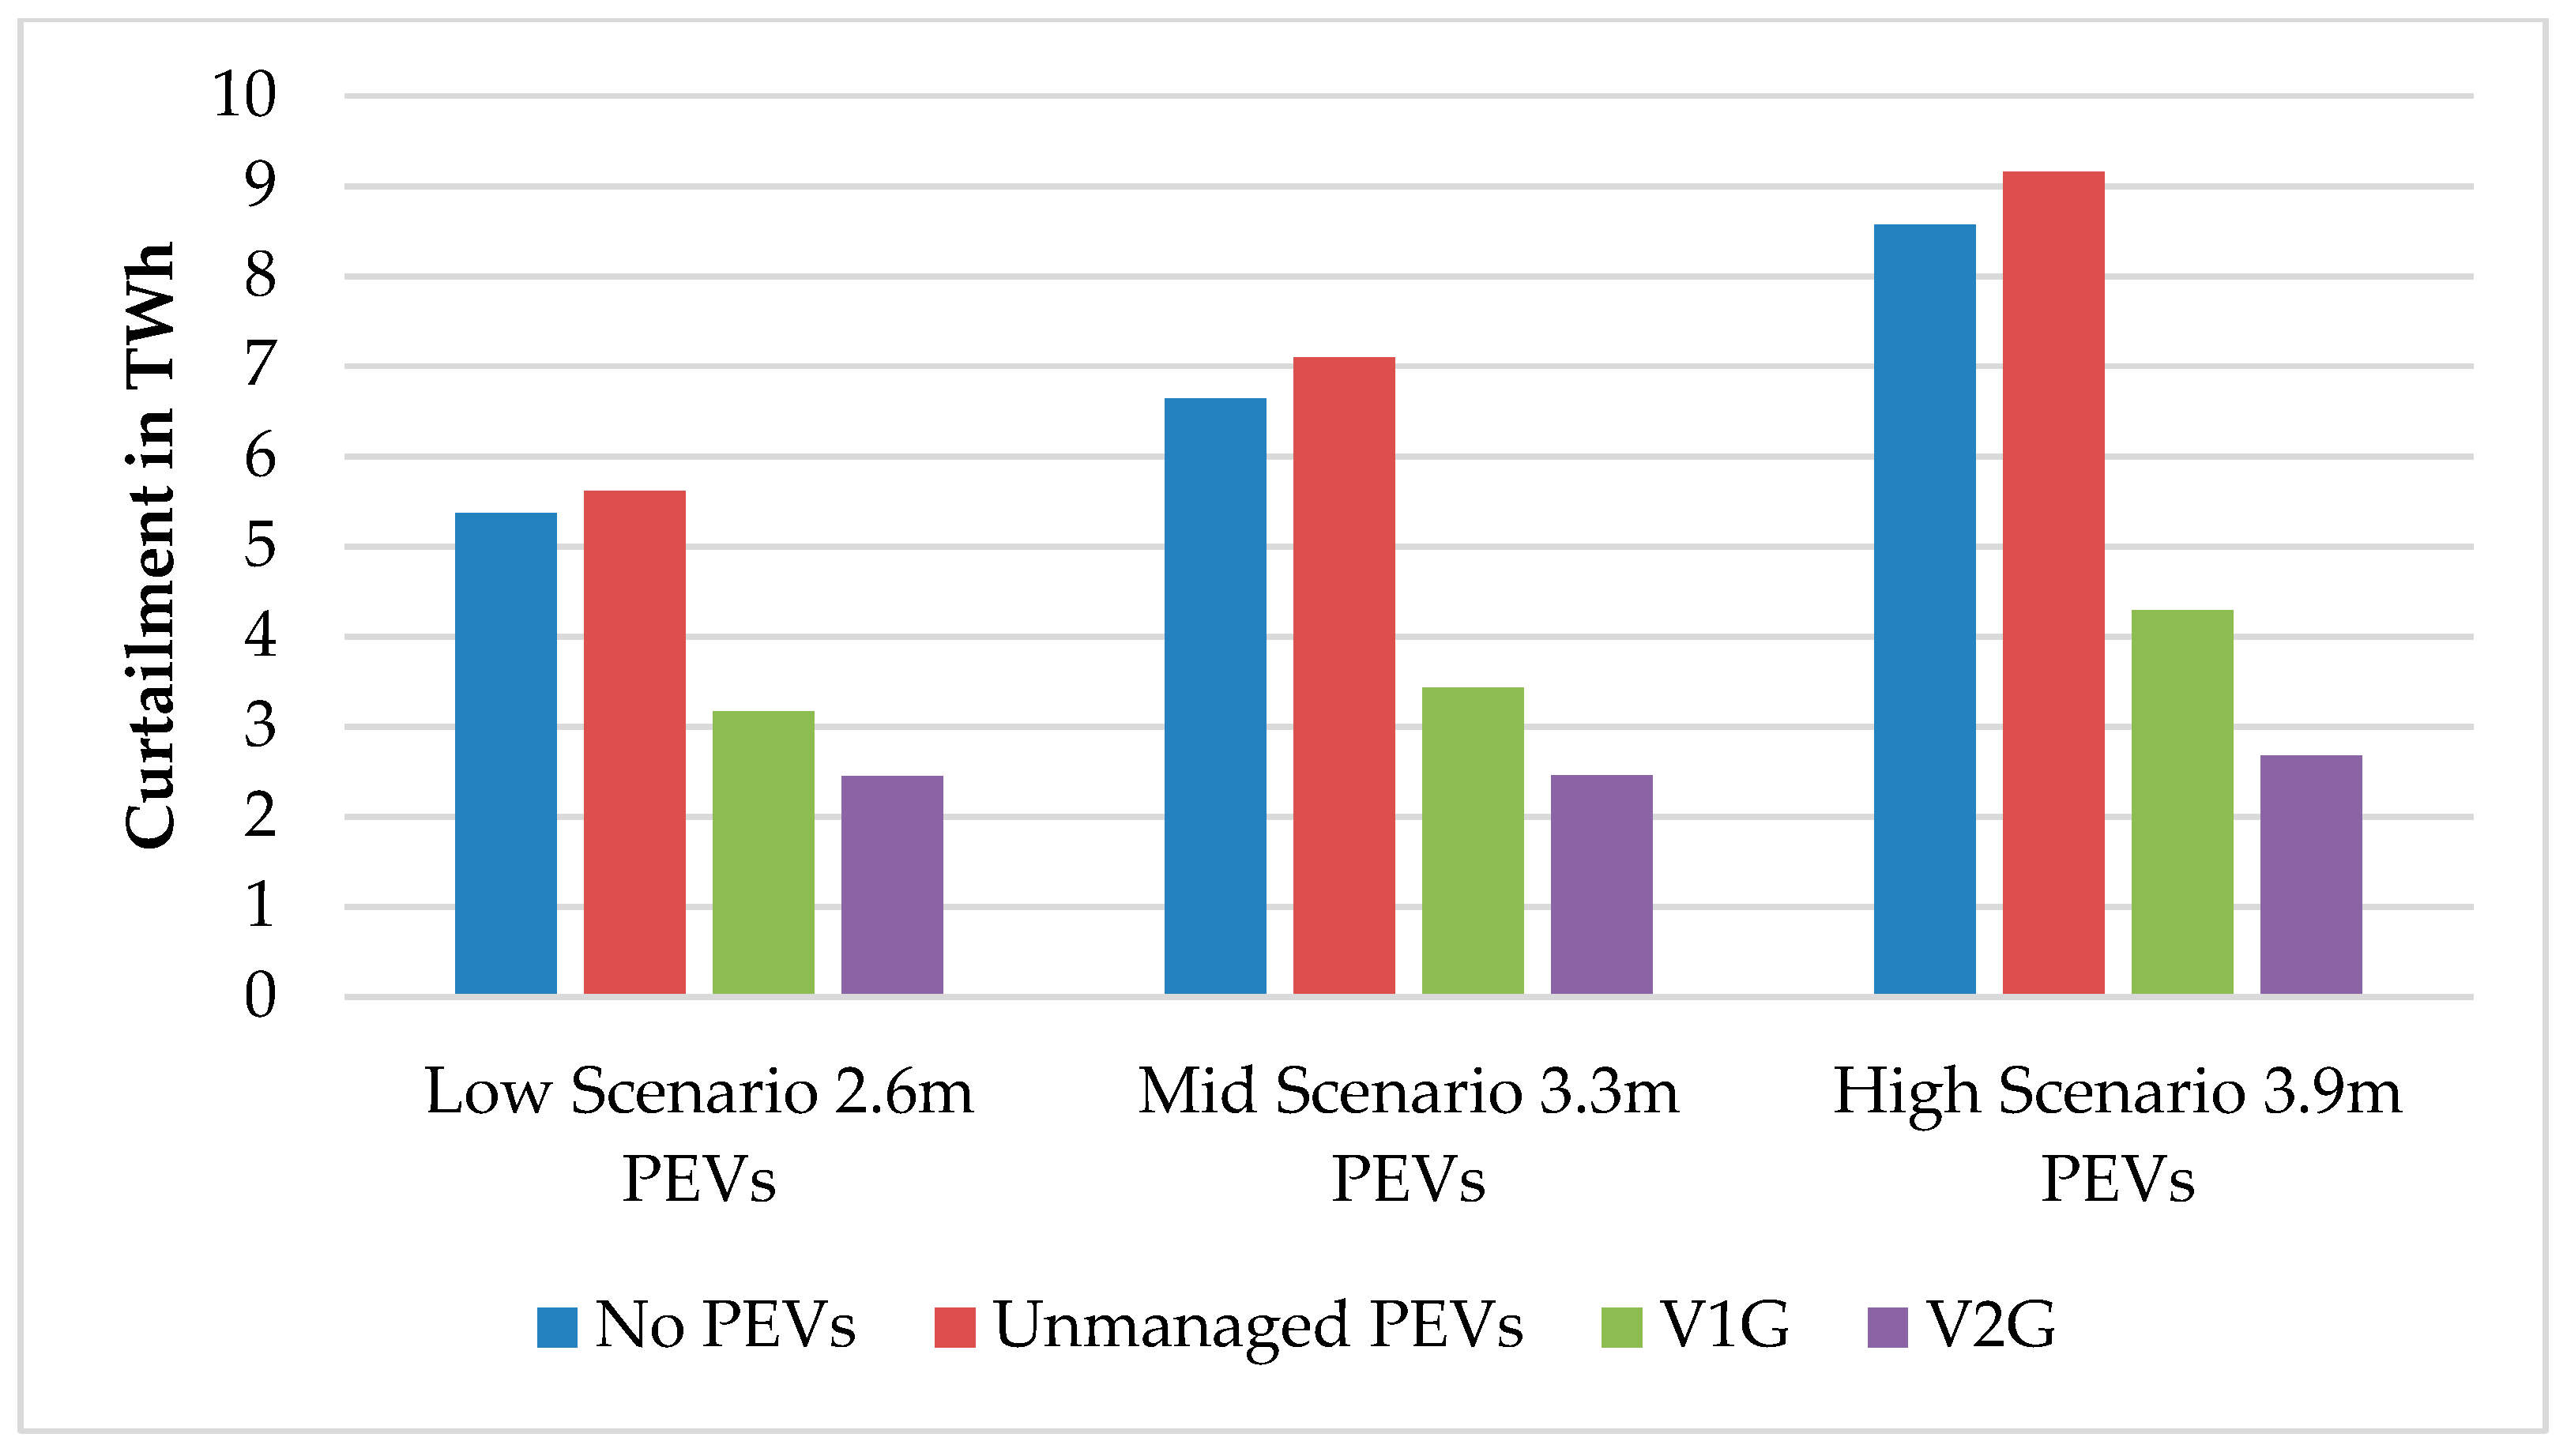
| No PEVs | Unmanaged PEVs | Managed PEVs with V1G | Managed PEVs with V2G | |
|---|---|---|---|---|
| Total Demand in TWh | 334.81 | 339.19 | 339.19 | 339.19 |
| Curtailment in TWh | ||||
| Peak-Valley Optimization | 6.64 | 7.09 | 4.39 | 2.58 |
| Ramp-Rate Optimization | 3.43 | 2.45 | ||
| Curtailment in % of Total Generation | ||||
| Peak-Valley Optimization | 1.94 | 2.04 | 1.27 | 0.75 |
| Ramp-Rate Optimization | 0.97 | 0.71 | ||
| Renewable Energy Curtailment (TWh) | Equivalent Power Capacity (MW) | Equivalent Energy Capacity (MWh) | |
|---|---|---|---|
| V1G | 3.43 | 7500 | 30,000 |
| V2G | 2.45 | 12,500 | 50,000 |
| Power Capacity (MW) | Energy Capacity (MWh) | Equivalent Storage Cost (Billion U.S. $2019) | |
|---|---|---|---|
| V1G | 7500 | 30,000 | 15.77 |
| V2G | 12,500 | 50,000 | 26.28 |
© 2020 by the authors. Licensee MDPI, Basel, Switzerland. This article is an open access article distributed under the terms and conditions of the Creative Commons Attribution (CC BY) license (http://creativecommons.org/licenses/by/4.0/).
Share and Cite
van Triel, F.; Lipman, T.E. Modeling the Future California Electricity Grid and Renewable Energy Integration with Electric Vehicles. Energies 2020, 13, 5277. https://doi.org/10.3390/en13205277
van Triel F, Lipman TE. Modeling the Future California Electricity Grid and Renewable Energy Integration with Electric Vehicles. Energies. 2020; 13(20):5277. https://doi.org/10.3390/en13205277
Chicago/Turabian Stylevan Triel, Florian, and Timothy E. Lipman. 2020. "Modeling the Future California Electricity Grid and Renewable Energy Integration with Electric Vehicles" Energies 13, no. 20: 5277. https://doi.org/10.3390/en13205277
APA Stylevan Triel, F., & Lipman, T. E. (2020). Modeling the Future California Electricity Grid and Renewable Energy Integration with Electric Vehicles. Energies, 13(20), 5277. https://doi.org/10.3390/en13205277


