Article

Forks in the Road to E-Mobility: An Evaluation of Instrument Interaction in National Policy Mixes in Northwest Europe

1
School of Business & Economics, Maastricht University, 6200 MD Maastricht, The Netherlands
2
Nordic Institute for Studies in Innovation, Research and Education (NIFU), 0608 Oso, Norway
3
School of Business & Economics, Maastricht University and UNU-Merit, 6200 MD Maastricht, The Netherlands
4
DTU Management, Technical University of Denmark (DTU), 2100 Copenhagen, Denmark
5
Borup Strategi og Analyse, 2100 Copenhagen, Denmark
*
Author to whom correspondence should be addressed.
Energies 2020, 13(2), 475; https://doi.org/10.3390/en13020475
Submission received: 19 November 2019 / Revised: 19 December 2019 / Accepted: 15 January 2020 / Published: 18 January 2020

Abstract

:
This paper evaluates how policy shaped the emergence of electric mobility in three countries, Norway, the Netherlands and Denmark, between 2010 and 2015. Whereas previous studies have looked at the effects of separate policy instruments, this paper gives insights in the interaction effects of instruments on the diffusion of battery electric cars between five policy areas. Based on analysis of synergetic, contradictory and pre-conditional effects, we find that an effective policy mix includes: fiscal incentives that mirror the actual carbon footprint of the respective vehicles; non-fiscal demand-side incentives; centrally financed and/or coordinated charging infrastructure; clarity regarding the choice of technology that will be supported. Moreover, development of a domestic, e-mobility-related industry and a high share of renewable energy strengthens the legitimization of e-mobility support. The findings help designing policy mixes in the transition to electric mobility.

1. Introduction

Passenger mobility is one of the most significant contributors to global climate change, and its carbon emissions are still growing. Local air pollution limit values for PM10 and NOx are regularly exceeded at traffic monitoring sites across the European Union [1]. Policy-makers have recognized these problems, which are associated with internal combustion engines (ICEs) and car mobility, and have implemented various policies, most notably regulations regarding vehicle emissions within the EU and also financial and other instruments to support low-carbon fuel and propulsion systems both within the EU and nationally, including electric mobility. Full battery-electric vehicles (FBEVs) have the potential to impose a much lower climate footprint, but this depends on the fraction of renewables in the electricity that fuels the FBEVs and the production of the batteries. In a country like Denmark, for instance, FBEVs currently have approximately half the climate footprint of plug-in hybrid electric vehicles (PHEVs) and efficient ICE vehicles that have approximately the same footprint during their life cycle [2]. If the share of renewable grows in the future, then FBEVs will compare even more favourably with PHEVs.
A major objective of both the EU’s and most national transport policies in European states is to increase the penetration of FBEVs into existing vehicle mobility. The common challenge is to stimulate change in a market that has long been dominated by an incumbent technology, the internal combustion engine (ICE). The mobility system that has grown up around the ICE can be seen as a regime [3,4] that has proved remarkably resilient because of user preferences, sunk costs, infrastructure issues, engineering scepticism about alternatives, scale-economies and lobbying against the introduction of automobile emission regulations, which acted to ‘lock out’ alternatives [5,6]. The emergence of electric mobility therefore faces a ‘web of constraints’ [7] that includes people’s preferences and practices, infrastructure, the character of established business models and the current policy contexts both nationally and within the EU. The emergence of electric mobility requires, among other things, the manufacture of affordable vehicles that are attractive to car drivers and are supported by a recharging infrastructure.
This paper evaluates how policy shaped the emergence of electric (e-)mobility in three countries, Norway, the Netherlands and Denmark, between 2010 and 2015, a period in which all three actively encouraged e-mobility. The countries are also of specific interest because they were the first to show this level of ambition in respect of e-mobility. Our evaluation is based on interviews with stakeholders and experts, supplemented with an analysis of relevant reports and data analysis of the diffusion of battery electric vehicles and relevant alternatives. We seek explanation for the differences in e-mobility use in the three countries in the first five years of policy support. Other studies have evaluated the effects of financial instruments and recharging infrastructure, but separately (e.g., [8] through regression analysis; [9]), but such studies neglect or even ignore the interaction effects of different types of policy. However, the performance of policy instruments depends on their interaction with other measures that may be in place. Instrument interaction effects on e-mobility have not yet been studied. Our aim is to highlight and understand the interaction effects of five policy domains and contribute an empirical, ex-post evaluation of electric mobility to the recent interest in and debate on policy mixes. It is increasingly recognized that a multiplicity of instruments is needed to understand such transitions (see e.g., [10,11,12,13]), but in the main only ex-ante analyses of instrument interaction have been produced so far; we offer an ex-post evaluation instead. Our research question is: how does the composition of the policy mix in each of the three countries explain the respective sales levels of full battery-electric vehicles (FBEVs)? Related to this, we discuss what policy lessons can be drawn regarding the transition to e-mobility.
The paper is organized as follows. The next section reviews the literature on policy mixes and describes our research methods. Section 3 discusses similarities and differences in the national policy mixes of five groups of policy instruments in Norway, the Netherlands and Denmark, including FBEV demand-side (such as financial incentives for FBEV adoption), FBEV supply-side (i.e., FBEV industry policies), FBEV infrastructure, cleaner internal combustion engine (ICE) cars and renewable energy. In Section 4, we analyse and discuss interaction effects within the policy mix in the three countries and their overall impact on electric vehicle (EV) sales. The last Section 5 draws conclusions about the policy mixes we observed and makes recommendations on their use in national transitions to e-mobility and supporting infrastructure within a common EU policy context.

2. Policy Mixes for Low-Carbon Innovation and Transition

2.1. Policy Mixes

The motivation for a policy-mix perspective is that policies ‘do not work in isolation’, i.e., their effect depends on the (policy) situation at implementation, and therefore on their interference with existing instruments and with those implemented simultaneously or later [12]. A large part of the older literature on climate change concentrated on debates about specific instruments appropriate for internalizing the negative externalities that follow from greenhouse gas emissions (e.g., tax versus trading), but it has increasingly been recognized that a variety of instruments is needed to foster low-carbon transitions effectively [13]. System approaches to environmental innovation have highlighted the interrelatedness of individual behavioural and collective social factors both within and between different consumption domains, as well as supply-side factors and infrastructure [14,15]. To address this ‘web of constraints’ on environmental innovation, these studies call for policy mixes and consistently address a number of factors hampering innovation, attempting to anticipate the potential rebound effects between behavioural factors, supply-side and infrastructure and to take advantage of synergetic effects across consumption domains where possible. After all, a single instrument is unlikely to align multiple actors, factors and policy goals, and, moreover, the practical realities of the policy process, in which new policies are introduced in the context of established policies, in effect does deliver policy mixes [16].
Car mobility policy already consists of a complex mix of policies, including emissions regulation, road taxes, infrastructure policy, toll roads etc., mostly nationally, but also locally and on the EU level, although it was not designed deliberately in a single moment, but was rather the result of a range of decisions and considerations over a period of a few decades, which has not necessarily led to an effective and efficient mix. Our definition of ‘policy mix’ is therefore in accordance with Kern and Howlett [17], who refer to policy mixes as complex arrangements of multiple goals and instruments that, in many cases, have developed gradually over many years. Nevertheless, in our analysis we foreground the instrument mix while backgrounding policy goals (so taking a more ‘narrow’ approach, in the words of Rogge and Reichardt [12]. We argue that in our case this makes sense because, as we shall show, policy aims were often formulated in rather general terms. For example, in the Netherlands the aim was declared to be ‘stimulate economic growth, decrease environmental impact’, so every ministry emphasized what best fitted its own interests).
A policy mix perspective draws significant attention to relations between policies to understand the effects of the overall mix [18]. The influence of one instrument involves direct effects and also indirect effects through interference with the operation of other instruments [19,20]. This mutual dependency of instruments means that policy analysis should focus the combined effect of the instrument mixes when evaluating the accomplishment of policy aims [10].
The older literature provides some guidance on how to establish a connection between policy mixes and policy coordination. Painter [21] argues that effective policy coordination entails: (1) avoiding or minimizing duplication and overlap, (2) avoiding policy inconsistencies, (3) minimizing bureaucratic or political conflicts, (4) striving for coherence, cohesion and consensus about priorities, and (5) promoting a comprehensive or ‘whole government’ perspective against the dominant advocacy of narrower perspectives (cited in [22], p. 230).
A specialist literature has developed on policy interactions for energy and climate matters [20,23,24] and innovation [10,18,25]. These studies call for the creation of positive or complementary interactions of policies towards policy aims and the need to avoid negative interactions. In the environment domain, literature on policy mixes primarily concerns ex-ante studies [26,27,28,29] addressing potential and projected interactions and associated design questions, but barely ex-post evaluations. Therefore, this study offers an ex-post evaluation to this body of research by foregrounding the relations between a range of policy domains and instruments related to electric mobility (i.e., both newly introduced and established ones that affect all cars) and explaining the emergence of electric mobility in three countries, Norway, the Netherlands and Denmark, between 2010 and 2015. Our question is: How does the composition of the car mobility policy mix relate to trends in FBEV sales levels in these three countries?

2.2. Methods and Data

We opted for a qualitative approach to answering this question because quantitative evaluations of policy mixes are usually not capable to comprehend effects of mixes that involve non-economic instruments, which tend to be significant in low-carbon transitions [30]. The complexity of policy systems calls for a qualitative approach which takes account of the details of policy instruments and interaction effects together with relevant mobility situational characteristics (charging infrastructure, special lanes for battery cars, etc.) and the competition of battery electric vehicles with plug-in hybrids and green ICE cars. The integration of all these aspects into the analysis requires a consideration of multiple types of evidence (interview survey information about arguments for policy instruments and their effects, about arguments for buying an electric car and for installing charging/battery exchange stations, supplemented with information on diffusion rates, total cost of ownership for different types of cars, etc.).

2.2.1. Interviews

As already noted, interviewing was a key method used in this research. We started by interviewing national policy-makers involved in e-mobility policy and then went on to select (relevant) stakeholders by combining the opinions of other interviewees (‘snow-balling’) with what followed from the analysis of written sources (positional approach). As Table 1 shows, this gave us a list of 27 stakeholders. Accordingly, we conducted semi-structured, personal interviews with policy-makers, researchers, non-governmental organizations (NGOs), project managers, business employees and branch organizations in Denmark (11), Norway (8) and the Netherlands (8) during 2013–2015. The group of interviewees included both those directly involved in policy decisions and implementation (‘insiders’—indicated by ‘ins’ in Table 1) and experts and stakeholders who had good knowledge of e-mobility policies but were not directly engaged in their making or implementation (‘outsiders’). This happened to result in a balance between ‘insiders’ and ‘outsiders’. Interviews lasted between forty and ninety minutes and were transcribed. As the interview format shows (see Appendix A), we asked interviewees what they consider to be the policy instruments that are shaping sales of FBEV, how, and how these interact; whether the amount of resources and effort allocated to or invested in a policy instrument was strong, medium or weak; and also what they consider to be the most relevant stakeholders and policy or other reports regarding electric mobility.

2.2.2. Interview Analysis

The interview transcriptions were coded to identify ‘policy instruments shaping sales of FBEV’. In each of the three countries one person initially coded all the interviews held in that country individually. This was followed by a joint Skype discussion to compare and align the coding. Based on this discussion we agreed on five types of policy that were relevant for e-mobility: FBEV demand-side, FBEV supply-side, FBEV infrastructure, cleaner internal combustion engine (ICE) cars and renewable energy. Four of the five types had been identified in each country: in the Netherlands ‘renewable energy policy’ had not been mentioned as a relevant policy type, but it was added to the analysis at this stage.
The next step was to code the transcriptions regarding the intensity of each policy type, i.e., the amount of resources and effort allocated to or invested in a policy instrument (so we follow [31] in a more qualitative definition of intensity, see also [32]; we use three categories: strong, medium or weak. Initially one person in each of the three countries coded all the interviews held in that country individually. This was followed by a joint Skype discussion to explain what we took to be strong, medium and weak, and after this ‘qualitative calibration’, everyone gave final scores to his/her own country policies.
Finally, we coded the transcriptions regarding the type of interaction between the five policy types. We used a coding framework for this following the types of policy interaction set out by [33], who distinguish three types of relationship: (1) preconditioned linkages, where the successful implementation of one measure is completely contingent on another; (2) synergetic linkages, where the functional capacity of a measure is enhanced by another; and (3) contradictory linkages, where two or more countervailing policy measures undermine the functional capacity of both or either. We added a fourth ‘neutral’ relationship in case none of the above three was applicable. Here too, initially one person in each of the three countries coded all the interviews held in that country individually. This was followed by a joint Skype discussion to explain what we took to be pre-conditional, synergetic, contradictory and neutral, and after this ‘qualitative calibration’ everyone gave final labels to the interactions in his/her own country.

2.2.3. Written Sources and Analysis

As noted above, we asked interviewees what they considered to be the most relevant policy reports or other reports regarding electric mobility. This gave us a list of about twenty reports that we included in the analysis (see Appendix A). These reports were not coded, but relevant data (numbers of sales, recharging spots, prices, cost, etc.) were used to give more context to the interaction effects and intensities observed by the interviewees and make them more specific. Additionally, based on the written sources, descriptions were made of the policy instruments that stakeholders mentioned in each of the three countries.
As a last analytical step, the policy intensities and interaction effects noted above were correlated with sales figures for FBEVs. The first author drafted an explanatory narrative for each of the three countries, including a discussion of similarities and differences. In a second step, all the other authors jointly revised these narratives on paper, based on their interpretation of the policy intensities and interaction effects.
Finally, we organized stakeholder round tables in each country (in 2015) to reflect on our understanding of the relation within and subsequent effects of the policy mixes with stakeholders. This confirmed the core of our analysis and conclusions.

3. Divergent Policy Paths in Norway, the Netherlands and Denmark

3.1. Policy Mixes

Which policies were relevant to e-mobility? In the interviews stakeholders reported five types of policy as the main ones shaping e-mobility: policies designed to stimulate FBEV mobility (demand policies, supply policies and infrastructure policies), as well as ICE car demand-side policies and renewable energy policies. Table 2 provides details of these policies in the three countries. Here we discuss the main similarities and differences, starting with (ICE and energy) policies that were already established when FBEV support was being implemented. (The Danish Council on Climate Change [34] provides an updated overview of goals, policies and market shares for FBEV and PHEV in eight EU member states (Denmark, Norway, the Netherlands, Sweden, Finland, Britain, Belgium, Germany) as well as California (2014–2018). The market shares of FBEV and PHEV have gone down in Denmark and the Netherlands compared to 2015 but have continued to go up in Norway. This is consistent with the relative policy mixes outlined in this article.)

3.1.1. ICE Car Demand-Side Policies

When the three countries started to actively encourage e-mobility (broadly) after 2010, this took place in the context of an established demand policy for ICE cars. As Table 2 shows in more detail, all three countries have a history of relatively high taxes on car mobility, Denmark’s being the highest. These high taxes indicate that tax exemptions for electric cars would provide a relatively high financial benefit for electric car buyers in all three countries (highest in Denmark, followed by Norway, then the Netherlands).

3.1.2. Renewable Energy Policies

Denmark and especially Norway are strongly committed to renewable energy, with Norway generating more than 95% of its electricity through hydropower, thus providing carbon-free electricity for e-mobility. Denmark has been decarbonizing its energy system mainly through wind energy from the 1990s onwards, reaching 43% of renewables by 2013, and it regards electric mobility as a possible instrument for stabilizing the grid and therefore favouring the electrification of road transport over, for example, biofuels (see details in Table 2). The Netherlands has a tradition of domestic gas exploitation and revenues, and has accordingly showed much less ambition to promote renewable energy in recent decades. Its current target is 14% by 2020, but even this was relaxed before 2013, having been 20% earlier. This implies that in the Netherlands the debate about e-mobility was disconnected from the debate over renewable energy policy, whereas in Norway and Denmark supporting e-mobility was seen as creating synergies with their renewable energy policy.

3.1.3. FBEV Demand-Side Policies

As noted, each county actively encourage the demand for e-mobility. As Table 3 shows, they use similar demand-side instruments, especially exemptions on sales and annual road taxes. In the Netherlands, these tax benefits are equally high for plug-in hybrid electric vehicles (PHEVs) as for FBEVs, whereas in Denmark and Norway PHEVs have smaller benefits than FBEVs. Another significant difference involves the drivers of company vehicles. Dutch commercial drivers benefit from additional tax exemptions (the MIA/VAMIL and KIA schemes) that amount to thousands of euros over the vehicle’s lifetime. As noted above, absolute tax savings differ as each country starts from different sales and annual tax levels, these being highest in Denmark, followed by Norway, then the Netherlands [8,37]. (Sierzchula et al. [8] compare overall tax savings in various countries for a Nissan Leaf in 2012. In absolute terms, they find Denmark has the strongest financial incentives (around 33,000 USD in sales and annual taxes per vehicle), followed by Norway (15,000 USD) and the Netherlands (10,000 USD). The high reduction in Denmark is due to a proportionally higher vehicle sales tax to begin with, although when demand benefits like free toll roads, free parking, etc. are included, total demand side incentives in Norway are slightly higher than in Denmark [37]).
In each of the three countries, excise duties on petrol and diesel are well above the EU average (Table 4). This gives FBEVs a relative advantage over ICEs in terms of operating costs. Furthermore, in Denmark the tax rate of electricity delivered by charging stations was lower than the rate for private households. This rebate was phased out from 2016.
Norway is an exception in terms of the various FBEV driver benefits that are available in addition to the tax benefits, namely free municipal parking (since 1993), free use of toll roads (since 1996), access to bus lanes (since 2008), free ferries (since 2008) and free charging at public charging points (since 2009). Such benefits targeting the car owner have not been established elsewhere on the same scale. Dutch law does not allow free parking for FBEVs, although Amsterdam tried it in a pilot project until 2012. Amsterdam and other cities favour FBEV- and PHEV-owning residents with the immediate issue of a parking permit, which normally takes about a year to obtain, and a charging spot in their street. In Denmark, prior to 2014 municipalities were not allowed to charge different parking fees based on environmental impact.

3.1.4. FBEV Infrastructure Policies

To ensure the implementation of charging infrastructure, each country has introduced different policy instruments. In Denmark, the initial costs of installing charging points were fully subsidized by two funding programmes, although the ceiling for subsidies has subsequently fallen to forty percent for fleet projects. As noted in the context of renewable energy policy, FBEV infrastructure policy in Denmark is closely related to the country’s smart grid policy, reflecting the need for flexibility in future electricity systems to handle large amounts of fluctuating wind energy. The development of Denmark’s FBEV charging infrastructure has thus built on the active involvement of both energy companies and infrastructure developers. In contrast, since 2010 the Dutch government has drawn up neither budgets nor targets for constructing charging infrastructure, the general philosophy being that ‘charging spots would follow once the vehicles were there’ [42]. The Formula E-team (see below) stimulated various organizations to implement charging infrastructure, coordinating where possible. Many public charging spots were constructed by (1) semi-public electricity grid operators, (2) a few private firms focusing on fast charging stations along highways, (3) large warehouses (such as IKEA) and businesses, partly co-funded through a ‘green deal’ innovation fund, and (4) local governments, mainly in the four largest cities and near the houses of PHEV or FBEV owners. The team also coordinated an interoperability agreement for the national recognition of vehicle charging cards and ways to overcome legal barriers to developing recharging infrastructure. In Norway, there has been a mix of public–private partnerships and municipal initiatives. The public agency Transnova was charged with developing a strategy for FBEV infrastructure (2009–2014), which FBEV stakeholders have also been involved in constructing. Public funding has been key: 50 million NOK for normal charging infrastructure, about 9 million NOK for fast chargers, and 2.5 million NOK annually for Grønn Bil (see below) [43]. Local and regional authorities acting in parallel have launched their own strategies for charging infrastructure. In sum, these different infrastructure policies and investments have contributed to some striking differences in the density of charging stations and in the uptake of FBEVs in the three countries (Table 5). As of 2012, Norway led in terms of these indicators, followed by the Netherlands and then Denmark.

3.1.5. FBEV Supply-Side Policies

Supply-side policies are designed to stimulate the emergence of businesses around electric mobility, i.e., vehicle manufacturing, technological components or infrastructure installation firms, consultancy, etc. Norway has had these policies in place from the 1990s, and the small domestic FBEV producer (Pivco), which was supported, has triggered a positive public attitude to electric driving, as manifested in the early FBEV driver benefits mentioned above. While the Netherlands has had no domestic FBEV producer, Denmark hosted home-grown FBEV producers CityEL and Kewet in the early 1990s, but because of a lack of support they both moved abroad. In Norway, Pivco benefited from various forms of public support, including public RD&D funding (Norwegian Pollution Control Authority) to develop new models and a risk loan (public investment company, 2009) to stave off bankruptcy, though unsuccessfully (2011), but by then it had already had a profound positive effect. Compared to Norway, supply-side policies in Denmark and the Netherlands are relatively recent. Since 2008, Denmark’s supply-side policy has focused on supporting smart grid development. Several energy RD&D programmes have prioritized the smart grid [44] while also supporting battery and charging management technology. In the Netherlands in 2009 an ‘action plan e-mobility’ was developed by an inter-departmental team that designated about 65 million euros for innovation experiments (R&D funding and more practical ones) and information and coordination activities in 2009–2015, including the Formula-E-team (see below). In contrast to Norway, synergies between supply-side and demand-side instruments in the Netherlands and Denmark only started to show benefits from 2010.

3.1.6. Embedding Governance

In each of the three countries, the policy instruments were embedded in a slightly different way in the governance context. In the Netherlands in 2009, a public-private taskforce on electric mobility, the Formula E-team, was created to increase the interest in electric mobility. It consists of businesses, NGOs, branch organizations, local governments and an ‘ambassador’ from the royal family, but it lacks independent innovation policy experts. The shared aim is to stimulate collaboration among its members and thus to develop electric mobility. In 2011 the taskforce set a target of 15,000–20,000 electric vehicles (FBEV or PHEV) to be sold by 2015, 200,000 by 2020, and a million by 2025. These general targets were set in association with government ministries, with the notable exception of the Ministry of Financial Affairs, which was responsible for the tax regime.
In Norway in 2008, the Ministry of Transport initiated an action plan on clean transport that also launched a public-private initiative, Grønn Bil (‘green car’) [45]. Grønn Bil was founded by a trade association (Energy Norway), a public transport agency (Transnova), a regional authority (KS) and a Norwegian NGO (ZERO). As in the Dutch case, the target was 200,000 FBEVs and PHEVs by 2020 [46]. The initiative also provides systematic data on the registration of FBEVs and PHEVs and installed charging infrastructure.
In Denmark, two support programmes were established in 2008–2009 on the use of electric cars (under the Energy Agency) and on the greening of transport (under the Transport Agency). The programmes were somewhat aligned, and both emphasised the demand side and FBEV use in practice. Issues related to infrastructure and some supply-side factors were also included. Together these programmes funded FBEV projects, supported local electric vehicle partnerships (2013–2015) and funded fleet projects bringing together private and public organizations to establish FBEV fleets and charging points and build experience with practical FBEV use. Among other demand-side initiatives, the Energy Agency has promoted dialogues with local and regional municipalities on the procurement and use of FBEVs and the establishment of charging spaces. It has also established experience-exchange networks for local and regional municipalities and for firms designed to systematically collect, analyse and communicate real-life experiences with FBEVs.

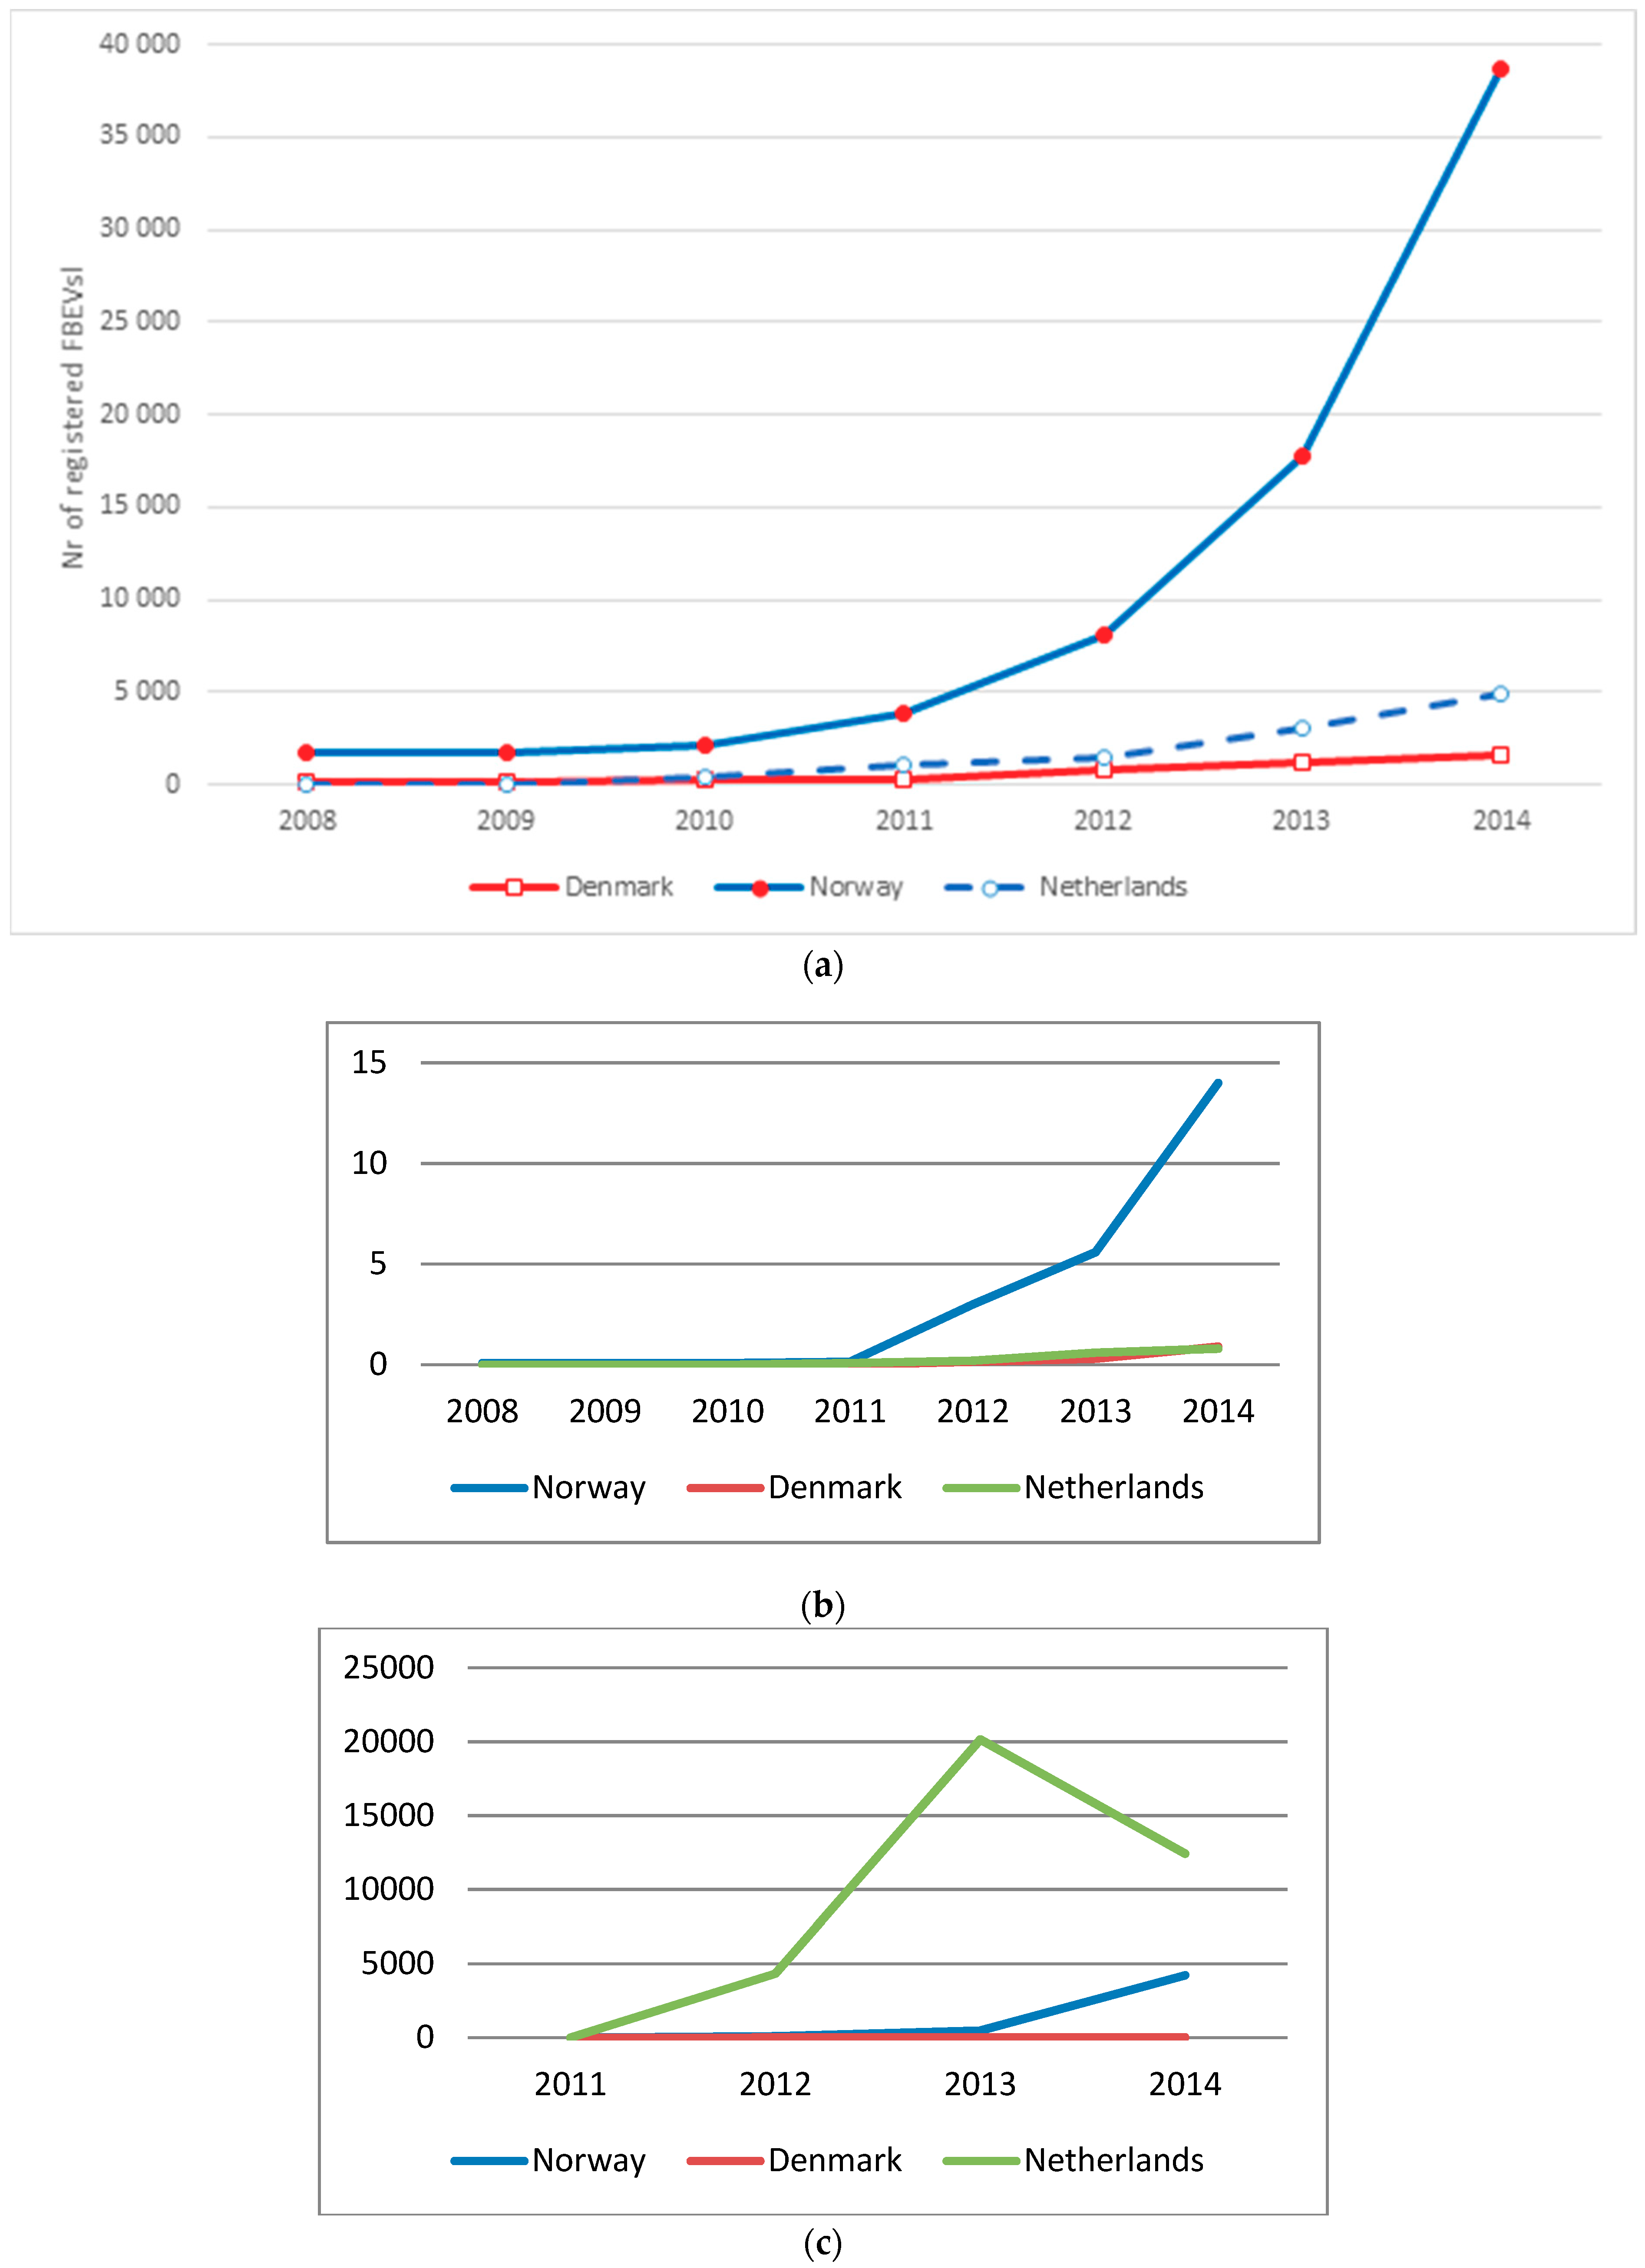
3.2. Policy Outcomes

In this section, we discuss policy outcomes in our period of study (2010–2015). There are striking differences in the market share of FBEVs in Norway, Denmark and the Netherlands, both in terms of absolute level and share (Figure 1a,b). New FBEV registrations in Norway have doubled yearly since 2009, while they have been fairly constant in Denmark since 2012. In 2014 new FBEV registrations were thirty times higher in Norway (almost 20,000) than in Demark (600). The Netherlands has a low market for FBEVs (same as Denmark) but a high market for PHEVs (see Figure 1c).
In the remainder of this section, we first offer an explanation for the observed differences. Policy interaction effects are discussed in more detail in Section 4, where we discuss the synergetic policy effects, conditional effects and contradictory effects. The main reason why FBEV diffusion is so high in Norway is the large fiscal stimulus and ‘fringe benefits’. In Norway, electric car owners do not pay the road tolls, ferry fees or city emissions charges that other Norwegian car owners face. Other important perks include parking for free and being able to bypass traffic by driving in some bus lanes [47]. In the Netherlands, FBEV sales were limited by a subsidy scheme that made no distinction between PHEVs and FBEVs, which led people to opt for the former as the more attractive option. PHEVs were overwhelmingly bought by company drivers who benefitted from multiple subsidy schemes. The advantages of PHEVs were reduced relative to FBEVs in 2014 upon discovery that PHEV emissions were not low in practice, in part because these vehicles were not driven in electric mode very much, leading to a peak in PHEV sales in December 2013.
In Denmark, the diffusion of FBEVs was slow, especially among private households, which were reluctant to buy FBEVs given the competition between two incompatible recharging standards. The public funding for recharging infrastructure led to a unique joint venture between the largest electricity distributor in Denmark, Dong Energy, and the Israeli-American start-up Better Place, which introduced battery-swapping stations at a number of sites, though they were only compatible with a limited number of models, namely Renault and Nissan. In addition, recharging spots were constructed for other EVs, including Tesla’s. Both Better Place and Tesla promised to ‘revolutionize automobility’, but with many potential customers reluctant to choose, the Better Place scheme went bankrupt. The FBEVs that were sold were often in the fleets of municipalities, regional authorities and large private firms, not owned by private households. Government support to fleet establishment (dialogues, procurement, etc.), noted above, may have been effective here.
The differences in FBEV diffusion curves can partly be explained by comparing the total costs of ownership (TCO, euro/km). Kley et al. [38] show that in most countries, despite incentives, the TCO for mid-sized FBEVs is higher than for ICEs. Exceptions are Denmark and Norway, and for PHEVs the Netherlands and Norway. For smaller city vehicles the total costs for FBEVs are lower in Belgium, Denmark, Spain and Norway (Oslo). This is an important element of the explanation of the relative effectiveness of the three policy mixes. (Evaluating the effectiveness of a policy instrument or mix assumes an unambiguous policy aim, but as our study shows, in the case of FBEVs various policy departments in the same national government had their own particular aims. Therefore our indications of effectiveness in the three countries adopts a relative approach, taking the relative level of FBEV sales as the benchmark, hence it does not necessarily reflects the effectiveness of any government department in particular). Although the nature of financial demand instruments in Norway and the Netherlands are clearly significant (to explain the high FBEV sales and high PHEV sales, respectively), however, the fact that this did not also lead to strong FBEV sales in Denmark (and, to a lesser extent, why there were not more PHEV sales in Norway) is an anomaly. It is therefore important to take into consideration other instruments in the policy mix, as we shall now do.

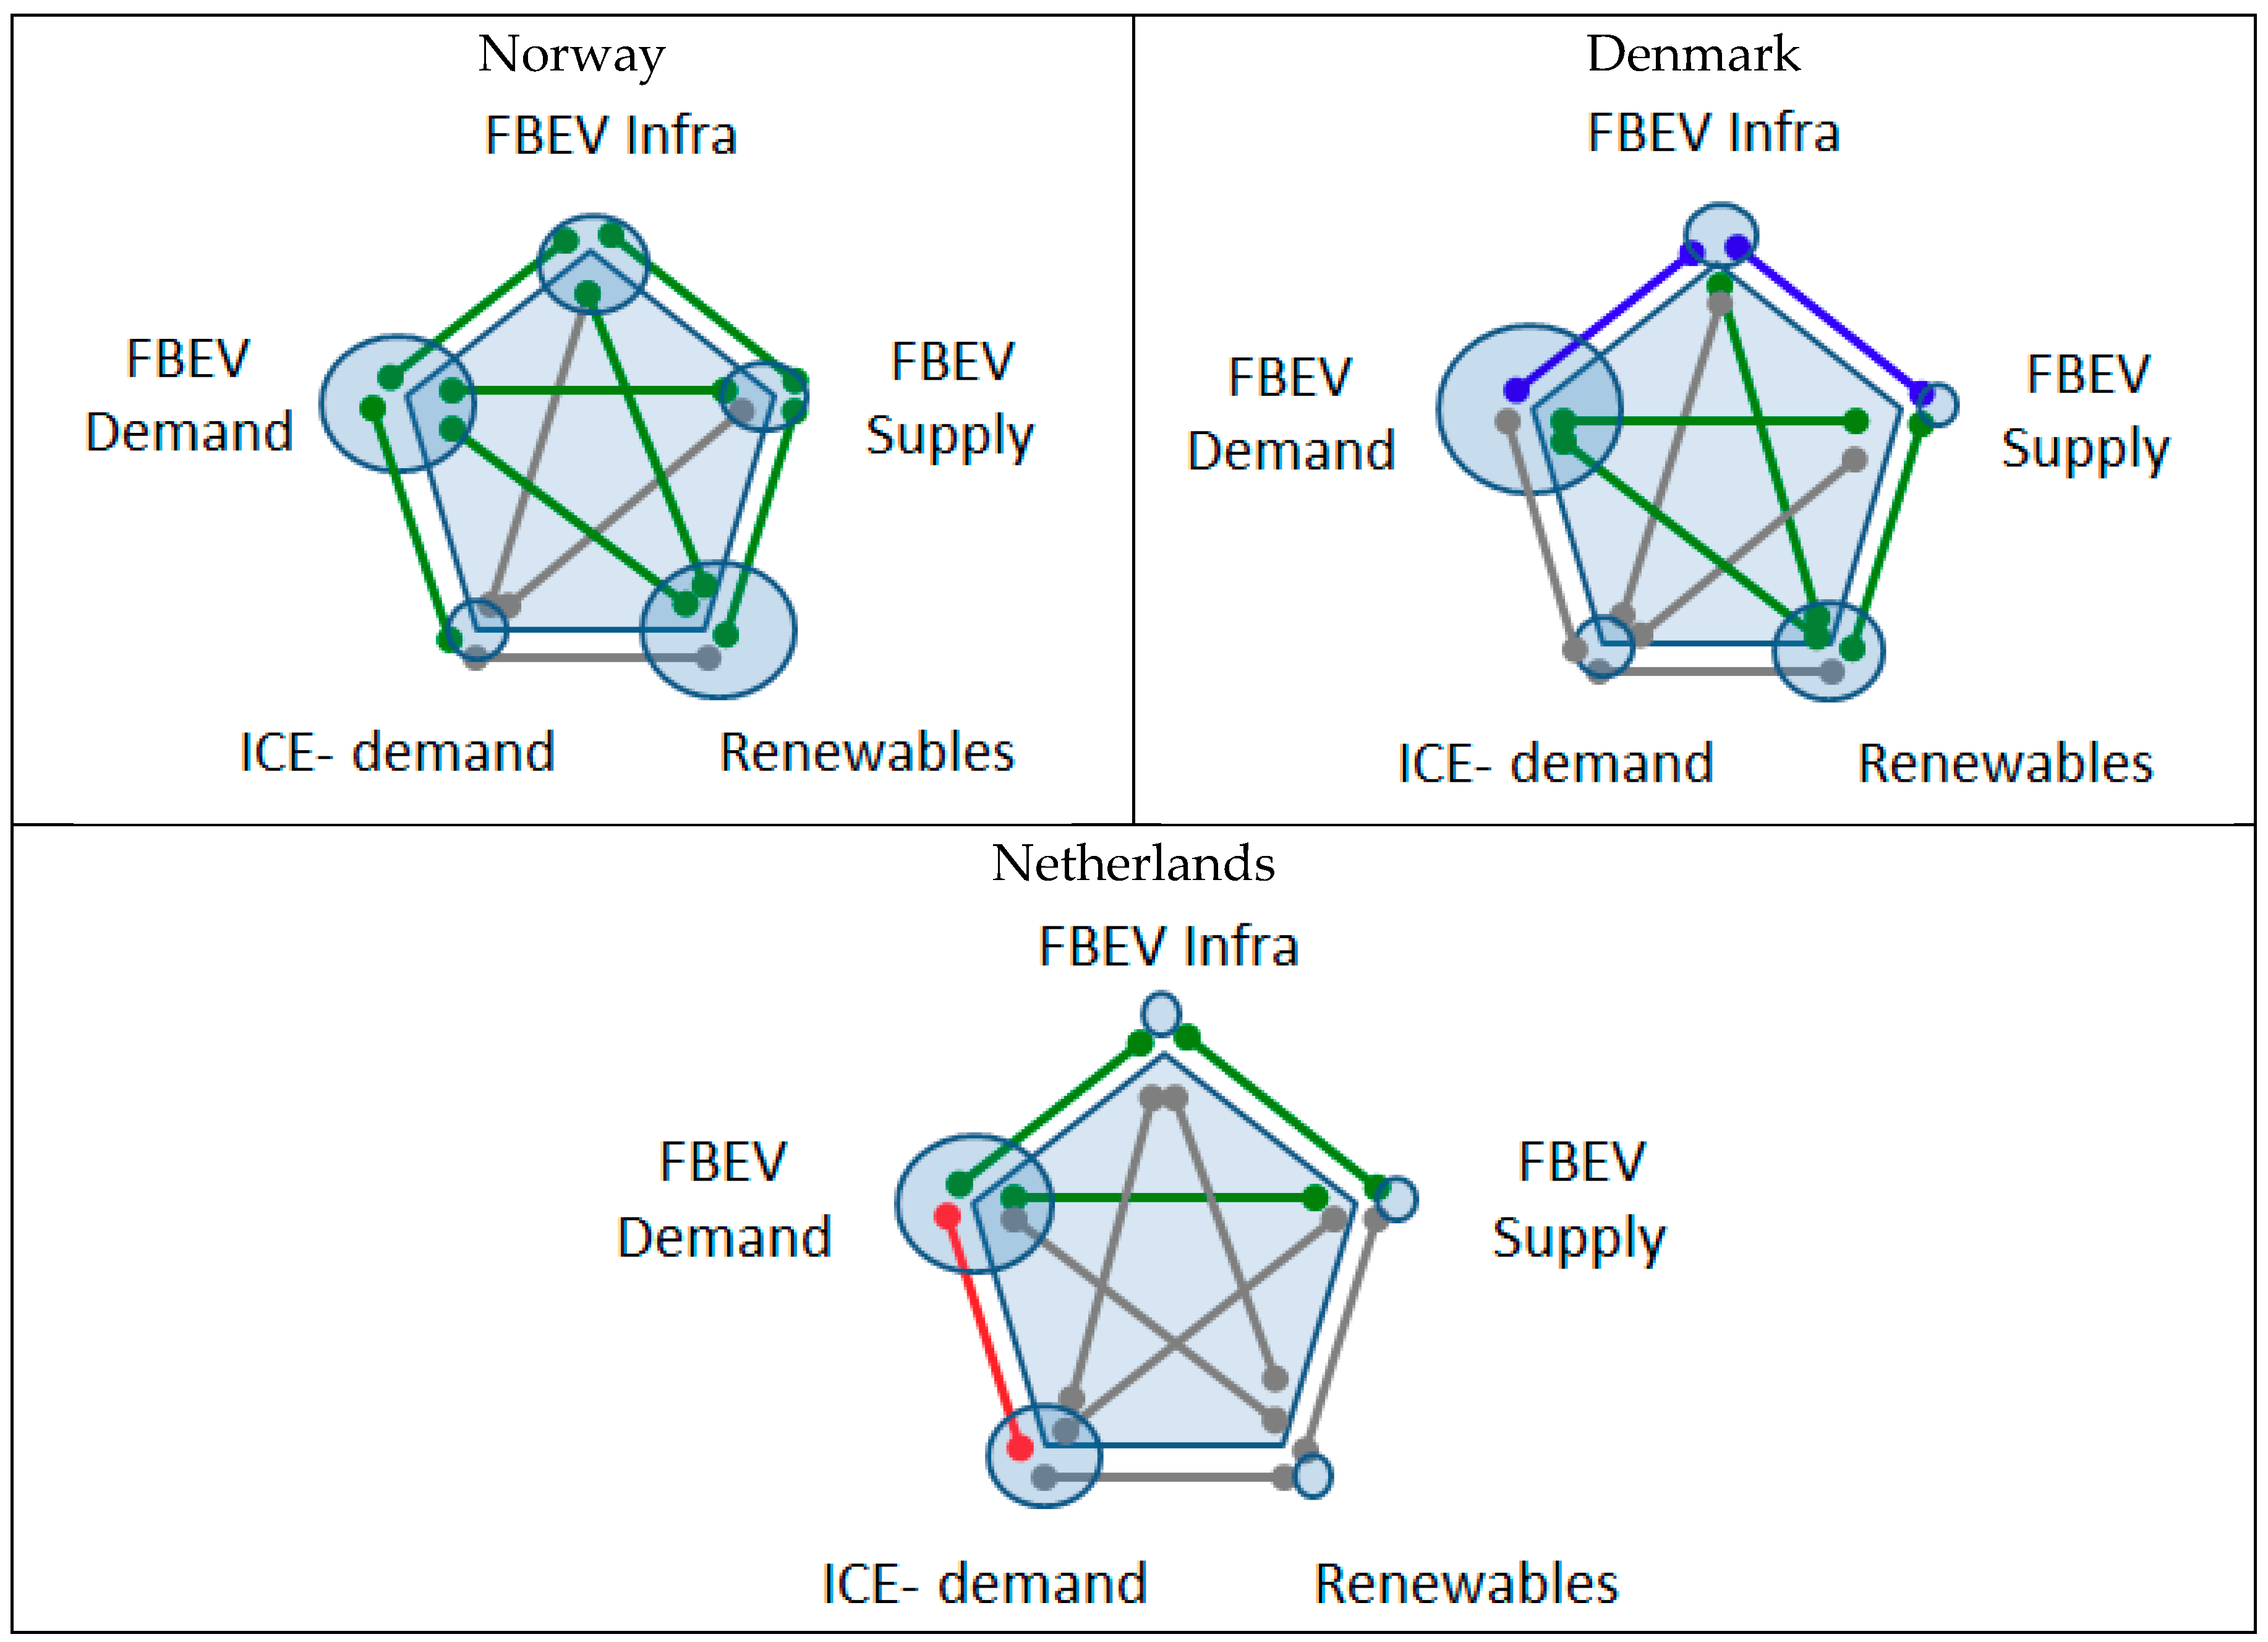
4. Policy Interaction Effects and Discussion

This section compares the composition of the policy mixes that affect e-mobility in the three countries in terms of policy synergies, contradictions and conditional effects to explain EV sales. We show in Table 6 below how stakeholders evaluated the intensity of the five policy types that were reported to be relevant for e-mobility, as discussed in the previous section. Figure 2 indicates these intensities through the size of the ‘bubbles’, as well as showing how, on average, stakeholders qualified the interactions between the five policy areas.
A key difference in the policy mixes of Norway and Denmark has been the relationship of infrastructure policy to demand and supply policies. In Denmark, it was generally left up to local actors to establish the infrastructure. An innovative battery-swapping system was introduced with so many promises that its success was effectively a pre-condition for demand and supply to remain confident in e-mobility as such (see relationship coloured blue in Figure 2). This risky strategy turned out to be unfortunate because the system failed to deliver an affordable scheme and this affected suppliers and consumers negatively. In Norway, the recharging infrastructure (paid for with public money) was well aligned with demand measures and vehicle adoption levels (see relationship coloured green in Figure 2). In the Netherlands, the building of infrastructure was a private-public matter with little oversight or planning. The Dutch government created an organization called the Formula E-team to stimulate others to build infrastructure. The philosophy was that ‘the recharging spots will follow when we stimulate the vehicle sales’. The team seems to have performed its coordination role well, and none of the experts suggested that this zero-budget infra-strategy delayed FBEV/PHEV adoption to any extent (see relationship coloured green in Figure 2). There was an unplanned positive interaction with air-quality policy as national funds for improvements to air quality could be used by local governments to build recharging infrastructure. In sum, some central support (fiscal or organizational) for recharging infrastructure is an essential element of an effective policy mix promoting FBEVs.
The alignment of FBEV policies with those for PHEVs and ICEs also proved to be an important factor behind the observed differences. In the Netherlands, PHEVs were treated equally with FBEVs until 2014, and there were significant financial incentives, including tax exemptions, for the most efficient a-label ICE cars, which made these very attractive both for manufacturers in enabling them to offer more models, and for consumers, and sales levels were accordingly high. Cleaner ICEs (i.e., emitting 80–100 gr CO2 per km) were financially most attractive, in the sense that the TCO was lowest, reducing the attraction of zero-emission FBEVs. The same was to some extent true in Denmark [48]. In our scheme of policy interaction effects, the support policies for cleaner ICEs are an example of a clash with support of FBEV demand (as indicated in red in Figure 2). In Norway, the high taxes for all ICE vehicles, although distributed according to CO2 emissions, and fiscal stimulation policies for FBEVs meant that the TCO for FBEVs has been lower than for ICEs, giving FBEVs a competitive advantage, as indicated by the green relationship between FBEV demand and ICE demand policies. In sum, to be an effective element of the policy mix promoting FBEVs, financial incentives should mirror the life-cycle carbon footprint of the respective vehicles.
In all three countries, demand-side policies and supply-side innovation policies were pursued synergetically, at least to some extent (see Figure 2, all green). In Norway, free municipal parking (since 1993), free toll roads (since 1996) and free access to bus lanes (2008) had great significance for early adopters [49]. These policies resulted from a coming together of the industrial and climate rationales in Norway [50], showing that non-fiscal incentives may be an important element in the policy mix promoting FBEVs.
Denmark and the Netherlands are both small, densely populated countries that tend to drive relatively small and fuel-efficient cars. The fact that supply-side support for e-mobility emerged only after 2009 meant that domestic businesses related to e-mobility were still in their infancy in our study period, while the associated public familiarity with FBEVs remained at an order of magnitude lower than in Norway. The strong demand-side financial instruments for e-mobility in Norway and Denmark were well aligned with their renewable energy policies (indicated in green in Figure 2), and these synergies have also tended to strengthen the legitimation of e-mobility support. In the Netherlands such synergies were absent (indicated grey in Figure 2), although more general arguments for lower oil dependency, green growth potential and environmental benefits (climate, air and noise) were highlighted as key reasons for the policy support.
Although it did not conduct an exhaustive analysis of the reasons for policy consistency or imperfections, ‘level of coordination’ comes out as a relevant factor here. The Dutch e-mobility strategy was introduced at a time when electric vehicles were ‘hot’ and every minister announced his own way of stimulating them. With the Ministry of Financial Affairs not being involved in the coordination, this resulted in a policy portfolio with much greater benefits for company car drivers than anticipated, leading to perverse effects on the consumer side (see above). As a positive example, in Norway there was strong alignment between national policies (purchase and annual tax exemptions) and local policies (toll-road and parking exemptions), which, in combination, acted as a significant pull for FBEV adopters.
Another important policy lesson is that over-stimulation of FBEVs leads to perverse effects. For adoption purposes, the TCO of FBEVs should be lower than that of ICEs in promoting uptake, but the difference should not be too great. The Dutch case offers evidence of PHEVs or FBEVs being bought as an additional vehicle instead of an ICEV replacement and of PHEVs being driven in gasoline mode. The case of Denmark also brings home another important lesson for policy, namely the danger of relying too much on a specific technology configuration, as was the case with the battery swapping model, where only one type of vehicle was available (the Renault Fluence Z.E.). Innovation experiments with infrastructure are generally useful unless they increase consumer uncertainty too much.
The reasons why the three countries introduced active support policies for FBEVs differ, being associated with differences in energy supply and ambitions for a domestic car industry. For Norway, with its endowment of large amounts of hydropower, electric cars were an attractive new market. Denmark, seeking to handle fluctuating electricity from its wind-power plants, envisaged FBEVs as a means to store electricity as a component in smart grids, although this has turned out to be more difficult than assumed. The main motivation for the Netherlands, at that time a natural gas producer with a fossil fuel-based electricity system, was to generate commercial opportunities in e-mobility. Cleaner air benefits in cities were an important motiving factor in all three countries too, supplementary to those already mentioned, and more important for local than for national authorities. In summary, the policy mix in Norway is rich in synergies and is very effective for broadly the same overall cost as in the Netherlands. It has a longer history of both supply-side support (primarily Pivco) and benefits for FBEV users (free parking and toll roads). As a result of the combination of high taxation of ICE vehicles with tax exemptions for FBEVs, an FBEV is financially the most attractive option for the Norwegian consumer as small car, primarily as a second car in early adopting households [49].
The Danish policy mix has experienced synergies between the demand-side elements of the high tax benefits of FBEVs and use-oriented funding programmes. Synergies with smart grid efforts have so far been primarily on the strategic and experimental levels and have not yet been realized in practice. Relatively limited infrastructure compared to Norway and the Netherlands and the absence of additional user benefits, as in Norway, help to explain why FBEVs have not been adopted more widely, despite the strong financial demand-side measures.
The Dutch policy mix had various synergies between demand, supply and infrastructure policy, although most of the financial burden had been on the demand side. Little public money had been spent on recharging infrastructure, but the strategy to stimulate other parties to do this was very successful. The Achilles heel was the equal tax exemption for PHEVs until 2014 and also those for clean ICEs, which still left compact ICEs the most attractive option as a second household vehicle (a typical lead market for FBEVs), in spite of tax exemptions for FBEVs. We estimate that the total costs (or forgone tax revenues) of the Dutch policy mix have broadly been in line with those in the Norwegian case (about 400–500 million in 2014) [51].
In terms of governance, Norway and the Netherlands have both relied on stakeholder platforms for e-mobility as a form of governance. The platforms brought together expertise and actors interested in electric driving. In the Dutch case, the important Formula E-team did not include representatives from the Ministry of Financial Affairs, which declined the invitation, nor external experts on innovation policy, who were not approached. The involvement in the team of these two actors (the first being responsible for taxation) might have improved the adaptation of the tax regime and the calibration of forgone taxes for electric vehicles and prevented similar ‘losses’ as for cleaner ICE taxes in 2007–2009. Nevertheless, keeping an arms-length relationship from parties interested in electric driving has proved useful. In general, it is desirable that policy choices should be critically scrutinized by independent experts in the sector (innovation field) in order to build in safeguards against cost inefficiencies. The Dutch experience illustrated the importance of embedding autonomy, discipline (the use of time-bound incentives and programme reviews) and accountability, as identified by industrial policy expert Dani Rodrik [52]. Whereas strategic collaboration and coordination between the private sector and the government helps in learning about the most significant bottlenecks and in identifying and discussing useful interventions, discipline in the support, accountability and legitimacy of policy actions helps to secure the public interest.

5. Conclusions and Policy Implications

Despite apparent similarities in respect of various social aspects, Norway, the Netherlands and Denmark have pursued divergent policy paths in promoting the dissemination of FBEVs and rolling out FBEV infrastructure. These north-western European countries were all early adopters and active propagators of e-mobility. A comparison of their respective policy mixes in terms of the instrument interaction effects can explain to a significant extent the relative FBEV sales levels. What we found is that Norway was most effective due to synergies between sustained supply-side stimulation and comprehensive demand measures rather than tax exemptions. Denmark was least effective due to inconsistencies between its ‘double’ infrastructure strategy and the demand side, while The Netherlands was relatively ineffective due to inconsistencies between FBEVs’ and PHEVs’ demand benefits, which were similar, and to a lesser extent clean ICEs.
The first important policy conclusion of this paper thus is that, in adopting FBEVs, the policy mix is very important: The Norwegian policy mix was most effective, the Danish mix was least effective, while the Dutch mix achieved somewhat more than the Danish. The elements of an effective policy mix are:
  • Fiscal incentives that mirror the actual carbon footprint of the respective vehicles
  • Non-fiscal demand-side incentives, such as free use of toll roads, free parking or free use of bus lanes
  • Centrally financed and/or coordinated charging infrastructure
  • Clarity regarding the choice of technology that will be supported
Moreover, development of a domestic, e-mobility-related industry and a high share of renewable energy strengthens the legitimization of e-mobility support. Whether all these measures are necessary is difficult to say, but each element was positively appreciated by prospective adopters. Contradictory effects were observed in the Netherlands, where the support for cleaner, i.e., more fuel-efficient ICEVs encouraged many people to opt for a cleaner ICEV or PHEV rather than an FBEV. Undesirable synergetic effects were also observed in the Netherlands in the form of the existence of multiple subsidy schemes for company car users, which led them to buy electric vehicles for purely economic reasons, leading to the undesirable effect of cars being driven primarily (80%) in fossil-fuel mode, meaning that a good deal of the money that went on promoting electric mobility and cleaner air was being misspent. It is clear from the comparison of the policy mixes of the three countries that contradictory effects or negative synergies may have very significant effects on adoption. To attain complementarities between the different elements of the policy mix is crucial.
As for the costs incurred in the form of forgone tax revenues and direct expenditure, the total costs of E-mobility support in Norway and the Netherlands are broadly comparable, although the Dutch expenses were mainly on PHEVs. The cost of the Danish mix was lower because fewer vehicles were sold. In Denmark, a large share of the costs was covered by the energy industry.

Limitations and Future Research

The analysis offered in this paper has a number of limitations. We have highlighted the nature of the relationships between the five types of policy instrument, but in practice these are not homogenous. After all, every policy type consists of a few different instruments, so interrelations may be more multifaceted and the indicated nature should be seen as the primary but not necessarily the only one. Second, because of language issues and time limitations, only the researchers in the respective countries analysed the interviews and reports. Interview transcriptions were not translated into English, so the corroboration of the coding was only done in discussions between the researchers and not through reading each other’s interviews (or reports). Third, because we sought a country-level comparison, the level of empirical detail for each country is lower than if looking at only one country. Finally, our data do not include the most recent developments. However, we intend to explain the introductory period of e-mobility in different countries and therefore our policy conclusions are still relevant for countries that are still in an introductory phase. In addition to the policy insights, our qualitative, ex-post, country comparison offers a new direction to the policy-mix literature in terms of methodology. Future research should pursue more country comparisons and seek to integrate more quantitative analyses of particular effects into the qualitative approach that we followed. This may deliver a ‘best of both worlds’ in terms of insights into the socio-political complexities involved through the qualitative methods, combined with econometric insights into particular effects through quantitative analysis.

Author Contributions

Conceptualization, M.D., E.I., A.K., R.K., S.B., M.B.; methodology, M.D., E.I., A.K., R.K., S.B., M.B.; software, validation, formal analysis, investigation, M.D., E.I., A.K., R.K., S.B., M.B.; resources, data curation, writing—original draft preparation, M.D., E.I., A.K., R.K., S.B., M.B., P.M.; writing—review and editing, M.D.; visualization, M.D.; supervision, project administration, funding acquisition, R.K. All authors have read and agree to the published version of the manuscript.

Funding

The Dutch part of this research received funding from European Union’s FP7 under grant agreement No. 308371 (project named “Policy Options for a Resource Efficient Economy” (POLFREE). The Norwegian and the Danish part of this research received funding from Nordic Energy Research under the project “TOP-NEST Technology Opportunities in Nordic Energy System Transitions” (project number 42).

Acknowledgments

We are grateful to Paula Kivimaa, Karoline Rogge and Phil Johnstone for comments on an earlier version of this paper. The usual disclaimer applies.

Conflicts of Interest

The authors declare no conflict of interest.

Appendix A

Appendix A1. Interview Format

  • What do you consider the policy instruments shaping sales of FBEV, and how (i.e., what was its effect)?
  • How do the policy instruments (see previous question) influence each other? (specify each pair). For example, do they work together or against each other?
  • Was the amount of resources, efforts, activities, etc. that was invested in the policy instrument? (specify for each policy instrument).
  • What do you consider the most relevant stakeholders and policy or other reports regarding electric mobility?

Appendix A2. List of Policy or Other Reports Included in the Analysis, but not Cited in the Text:

NL: [53,54,55,56,57]
DK: [58,59,60,61,62]
NO: [63,64,65,66,67,68]
All countries: [69,70];

References

  1. Althaus, H.-J. Modern individual mobility. Int. J. Life Cycle Assess. 2011, 17, 267–269. [Google Scholar] [CrossRef] [Green Version]
  2. DCCC. Hvor Klimavenlige er Elbiler Sammenlignet Med Benzin- og Dieselbiler; Danish Council for Climate Change: Copenhagen, Denmark, 2018. Available online: www.klimaraadet.dk (accessed on 1 July 2019).
  3. Geels, F.W. Understanding the Dynamics of Technological Transitions. Ph.D. Thesis, Twente University, Enschede, The Netherlands, 2002. [Google Scholar]
  4. Rip, A.; Kemp, R. Technological change. In Human Choice and Climate Change; Rayner, S., Malone, E.L., Eds.; Battelle Press: Columbus, OH, USA, 1998; pp. 327–399. [Google Scholar]
  5. Cowan, R.; Hulten, S. Escaping lock-in: The case of the electric vehicle. Technol. Forecast. Soc. Chang. 1996, 53, 61–79. [Google Scholar] [CrossRef]
  6. Klitkou, A.; Bolwig, S.; Hansen, T.; Wessberg, N. The role of lock-in mechanisms in transition processes: The case of energy for road transport. Environ. Innov. Soc. Transit. 2015, 16, 22–37. [Google Scholar] [CrossRef] [Green Version]
  7. Dijk, M.; Wells, P.; Kemp, R. Will the momentum of the electric car last? Testing an hypothesis on disruptive innovation. Technol. Forecast. Soc. Chang. 2016, 105, 77–88. [Google Scholar] [CrossRef] [Green Version]
  8. Sierzchula, W.; Bakker, S.; Maat, K.; Van Wee, B. The influence of financial incentives and other socio-economic factors on electric vehicle adoption. Energy Policy 2014, 68, 183–194. [Google Scholar] [CrossRef]
  9. Wesseling, J.H. Explaining Variance in National Electric Vehicle Policies. Environ. Innov. Soc. Transit. 2016, 21, 28–38. [Google Scholar] [CrossRef]
  10. Flanagan, K.; Uyarra, E.; Laranja, M. Reconceptualising the ‘policy mix’ for innovation. Res. Policy 2011, 40, 702–713. [Google Scholar] [CrossRef]
  11. Veugelers, R. Which policy instruments to induce clean innovating? Res. Policy 2012, 41, 1770–1778. [Google Scholar] [CrossRef]
  12. Rogge, K.S.; Reichardt, K. Policy Mixes for Sustainability Transitions: An extended concept and framework for analysis. Res. Policy 2016, 45, 1620–1635. [Google Scholar] [CrossRef]
  13. Rogge, K.S.; Kern, F.; Howlett, M. Conceptual and empirical advances in analyzing policy mixes for energy transitions. Energy Res. Soc. Sci. 2017, 33, 1–10. [Google Scholar] [CrossRef]
  14. Borrás, S.; Edquist, C. The choice of innovation policy instruments. Technol. Forecast. Soc. Chang. 2013, 80, 1513–1522. [Google Scholar] [CrossRef] [Green Version]
  15. Dijk, M.J.; Backhaus, H.; Wieser, R. Kemp Policies tackling the ‘web of constraints’ on resource efficient practices: The case of mobility. Sustain. Sci. Pract. Policy 2019, 15, 62–81. [Google Scholar]
  16. Howlett, M.; Rayner, J. Design principles for policy mixes: Cohesion and coherence in ‘New Governance Arrangements’. Policy Soc. 2007, 26, 1–18. [Google Scholar] [CrossRef] [Green Version]
  17. Kern, F.; Howlett, M. Implementing transition management as policy reforms: A case study of the Dutch energy sector. Policy Sci. 2009, 42, 391–408. [Google Scholar] [CrossRef]
  18. Nauwelaers, C.; Boekholt, P.; Mostert, B.; Cunningham, P.; Guy, K.; Hofer, R.; Rammer, C. Policy Mixes for R & D in Europe; UNU-MERIT, University of Maastricht and United Nations University: Maastricht, The Netherlands, 2009. [Google Scholar]
  19. Oikonomou, V.; Jepma, C. A framework on interactions of climate and energy policy instruments. Mitig. Adapt. Strateg. Glob. Chang. 2008, 13, 131–156. [Google Scholar] [CrossRef] [Green Version]
  20. Sorrell, S.; Smith, A.; Betz, R.; Walz, R.; Boemare, C.; Quirion, P.; Sijm, J.; Konidari, D.M.P.; Vassos, S.; Haralampopoulos, D.; et al. Interaction in EU Climate Policy: Final Report; SPRU: Brighton, UK, 2003. [Google Scholar]
  21. Painter, M. Central agencies and the coordination principle. Aust. J. Public Adm. 1981, 40, 265–280. [Google Scholar] [CrossRef]
  22. Braun, D. Organising the political coordination of knowledge and innovation policies. Sci. Public Policy 2008, 35, 227–239. [Google Scholar] [CrossRef] [Green Version]
  23. Del Río, P. Interactions between climate and energy policies: The case of Spain. Clim. Policy 2009, 9, 119–138. [Google Scholar]
  24. Gunningham, N.; Grabosky, P.N.; Sinclair, D. Smart Regulation: Designing Environmental Policy; Oxford University Press: Oxford, UK, 1998. [Google Scholar]
  25. Guerzoni, M.; Raiteri, E. Demand-side vs. supply-side technology policies: Hidden treatment and new empirical evidence on the policy mix. Res. Policy 2015, 44, 726–747. [Google Scholar] [CrossRef]
  26. Del Río González, P. The interaction between emissions trading and renewable electricity support schemes: An overview of the literature. Mitig. Adapt. Strateg. Glob. Chang. 2006, 12, 1363–1390. [Google Scholar] [CrossRef]
  27. IEA. Interactions of Policies for Renewable Energy and Climate; IEA: Paris, France, 2011.
  28. Antonioli, D.; Borghesi, S.; D’Amato, A.; Gilli, M.; Mazzanti, M.; Nicolli, F. Analysing the interactions of energy and climate policies in a broad policy ‘optimality’ framework: The Italian case study. J. Integr. Environ. Sci. 2014, 11, 205–224. [Google Scholar] [CrossRef] [Green Version]
  29. Palmer, K.; Paul, A.; Woerman, M.; Steinberg, D. Federal policies for renewable electricity: Impacts and interactions. Energy Policy 2011, 39, 3975–3991. [Google Scholar] [CrossRef]
  30. Kivimaa, P.; Kangas, H.-L.; Lazarevic, D. Client-oriented Evaluation of ‘Creative Destruction’ in Policy Mixes: Finnish Policies on Building Energy Efficiency Transition. Energy Res. Soc. Sci. 2017, 33, 115–127. [Google Scholar] [CrossRef]
  31. Albrecht, J.; Arts, B. Climate Policy Convergence in Europe: An Assessment Based on National Communications to the UNFCCC. J. Eur. Public Policy 2005, 12, 885–902. [Google Scholar] [CrossRef]
  32. Schaffrin, A.; Sewerin, S.; Seubert, S. Toward a comparative measure of climate policy output. Policy Stud. J. 2015, 43, 257–282. [Google Scholar] [CrossRef]
  33. Givoni, M.; Macmillen, J.; Banister, D.; Feitelson, E. From policy measures to policy packages. Transp. Rev. 2013, 33, 1–20. [Google Scholar] [CrossRef]
  34. DCCC. Mål og Virkemidler på Elbilområdet i Udvalgte Lande; Danish Council for Climate Change: Copenhagen, Denmark, 2018. Available online: www.klimaraadet.dk (accessed on 1 July 2019).
  35. Vasseur, V. A Sunny Future for Photovoltaic Systems in The Netherlands? An Analysis of the Role of Government and Users in the Diffusion of an Emerging Technology. Ph.D. Thesis, Maastricht University, Maastricht, The Netherlands, 2014. [Google Scholar]
  36. Christensen, T.B.; Wells, P.; Cipcigan, L. Can innovative business models overcome resistance to electric vehicles? Better Place and battery electric cars in Denmark. Energy Policy 2012, 48, 498–505. [Google Scholar] [CrossRef]
  37. McKinsey. Electric Vehicles in Europe: Gearing Up for a New Phase? Report of Amsterdam Roundtables Foundation and McKinsey & Company; McKinsey: Maastricht, The Netherlands, 2014. [Google Scholar]
  38. Kley, F.; Wietschel, M.; Dallinger, D. Evaluation of European Electric Vehicle Support Schemes. In Paving the Road to Sustainability: Governance and Innovation in Low-Carbon Vehicles; Nilsson, M., Hillman, K., Rickne, A., Magnusson, T., Eds.; Routledge: London, UK, 2012. [Google Scholar]
  39. Excise Duty Tables January 2016. Available online: http://ec.europa.eu/taxation_customs/index_en.htm (accessed on 18 February 2016).
  40. EU Energy Prices. Available online: https://www.energy.eu/fuelprices/ (accessed on 18 February 2016).
  41. Norway Gasoline Prices. Available online: http://www.globalpetrolprices.com/Norway/gasoline_prices/ (accessed on 18 February 2016).
  42. RVO. Elektrisch Rijden in de Versnelling: Plan van Aanpak 2011–2015 [Electric Driving in Acceleration: Work Plan 2011–2015]; Netherlands Enterprise Agency/Rijksdienst voor Ondernemend Nederland (RVO): Utrecht, The Netherlands, 2011. [Google Scholar]
  43. Transnova. Prosjektrapport: Etter 3 år; Transnova: Oslo, Norway, 2012. [Google Scholar]
  44. Danish Energy Agency. Forsøgsordning for Elbiler. 2016. Available online: http://www.ens.dk/klima-co2/transport/elbiler/forsogsordning-elbiler (accessed on 18 February 2016).
  45. Handlingsplan. Handlingsplan for Elektrifisering av Veitransport: Rapport fra Ressursgruppe Nedsatt av Samferdselsdepartementet; Samferdselsdepartementet: Oslo, Norway, 2009; p. 52. [Google Scholar]
  46. Grønn Bil. 2015. Available online: www.gronnbil.no (accessed on 18 November 2015).
  47. Available online: https://www.theguardian.com/environment/2017/dec/25/norway-leads-way-electric-cars-green-taxation-shift (accessed on 1 July 2018).
  48. DCCC. Flere Elbiler på de Danske Veje. Forslag til Pejlemærker og Virkemidler til Elektrificering af Personbilerne; Danish Council for Climate Change, 2018. Available online: www.klimaraadet.dk (accessed on 1 July 2019).
  49. Haugneland, P.; Kvisle, H. Norwegian electric car user experiences. Int. J. Automot. Technol. Manag. 2015, 15, 194–221. [Google Scholar] [CrossRef]
  50. Ekeland, A. The Electric Car Success in Norway: A Dead-End or a Way Forward for Climate Policy? Paper for the Colloque International Recherche & Regulation, Paris. 2015. Available online: https://www.eiseverywhere.com (accessed on 12 June 2015).
  51. Kok, R.; Van der Linden, F.; Smokers, R.; Verbeek, M. Evaluatie Autogerelateerde Belastingen 2008–2013 en Vooruitblik Automarktontwikkelingen tot 2020 [Evaluation of Car-Related Taxes 2008–2013) and Outlook Car Market Trends to 2020]; Report Commissioned by Ministry of Finance; Policy Research Corporation: Rotterdam, The Netherlands, 2014. [Google Scholar]
  52. Rodrik, D. Green industrial policy. Oxf. Rev. Econ. Policy 2014, 30, 469–491. [Google Scholar] [CrossRef]
  53. Van der Beesen, P.; Munnix, S.; Reitsma, S. Verzilvering Verdienpotentieel Elektrisch Vervoer in Nederland [Cashing the Revenue Potential of Electric Transport in The Netherlands]; Netherlands Enterprise Agency/Rijksdienst voor Ondernemend Nederland (RVO): Utrecht, The Netherlands, 2014. [Google Scholar]
  54. PBL. Belastingkortingen Voor Zuinige Auto’s: Afwegingen Voor Fiscaal Beleid [Tax Reduction for Fuel Efficient Cars: Trade-Offs for Fiscal Policy]; Planbureau voor de Leefomgeving: Den Haag, The Netherlands, 2014.
  55. Eurlings, C.; Van den Hoeven, M. Mobiliteitsbeleid [Mobility Policy], Letter to Parliament; Ministry of Traffic & Water and Ministry of Economic Affairs: The Hague, The Netherlands, 2009.
  56. Wiebes, E. Autobrief 2, Letter to Pariament; Ministry of Financial Affairs: The Hague, The Netherlands, 2015.
  57. Bakker, S.; Maat, K.; Van Wee, B. Stakeholders expectations, interests, and strategies regarding the development and implementation of electric vehicles. Transp. Res. A 2014, 66, 52–64. [Google Scholar] [CrossRef]
  58. DMT. Forslag til Lov om Ændring af Registreringsafgiftsloven, Brændstofforbrugsafgiftsloven og Forskellige Andre Love; Danish Ministry of Taxation: Copenhagen, Denmark, 2015.
  59. Borup, M. Electrical Mobility Case Study: Better Place–An Effort of Creating New Actor Roles and Infrastructure for Electric Car Mobility; TOP-NEST Working Paper; DTU: Lyngby, Denmark, 2013; p. 30. [Google Scholar]
  60. DE and Energinet.dk 2015: Smart Energy—Hovedrapport; Danish Energy Association: Copenhagen, Denmark, 2015.
  61. YouGov. Danskernes syn på Elbiler. The Survey was Administered to a Representative Sample of 1002 Respondents. 2014. Available online: www.danskelbilalliance.dk (accessed on 29 January 2014).
  62. Energistyrelsen. Vejledning til Beregning af Støtteberettigede Meromkostninger for Elbiler og Ladeinfrastruktur; Energistyrelsen: København, Denmark, 2013. [Google Scholar]
  63. Government of Norway. Alternative Drivstoff, Elbiler og Nullutslippsteknologi. 2014. Available online: https://www.regjeringen.no/no/tema/transport-og-kommunikasjon/veg_og_vegtrafikk/biler-og-lavutslippsteknologi/id2076451/ (accessed on 15 November 2017).
  64. Vergis, S.; Turrentine, T.S.; Fulton, L.; Fulton, E. Plug-In Electric Vehicles: A Case Study of Seven Markets, ITS Research Report; Institute of Transportation Studies, University of California: Davis, CA, USA, 2014; p. 35. [Google Scholar]
  65. EEO. European Electro-Mobility Observatory. 2015. Available online: http://ev-observatory.eu/norway-logs-50-000-ev-and-continues-incentives-up-to-2017/ (accessed on 15 November 2017).
  66. Michelin Nordic. Survey Results Data Files. The Survey was Conducted in 2014 by PFM Research Sweden on Behalf of Michelin and Included 1000 Respondents; Michelin Nordic Oslo: Oslo, Norway, 2014. [Google Scholar]
  67. Røste, R. Value Chain Analysis of the Norwegian Electric Vehicles Market: Think a First-Mover; TOP-NEST Project: Oslo, Norway, 2013. [Google Scholar]
  68. Jolly, D. Norway’s Electric Embrace. New York Times, 19 October 2015. [Google Scholar]
  69. For Renewable Energy Consumption and Generation Shares. Available online: https://ec.europa.eu/eurostat/data/database (accessed on 13 April 2015).
  70. Hoogma, R.; Kemp, R.; Schot, J.; Truffer, B. Experimenting for Sustainable Transport Experimenting for Sustainable Transport: The Approach of Strategic Niche Management; Routledge: London, UK; New York, NY, USA, 2002. [Google Scholar]
Figure 1. (a) Number of newly registered FBEVs in Denmark, Norway and the Netherlands, 2008–2014. Sources: Statistics Denmark, Statistics Norway, RVO. (b) FBEV market shares. (c) Number of new registered plug-in hybrid electric vehicles (PHEVs).
Energies 13 00475 g001
Figure 2. Relationships in the national policy mixes (precondition in blue, synergy in green, contradictory in red, neutral in grey). The size of the balloons reflects the intensity of the policy, as indicated in Table 6.
Energies 13 00475 g002
Table 1. List of stakeholder interviewees. All experts also joined the round tables within the particular country, unless indicated with an asterisk. Stakeholders we see as ‘policy insiders’ are indicated by ‘ins’.
Norway
  • Norwegian Electric Vehicle Association (Norsk elbilforening)
  • Energy Norway (Energi Norge)
  • Transnova (agency under the Norwegian Ministry of Transport, now part of Enova SF) (ins)
  • Zero—The Zero Emissions Resource Organisation
  • Trondheim Municipality (Trondheim commune) (ins)
  • EV-Power AS
  • Statoil Retail AS
  • Proxll AS
The Netherlands
  • Ministry of Economic Affairs (Ministerie van Economische Zaken) (ins)
  • Netherlands Enterprise Agency (RVO, Rijksdienst voor Ondernemend Nederland) (ins)
  • Ministry of Infrastructure and the Environment (Ministerie van Infrastructuur en Milieu) (ins)
  • Netherlands Infrastructure Agency (Rijkswaterstaat)
  • Ministry of Financial Affairs (Ministerie van Financiën) (*) (ins)
  • PBL Netherlands Environmental Assessment Agency (Planbureau voor de Leefomgeving) (*)
  • TNO (*)
  • ANWB (national car user club and branch organization) (*)
Danmark
  • Danish Energy Agency (Energistyrelsen) (ins)
  • Danish Transport Authority (Trafikstyrelsen) (ins)
  • Copenhagen Electric, Capital Region of Denmark (Region Hovedstaden) (ins)
  • City of Copenhagen (Københavns Kommune) (ins)
  • Roskilde Municipality (Roskilde Kommune) (ins)
  • Danish Electric Vehicle Alliance (Dansk Elbil Alliance)
  • Clever
  • E.on
  • Better Place
  • LeasePlan
  • Danish Energy Association (Dansk Energi)
Table 2. Policies shaping electric mobility in Norway, the Netherlands and Denmark, 1990–2015.
Type or Domain of PolicyCountry1990s2000s2010–2015
FBEV demand—SideNOStrong user benefitsStrong financial tax incentives + user benefits.Strong financial tax incentives + user benefits.
NL Medium to strong financial tax incentives
DK Very strong financial tax incentives
FBEV supply-sideNOMedium support to small domestic FBEV producersMedium support to small domestic FBEV producersMedium support to small domestic FBEV producers
NL Weak: after 2009 mostly organization measures to stimulate domestic infrastructure and the grid sector. Since 2011, business development goals have gained in prominence after the responsibilities of the Ministry of Economic Affairs (EZ) took over responsibilities for the action plan. By 2012 the Formula E-team had identified twelve promising niches and a list of activities to trigger innovation.
DK Weak: tax reduction for utilities after 2012. Efforts to standardize charging technology and data-exchange systems
FBEV infrastructureNODemonstration projects Demonstration projectsPublic funds for wider (recharging) infrastructure development
NL Formula E-team encouraging and coordinating organizations to implement infrastructure. Some co-funding available for businesses (‘green deals’) or residents (national air quality fund).
DK Funds that cover part of the cost of recharging infrastructure. Regular dialogue between energy authorities, road authorities and municipalities on establishment and coordination (e.g., data exchange and standardization) of the further development of charging infrastructure.
ICE car demand-side NO(Tax scheme unrelated to CO2)Norway has a relatively high car purchase tax based on vehicle weight, engine capacity and NOx emissions. Since 2007, the purchase tax has also been connected to CO2 emissions. To stimulate the introduction of cleaner ICE cars, the CO2 component in the car purchase tax is regularly adjusted.
NL(Tax scheme unrelated to CO2)Car purchase (registration) tax was connected to an energy label in 2006 and to the CO2 emissions level after 2010. A ‘feebate’ system gave low-emission ICE vehicles a tax discount (or even exemption), while high-emission vehicles were taxed extra, so ICEs were taxed progressively according to their CO2 emissions. In the policy arena one informant spoke of the ‘greening of the tax regime’.
DK(Tax scheme unrelated to CO2)Denmark has the highest vehicle purchase tax in Europe. The tax is 105% on the first €8000 of the import price, and 180% of the price above €8000. The tax is calculated after adding VAT (25%), resulting in double taxation
Renewable energy policyNONorway nurtures a vast hydropower-based electricity system and, together with Sweden, established a common market for certificates for renewable electricity production.
NLRelative unambitious targets for renewable energy (in 2013 the target was 14% by 2020). Renewables were stimulated through an unstable subsidy regime that changed from year to year [35] and offered very little certainty for investors. In some years, the subsidies were very low or temporarily non-existent.
DKDenmark aims to charge 200,000 electric vehicles at night (i.e., at a time of relative low electricity demand) by 2020 within the current capacity of the Danish energy system [36]. This ‘smart charging’ approach raises overall efficiency of the energy system, improves the economy of wind energy, and reduces pressure on local electric grids (Ibid). The share of renewable sources in electricity generation was about 43% in 2013. The goal is to have 70% of generated electricity from renewables by 2020 (50% wind power, 20% biomass). The long-term policy to become fossil-free by 2035 (excluding transport) and 2050 (including transport) is perceived as robust by industry actors, having been agreed by a broad coalition of political parties. It is also supported by major industrial actors who see it as a key leverage for ‘green’ business strategies.
Table 3. Overview of full battery-electric vehicles (FBEV) demand-side policies in Norway, the Netherlands and Denmark 2010–2015 (source: adapted from [38]).
NorwayNetherlandsDenmark
Tax reduction on vehicle sales priceYesYesYes
Reduction of annual road or vehicle taxYesYesYes
Tax reduction after purchase (company cars)NoYesNo
Purchase subsidiesNoNoNo
Scrappage schemeNoNoNo
Fossil transport fuel taxesYesYesYes
Reduced or exemption from toll charges and parking fees, access to bus lanes, free ferries, free charging at public charging pointsYesNoNo
Table 4. Fossil transport fuel taxes (unleaded petrol, January 2016).
Excise Duty (euro/litre) 1VAT (%) 1Retail Price 2
Norway 0.604251.470
Netherlands0.770211.415
Denmark0.611251.379
EU 28 Average0.546-1.132
Sources: 1 [39]; 2 [40]. For Norway [41].
Table 5. Overview of charging station densities and FBEV market shares as of 2012 (Source: [8]).
NorwayThe NetherlandsDenmark
Charging stations per 100,000 residents25215
FBEV market share (%)3.21.00.2
Table 6. Policy areas and their intensity.
Type or Domain of PolicyNorwayDenmarkNetherlands
FEV demand-sideStrong financial tax incentives + user benefitsVery strong financial tax incentivesMedium-strong financial tax incentives
FEV supply-sideMedium –support to small domestic FEV producer since 1990sWeak– after 2012 support for smart charging infra. Tax reduction for charging/ electricity suppliers Weak – after 2009 mostly organization measures to stimulate domestic infrastructure & grid sector
FEV infrastructureStrong: large budgets for infra developmentMedium: some innovation funds for infrastructure development Weak: no targets, no budgets, but coordination
ICE -demandWeak – high taxes for all (also clean) ICEMedium level incentives for clean ICE Very strong feebate system with tax exemption for clean ICE
Renewable energyVery strongStrongWeak

