Article

Turbocompound Power Unit Modelling for a Supercapacitor-Based Series Hybrid Vehicle Application

by
Matteo Repetto
1,
Massimiliano Passalacqua
2,
Luis Vaccaro
2,
Mario Marchesoni
2,* and
Alessandro Pini Prato
1
1
Department of Mechanical, Energy, Management and Transportation Engineering (DIME), University of Genova, via all’Opera Pia 15, 16145 Genova, Italy
2
Department of Electrical, Electronic, Tlc Engineering and Naval Architecture (DITEN), University of Genoa, via all’Opera Pia 11a, 16145 Genova, Italy
*
Author to whom correspondence should be addressed.
Energies 2020, 13(2), 447; https://doi.org/10.3390/en13020447
Submission received: 11 December 2019 / Revised: 10 January 2020 / Accepted: 13 January 2020 / Published: 16 January 2020

Abstract

:
In this paper, starting from the measurements available for a 2000 cm3 turbocharged diesel engine, an analytical model of the turbocharger is proposed and validated. The model is then used to extrapolate the efficiency of a power unit with a diesel engine combined with a turbocompound system. The obtained efficiency map is used to evaluate the fuel economy of a supercapacitor-based series hybrid vehicle equipped with the turbocompound power unit. The turbocompound model, in accordance with the studies available in the technical literature, shows that the advantages (in terms of efficiency increase) are significant at high loads. For this reason, turbocompound introduction allows a significant efficiency improvement in a series hybrid vehicle, where the engine always works at high-load. The fuel economy of the proposed vehicle is compared with other hybrid and conventional vehicle configurations.

Graphical Abstract

1. Introduction

The increasing interest in sustainable mobility has led to the study and development of new hybrid architectures, which can be mainly divided in three main categories [1]: parallel [2,3,4,5,6], series/parallel (also known as power-split) [6,7,8,9,10,11,12,13,14], and series hybrid [15,16,17,18,19,20,21]. Passalacqua et al. [22] proposed a new series architecture configuration for medium size cars, with a storage system based only on supercapacitors and they highlighted the benefits in terms of internal combustion engine (ICE) optimal working points. This topology may further benefits from innovation in engine design, such as the introduction of turbocompound (TC) systems. As observed by Jain et al. [23], turbocompound conditions are quite occasional in real road missions, thus, they do not render beneficial the introduction of the TC system; as a matter of fact, turbocompounding benefits are substantial at high load [23,24,25,26,27,28]. This aspect explains why today this technology is not used on medium size cars and is developed only for sportive cars or trucks and buses, characterized by frequent high load demand. For this reason, many studies [26,27,28,29,30] focused on turbocompound application to diesel engines above 12 L. In particular, Katsanos et al. [27] show a fuel consumption reduction of 4% in a 330-kW diesel engine at full load and 4% fuel consumption reduction was also found by Kant et al. [28]. Zhao et al. [29] found a brake-specific fuel consumption (BSFC) reduction from 3.1% to 7.8%, whereas Teo Sheng Jye et al. [26] found a 2% average BSFC reduction for a 13,000 cm3 diesel engine. In [30], an analytical model is developed to show BSFC of a turbocompound diesel engine with different power turbine expansion ratio.
Various studies also concern turbocompounds on spark-ignition engines. In [25] a theoretical analysis of turbocharging benefits on a 2000 cm3 spark-ignition engine is shown whereas in [24] turbocharging benefits on a 1000 cm3 spark-ignition engine are supported by experimental results.
In this paper, starting from measured quantities on a four cylinder 2000 cm3 direct ignition turbocharged (variable geometry turbine—VGT) diesel engine, ICE efficiency and turbocharger efficiency are calculated. Indeed, ICE and turbocharger efficiency cannot be measured directly but calculated from experimental measures. An analytical analysis is then carried out in order to quantify efficiency improvements in various working conditions (i.e., mean effective pressure and engine speed) with turbocompound introduction. Once the efficiency improvement is determined, BSFC (or equally engine efficiency) map is available both for turbocharged and turbocompound engines. After turbocompound modelling, its impact on the hybrid series architecture proposed in [22] is analyzed. Indeed, despite in traditional vehicles and parallel hybrid vehicles the engine works frequently at low load, in the abovementioned architecture the engine works constantly near full load, thus turbocompound can lead to significant advantages.
In contrast, the main novel contribution of this paper can be pinpointed as follow: (1) efficiency map for a 2000 cm3 turbocompound diesel engine is evaluated starting from measured values on a traditional turbocharged diesel engine; (2) turbocompound contribution to a hybrid series architecture medium size car based on supercapacitor storage is analyzed.
In Section 2 turbocompound modelling is carried out and efficiency maps, both for turbocharged and turbocompound diesel engines are reported; in Section 3 turbocompound influence on series hybrid architecture is discussed. Conclusions are finally pointed out in Section 4.

2. Turbocompound Efficiency Evaluation

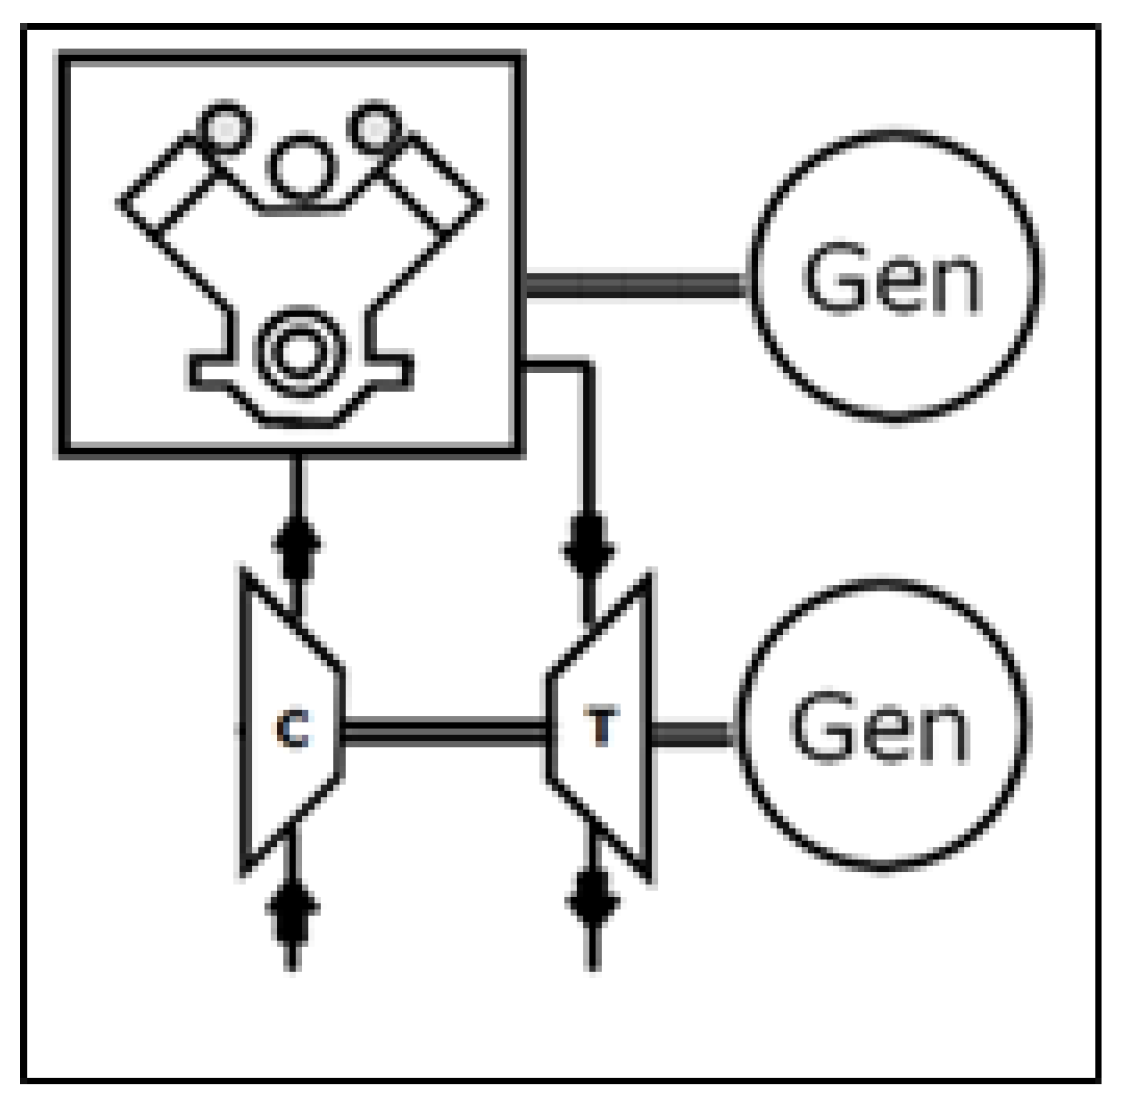
2.1. Turbocompound Overview

Turbocompound technology consists of a power unit where the ICE is combined with a turbine which recovers exhaust gas enthalpy. Differently from traditional turbochargers, where the energy produced by the turbine is used only to move the compressor (C), in the turbocompound system part of the power produced by the turbine is delivered and used outside the turbocharger. One of the solutions to exploit this available energy, which is considered in this study, is to connect an electric generator (Gen) to the turbine (T), as shown in Figure 1.
The interaction between the ICE and the turbine is quite complex since the power provided by the turbine is generated with a reduction in ICE generation; therefore, the optimization of the power unit cannot consider the optimization of the two subsystems separately, but has to be a combined optimization of all of the power unit. Moreover, since in road traction application the ICE rarely works in steady state condition, all load and speed working conditions have to be taken into account in the power unit optimization.
The first step in power unit optimization starts from evaluating the behavior of turbochargers usually used on current vehicles. Traditional turbochargers work by self-sustaining, i.e., the power provided by the turbine is used to move the compressor and to overcome friction; therefore, the turbocharger do not provide power outside.
Various works focus on thermal and mechanical losses of turbochargers [31,32].
Other works focus on turbine coupling with the ICE which has an outflow characterized by cyclic variation in amplitude [31,33]. These studies show that the energy provided to the turbine is higher than the amount of energy evaluated taking into account the average pressure values before and after the turbine. The ratio between the energy provided to the turbine and the estimated energy using pressure average values is known in the technical literature as “pulsating factor” [34,35].
In order to evaluate turbine design criteria and turbocharger control logic while power is provided to the electric generator, it is necessary to divide as much as possible the various phenomena:
  • Thermal losses;
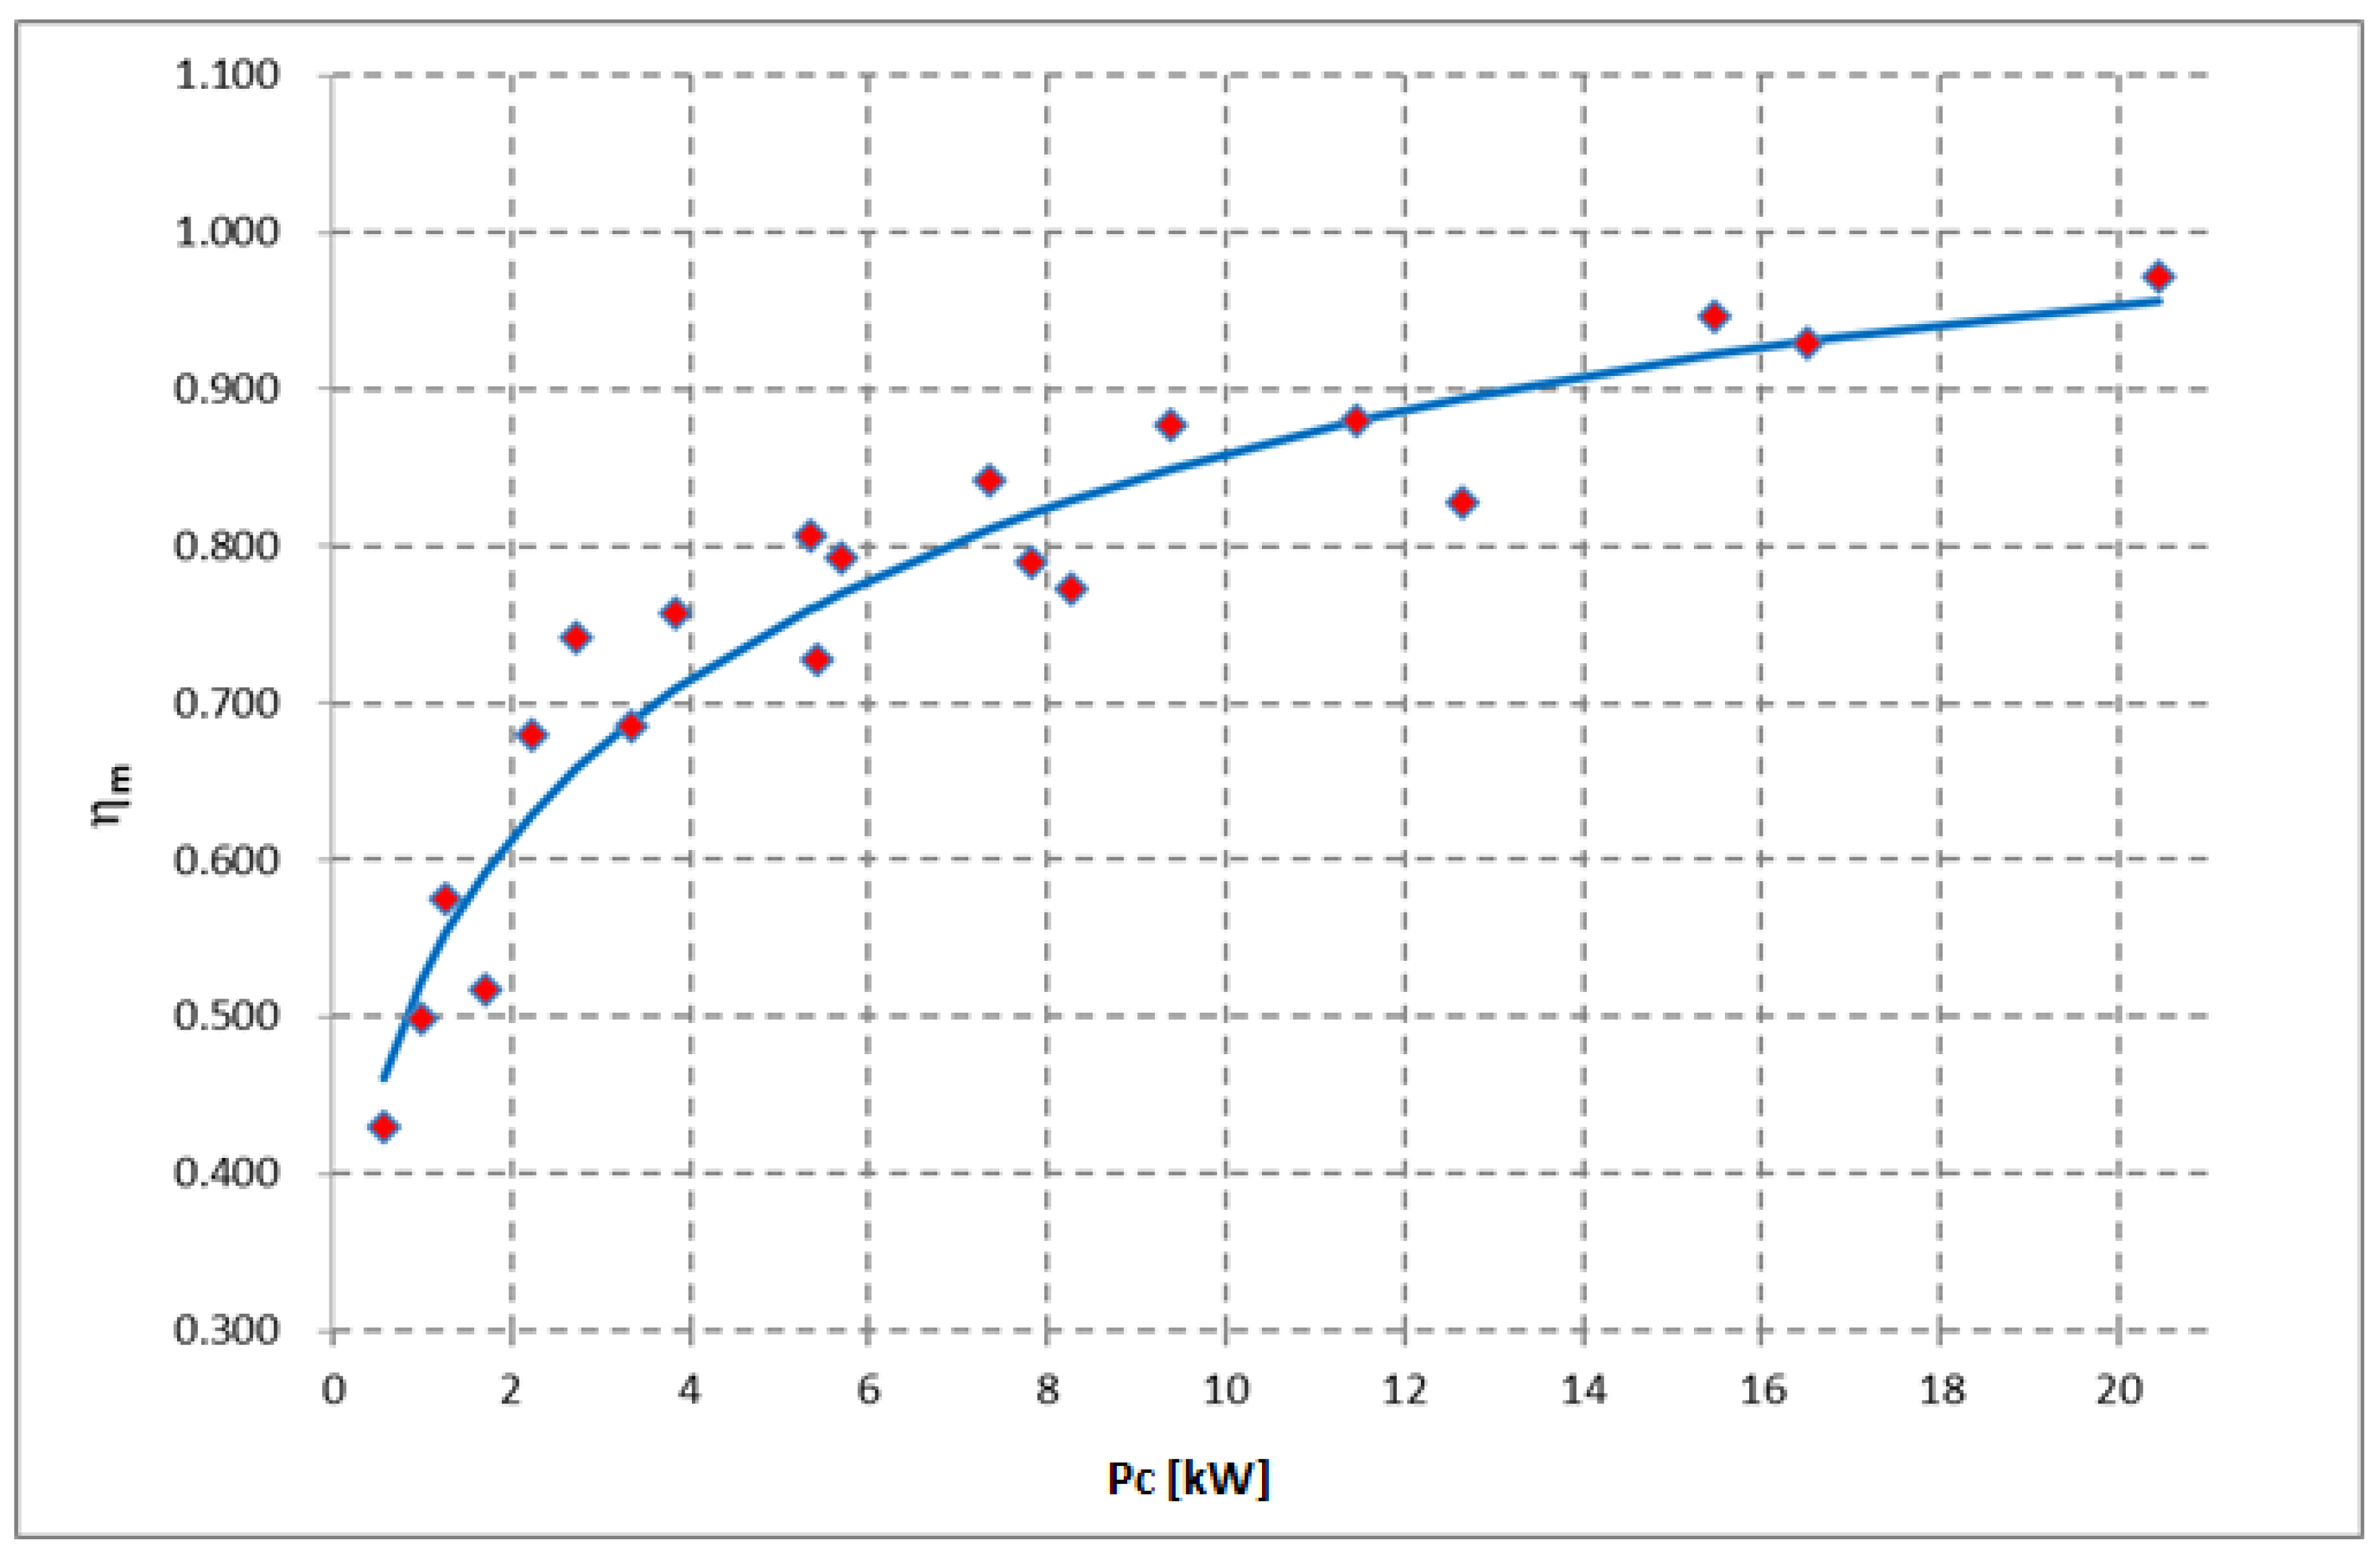
  • Mechanical efficiency;
  • Effects of outflow cyclic variation (pulsating factor).
In this study, an analytical model of the turbocharger will be shown. After its validation (i.e., the comparison between the model output and the experimental measurements) the analytical model will be used to predict turbocompound behavior (i.e., the power unit efficiency).

2.2. Analytical Model of a Turbocharger via Experimental Measurements

In order to estimate efficiency improvement with a turbocompound system combined with a diesel engine, measurements on a four cylinders, turbocharged (variable geometry turbine—VGT), common rail, Euro 5, 2000 cm3 engine were performed for various operating points (i.e., engine speed and mean effective pressure) [36]. It should be clarified that in the following approach, behavior during transient was neglected; as a matter of fact, even if this aspect is evaluated in various studies [37,38] transient behavior is negligible in series hybrid application, where ICE dynamics are smoothed by the storage system [22]. Moreover, operating conditions and turbocharger control have a great influence on turbine efficiency; however, since experimental measures regard fluid dynamics quantities and the efficiency was calculated starting from these parameters, the control effect is implicitly considered in the process. Analogously, turbine housing plays a fundamental role in turbine efficiency, however, also this aspect is implicitly considered in the process.
The following quantities were measured:
  • Air and fuel mass flow rate ( m ˙ A , m ˙ F );
  • Temperature before and after compressor and turbine (T1, T2, T7, and T8);
  • Pressure before and after compressor and turbine (p1, p2, p7, and p8);
  • Torque to ICE shaft;
  • Speed of ICE (rpm).
From these quantities it is possible to easily calculate:
  • ICE power;
  • Mean effective pressure (pme).
The quantities were measured for 20 different working points (i.e., different ICE speeds and mean effective pressures), which are reported in Table 1. For each working point, ICE power is reported; since the maximum load (i.e., the maximum pme) depends on ICE speed, maximum load is reported in the last line of the table.
The measurements were performed on a traditional ICE, where the turbocharger is self-sustaining, since no power is delivered outside.
The thermodynamic first law is shown in Equation (1), where the heat provided to the system and the work provided by the system are considered positive. The work performed by the compressor can be therefore evaluated from Equation (2), where the transformation was considered as adiabatic, since there is a negligible thermal exchange. dh is the enthalpy infinitesimal variation, dW is the infinitesimal workm and dQe is the infinitesimal exchange heat per mass unit.
d h + d W d Q e = 0 ,
d h c + d W c = 0 .
Being the enthalpy gap defined as in Equation (3), the power delivered to the compressor (Pc) can be evaluated as in Equation (4). CpA is the air constant pressure specific heat capacity, T2 is the compressor output temperature, T1 is the ambient temperature and m ˙ A is the air flow.
Δ h c = C p A ( T 2 T 1 ) ,
P c = m ˙ A | Δ W c | = m ˙ A C p A ( T 2 T 1 ) .
To evaluate turbine work, the assumption of adiabatic transformation is not valid since there is a high difference between outflow temperature and ambient temperature. The enthalpy gas can therefore be evaluated, taking into account the external work and the thermal losses, as in Equation (5), with the same sign convention as Equation (1).
d W T + d h T d Q T = 0 .
One can assume that the thermal losses are related to the temperature jump between the flow upstream of the turbine (i.e., the flow in the pipe between the ICE and the turbine) and the ambient temperature, since the turbine thermal resistance is almost constant in the various working conditions. As a matter of fact, turbine thermal resistance is related to thermal conduction through the component case, conveniently insulated, and through the turbocharger shaft. Therefore the power delivered by the turbine (PT) can be evaluated as in Equation (6).
P T = m ˙ t | Δ W T | = m ˙ t C p ( T 7 T 8 ) q t ,
where C p = C p ( T 7 , T 8 ) and q t = q t ( T 7 , T a ) , q t being the exchanged heat per time unit ( q t = m ˙ t d Q t ). Please note that the turbine does not have a dedicated cooling system; the terms q t includes also the heat subtracted by the lubricating oil.
Since the turbocharger is self-sustaining, the turbine work has to equal the compressor work plus the mechanical losses; introducing the mechanical efficiency η m , the relation between turbine power and compressor power is given by Equation (7).
P T = P c η m ,
where η m = η m ( P C ) . n m and q T are not directly measured and therefore must be evaluated through appropriate relations with the measured quantities. Equations (6) and (7) have three unknown quantities ( P t ,   q t , η m ) , therefore a third relation is necessary.
Since q t = q t ( T 7 , T a ) , a linear relation q t = α   T 7 + φ was supposed, indeed the thermal resistance is almost constant in the various working conditions. The value of η m should be in accordance with the values shown in detailed studies in the technical literature, which show a mechanical efficiency around 95%–97% at maximum load and around 40%–50% for very low power [37]. Therefore, the system of Equation (8) was solved.
{ P T = m ˙ t | Δ W T | = m ˙ t C p ( T 7 T 8 ) q t P T = P c η m q t = α   T 7 + φ η m ( 1   kW ) = 0.5 η m ( 20.5   kW ) = 0.97 .
The relation for the exchanged heat, evaluated from Equation (8) is reported in Equation (9) and plotted with the red line in Figure 2.
q T = 1.7 · 10 3 · T 7 0.521 .
The corresponding η m values obtained combining Equations (6), (7) and (9) are reported with red rhombi in Figure 3. One can note that the η m values obtained with the proposed process are in accordance with the values shown in [37]. For these points the fitting curve shown in Equation (10) can be used.
η m = 0.525 · P c 0.229 1.46 · 10 3 · P c .
Evaluating the exchanged heat q t with the fitting of Equation (10) and using Equation (6) and (7), one obtained the blue rhombi in Figure 2. Observing the good correspondence between Equation (9) (red line in Figure 2) and the blue rhombi (obtained with the fitting in Equation (10)), one can verify that the proposed fittings represent the turbocharger well.
The turbine power PT obtained from Equation (7), can be compared with the isentropic enthalpy gap related to the expansion rate in the turbine. In this way, one obtains an “apparent” efficiency value ( η ˜ T ), defined in Equation (11), significantly higher than the efficiency value experimentally measured for these types of turbines with stationary flow.
η ˜ T = P T m ˙ t · d h T .
The difference is related to the cyclic operation of the ICE, which produces a pulsating outflow.
The relation between the above “apparent” turbine efficiency η ˜ t and the turbine efficiency which can be measured in stationary flow η ¯ is therefore given by Equation (12), where ε is the pulsating factor [34,35,36,37,38,39]:
η ˜ t = η ¯ t · ε .
This phenomenon is related to the ratio between flow average speed in the turbine, which is related to the flow rate, and the amplitude of speed pulsation. Indeed, the energy provided to the turbine is related to the kinetic energy of the flow, which depends on speed quadratic value and is filtered by the turbine inertia. The mean kinetic energy is therefore the mean of quadratic speed, which is higher than the quadratic of the main speed (i.e., the speed measured during the experimental test), as summarized in Equation (13), where tcycle is the period of a thermodynamic cycle:
1 t c y c l e 0 t c y c l e c 2 d t > 1 t c y c l e ( 0 t c y c l e c d t ) 2 .
The pulsating factor (ε) is therefore related to the ratio between the pulsation amplitude (A) and the main speed (c) and can be evaluated as in Equation (14):
ε = 1 + τ · ( A / c ) 2 ,
where:
A = c max c min ,
and τ is a coefficient which depends on the flux waveform (e.g., for a square wave it is 0.25).
In the pipe between the ICE and the turbine, taking away the work produced by the piston during the exhaust stroke and the irreversibility in the valve, the kinetic energy variation is obviously related to the pressure difference between the cylinder pressure (just before the exhaust valve opens) and the mean pressure in the exhaust pipe.
Indeed from energy conservation law in Equation (16), neglecting d W and d W a , and integrating the Equation, one obtains Equation (17). dp is the pressure gap, v is the flow specific volume, dW is the infinitesimal work, and dWa are the friction losses.
c · d c + v · d p + d W + d W a = 0 ,
c max 2 c min 2 = 2 v · Δ p .
Therefore, the pulsating factor can be expressed as in Equation (18).
ε = 1 + ζ Δ p c 2 ,
where:
ζ = 2 v · τ .
From Equations (18) and (20) one obtains Equation (21), where ρ = ρ ( T 7 ) .
m ˙ = Ω ρ c ,
ε = 1 + ζ ( p 6 p 7 ) m ˙ t 2 Ω 2 ρ 2 .
From Equation (21) is it possible to obtain the ε value for each working point, which is reported in Table 2.
Analyzing Equation (21), one can observe that ε depends on ρ (therefore on T7), on p6-p7 and on m ˙ t , therefore the fitting proposed in Equation (22) can be considered.
ε = 1 + 0.5 · 10 3 0.75 · 10 6 · ( T 7 647 ) m ˙ t 2 · ( p 6 p 7 ) · 10 5 .
In order to verify if the proposed analytical expressions properly model the turbocharger behavior, the efficiency in stationary flow ( η ¯ t ) obtained with Equations (9), (10) and (22), starting from the available measurements, was compared with the value of η ¯ t available in the technical literature (which normally identify the combined effect of isentropic efficiency η ˜ T and mechanical efficiency in stationary flow η m ). The combined efficiency obtained with Equations (10), (12) and (22) is shown in Table 3 for the 20 analyzed points.
The combined efficiency η ¯ T · η m in Table 3 can be plotted as a function of the expansion ratio β, obtaining the green rhombi in Figure 4. The rhombi can be compared with the results curve deriving from the fitting of experimental results obtained in [38], showing a good correspondence between them and therefore the model can be considered valid.

2.3. Turbocompound Modelling: An Extrapolation of Turbocharger Analytical Model

In order to extract power from the turbocharger, the power required from the compressor being the same as in self-sustaining, the expansion ratio of the radial mono-stage turbine should be increased; moreover, the turbine diameter should be increased and the cross-section reduced compared to the one in self-sustaining.
For each of the 20 working points for which experimental measurements were available, increasing values of p7 were assigned. These values were given between the pressure related to the self-sustaining of the turbocharger and the pressure in the cylinder exactly before exhaust valve opening, which are the minimum and the maximum theoretical values that the pressure can reach. The increase of pressure upstream the turbine involves, for the same flow rate, an increase in turbine work, thanks to the increase of expansion ratio. The new value of the turbine work per cycle will be evaluated considering also an enthalpy increment caused by the piston, which has to oppose a higher pressure during the exhaust stroke.
For this reason, the power delivered to the ICE shaft will decrease of Δ P p , with a power shift from the ICE to the turbocompound.
As aforementioned, also the pulsation amplitude of the flow will reduce, due to the reduction of the ratio between the pressure inside the cylinder immediately before exhaust valve opening and the mean pressure in the pipe upstream the turbine, causing a reduction in the pulsating factor. Therefore, the power generated by the turbine is given by Equation (24):
P T = m ˙ t C p T 7 ( 1 β T λ ) ε η ¯ t ,
where:
β T = p 7 p 8 .
For each of the 20 working points, PT will be evaluated for each increasing value of p7. For each increased value of p7, the value of T7, ηm, and ε will be recalculated with Equations (7), (9)–(11), (23) and (24), whereas η T ¯ is considered constant for each of the 20 working points ( η T ¯ varies for each of the 20 points but is constant for increasing values of p7). Indeed, it is hypothesized that a correct design allows the modified turbine to have the same η T ¯ of the original component.
The power delivered externally from the turbocompound (i.e., the power to the electric generator shaft) is given by Equation (25):
P T C = ( P T P C ) · η m .
As a consequence, the total power of the power unit is given by Equation (26), where Δ P p is the incremental pumping loss (i.e., the difference between the pumping loss with the turbocharger in self-sustaining and the pumping loss with the turbocompound). This loss was evaluated taking into account the pression increase in turbocompound configuration, considering the engine displacement and the engine speed.
P P U = P T C + P I C E Δ P P .
The new efficiency of the power unit, for the same fuel power (fuel flow rate), for each working point will be given by Equation (27):
η P U = P P U F .
Finally, the efficiency increase thanks to the introduction of turbocompound is given by Equation (28):
ψ = η P U η I C E .
As an example, power unit efficiency η P U is shown in Figure 5 for 2500 rpm and 17 × 105 Pa of pme, for the same fuel flow rate and as a function of pressure p7.

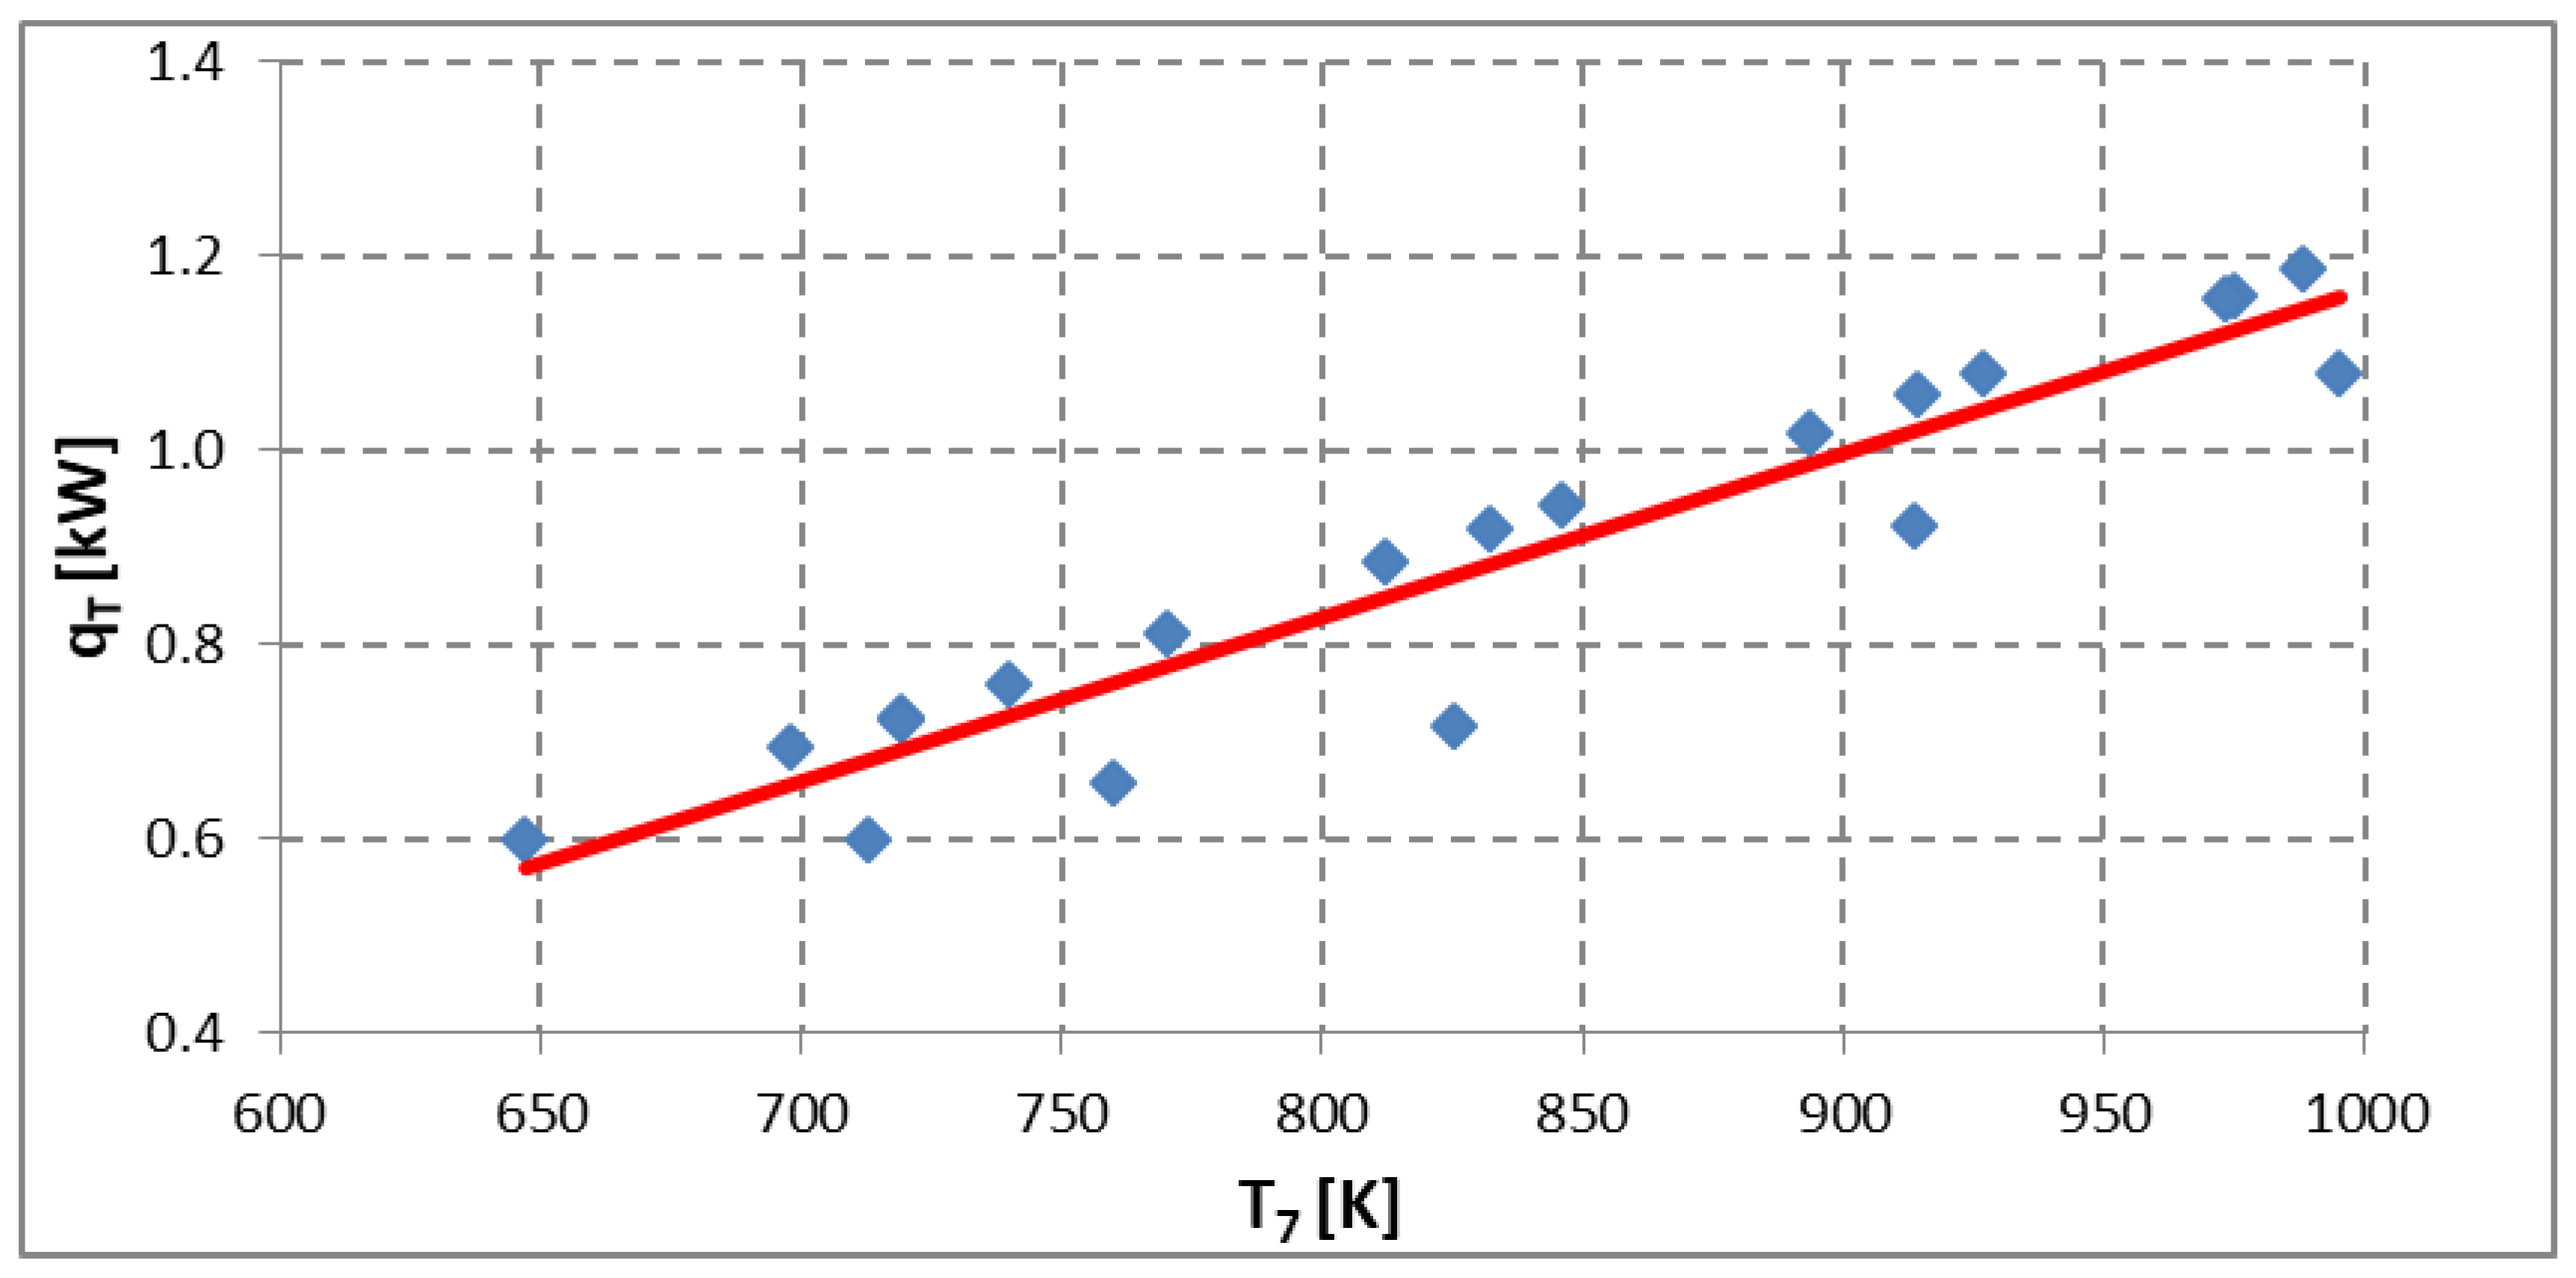
2.4. Turbine Limits and Turbocompound Efficiency

The analytic analysis performed in the previous section showed that by increasing turbine counter-pressure, the power unit efficiency increases, thanks to the higher power recovered on the exhaust gas. However, conceptual and constructive constraints limit the maximum counter-pressure that can be imposed for each working point. These constraints have to be respected in the machine sizing and defining the behavior of the variable-geometry control system. The following main limit criteria were taken into account:
The main pressure in the pipe between the ICE and the turbine should be lower than the pressure in the cylinder at the exhaust valve opening.
The expansion ratio β should be compatible with the limits of single-stage radial turbines.
The pipe section reduction, for the same ICE speed and main effective pressure, should not exceed 50% in comparison to the pipe section of a traditional ICE with the turbocharger in self-sustaining.
In Section 2.3 the good correspondence between the analytical results and the experimental results of [38] was shown and therefore the model was validated. For this reason, the proposed model was used to extrapolate the results also for higher values of the expansion ratio β. These higher values are obtained when the turbocharger is no longer in self-sustaining but is producing work (turbocompound application).
In Figure 6 the combined efficiency η ¯ T · η m obtained with the extrapolation process of the proposed model (red dots) are compared with the values available in [38] (green line), whereas the blue rhombi and the red line are the same as in Figure 4. Additionally, in the extrapolation area, the values obtained with the analytical approach show a good correspondence with the experimental results and therefore also in the extrapolation area the model is validated.
With the abovementioned procedure and using Equations (24) and (27), power unit efficiency improvements and ICE power reduction (in comparison to a traditional solution with a self-sustaining turbocharger) were evaluated as a function of fuel rate per thermodynamic cycle. In Figure 7 the efficiency increase of the power unit is shown, as a function of the fuel flow rate per cycle. As it can be noticed from the green line, the influence of the ICE speed is negligible, and the efficiency increase is more related to the fuel flow rate.
While working in power unit configuration (ICE + TC) a part of the power originally produced by the ICE is produced by the turbocompound. The shift of power from the ICE to the TC is shown in Figure 7 as a function of the fuel flow rate; again, the red line shows that the influence of ICE speed on this parameter is negligible.
From Figure 8 it is easy to notice that for the same fuel flow rate and same operating condition (i.e., ICE speed) there is a shift of power from the ICE to the turbine. This justifies the necessity of considering the two subsystems together to evaluate power unit performance.
The ICE contour map, which is easily calculated from measured fuel flow and power delivered to the ICE shaft, is reported in Figure 9a. The map regards the efficiency of the original ICE, without the turbocompound. The results in Figure 8 and Figure 9a allow the efficiency contour maps for the turbocompound power unit to be obtained, which is reported in Figure 9b. The contour maps are obtained interpolating the efficiency of the 20 points analyzed in the study. These contour maps were used to perform vehicle fuel consumption simulations, as shown in the following sections.

3. Turbocompound Application on Series Hybrid Vehicles

In the previous sections, starting from the measurements available for a turbocharged ICE, an analytical model of the turbocharger was carried out. The model was used to extrapolate the results for a turbocompound power unit, and the efficiency contour was map evaluated. These results are used in this section to evaluate the fuel economy of a series hybrid vehicle based on supercapacitor storage and equipped with a turbocompound diesel power unit. In Section 3.1 the road mission profiles used for simulations are described. An overview on series hybrid vehicles is shown in Section 3.2, whereas the vehicle modelling is reported in Section 3.3. Finally, the simulation results are shown in Section 3.4.

3.1. Simulated Road Missions

The different powertrain configurations were tested over six different road missions. At first, three American standard drive cycles were considered: Highway Fuel Economy Test (HWFET), Urban Dynamometer Driving Schedule (UDDS), and the Supplemental Federal Test Procedures (SFTP or US06) [39]. The advantage of using standard driving cycles is that they allow an easier comparison with other studies. However, since downhill are critical for the storage system (in this case supercapacitors), because a large quantity of potential energy should be stored, three additional real missions were simulated, whose data were experimentally acquired in the area of Genoa (Italy) [10,18,40]. In particular, the extra-urban mission is characterized by a long downhill road. The mission main features are reported in Table 4.

3.2. Overview on Series Hybrid Vehicles

Using batteries as storage systems, the efficiency being low, ICE provided power has to be instantaneously close to the demanded power, in order to minimize the stored energy. Moreover, not only the stored energy has to be minimized from an efficiency point of view, but battery life in terms of number of cycles is quite low. Indeed, on medium sized car, parallel (or analogously series/parallel) architecture is primarily developed. Passalacqua et al. [22] proposed a series hybrid architecture for medium size cars based on supercapacitor as a stand-alone storage system. The efficiency of supercapacitors being high, the ICE can always work at high load, even if the average demanded power is low (e.g., in urban missions) since the exceeding power can be stored at high efficiency. Moreover, also power electronics efficiency has a significant effect on series architecture; as a matter of fact, supercapacitor storage is connected to the DC-link with a DC-DC converter, and all the power provided by the ICE is subjected to a double conversion (i.e., from mechanical to electrical and from electrical to mechanical), where an inverter is involved in both conversions. As a result, not only storage efficiency has a great influence on series architecture, but also power electronics play a fundamental role.
In Figure 10, average powertrain efficiency (obtained in [10,22] considering a spark ignition engine) over the simulated road missions is plotted as a function of storage and converter efficiency. Please note that the average storage and converter efficiency is the product of storage, generator inverter, motor inverter, and DC-DC converter average efficiency, whereas powertrain efficiency is defined as in Equation (29).
η powertrain = Energy   to   overcome   friction Primary   energy   ( fuel ) .
From Figure 10 it can be noticed that low storage efficiency parallel and series/parallel architecture are more efficient than series architecture, this fact explains why today those structures are the most widespread; however, with high storage and converter efficiency, series architecture becomes competitive [22,41]. The break-even point is around 86%, which is a high value to be reached with batteries (as a matter of fact, the combined efficiency of storage and converters being 86%, battery efficiency should be higher than 92%–94%). Moreover, battery life is a critical issue, therefore from an economic point of view, break-even point could be at higher values. Nevertheless, high efficiency values can be achieved using supercapacitor storages and series architecture benefits can be further increase using Silicon Carbide components [18,22,41].
Although series architecture introduces additional losses, powertrain efficiency increases since ICE can work in optimal working conditions, as it can be noticed from Figure 11 [10,22] (again the results are shown on a spark-ignition engine) As a matter of fact, ICE working points are at high-load and in the maximum efficiency area in the last configuration. Please note that in the first two figure ICE maximum power is about 72 kW, whereas in the last figure ICE maximum power is about 40 kW. Indeed, as it will be shown after, ICE downsizing is possible in series architecture.
In addition, as observed in [22], the series architecture allows a relatively easy introduction of a diesel engine exploiting its strengths and softening its weaknesses. As a matter of fact, spark ignition engines are today widely employed in the automotive hybrid industry; the reason for this trend is given by their lower local pollutant emission and a higher flexibility in terms of on/off frequency. Nonetheless, firstly, the series architecture can reduce the number of ICE on/offs [22,40], secondly, by slowing down ICE transients, and by working in a limited working area, the local emissions are reduced. To sum up, not only using supercapacitor storage, series architecture becomes more competitive than parallel, but this gap can be even increased with the use of diesel engines.
In this scenario, not only fuel economy can increase using traditional ICEs, but series architecture can further benefit from turbocompound introduction, the benefits of which, in terms of efficiency, are relevant at high load, as observed by the modelling at Section 2 and by many works in the scientific literature [23,24,25,26,27,28,42].

3.3. Vehicle Modelling

In order to quantify the benefits of turbocompound introduction in a series hybrid vehicle, a MATLAB/Simulink model was created according to what was presented in [22]. The model is a quasi-stationary model and components were modelled as efficiency look-up tables. As a matter of fact, the aim of the study is to evaluate powertrain efficiency and fuel economy with different configurations, therefore vehicle dynamic was implemented, as well as components efficiency and energy management system (EMS). The efficiency contour map obtained with the process of Section 2 was used in the model, as well as efficiency map for a diesel engine without turbocompound (Figure 9a). In order to compare the powertrain efficiency with different engine configuration, spark-ignition engine efficiency map [43] was also used, which is reported in Figure 11, where also the operating points are shown. Regarding series architecture, a great downsizing of the ICE is possible, as shown in [18,22], and in this study a 40 kW ICE was considered. The efficiency contour maps shown in Figure 9 are considered valid also for a 40 kW ICE, where the speed is kept constant and the torque is conveniently scaled. The efficiency contour maps for a 40-kW diesel engine and 40-kW diesel + TC power unit are shown in Figure 12a,b, respectively, together with series architecture working points. As can be noticed from Figure 12, for each required power, the ICE always works in the maximum efficiency point for that specific power.
Initial and final storage state of charge (SOC) are generally different. However, to compare the fuel consumption of the different architectures, the initial SOC should be the same of final SOC, in this way electric consumption is zero. To avoid this problem every mission was repeated several times; indeed, the longer the road mission is, the lower is the SOC variation influence on fuel consumption. Two different simulations were performed for each road mission: one with maximum initial SOC and one with minimum initial SOC. When the difference between the fuel consumption obtained with the two SOC values was below 1%, the number of road mission repetitions was considered sufficient.
Vehicle longitudinal parameters are reported in Table 5.
Supercapacitor storage features are reported in Table 6; a 162-Wh supercapacitor module is used to perform simulations, according to what was presented in [40].

3.4. Simulation Results

Different vehicle configurations are taken into account:
  • Regular vehicle (RV): spark ignition engine, automatic transmission optimized for consumption minimization.
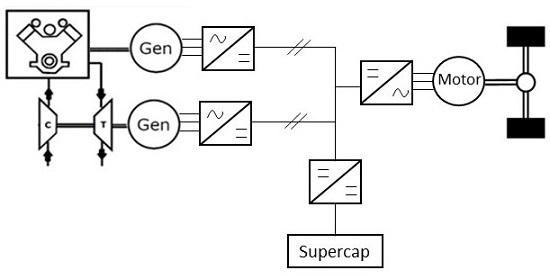
  • Spark Ignition Series Hybrid Vehicle (SI SHV): spark ignition engine, series architecture, supercapacitor module, SiC power converters.
  • Diesel Series Hybrid Vehicle (D SHV): diesel engine, series architecture, supercapacitor module, SiC power converters.
  • Turbocompound Diesel Series Hybrid Vehicle (TCD SHV): diesel engine combined with the turbocompound technology, series architecture, supercapacitor module, SiC power converters.
Each configuration corresponds to a different MATLAB/Simulink model [10,18,22]. In order to provide a fair comparison, machine and inverter efficiency are the same for each configuration (according to what was presented in [10,18,22]) and vehicle longitudinal parameters (i.e., parameters in Table 5) are equal for all configurations. In Table 7, fuel economy is reported for various road missions for all the above-mentioned configurations.
It can be notice how turbocompound introduction guarantees a great fuel consumption reduction, as it can be highlighted in Table 8 where fuel saving (i.e., fuel reduction moving from D SHV to TCD SHV) is shown. The use of a series architecture allows a great improvement from turbocompound use also in urban missions (UDDS, Urban, and Fast-urban); as a matter of fact, although average demanded power is low (thus turbocompound would not allow significant fuel saving in traditional vehicle or parallel configurations [23]), ICE constantly works at high-load in series architecture. Please note that high-load does not mean maximum load, indeed turbocompound efficiency improvement in diesel engines is significant starting from 50% of full load, whereas it does not give substantial benefits for lower loads.

4. Conclusions

In this paper an analytic study to determine efficiency map of a four cylinder, common rail, 2000 cm3 diesel engine equipped with turbocompound is carried out. Once the efficiency contour map was obtained, it was used to evaluate benefits on a series hybrid architecture for a medium sized car. This architecture, using supercapacitors as storage system, which can store energy at high efficiency, allows the ICE to work in optimal conditions (i.e., high-load). Therefore, not only this architecture is more efficient with traditional ICE, but it can further benefit from TC introduction. As a matter of fact, ICE generally works at low-load in traditional vehicles and parallel hybrid vehicles, hence TC would lead to negligible advantages in these architectures.
The simulation results show a fuel saving from 10% to 12.5% in the diesel series architecture thanks to the introduction of the TC system. The proposed architecture shows a fuel consumption reduction from 44% to 61% compared to a traditional vehicle and from 43% to 55% compared to a series/parallel hybrid vehicle with battery storage and spark-ignition engine.

Author Contributions

M.R. and A.P.P. conceived the turbocompound modelling and managed the study of Section 2. M.P. and L.V. managed the study of Section 3. M.P. wrote the article. M.M. and A.P.P. revised the article and supervised the all work. All authors have read and agreed to the published version of the manuscript.

Funding

This research received no external funding.

Conflicts of Interest

The authors declare no conflict of interest.

Nomenclature

SymbolDefinition
hEnthalpy for mass unit (kJ/kg)
WWork for mass unit (kJ/kg)
QExchanged heat for mass unit (kJ/kg)
pPressure (Pa)
TTemperature (K)
cSpeed (m/s)
mMass (kg)
ηEfficiency
βExpansion ratio
εPulsating factor
APulsation amplitude
λ(k-1)/k where k is the exponent of Poisson adiabatic equation
PPower (kW)
ICEInternal Combustion Engine
TCTurbocharger
PUPower Unit (ICE + TC)
vSpecific volume (m3/kg)
pmeMean effective pressure (Pa)
CpConstant pressure specific heat capacity (kJ/K)
FFuel power (kW)
qExchanged heat per time unit (kW)
Ω Pipe section (m2)
ρ Density (kg/m3)
ΨEfficiency increase
αExchanged heat equation slope
φExchanged heat equation intercept
Subscript
eExternal
tTotal
mMechanical
TTurbine
maxMaximum
minMinimum
aFriction
cCompressor
AAir
FFuel
Superscript
_Stationary conditions
.Time derivative
˜ Apparent
Thermodynamic Cycle Points
1Ambient condition
2Compressor output
3Intercooler output
4ICE end of compression
5ICE End of combustion
6ICE end of expansion
7Turbine input
8Turbine output

References

  1. Salmasi, F.R. Control strategies for hybrid electric vehicles: Evolution, classification, comparison, and future trends. IEEE Trans. Veh. Technol. 2007, 56, 2393–2404. [Google Scholar] [CrossRef]
  2. Uebel, S.; Murgovski, N.; Tempelhahn, C.; Bäker, B. Optimal energy management and velocity control of hybrid electric vehicles. IEEE Trans. Veh. Technol. 2017, 67, 327–337. [Google Scholar] [CrossRef]
  3. Awadallah, M.; Tawadros, P.; Walker, P.; Zhang, N.; Tawadros, J. A system analysis and modeling of a HEV based on ultracapacitor battery. In Proceedings of the 2017 IEEE Transportation Electrification Conference and Expo, Asia-Pacific (ITEC Asia-Pacific), Harbin, China, 2–5 August 2017; pp. 792–798. [Google Scholar]
  4. Millo, F.; Cubito, C.; Rolando, L.; Pautasso, E.; Servetto, E. Design and development of an hybrid light commercial vehicle. Energy 2017, 136, 90–99. [Google Scholar] [CrossRef]
  5. Cheng, Y.-H.; Lai, C.-M. Control strategy optimization for parallel hybrid electric vehicles using a memetic algorithm. Energies 2017, 10, 305. [Google Scholar] [CrossRef] [Green Version]
  6. Lanzarotto, D.; Passalacqua, M.; Repetto, M. Energy comparison between different parallel hybrid vehicles architectures. Int. J. Energy Prod. Manag. 2017, 2, 370–380. [Google Scholar] [CrossRef] [Green Version]
  7. Burress, T.A.; Campbell, S.L.; Coomer, C.; Ayers, C.W.; Wereszczak, A.A.; Cunningham, J.P.; Lin, H.T. Evaluation of the 2010 Toyota Prius hybrid synergy drive system. In Power Electronics and Electric Machinery Research Facility; Technical Report ORNL/TM2010/253; Oak Ridge National Laboratory (ORNL): Oak Ridge, TN, USA, 2010. [Google Scholar]
  8. Kim, N.; Cha, S.; Peng, H. Optimal control of hybrid electric vehicles based on Pontryagin’s minimum principle. IEEE Trans. Control Syst. Technol. 2011, 19, 1279–1287. [Google Scholar]
  9. Chung, C.-T.; Wu, C.-H.; Hung, Y.-H. Effects of electric circulation on the energy efficiency of the power split e-CVT hybrid systems. Energies 2018, 11, 2342. [Google Scholar] [CrossRef] [Green Version]
  10. Bonfiglio, A.; Lanzarotto, D.; Marchesoni, M.; Passalacqua, M.; Procopio, R.; Repetto, M. Electrical-loss analysis of power-split hybrid electric vehicles. Energies 2017, 10, 2142. [Google Scholar] [CrossRef] [Green Version]
  11. Kim, H.; Wi, J.; Yoo, J.; Son, H.; Park, C.; Kim, H. A Study on the fuel economy potential of parallel and power split type hybrid electric vehicles. Energies 2018, 11, 2103. [Google Scholar] [CrossRef] [Green Version]
  12. Pei, H.; Hu, X.; Yang, Y.; Tang, X.; Hou, C.; Cao, D. Configuration optimization for improving fuel efficiency of power split hybrid powertrains with a single planetary gear. Appl. Energy 2018, 214, 103–116. [Google Scholar] [CrossRef]
  13. Xiang, C.; Ding, F.; Wang, W.; He, W. Energy management of a dual-mode power-split hybrid electric vehicle based on velocity prediction and nonlinear model predictive control. Appl. Energy 2017, 189, 640–653. [Google Scholar] [CrossRef]
  14. Yang, Y.; Pei, H.; Hu, X.; Liu, Y.; Hou, C.; Cao, D. Fuel economy optimization of power split hybrid vehicles: A rapid dynamic programming approach. Energy 2019, 166, 929–938. [Google Scholar] [CrossRef]
  15. Chen, J.; Du, J.; Wu, X. Fuel economy analysis of series hybrid electric bus with idling stop strategy. In Proceedings of the 2014 9th International Forum on Strategic Technology (IFOST), Cox’s Bazar, Bangladesh, 21–23 October 2014; pp. 359–362. [Google Scholar]
  16. Kim, M.; Jung, D.; Min, K. Hybrid Thermostat strategy for enhancing fuel economy of series hybrid intracity bus. IEEE Trans. Veh. Technol. 2014, 63, 3569–3579. [Google Scholar] [CrossRef]
  17. Zhao, Y.; Yao, J.; Zhong, Z.M.; Sun, Z.C. The research of powertrain for supercapacitor-based series hybrid Bus. In Proceedings of the 2008 IEEE Vehicle Power and Propulsion Conference, Harbin, China, 3–5 September 2008; pp. 1–4. [Google Scholar]
  18. Passalacqua, M.; Lanzarotto, D.; Repetto, M.; Marchesoni, M. Advantages of Using Supercapacitors and Silicon Carbide on Hybrid Vehicle Series Architecture. Energies 2017, 10, 920. [Google Scholar] [CrossRef] [Green Version]
  19. Xie, S.; Hu, X.; Liu, T.; Qi, S.; Lang, K.; Li, H. Predictive vehicle-following power management for plug-in hybrid electric vehicles. Energy 2019, 166, 701–714. [Google Scholar] [CrossRef]
  20. Liu, T.; Wang, B.; Yang, C. Online Markov Chain-based energy management for a hybrid tracked vehicle with speedy Q-learning. Energy 2018, 160, 544–555. [Google Scholar] [CrossRef]
  21. Passalacqua, M.; Lanzarotto, D.; Repetto, M.; Marchesoni, M. Conceptual design upgrade on hybrid pow ertrains resulting from electric improv ements. Int. J. Transp. Dev. Integr. 2018, 2, 146–154. [Google Scholar] [CrossRef] [Green Version]
  22. Passalacqua, M.; Lanzarotto, D.; Repetto, M.; Vaccaro, L.; Bonfiglio, A.; Marchesoni, M. Fuel Economy and ems for a series hybrid vehicle based on supercapacitor storage. IEEE Trans. Power Electron. 2019, 34, 9966–9977. [Google Scholar] [CrossRef]
  23. Jain, A.; Nueesch, T.; Naegele, C.; Lassus, P.M.; Onder, C.H. Modeling and control of a hybrid electric vehicle with an electrically assisted turbocharger. IEEE Trans. Veh. Technol. 2016, 65, 4344–4358. [Google Scholar] [CrossRef]
  24. Mamat, A.M.I.B.; Martinez-Botas, R.F.; Rajoo, S.; Romagnoli, A.; Petrovic, S. Waste heat recovery using a novel high performance low pressure turbine for electric turbocompounding in downsized gasoline engines: Experimental and computational analysis. Energy 2015, 90, 218–234. [Google Scholar] [CrossRef] [Green Version]
  25. Dimitriou, P.; Burke, R.; Zhang, Q.; Copeland, C.; Stoffels, H. Electric turbocharging for energy regeneration and increased efficiency at real driving conditions. Appl. Sci. 2017, 7, 350. [Google Scholar] [CrossRef] [Green Version]
  26. Jye, A.T.S.; Pesiridis, A.; Rajoo, S. Effects of Mechanical Turbo Compounding on a Turbocharged Diesel Engine; SAE International: Warrendale, PA, USA, 2013. [Google Scholar]
  27. Katsanos, C.; Hountalas, D.; Zannis, T. Simulation of a heavy-duty diesel engine with electrical turbocompounding system using operating charts for turbocharger components and power turbine. Energy Convers. Manag. 2013, 76, 712–724. [Google Scholar] [CrossRef]
  28. Kant, M.; Romagnoli, A.; Mamat, A.M.; Martinez-Botas, R.F. Heavy-duty engine electric turbocompounding. Proc. Inst. Mech. Eng. Part D J. Automob. Eng. 2015, 229, 457–472. [Google Scholar] [CrossRef]
  29. Zhao, R.; Zhuge, W.; Zhang, Y.; Yang, M.; Martinez-Botas, R.; Yin, Y. Study of two-stage turbine characteristic and its influence on turbo-compound engine performance. Energy Convers. Manag. 2015, 95, 414–423. [Google Scholar] [CrossRef]
  30. Zhao, R.; Zhuge, W.; Zhang, Y.; Yin, Y.; Zhao, Y.; Chen, Z. Parametric study of a turbocompound diesel engine based on an analytical model. Energy 2016, 115, 435–445. [Google Scholar] [CrossRef]
  31. Marelli, S.; Carraro, C.; Marmorato, G.; Zamboni, G.; Capobianco, M. Experimental analysis on the performance of a turbocharger compressor in the unstable operating region and close to the surge limit. Exp. Therm. Fluid Sci. 2014, 53, 154–160. [Google Scholar] [CrossRef]
  32. Bozza, F.; de Bellis, V.; Marelli, S.; Capobianco, M. 1D simulation and experimental analysis of a turbocharger compressor for automotive engines under unsteady flow conditions. SAE Int. J. Engines 2011, 4, 1365–1384. [Google Scholar] [CrossRef] [Green Version]
  33. Pasini, G.; Lutzemberger, G.; Frigo, S.; Marelli, S.; Ceraolo, M.; Gentili, R.; Capobianco, M. Evaluation of an electric turbo compound system for SI engines: A numerical approach. Appl. Energy 2016, 162, 527–540. [Google Scholar] [CrossRef]
  34. Zinner, K.A. Supercharging of Internal Combustion Engines: Additional; Springer Science & Business Media: Berlin/Heidelberg, Germany, 2012. [Google Scholar]
  35. Marelli, S.; Capobianco, M.; Zamboni, G. Pulsating flow performance of a turbocharger compressor for automotive application. Int. J. Heat Fluid Flow 2014, 45, 158–165. [Google Scholar] [CrossRef]
  36. Confidential data related to test performed by the Department of Mechanical Engineering (DIME) of the University of Genova in collaboration with Centro Ricerche Fiat (CRF).
  37. Deligant, M.; Podevin, P.; Descombes, G. Experimental identification of turbocharger mechanical friction losses. Energy 2012, 39, 388–394. [Google Scholar] [CrossRef]
  38. Confidential data of the Department of Mechanical Engineering (DIME), regarding studies on turbocharged power unit for car racing application.
  39. United States Environmental Protection Agency (EPA). Vehicle and Fuel Emissions Testing Dynamometer Drive Schedules. Available online: https://www.epa.gov/vehicle-and-fuel-emissions-testing/dynamometer-drive-schedules (accessed on 14 January 2020).
  40. Passalacqua, M.; Carpita, M.; Gavin, S.; Marchesoni, M.; Repetto, M.; Vaccaro, L.; Wasterlain, S. Supercapacitor storage sizing analysis for a series hybrid vehicle. Energies 2019, 12, 1759. [Google Scholar] [CrossRef] [Green Version]
  41. Lanzarotto, D.; Marchesoni, M.; Passalacqua, M.; Prato, A.P.; Repetto, M. Overview of different hybrid vehicle architectures. IFAC PapersOnLine 2018, 51, 218–222. [Google Scholar] [CrossRef]
  42. Zhao, R.; Zhuge, W.; Zhang, Y.; Yin, Y.; Chen, Z.; Li, Z. Parametric study of power turbine for diesel engine waste heat recovery. Appl. Therm. Eng. 2014, 67, 308–319. [Google Scholar] [CrossRef]
  43. Königstein, A.; Grebe, U.D.; Wu, K.-J.; Larsson, P.-I. Differentiated analysis of downsizing concepts. MTZ Worldwide 2008, 69, 4–11. [Google Scholar] [CrossRef]
Figure 1. Turbocompound power unit scheme.
Energies 13 00447 g001
Figure 2. Exchanged heat as a function of turbine input gas temperature.
Energies 13 00447 g002
Figure 3. Turbocharger mechanical efficiency as a function of compressor power.
Energies 13 00447 g003
Figure 4. Combined efficiency η ¯ T · η m as a function of expansion ratio β. Green rhombi are the value obtained with Equations (10), (12) and (22), whereas the red line shows the experimental results obtained in [38].
Energies 13 00447 g004
Figure 5. Power unit efficiency as a function of pressure p7 for 2500 rpm and 17 bar pme.
Energies 13 00447 g005
Figure 6. Combined efficiency η ¯ T · η m as a function of expansion ratio β. Red dots are the value obtained with Equations (8), (11), (21), and the extrapolation process whereas the green line shows the results obtained in [38] for the same values of β.
Energies 13 00447 g006
Figure 7. Power unit efficiency η P U compared to ICE efficiency without turbocompound η I C E , as a function of fuel flow rate (g/cycle). Marks correspond to ICE speed (rpm).
Energies 13 00447 g007
Figure 8. Ratio between ICE power with turbocompound ( P I C E _ T C ) and ICE power without turbocompound ( P I C E ), as a function of fuel flow rate (g/cycle). Marks correspond to ICE speed (rpm).
Energies 13 00447 g008
Figure 9. ICE efficiency contour map.
Energies 13 00447 g009
Figure 10. Average power train efficiency over the simulated road missions as a function of storage and converter efficiency (%) [22].
Energies 13 00447 g010
Figure 11. ICE work points in the parallel (a), series/parallel (b), and series (c) architecture [22].
Energies 13 00447 g011
Figure 12. The 40-kW diesel (a) and 40-kW diesel + TC (b) efficiency contour map. ICE working point in series architecture are shown.
Energies 13 00447 g012
Table 1. Internal combustion engine (ICE) power in the 20 analyzed points.
PME1500 rpm2000 rpm2500 rpm3000 rpm
6 bar16.3 kW20.7 kW26.0 kW33.5 kW
8 bar21.8 kW28.8 kW35.6 kW44.6 kW
11 bar30.3 kW40.0 kW50.0 kW60.8 kW
17 bar44.5 kW61.6 kW77.3 kW92.4 kW
Maximum load55.3 kW
(21.1 bar)
82.6 kW
(22.9 bar)
101 kW
(22.6 bar)
115 kW
(21.6 bar)
Table 2. ε as a function of ICE speed and mean effective pressure.
RPM6 bar8 bar11 bar17 bar22 bar
15001.671.701.671.451.36
20001.281.351.341.251.20
25001.151.181.191.151.12
30001.071.081.111.091.08
Table 3. η ¯ T · η m as a function of ICE speed and mean effective pressure.
RPM6 bar8 bar11 bar17 bar22 bar
15000.350.350.360.540.58
20000.450.480.490.560.61
25000.580.570.590.640.66
30000.650.670.650.670.67
Table 4. Road mission features.
Road MissionAverage Speed (km/h)Maximum Speed (km/h)Length (km)Change of AltitudeMaximum Road Slope (%)
US067813013--
UDDS319012--
HWFET789716.5--
Urban245711.420Negligible
Fast-urban276822626
Extra-urban4580363009
Table 5. Vehicle longitudinal parameters.
ParametersValue
Mass 1 (kg)1450
Rolling coefficient0.01
Aerodynamic drag coefficient0.25
Front section (m2)2.3
Wheel radius (m)0.3
Final gear ratio8
Differential gear efficiency
Gearbox efficiency (parallel)
Power-split gear efficiency (series/parallel)
0.97
0.95
0.95
Air density (kg/m3)
ICE maximum power (parallel) (kW)
1.22
72
ICE maximum power 2 (series) (kW)40
Mass 1 (kg)1450
Rolling coefficient0.01
Aerodynamic drag coefficient0.25
1 The vehicle mass includes the electric machines (about 80 kg), the storage system (85 kg), and the electric converter (about 15 kg). 2 The vehicle performance is related to the electric motor and it is independent of the ICE sizing in the series architecture; as a consequence, ICE downsizing is about 50%.
Table 6. Supercapacitor storage features.
FeaturesValue
Elementary module employedBMOD0165 P048 C01
Series module number4
Total mass (kg)56
Rated capacitance, C (F)41.2
Rated voltage, Vmax (V)192
Equivalent series resistance (ESR) (mΩ)24
Rated power 1 (kW)365
Usable energy 2 (Wh)162
1 The storage rated power is one order of magnitude higher than the converter nominal power, therefore, this is not a critical parameter for the storage. Indeed, the sizing criterion for supercapacitors is the stored energy. 2 Usable energy, calculated considering a working condition between 50% and 100% of the rated voltage.
Table 7. Fuel economy of different hybrid electric vehicle (HEVs) over different road missions (km/L).
Road MissionRVSI SHVD SHVTCD SHV
US0616.120.727.529.1
UDDS19.134.745.449.5
HWFET23.227.636.238.9
Urban19.53545.250.2
Fast-urban2035.34650
Extra-urban25.23646.950.6
Table 8. Turbocompound fuel saving.
Road MissionTurbocompound Fuel Saving
US0610.2%
UDDS11.6%
HWFET11.0%
Urban12.5%
Fast-urban11.5%
Extra-urban11.1%

