Article

Optimization of Fluidization State of a Circulating Fluidized Bed Boiler for Economical Operation

1
China Special Equipment Inspection and Research Institute, Beijing 100029, China
2
Key Laboratory for Thermal Science and Power Engineering of Ministry of Education, Tsinghua University, Beijing 100084, China
*
Author to whom correspondence should be addressed.
Energies 2020, 13(2), 376; https://doi.org/10.3390/en13020376
Submission received: 5 December 2019 / Revised: 30 December 2019 / Accepted: 7 January 2020 / Published: 13 January 2020

Abstract

:
To reduce the auxiliary power consumption and improve the reliability of large-scale circulating fluidized bed (CFB) boilers, we developed energy-saving CFB combustion technology based on the fluidization state re-specification. A calculation model of coal comminution energy consumption was used to analyze the change in comminution energy consumption, and a 1D CFB combustion model was modified to predict the operation parameters under the fluidization state optimization conditions. With a CFB boiler of 480 t/h, the effect of fluidization state optimization on the economical operation was analyzed using the above two models. We found that combustion efficiency presents a nonmonotonic trend with the change in the bed pressure drop and feeding coal size. There are an optimal bed pressure drop and a corresponding feeding coal size distribution, under which the net coal consumption is the lowest. Low bed pressure drop operation achieved by reducing the coal particle size is not beneficial to SO2 and NOx emission control, and the pollutant control cost increases. The effect of fluidization state optimization on the gross cost of power supply can be calculated, and the optimal bed pressure drop can be obtained.

Graphical Abstract

1. Introduction

With the advantages of fuel flexibility, a wide range of load adjustment and low cost for emission control, the circulating fluidized bed (CFB) boiler has been widely commercialized in recent years. However, CFB boilers have also shown deficiencies, such as high auxiliary power consumption and wear-related problems. To solve these problems, fluidization state re-specification in CFB boilers was proposed, namely flow pattern reconstruction [1,2]. It means that CFB boilers can be operated under a relatively low bed pressure drop by reducing the quantity of ineffective bed materials [3]. After the fluidization state is optimized, the combustion profile and heat transfer in the furnace change and the formation of the pollutant changes correspondingly. The aim of this work is to analyze the optimization of fluidization state for the economical operation of CFB boilers.
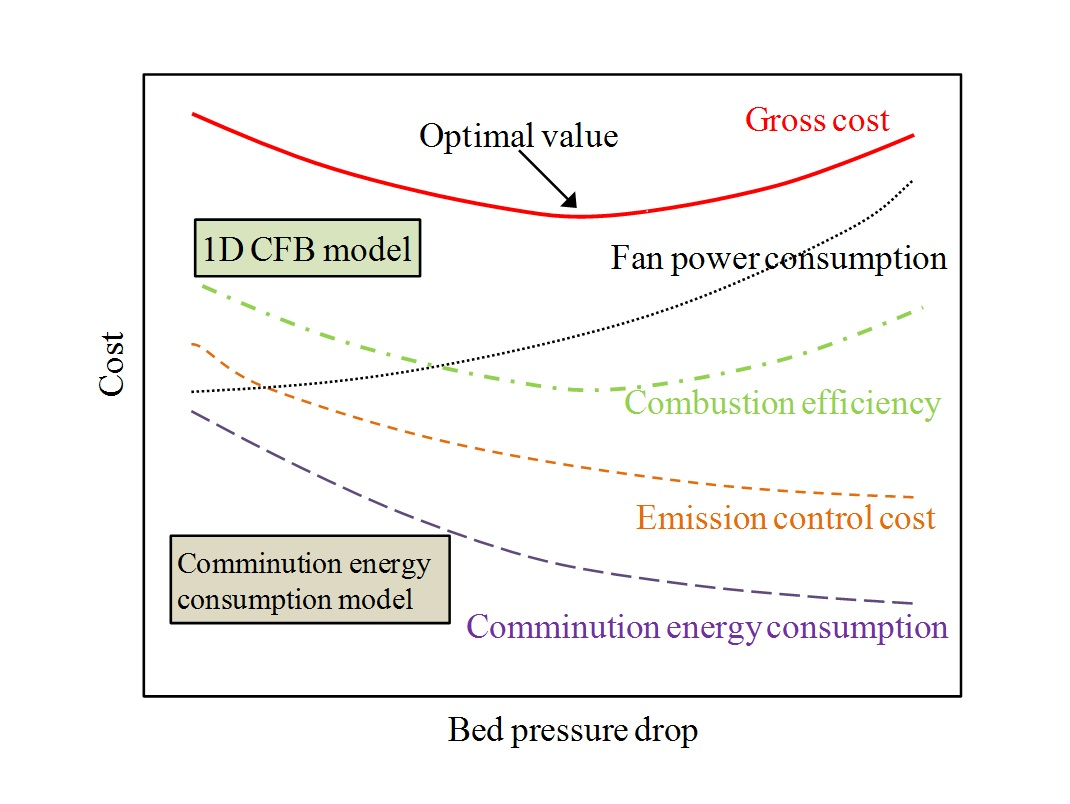
In the past decade, the characteristics and effects of fluidization state optimization have been studied. There would be a theoretical optimal value of bed pressure drop, around which the boiler operation can achieve the maximal combustion efficiency and with a significant reduction of the fan power consumption. At the same time, the wear of the heating surfaces can be alleviated, and the reliability can be improved [4]. The heat transfer coefficient increases significantly when the solid suspension density is increased [
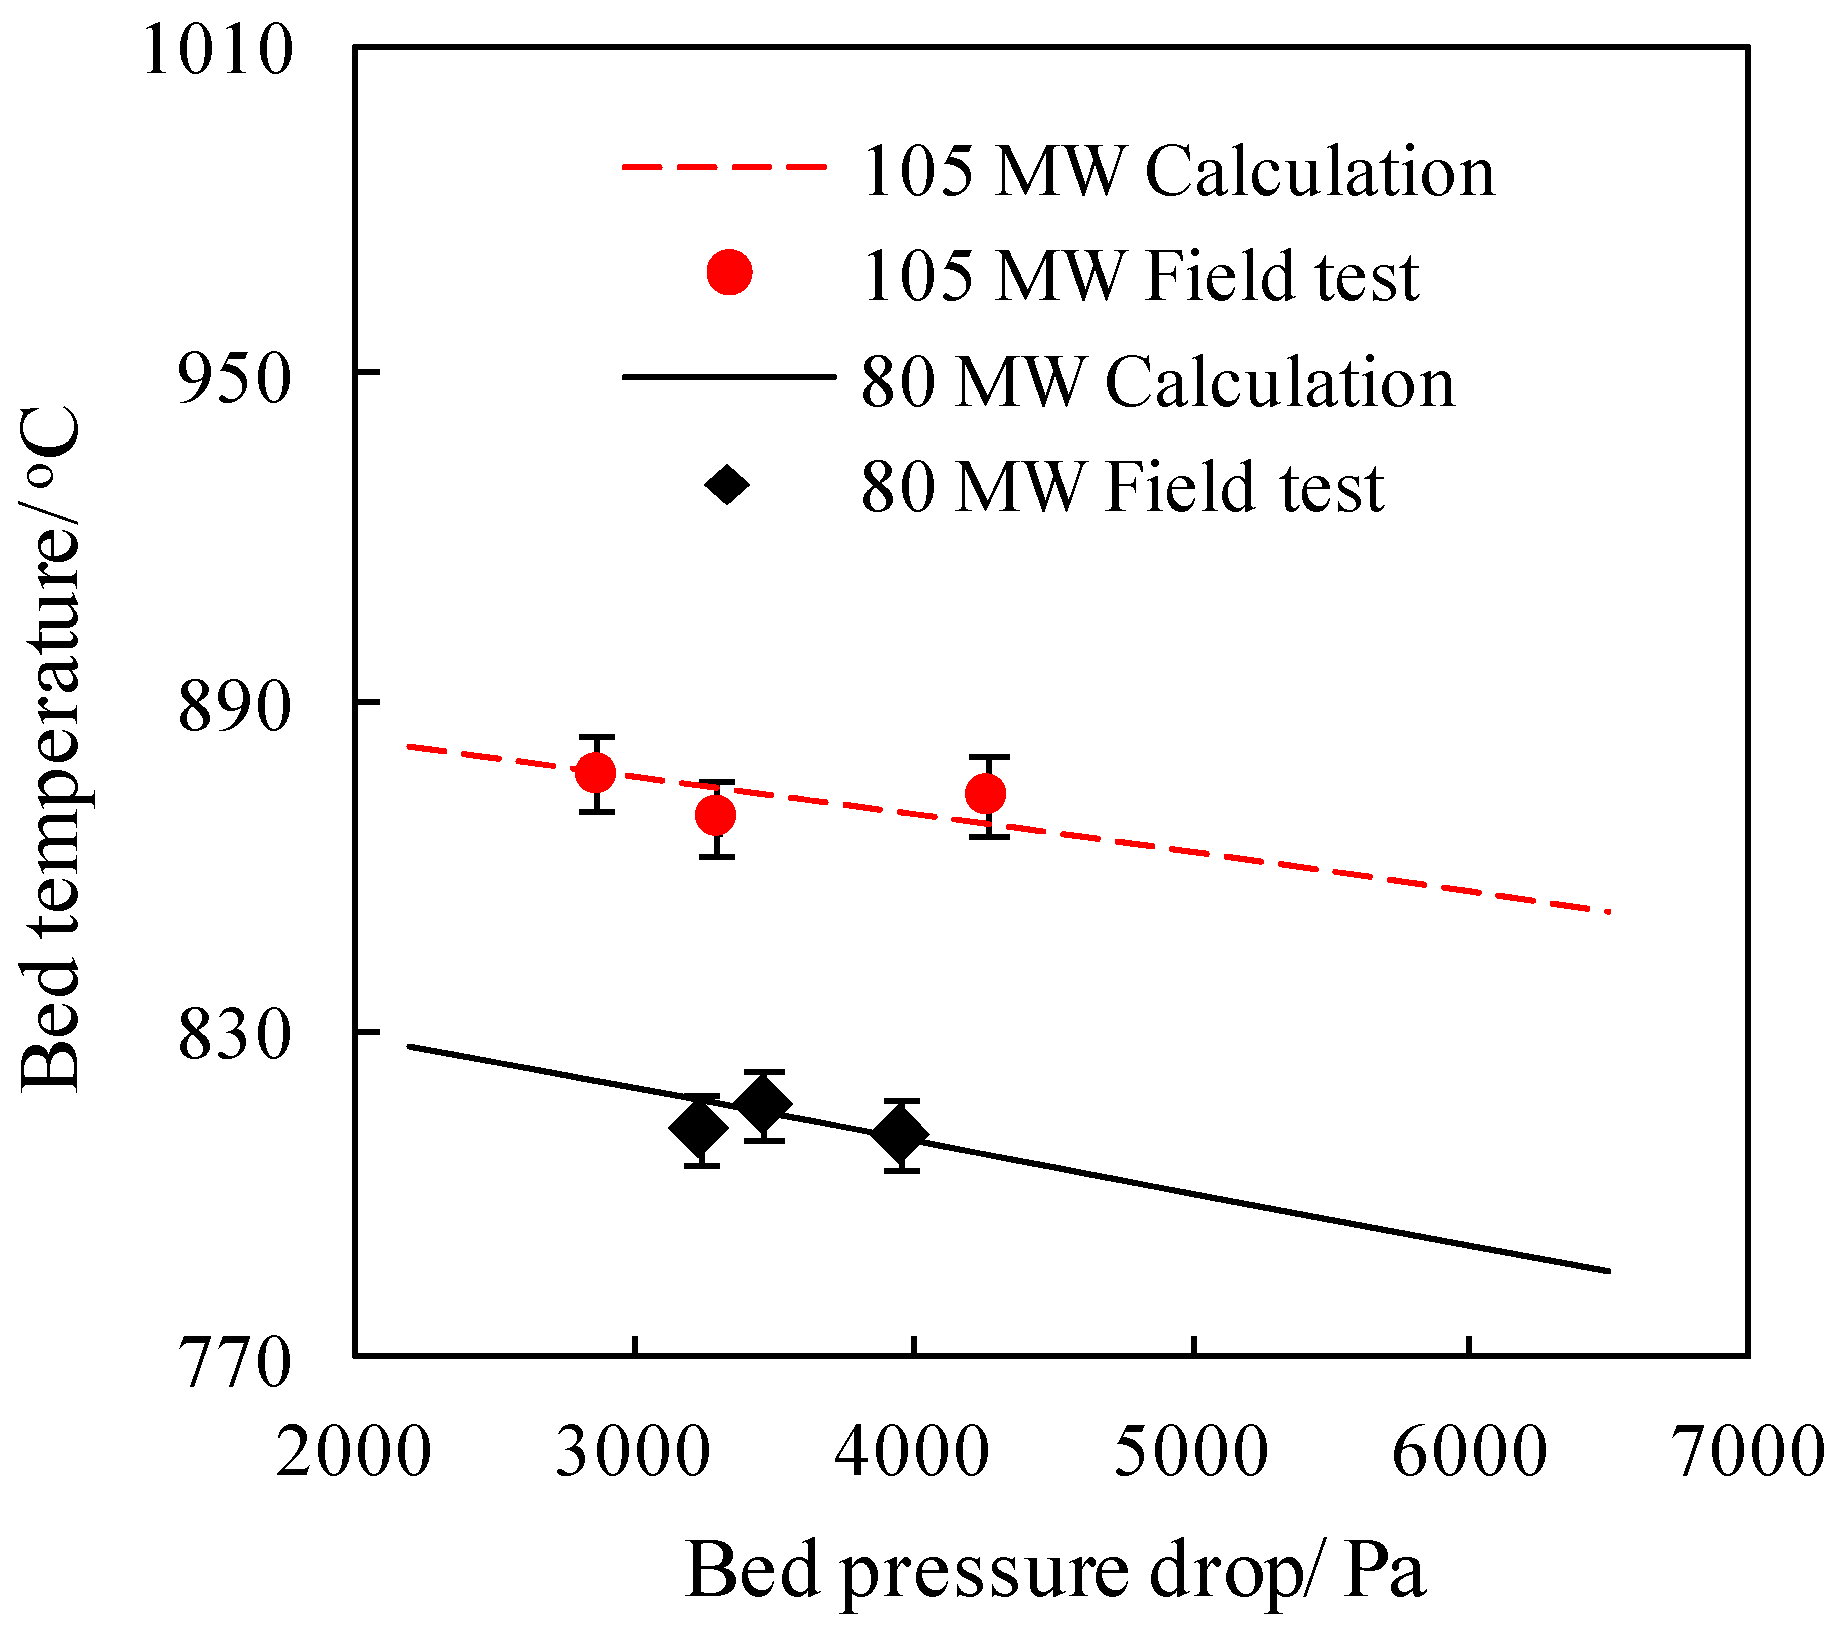
5]. At a certain load and with the fixed size distribution of feeding coal particles, a decrease in bed pressure drop yields an increase in bed temperature and reduced heat transfer coefficient [6]. The role of bed particle size in the heat transfer to membrane walls of a supercritical CFB combustion system was investigated [7]. The effect of fluidization state optimization on combustion efficiency and pollutant emission in the CFB boiler has also been studied [8,9]. The fluidization state specification (FSS) design principle [10] can be used for saving energy consumption, improving combustion efficiency, and achieving ultra-low NOx and SO2 emission [11,12,13]. Change in the bed pressure drop and size distribution of feeding coal particles directly influences the solids concentration profile and, therefore, affect the heat transfer and reaction. In this work, the optimization of the fluidization state for the economical operation of CFB boilers was attempted.
Many empirical and semi-empirical models have been used for simulation of CFB boilers, including calculation of fluid dynamics, reaction, and heat transfer. These models have often been applied to one dimension or two dimensions. A typical hydrodynamic model is based on the assumptions that the furnace is characterized by two flow regimes, a dense region at the bottom and a dilute region above. The dense phase operates in the turbulent fluidized bed regime while in the dilute phase, a core–annulus solids flow structure is established [14,15]. Gungor [16] used a single-phase back-flow cell model to represent the solid mixing in the dense phase zone. Wang et al. [17] developed a 2D particle population balance model for the particle size and density distribution based on the analysis of particle properties and the core-annulus hydrodynamic model. Krzywanski et al. [18] proposed a model of coal combustion in an oxygen-enriched CFB environment. Blaszczuk et al. [19] developed a mass balance model for the particle size distribution and solids’ mass fluxes in a supercritical CFB boiler. 3D semi-empirical models are rarer. Adamczyk et al. [20,21] used a hybrid Euler-Lagrange technique to model the dense gas-solid flow. Xu et al. [22] simulated the gas-solid hydrodynamics based on the Euler–Euler model and energy-minimization multiscale drag model. Although the 3D models can provide more detailed information about the local phenomena inside the furnace, they are computationally more demanding, and the modeling speed is slower. The 1D model can predict the main operating parameters with a fast calculation speed, and it can well meet the engineering needs. Previously, the authors and other research groups have developed many 1D models and realized calculations under normal operating conditions [15,16,23]. However, under the conditions of fluidization state re-specification, due to the decrease in solids concentration in the transition zone and the improvement in secondary air penetration, the previous model could not accurately predict the solids concentration distribution along with the furnace height or the carbon content in fly and bottom ash.
We introduced the effect of secondary air penetration on the combustion reaction in the 1D model established before so that the 1D model can predict the combustion efficiency with higher accuracy under the condition of fluidization state re-specification. The calculation results were validated with field tests carried out in a 480 t/h CFB boiler. In addition, to achieve the fluidization state re-specification, the size of feeding coal particles needs to be finer. To obtain the effect of the fluidization state re-specification on the overall operation economics of the boiler, this is the first attempt to comprehensively analyze the energy-saving and pollutant emission change caused by fluidization state re-specification using 1D CFB model, and the increase in comminution energy consumption of feeding coal particles using a calculation model of coal comminution energy consumption established in our previous work [24]. Based on the analysis of gross cost, the optimal bed pressure drop and corresponding feeding coal size distribution can be calculated.
In this paper, Section 2 gives a description to the 1D CFB model and verification of the model by field tests. Section 3 gives a brief introduction to the calculation model of fuel comminution energy consumption. Section 4 analyzes the effect of fluidization state optimization on the economical operation, including the effect on auxiliary power consumption, power supply cost, SO2 and NOx emissions, and gross cost of power supply. The effect of separator efficiency on boiler performance is analyzed in the last subsection of Section 4. Based on the analysis of Section 4, conclusions are drawn in Section 5.

2. 1D CFB Model

2.1. Model Description

For CFB boilers, the 1D model usually refers to the cell model. The furnace is divided into several cells along with the height, and the parameters in each cell are assumed to be uniform. The mass and energy balance equations are established in each cell. Heat exchange caused by the mass flow between adjacent cells is also considered. As the 1D model can meet the engineering needs very well, it is widely used.

2.1.1. Mass Balance

The mass balance of the solids flow (ash, char, and lime) and gas components (O2, SO2, CO, etc.) is established in each cell.
In CFB boilers, the gas flow is approximate to the plug flow. Thus, gas back-mixing is not considered in the calculation process. The mass balance of gas component j in cell i is shown in Figure 1.
The mass balance equation can be expressed as
u g ( i + 1 ) C i + 1 , j A u g ( i ) C i , j A + F i , j + R p i , j R r i , j = 0
where ug(i+1) is the gas velocity in cell i + 1, ug(i) is the gas velocity in cell i, Ci+1,j is the concentration of gas component j in cell i + 1, Ci,j is the concentration of gas component j in cell i, Rpi,j is the generation rate of component j in cell i, Rri,j is the consumption rate of component j in cell i, Fi,j is the flow rate of component j fed in cell i by primary and secondary air, and A is the furnace area.
For a solids flow, ash and lime particles are classified into different categories according to size and age, respectively. In cell i, the mass balance of ash particles in size group j and age group k is shown in Figure 2.
The mass balance of ash particles should satisfy the following equation [23]:
m ˙ a f , i , j , k + m ˙ a r , i , j , k m ˙ a d , i , j , k + m ˙ a u p , i + 1 , j , k m ˙ a u p , i , j , k + m ˙ a d o w n , i 1 , j , k m ˙ a d o w n , i , j , k + m ˙ a s h i f t , i , j , k + m ˙ a k 1 k m ˙ a k k + 1 = 0
where m ˙ denotes mass flux rate, subscripts a, f, r, d, up, down, and shift represent ash, fed particles, recirculation particles, drainage of bottom ash particles, upwards solids flux, downwards solids flux, and mass flux caused by attrition, respectively.
The mass balance equation of limestone particles is similar to that of ash particles, which can be expressed as
m ˙ l f , i , j , k + m ˙ l r , i , j , k m ˙ l d , i , j , k + m ˙ l u p , i + 1 , j , k m ˙ l u p , i , j , k + m ˙ l d o w n , i 1 , j , k m ˙ l d o w n , i , j , k + m ˙ l s h i f t , i , j , k + m ˙ l k 1 k m ˙ l k k + 1 = 0
where subscript l represents limestone particles.
For char particles, the mass variation caused by the combustion reaction should be added. The mass balance equation is as follows:
m ˙ c f , i , j , k + m ˙ c r , i , j , k m ˙ c d , i , j , k + m ˙ c u p , i + 1 , j , k m ˙ c u p , i , j , k + m ˙ c d o w n , i 1 , j , k m ˙ c d o w n , i , j , k + m ˙ c s h i f t , i , j , k m ˙ c c , i , j , k + m ˙ c k 1 k m ˙ c k k + 1 = 0
where subscript c represents limestone particles, m ˙ c c , i , j , k is the mass change rate of char particles caused by combustion reaction.
The density and size of particles in different groups vary, leading to the segregation of particles. The upwards solids flux can be calculated using a segregation model. An attrition model was used for calculation of mass flux caused by attrition. Details of these two models can be found in previous studies [23].

2.1.2. Chemical Reaction

The reaction model accounts for volatile release, char combustion, desulfurization, NOx formation, and reduction. The composition of the volatile matter is considered as CO, CO2, H2, CH4, SO2, HCN, and NH3. The char combustion reaction follows:
C + 1 ϕ O 2 [ 2 2 ϕ ] CO + [ 2 ϕ 1 ] CO 2
where ϕ can be calculated by the model proposed by Ross et al. [25].
The combustion reaction rate k c can be calculated as follows:
1 k c = 1 ϕ k d + 1 k s
where k s represents the chemical reaction rate constant and k d is the oxygen diffusion rate.
For calculation of combustion after fluidization state optimization, the secondary air mixing coefficient is introduced to describe the effect of secondary air penetration [8].
k d = ψ D g d c S h
where ψ is the secondary air mixing coefficient, Dg is the oxygen diffusion coefficient, and dc is the char particle diameter. Sh is the Sherwood Number, reflecting the influence of gaseous mass transfer in the boundary layer of char particles on combustion reaction.
ψ increases with the secondary air penetration depth, leading to an increase in kd. ψ can be assumed as follows [8]:
ψ = exp ( x a / 2 k )
where x is the secondary air penetration depth, a is the furnace depth, and k is the correction factor [26].
x = 1.7255 ( ρ 2 u 2 2 ρ g u g 2 + ρ p ( 1 ε ) u p 2 ) 0.5 d 0
where ρ2 is the secondary air density, u2 is the secondary air jet velocity, ρg is the mainstream air density, ug is the mainstream air velocity, ρp is the solid particle density, ε is the voidage, up is the slip velocity of solid particles, and d0 is the nozzle diameter.
For the desulfurization reaction, the conversion rate of CaO can be calculated as follows [27]:
d X s d t = K 0 C SO 2 exp ( K 0 C SO 2 t X s , max )
where Xs is the conversion rate of limestone, K0 is the chemical reaction constant, Xs,max is the maximum conversion rate of limestone when the reaction time tends to be infinite, and C SO 2 is SO2 concentration on CaO surface.
The conversion rate of CaO at time t can be obtained by integration of the above equation:
X s = X s , max ( 1 exp ( K 0 C SO 2 t X s , max ) )
In this work, reaction used to model the NOx formation and reduction is shown in Table 1. As all N-related reaction does not have the same importance, this work uses only the critical reaction, instead of considering all reaction [28,29,30].

2.1.3. Energy Balance

For a certain cell, heat is transported in and out by the gas components and solid particles at various temperature. At the same time, there is exothermic reaction (e.g., char combustion and volatile combustion) and endothermic reaction (e.g., limestone calcination). The heating surfaces in the furnace are constantly absorbing heat. Under steady operation conditions, the energy balance can be established as follows:
H in H out + Q r Q a Q t = 0
where ∑Hin is the heat transported in the cell by the gas-solid flow, ∑Hout is the heat transported out of the cell by the gas-solid flow, ∑Qr is the total heat released from chemical reaction, ∑Qa is the total heat absorbed by chemical reaction, and ∑Qt is the heat absorbed by the heating surfaces.
The heat transfer characteristics in CFB boilers are different from the pulverized coal (PC) boilers. Due to the high concentration of solid particles, the convection heat transfer of solid particles cannot be neglected. At the same time, the radiation heat transfer is relatively weak because of the low temperature in the furnace. Therefore, the heat transfer model in CFB boilers is different from that in PC boilers. According to the research results of Lu [31], the heat transfer model is established, and the influence of solid material concentration on the heat transfer coefficient is mainly considered.

2.1.4. Solving Method

The solving method is done semi-analytically with three iterative loops. The first iterative loop is energy balance, which is also the outermost iterative loop. The temperature in each cell is assumed. Then the particle concentration distribution is assumed and solved by iteration under this temperature distribution, which is the second iterative loop. As the mass fraction of char in bed inventory is relatively low and the effect of reaction on the mass balance can be neglected, the calculation method solves the mass balance first and then the reaction model (the third iterative loop) [32]. Based on the results of the mass balance and reaction model, the heat transported in and out of the cell by the gas components and solid particles, heat absorbed and released by chemical reaction can be calculated. Combined with the heat transfer model in the furnace and tail flue, the temperature in each cell can be obtained. The energy balance can be solved by iteration until the temperature distribution converges.

2.2. Field Tests

The field tests were carried out in a 480 t/h CFB boiler in Shanxi province in China. The combustion chamber had a cross-section of 16.24 m × 7.21 m, and the bottom part was covered by refractory. The main design parameters are listed in Table 2. The proximate analysis and ultimate analysis of fed coal particles are listed in Table 3, and the size distribution is shown in Figure 3. Desulfurization was achieved by adding limestone into the furnace. During the test, Ca/s was maintained at around 2.5.

2.3. Verification of 1D Model

Using the modified 1D model, the main operation parameters can be calculated, including the size distribution and carbon content of fly ash and bottom ash, pressure and temperature distribution in the furnace, and pollutant emission concentration. Figure 4 shows the model prediction and field test results of carbon content in fly ash and bottom ash. The difference between analytical and experimental data of carbon content was all in the range of ±15%. The 1D model can predict the combustion efficiency change with fluidization state re-specification well by considering the influence of secondary air penetration on char combustion. With the decrease in bed pressure drop, the carbon content in fly ash decreased, while the carbon content in bottom ash increased.
Figure 5 shows the calculated and experimental results of furnace temperature under different boiler loads and bed pressure drop, which indicates that the model calculation results are in good agreement with the field test data, with the difference lower than ±5%. With a certain coal particle size distribution, if the boiler load was basically constant, the furnace temperature increased as the bed pressure drop decreased. It means that the heat transfer temperature difference ΔT increased. At the same time, the heat exchange remained unchanged. Therefore, the heat transfer coefficient K reduced [6].
Figure 6 shows the model prediction results of SO2 emission concentration. The difference between analytical and experimental data of SO2 emission concentration was all in the range of ±25%. The SO2 emission concentration showed an increasing trend with the decrease in bed pressure drop. When the bed pressure drop was higher than 5 kPa, the SO2 emission concentration increased slowly with the decrease in bed pressure drop. As the bed pressure drop further decreases, the trend of SO2 emission concentration change with bed pressure drop became sharp.
The change in the measured NOx emission concentration with different bed temperature was essentially the same as in the calculated values, with the difference within ±15%, as shown in Figure 7. It can be seen that the NOx emission concentration increased significantly with the bed temperature. With the increase in the bed temperature, the release and production rates of volatiles were increased, and the proportion of volatile nitrogen was increased correspondingly, which increased the conversion of nitrogen in coal particles to NO. In addition, when the bed temperature was increased, the NO formation reaction and reduction reaction accelerated at the same time, and the influence of bed temperature on the formation reaction was more remarkable, leading to an increase in a conversion rate of nitrogen to NO. Based on the above effects, the NO emission concentration increased.
The percentage difference between the calculated and experimental results is summarized in Table 4. As there are many factors affecting the experimental results in the field tests, while simplification has been made in the calculation process of the 1D model, the calculated results have deviation from the experimental values. The difference between the calculated and measured SO2 emission concentrations under the lowest bed pressure drop was the largest, about 25%. The other percentage difference between the calculated and experimental results was all within 15%. In general, the modified 1D model can predict the effect of fluidization state re-specification on combustion, heat transfer, and pollutant emission of CFB boilers.

3. Calculation Model of Fuel Comminution Energy Consumption

In the case of fluidization state re-specification, it is usually necessary to reduce the size of feeding coal particles to achieve steady operation under a lower bed pressure drop. For crushers, if the size distribution of inlet particles is fixed, the comminution energy change with the different sizes of products can be calculated as follows [24]:
Δ e = C n 1 ( j = 1 N p 1 ( j ) x p j 1 n i = 1 N p 2 ( i ) x p i 1 n ) = C n 1 ( Γ ( α 1 n + 1 α 1 ) x 1 P = 63.2 % 1 n Γ ( α 2 n + 1 α 2 ) x 2 P = 63.2 % 1 n )
where p1(j), p2(i) are the mass fraction of product particles in each size group, and N is the number of particle size groups. Γ is the Gamma Function, Γ ( x ) = 0 + t x 1 e t d t . α is a constant (distribution modulus) and x P = 63.2 % is the particle size corresponding to P x = 63.2 % (size modulus) for R-R size distribution. C and n are constants, which can be determined by comparing the calculation results with the experiment data. The value of n is influenced by the size range, and C is by the grindability. For the size range of crushing operation, n can be fitted as 1.814. The coefficient C can be correlated with the Hardgrove Grindability Index (HGI).
C = 1 a H G I + b
According to the experiment results, the values of a and b can be fitted as 0.021 and −0.783, respectively. The detailed derivation and experimental verification of the calculation model can be seen in reference [24].

4. Effect of Fluidization State Optimization on Economical Operation

4.1. Effect of Fluidization State Optimization on Auxiliary Power Consumption

To achieve steady operation under a lower bed pressure drop, it is necessary to maintain the solids concentration in the upper furnace as a constant before and after optimization of fluidization state, namely, the circulating flow rate. Therefore, when the bed pressure drop is reduced, the mass fraction of fine coal particles needs to be increased, that is, the size distribution of fed coal particles needs to be optimized. The CFB boiler mentioned in Section 2 is still taken as the calculation object. Taking the 85% load condition as an example, in the calculation process, the circulating flow rate remained constant by adjusting the coal particle size distribution when the bed pressure drop was reduced. The coal particle size distribution corresponding to different bed pressure drop is shown in Figure 8. The increase in comminution energy consumption caused by decrease in coal particle size, and the decrease in power consumption of primary and secondary air fans caused by decrease in bed pressure drop were calculated, respectively. Then the influence of fluidization state optimization on auxiliary power consumption can be obtained.

4.1.1. Comminution Energy Consumption

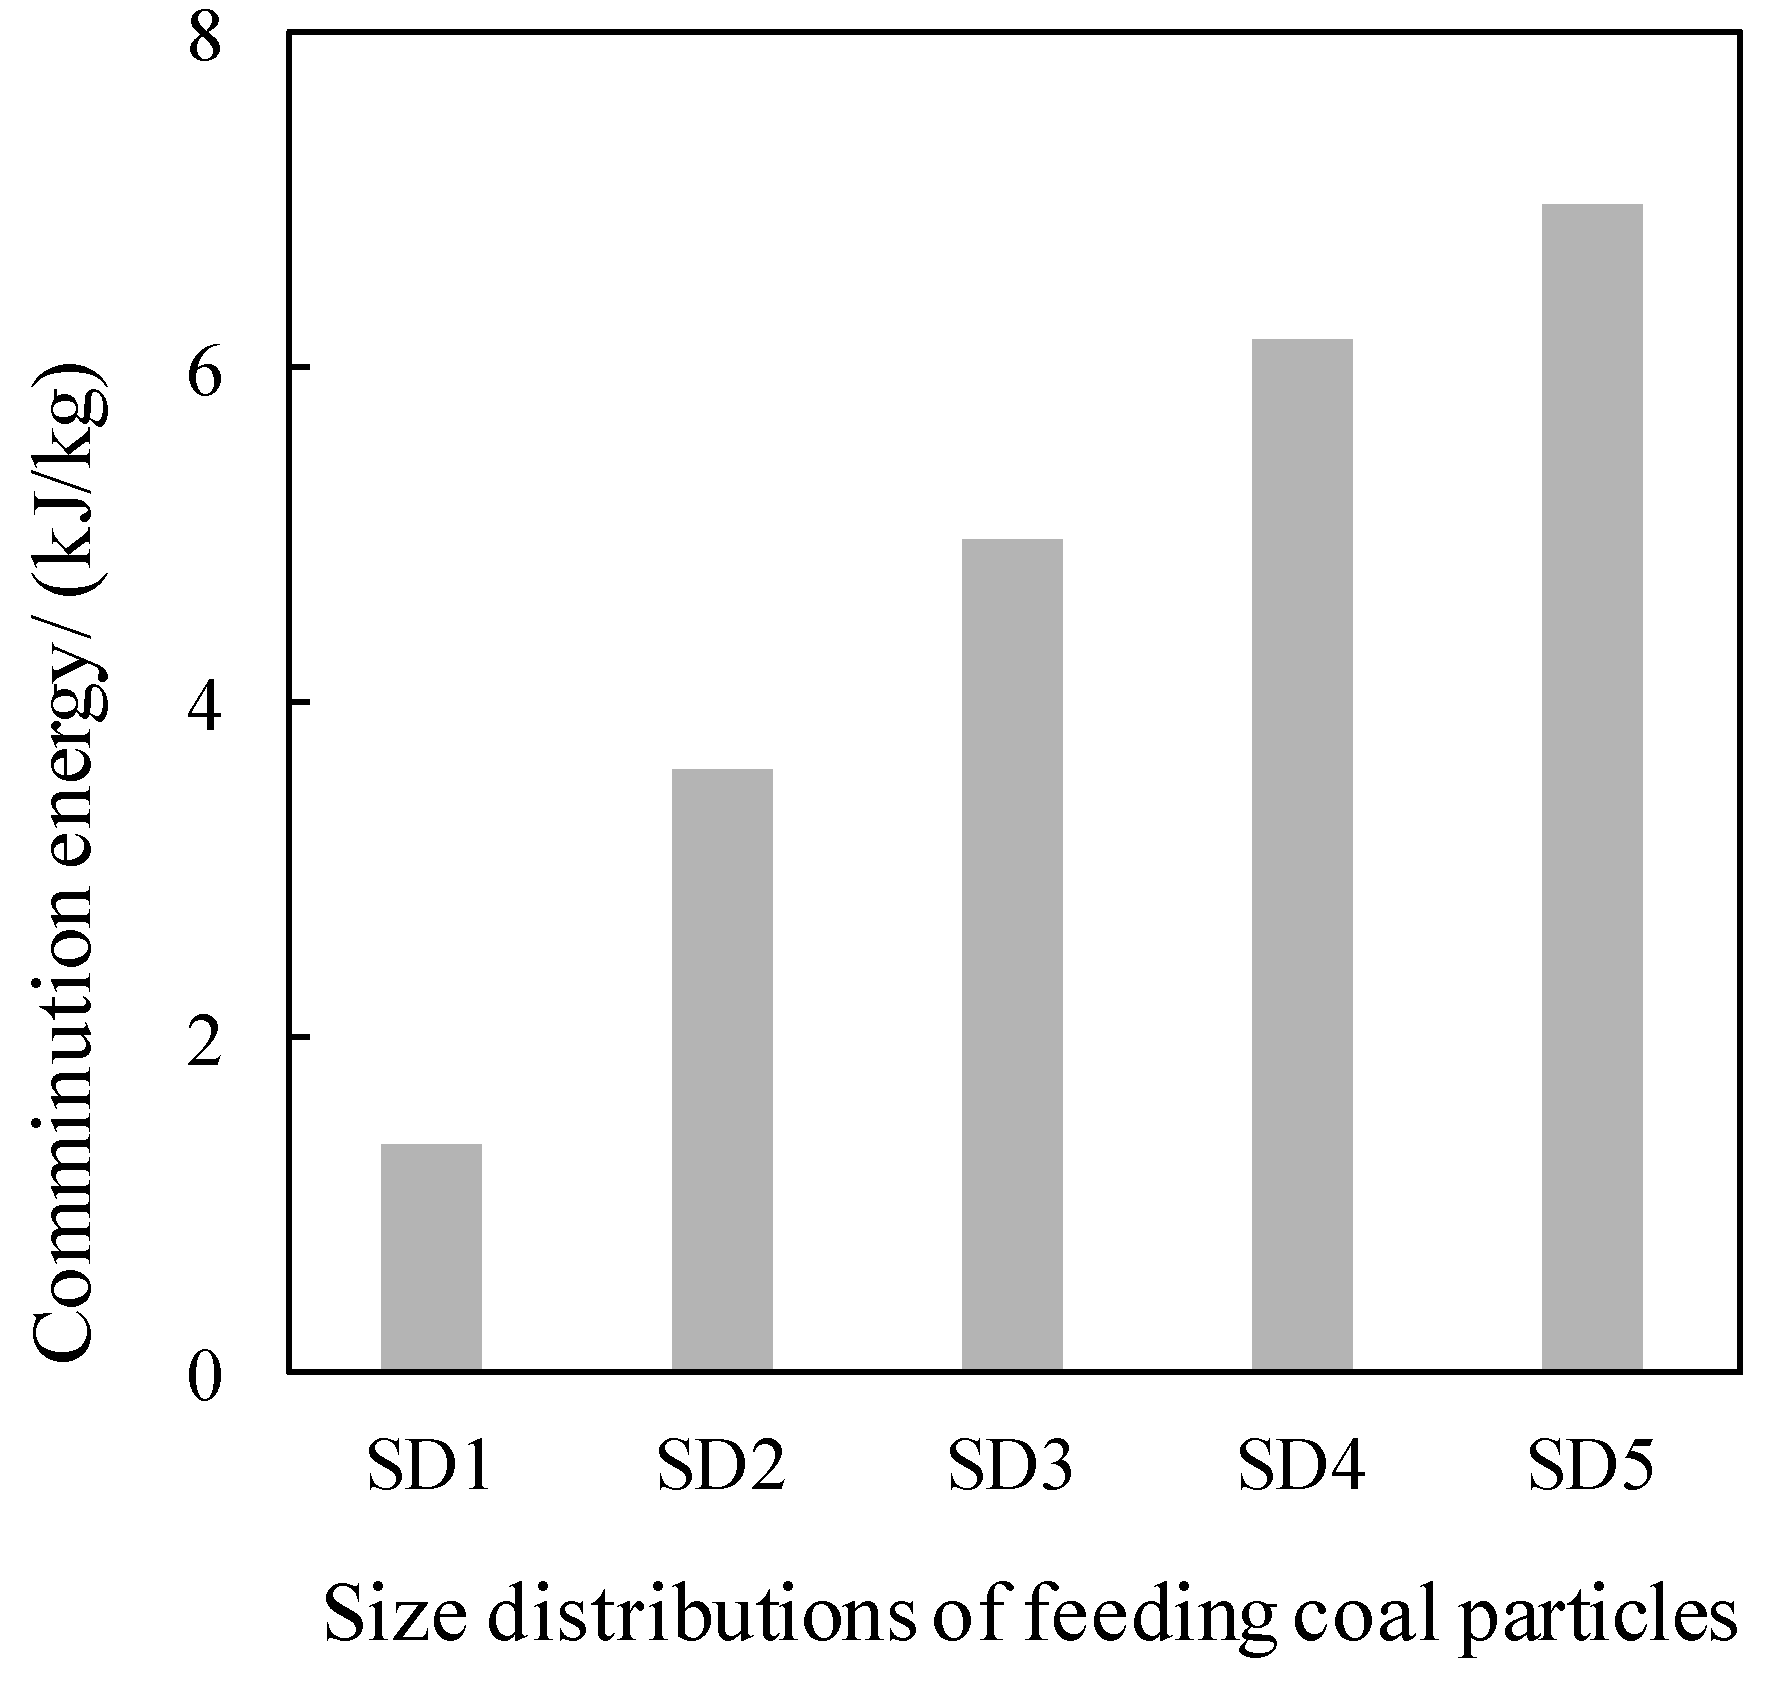
The HGI of the fed coal particles is 56. The change in comminution energy consumption with coal particle size can be calculated using the model described in Section 3, as shown in Figure 9. When the coal particle size distribution is gradually changed from SD1 to SD5, the mass fraction of fine particles is increased, leading to an increase in the required comminution energy consumption. The change in power consumption of the crusher with coal particle size distribution can be obtained.

4.1.2. Fan Power Consumption

With unchanged feeding coal amount and excess air ratio, the total amount of primary and secondary air is about a fixed value. If the ratio of primary and secondary air remains constant, the primary and secondary air volumes and air velocities are fixed values, respectively.
For primary air fan, the pressure head can be calculated as follows:
P PAF = Δ P bed + Δ P AD + Δ P PNR
where P PAF is the pressure head of the primary air fan, Δ P bed is the bed pressure drop, Δ P AD is the pressure drop of the air distribution plate, and Δ P PNR is the resistance of the pipe network.
The resistance of the air distribution plate is squared with the air velocity. At a certain primary air velocity, the pressure drop of the air distribution plate and the pipe network resistance are constant. Therefore, the change in bed pressure drop is the change in the fan pressure head.
For secondary air, the back pressure is determined by the solids concentration near the secondary air nozzles. As the bed pressure drop decreases, the secondary air back pressure decreases, and the downward trend becomes slower as the bed pressure drop decreases. It means that when the bed pressure drop is higher, the solids concentration in the transition zone decreases with the bed pressure drop more obviously, as shown in Figure 10, which is beneficial to the saving of fan power consumption.
The power consumption of the primary air fan or the secondary air fan can be calculated as follows:
N = P Q / η
where N is the fan power consumption, P is the fan pressure head, Q is the airflow, and η is the fan efficiency.

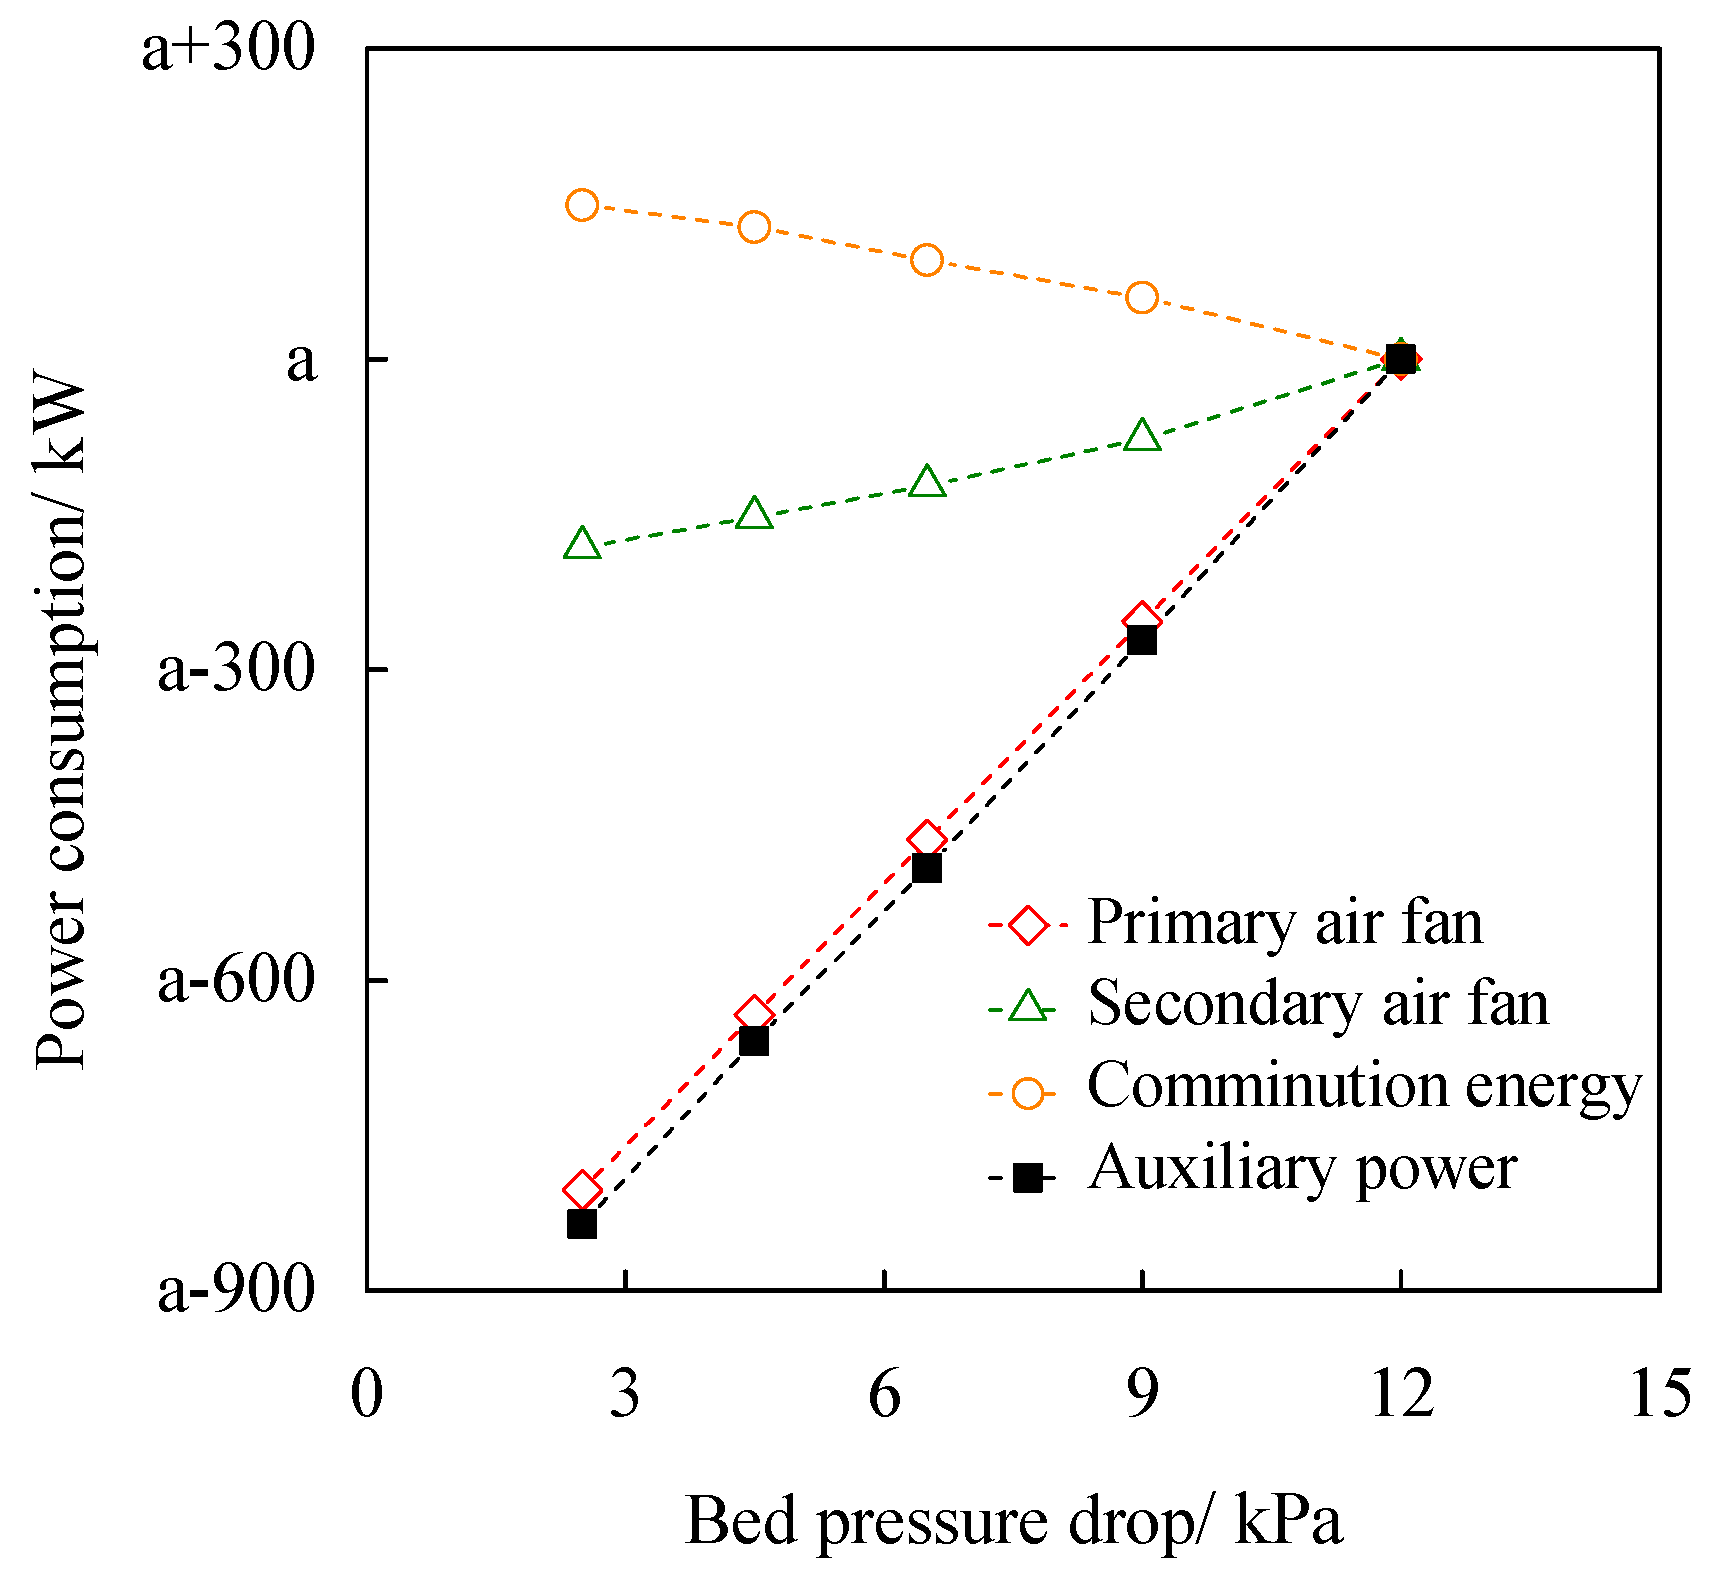
4.1.3. Auxiliary Power Consumption

Based on the calculation results of the power consumption of air fans and the comminution energy consumption, the auxiliary power consumption corresponding to different bed pressure drop and coal particle size distribution can be obtained, as shown in Figure 11. It can be seen that as the bed pressure drop decreases, the size of fed coal particles becomes finer, and the increase in comminution energy consumption is equivalent to the decrease in secondary air fan power consumption. The decrease in primary air fan power consumption is greater, resulting in a significant decrease in auxiliary power consumption. As the bed pressure drop was decreased from 12 kPa to 2.5 kPa, the auxiliary power consumption rate dropped by about 0.7%. Therefore, fluidization state optimization is beneficial to the saving of auxiliary power consumption.

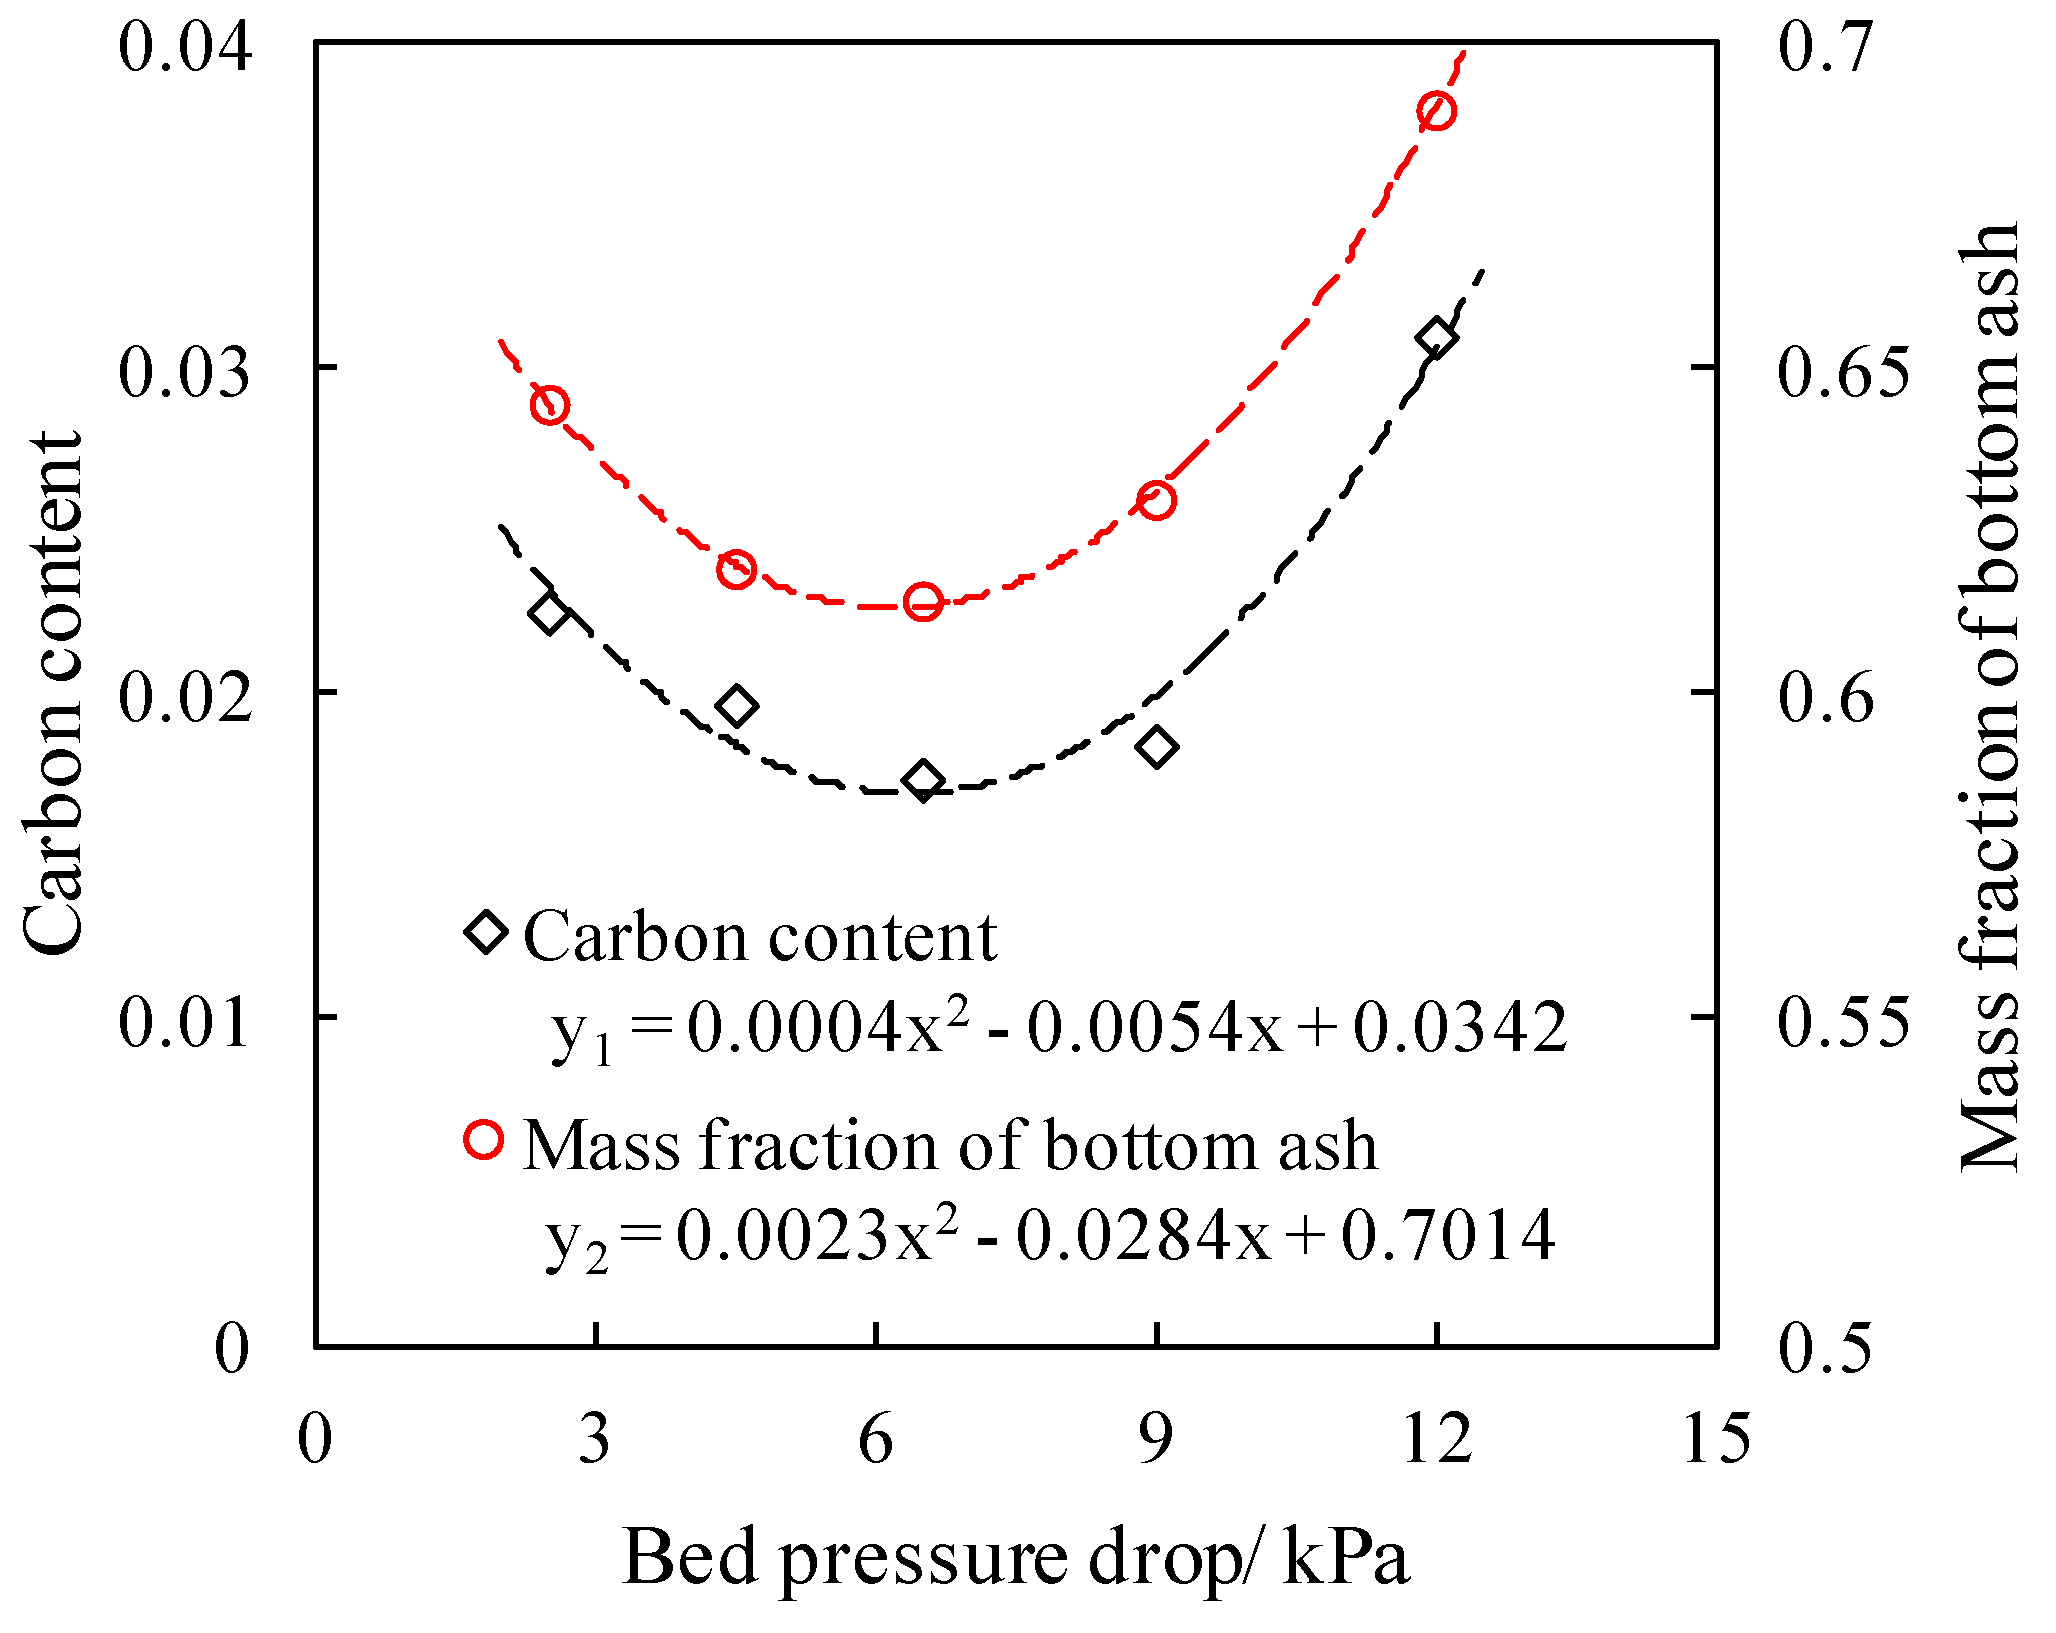
4.2. Effect of Fluidization State Optimization on Power Supply Cost

Fluidization state optimization can not only save the auxiliary power consumption but also affect the combustion efficiency, leading to a change in gross coal consumption. The mass fraction of bottom ash is affected by both the bed pressure drop and the coal particle size. With a certain coal particle size distribution, the mass fraction of bottom ash needs to be increased to achieve lower bed pressure drop, while if the bed pressure drop remains constant, the mass fraction of bottom ash decreases with coal particle size. Therefore, the mass fraction of bottom ash shows a non-monotonous trend during fluidization state optimization, as shown in Figure 12.
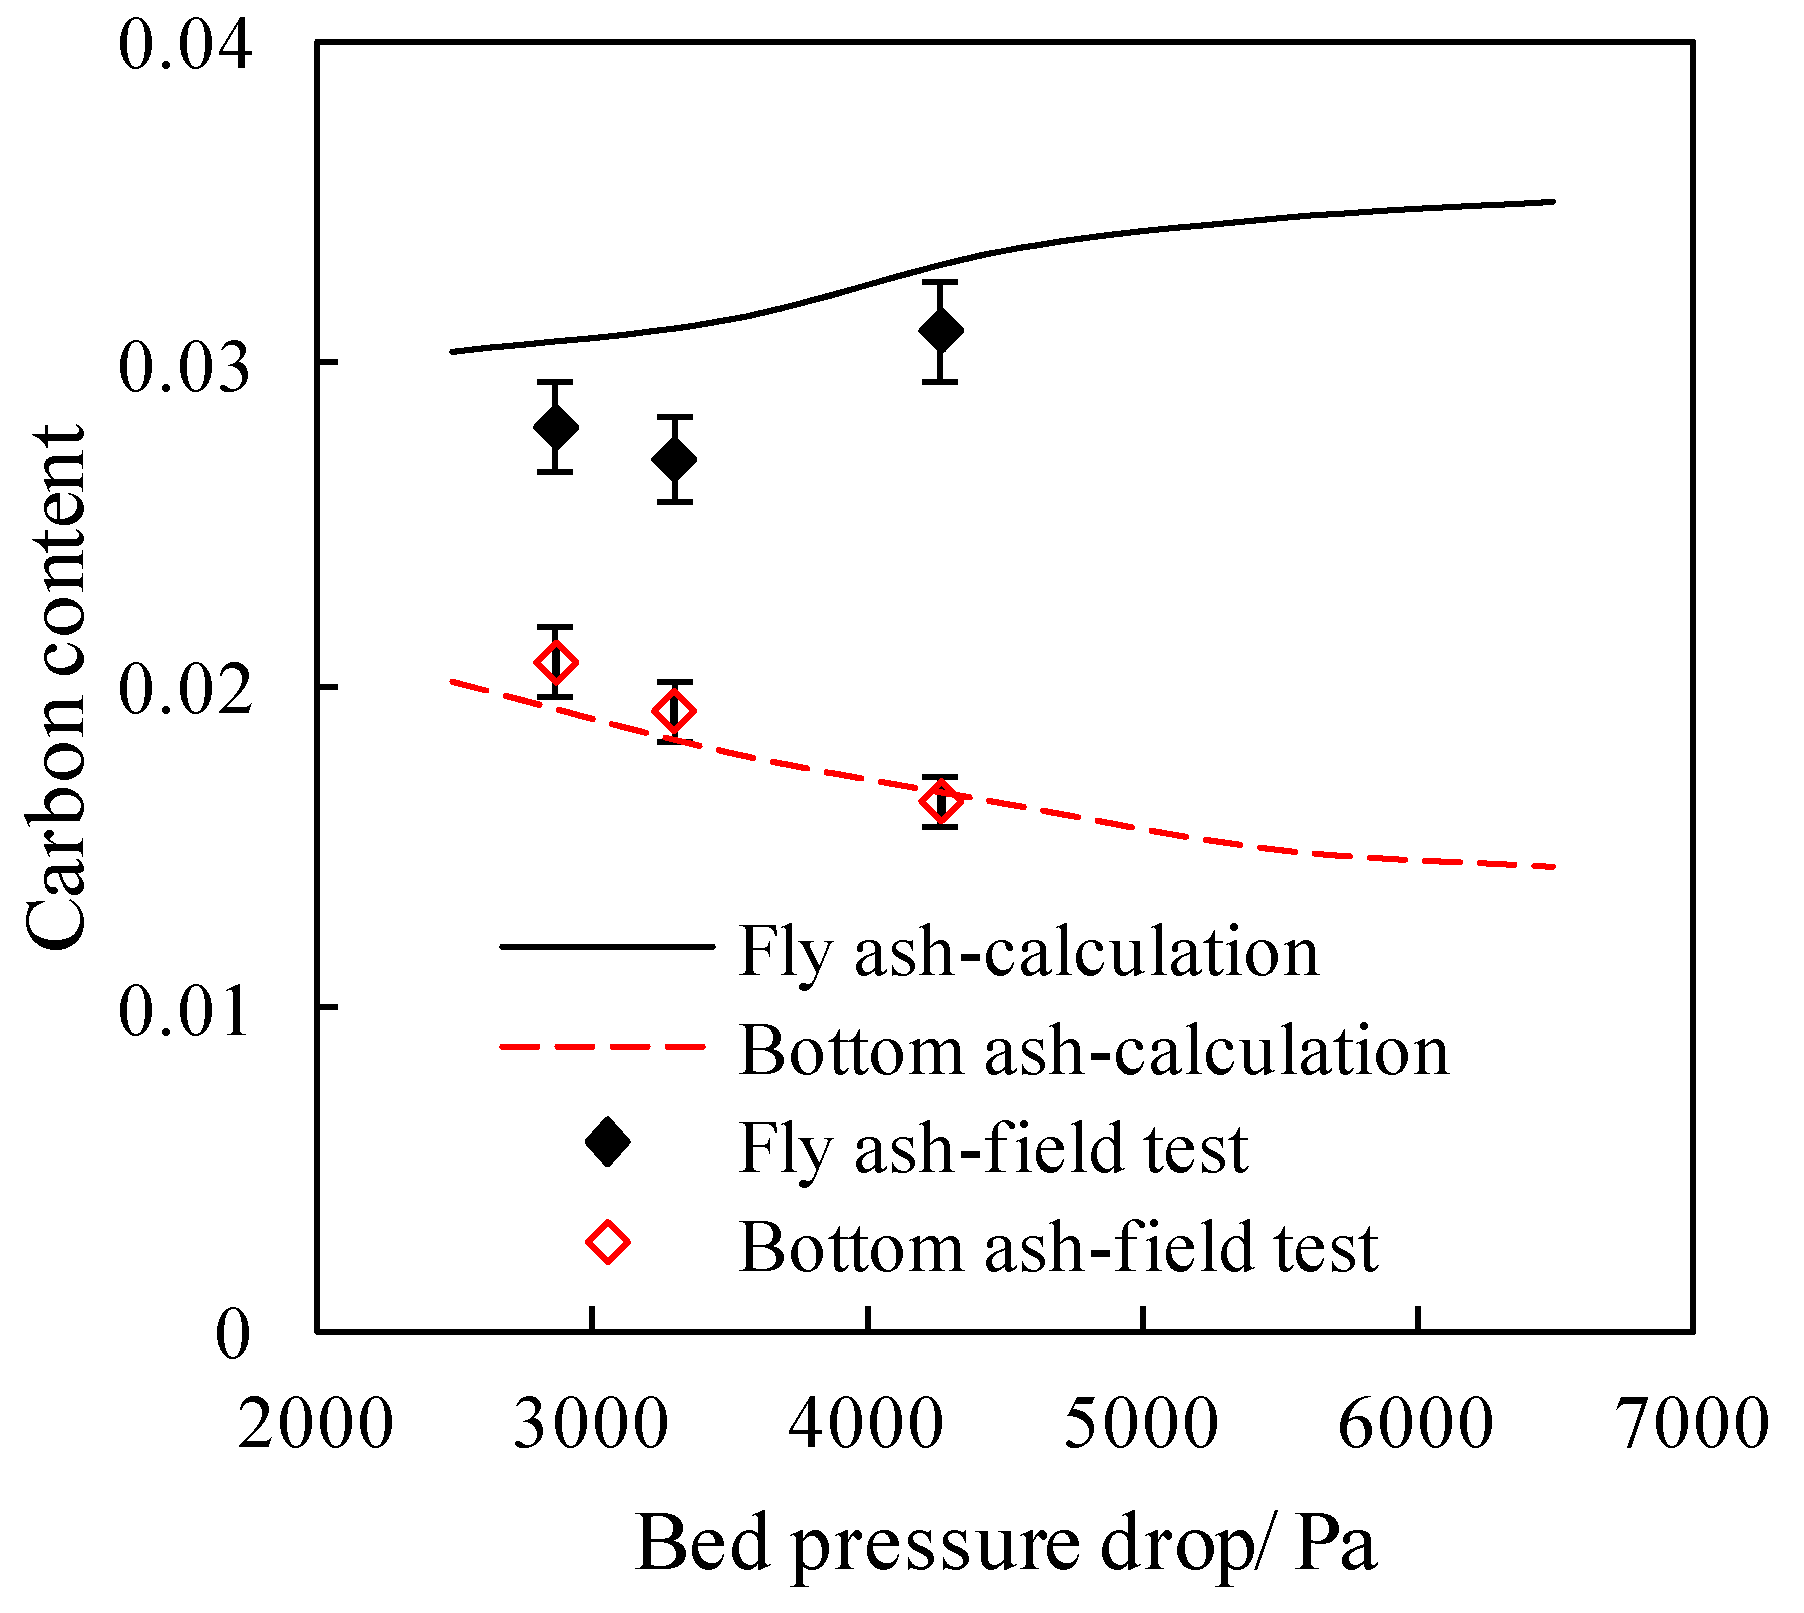
Combining the mass fraction of fly ash and bottom ash with carbon content, the average carbon content in residue can be calculated, which also decreases first and then increases as the bed pressure drop decreases, that is, when the bed pressure drop decreases to a certain extent, even if the secondary air penetration improvement is beneficial to oxygen mixing and diffusion, the average carbon content increases due to insufficient residence time. Accordingly, the combustion efficiency decreases.
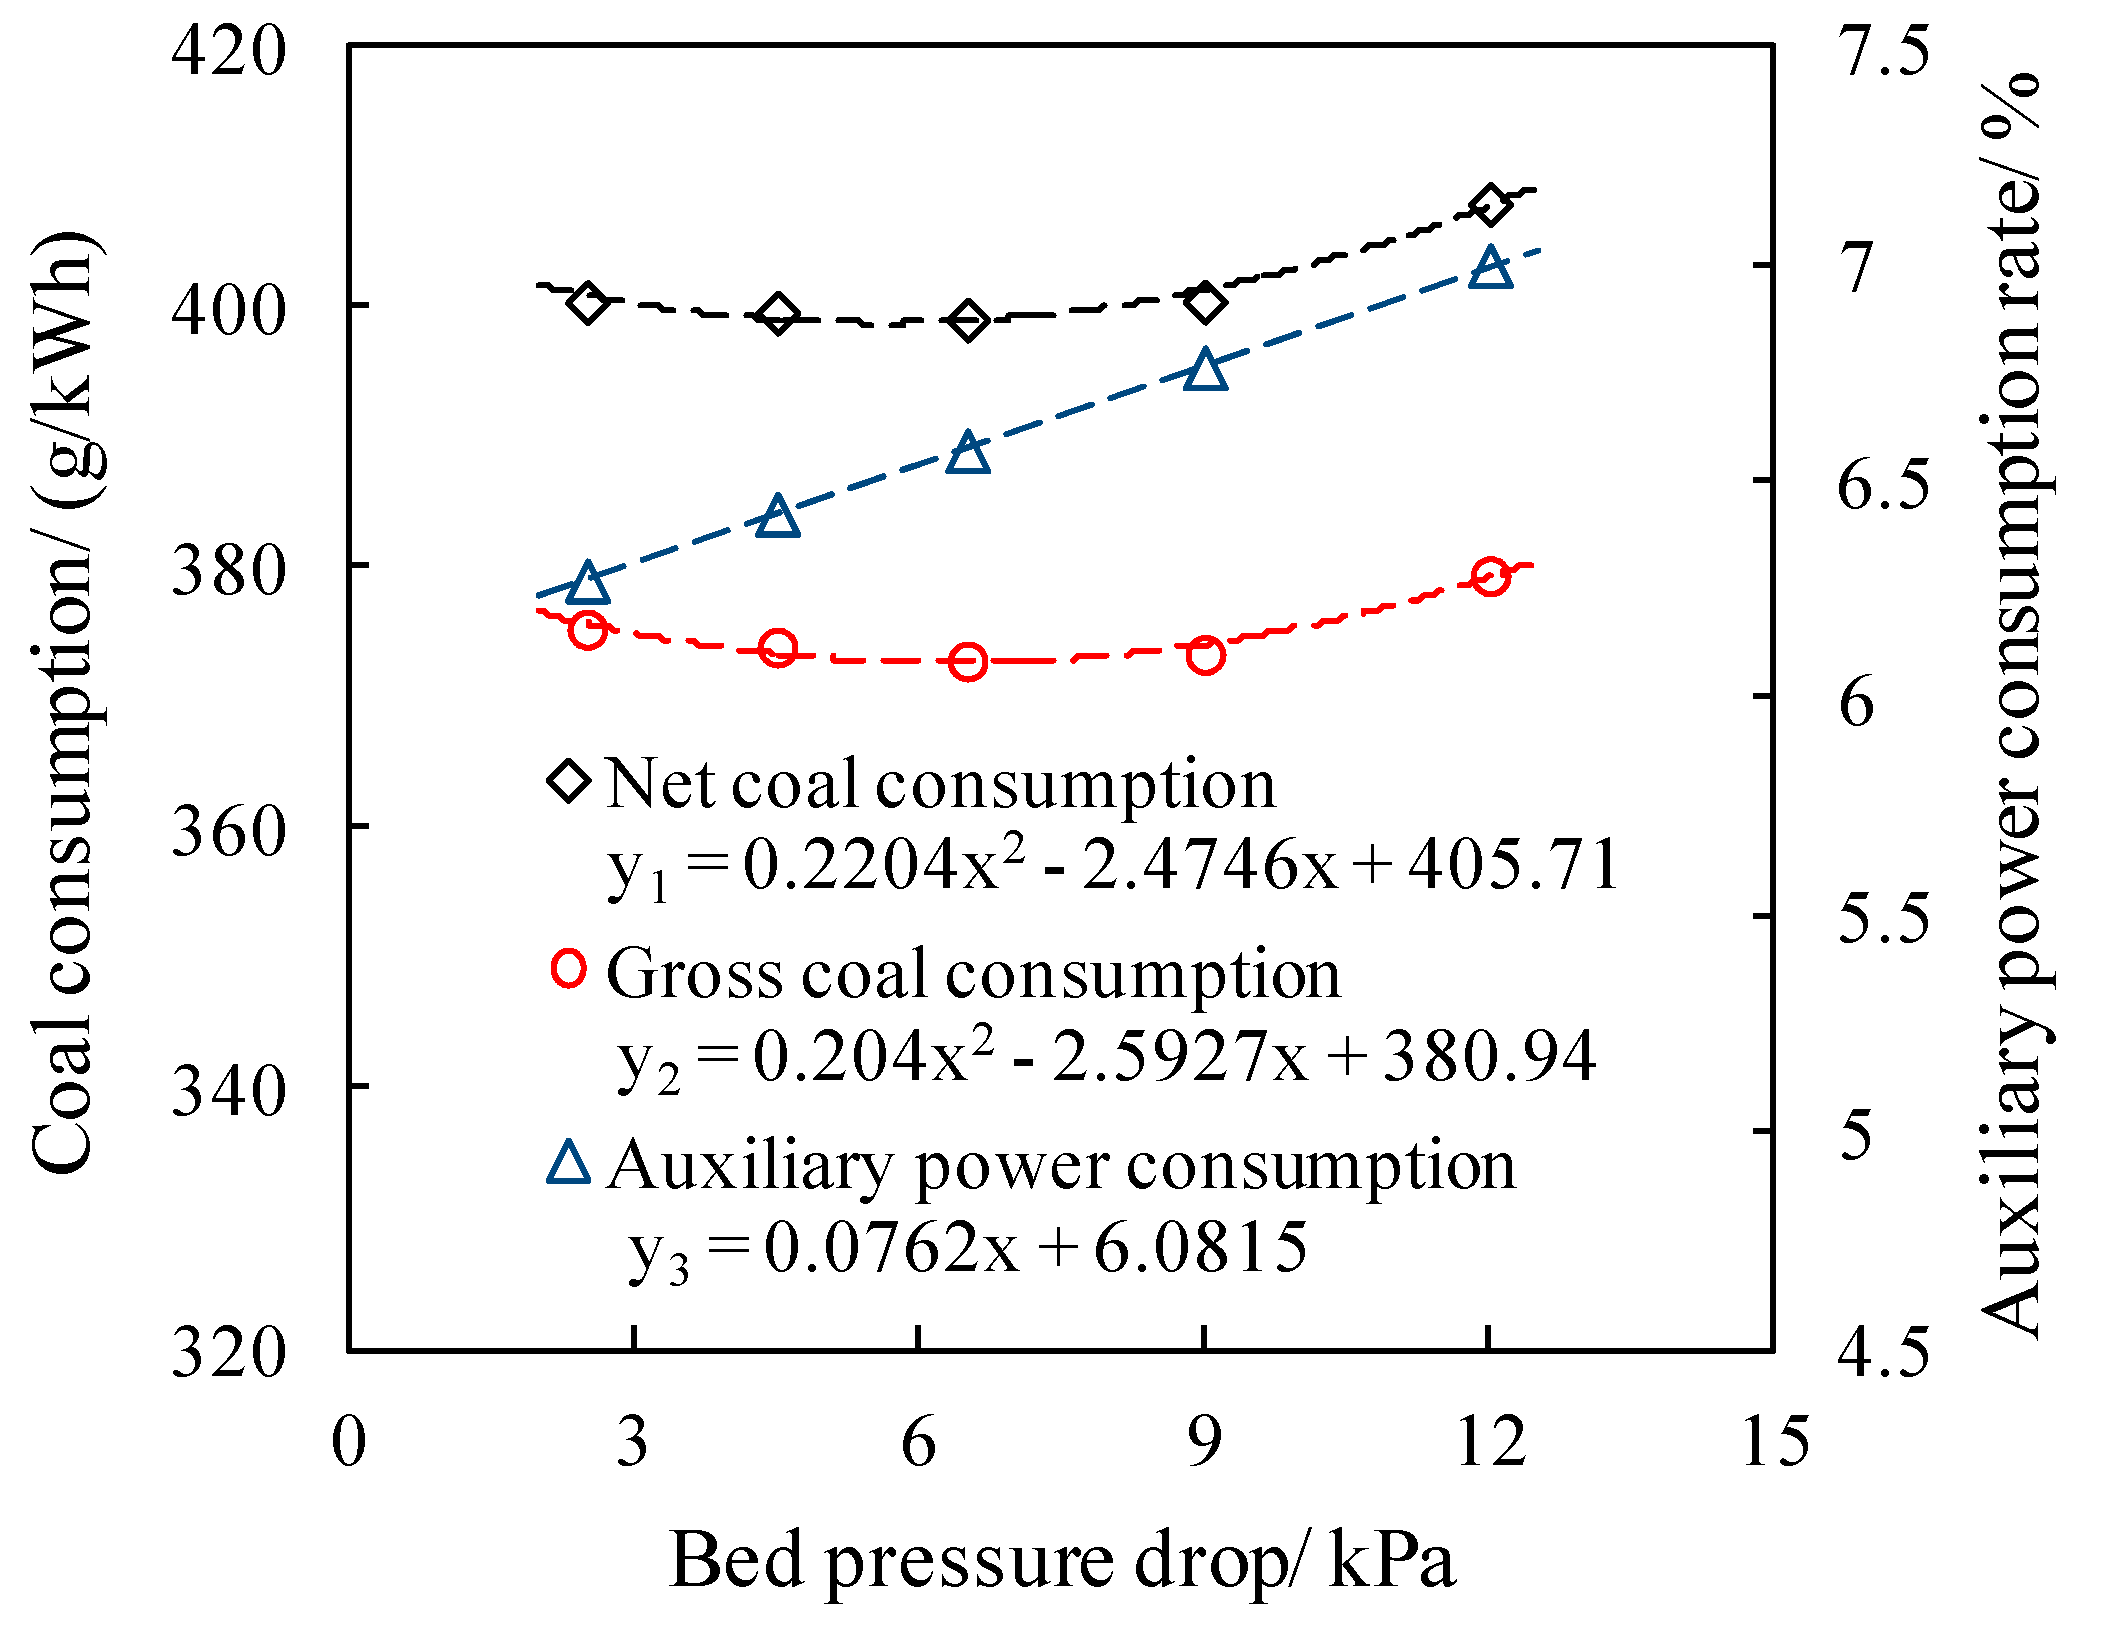
Based on the change in combustion efficiency, the change in gross coal consumption with bed pressure drop and coal particle size can be further calculated. Combined with the auxiliary power consumption, the change in net coal consumption can be obtained, as shown in Figure 13. The lower the carbon content in the residue is, the higher the combustion efficiency is, and the lower the gross coal consumption is. Therefore, the gross coal consumption also decreases first and then increases with the decrease in bed pressure drop, and the net coal consumption is similar. The auxiliary power consumption rate tends to decrease monotonously with the decrease in bed pressure drop. Hence, in the stage where the gross coal consumption decreases with the bed pressure drop, the decrease in net coal consumption is more obvious. When the gross coal consumption increases with the decrease in bed pressure drop, that is, in the stage of lower bed pressure drop, the increase in net coal consumption is slightly smaller than the gross coal consumption, due to the saving of auxiliary power consumption. The optimal bed pressure drop corresponding to the lowest net coal consumption is slightly lower than the optimal bed pressure drop corresponding to the lowest gross coal consumption, which is about 6 kPa and 6.5 kPa, respectively.

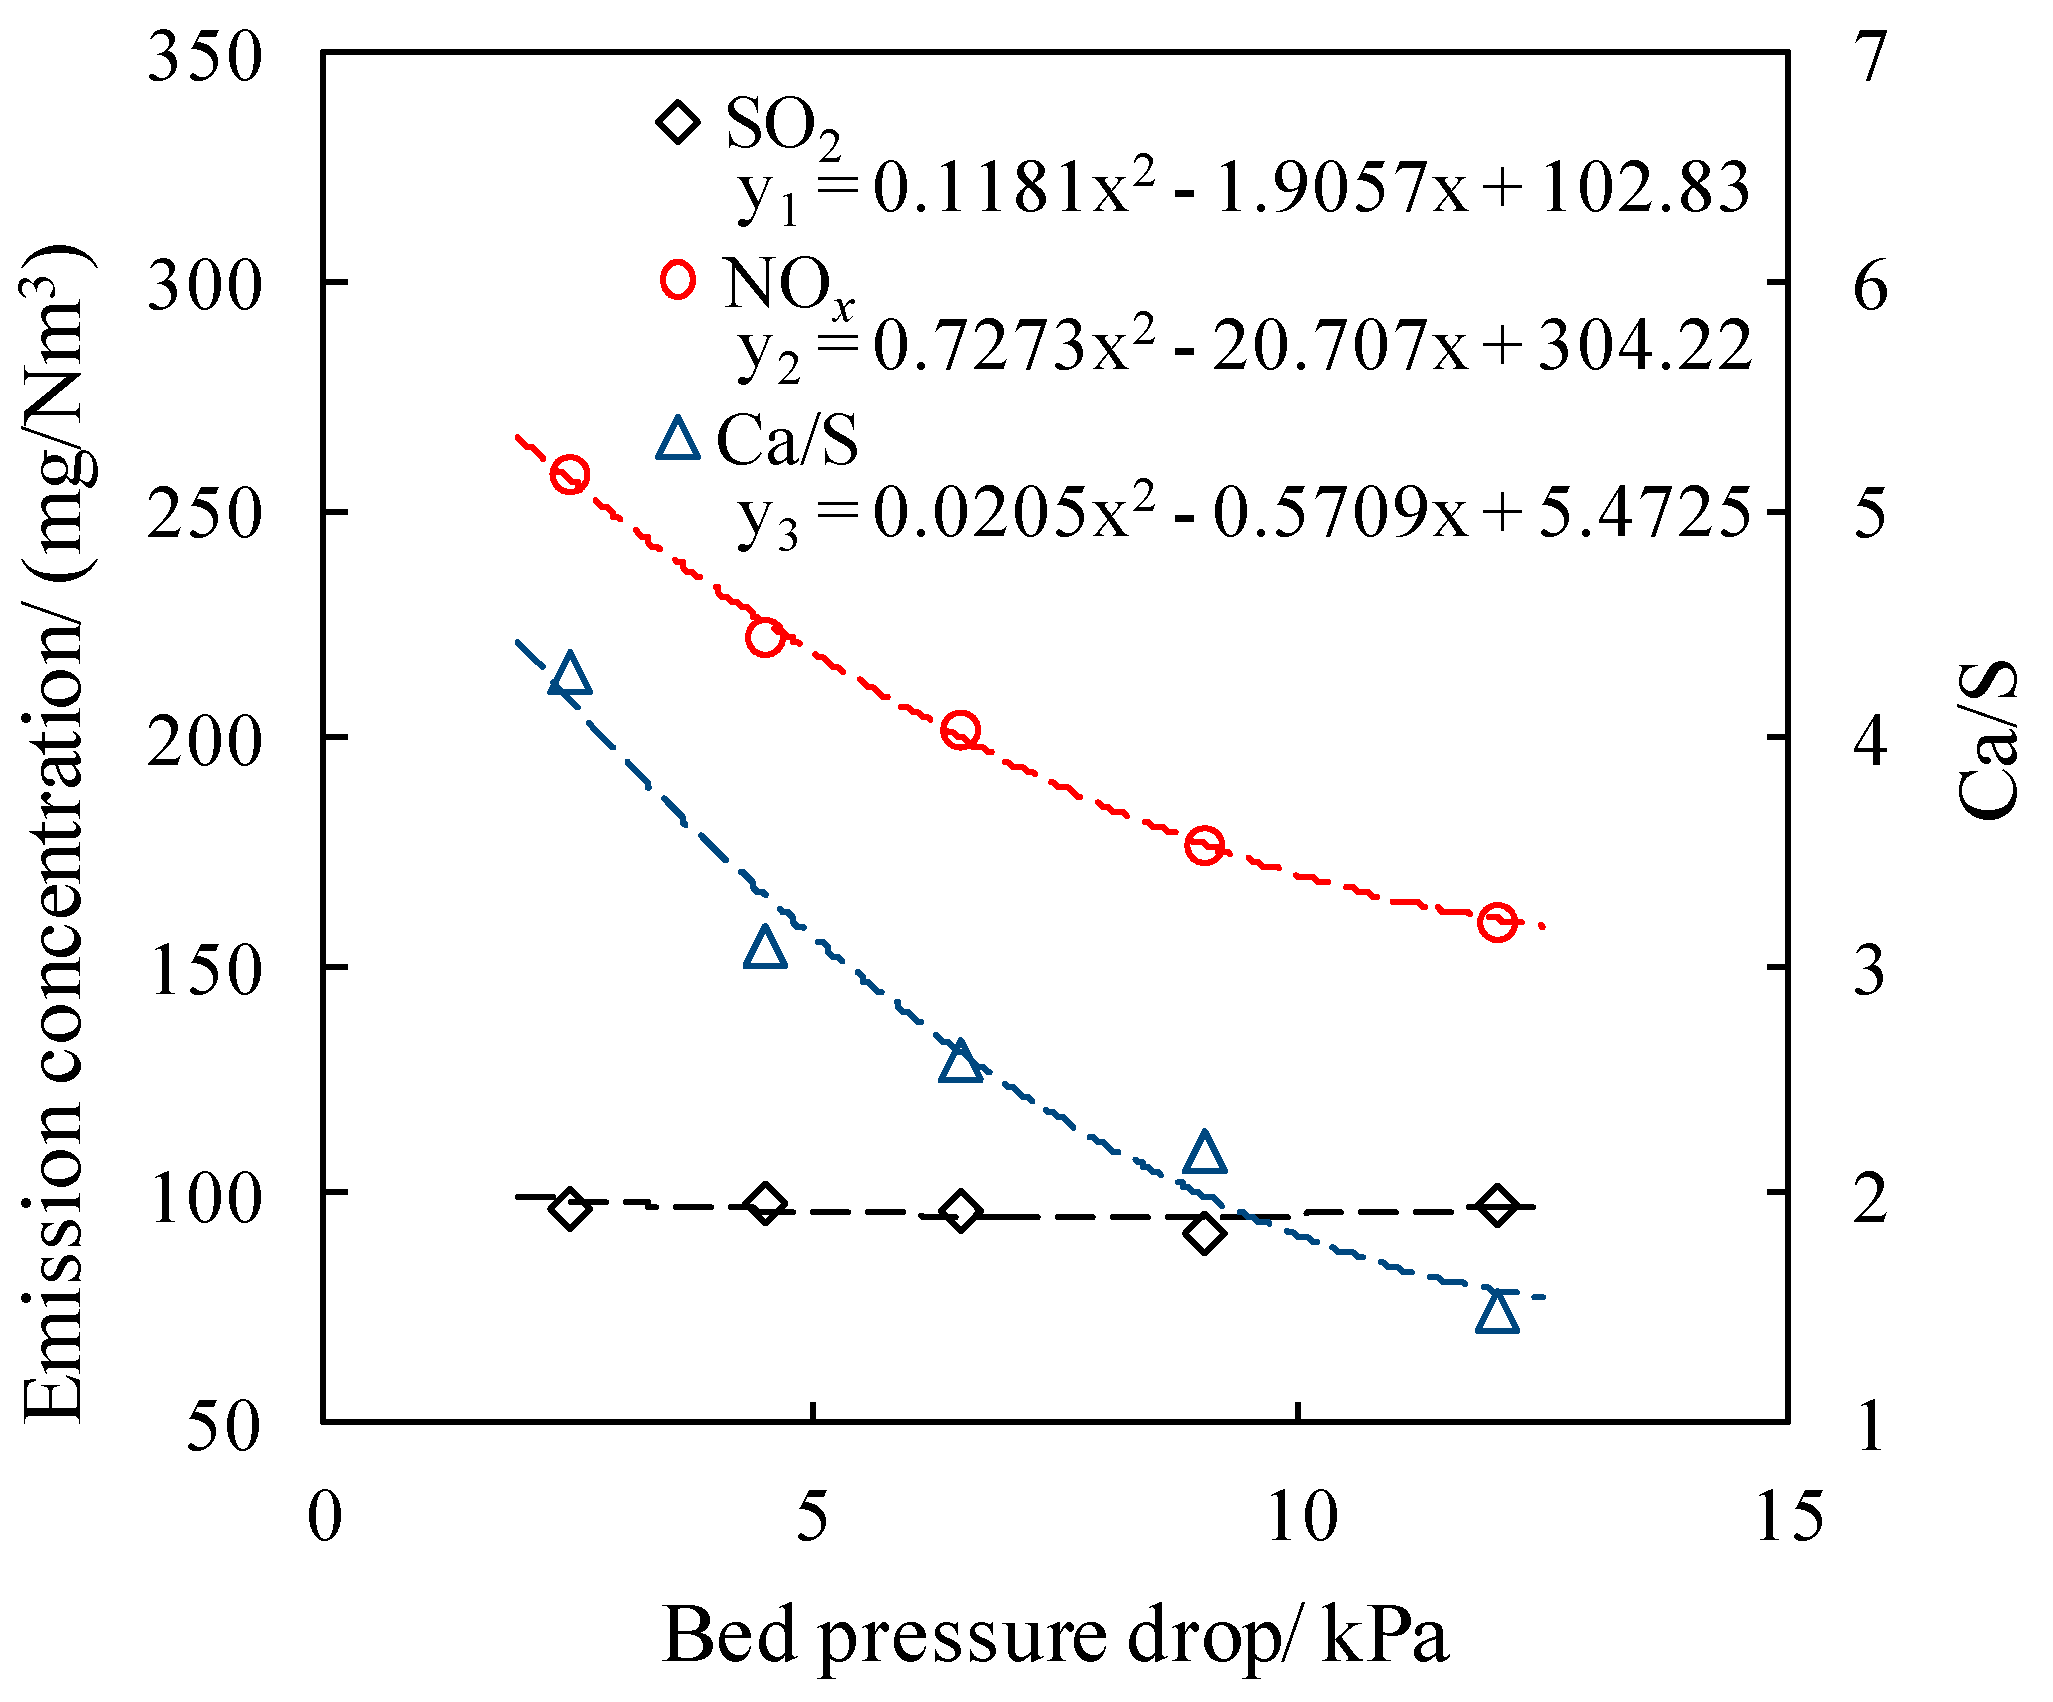
4.3. Effect of Fluidization State Optimization on SO2 and NOx Emission

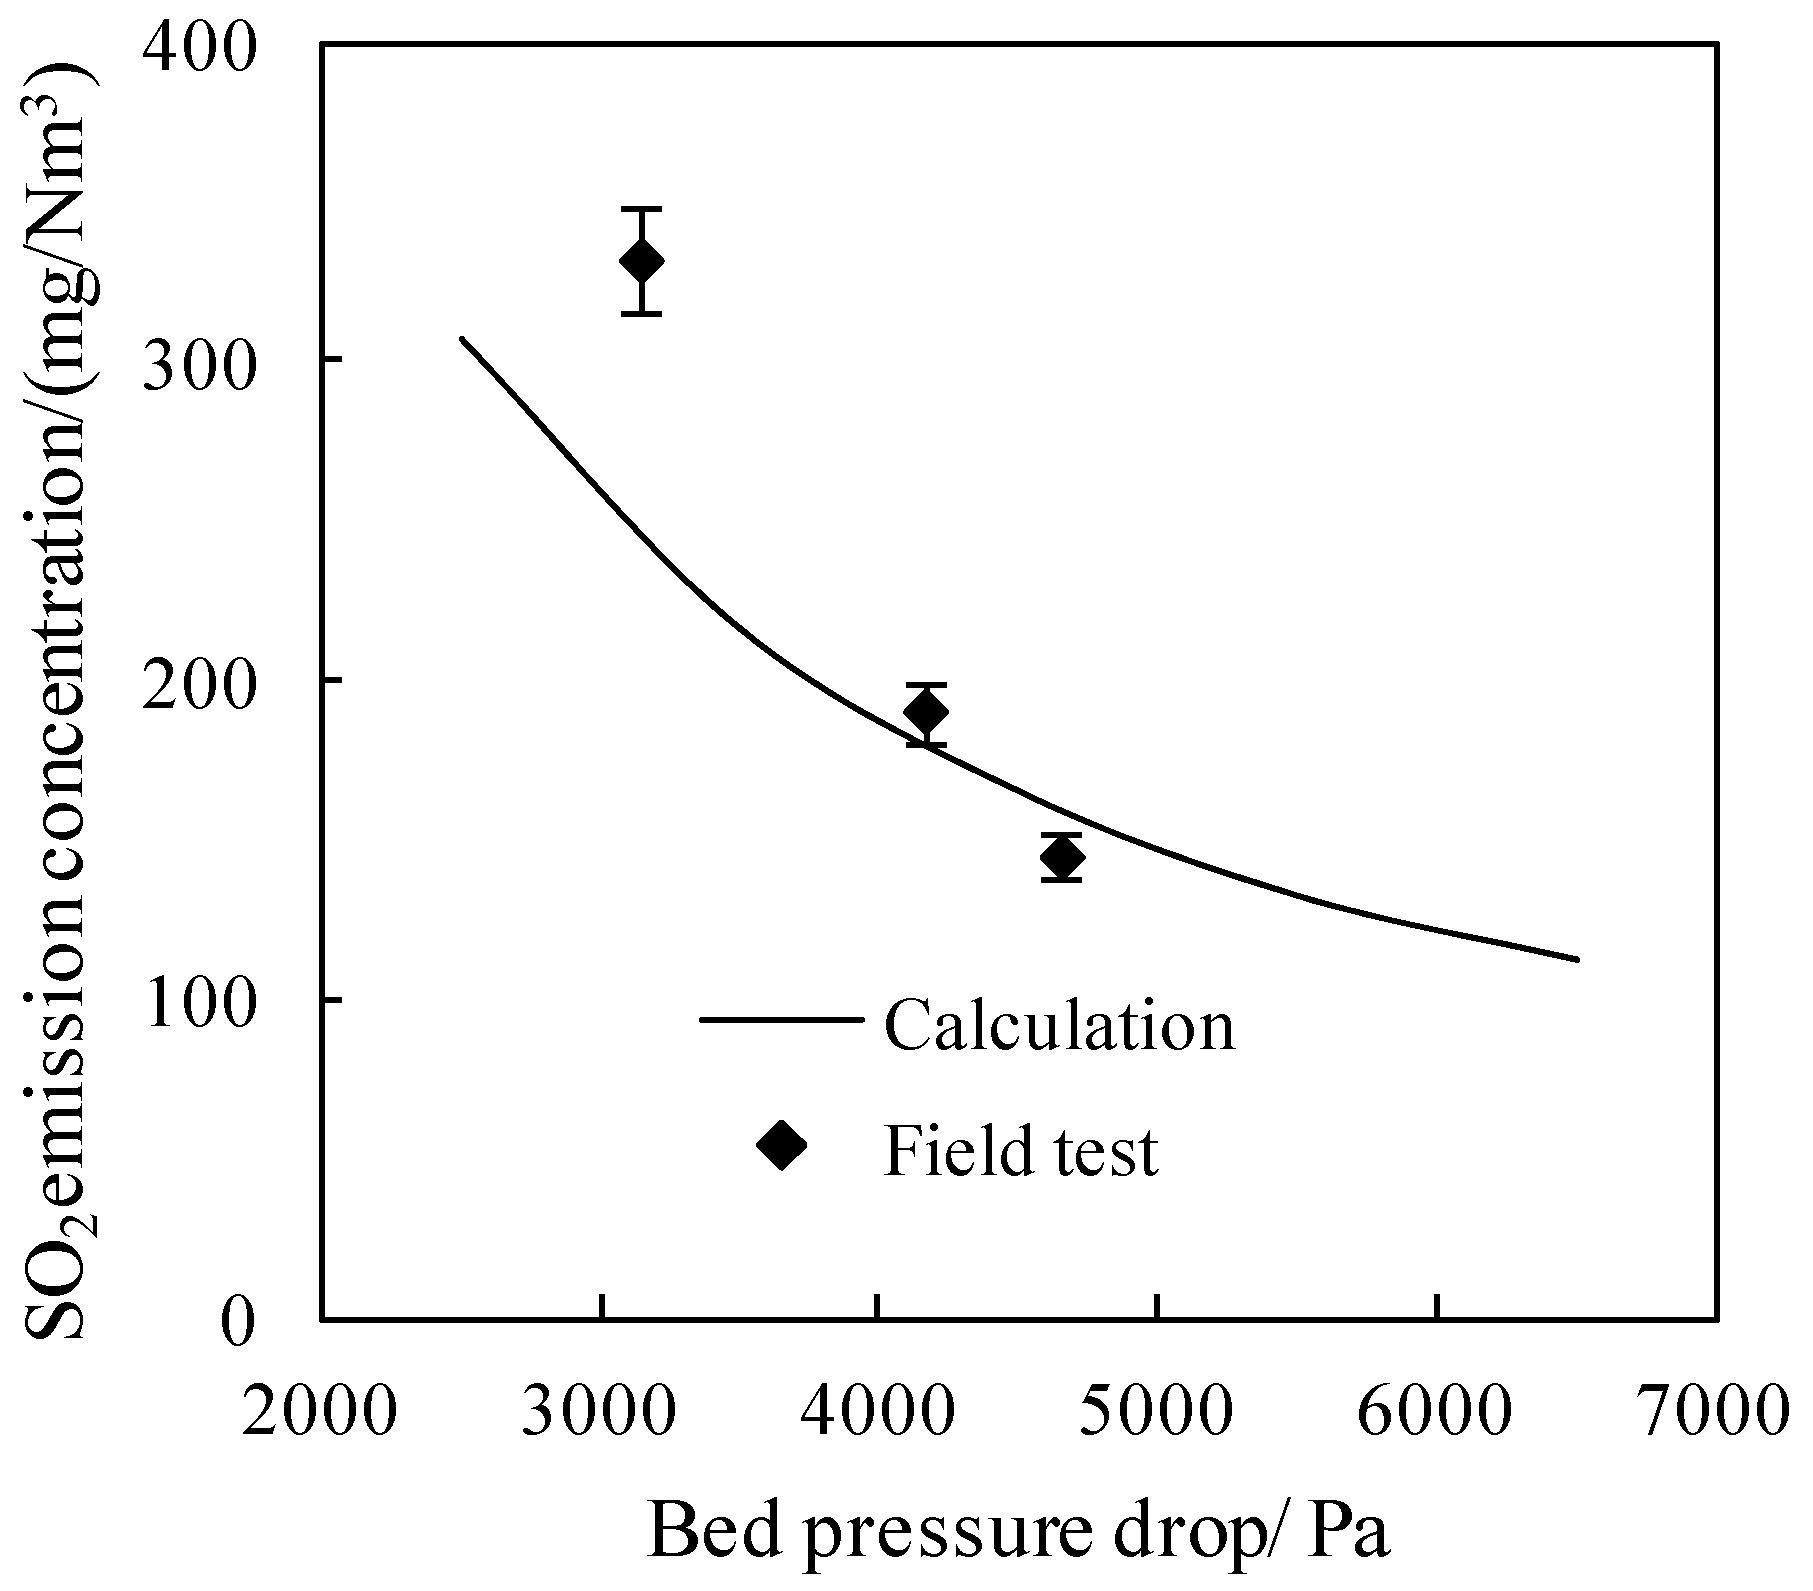
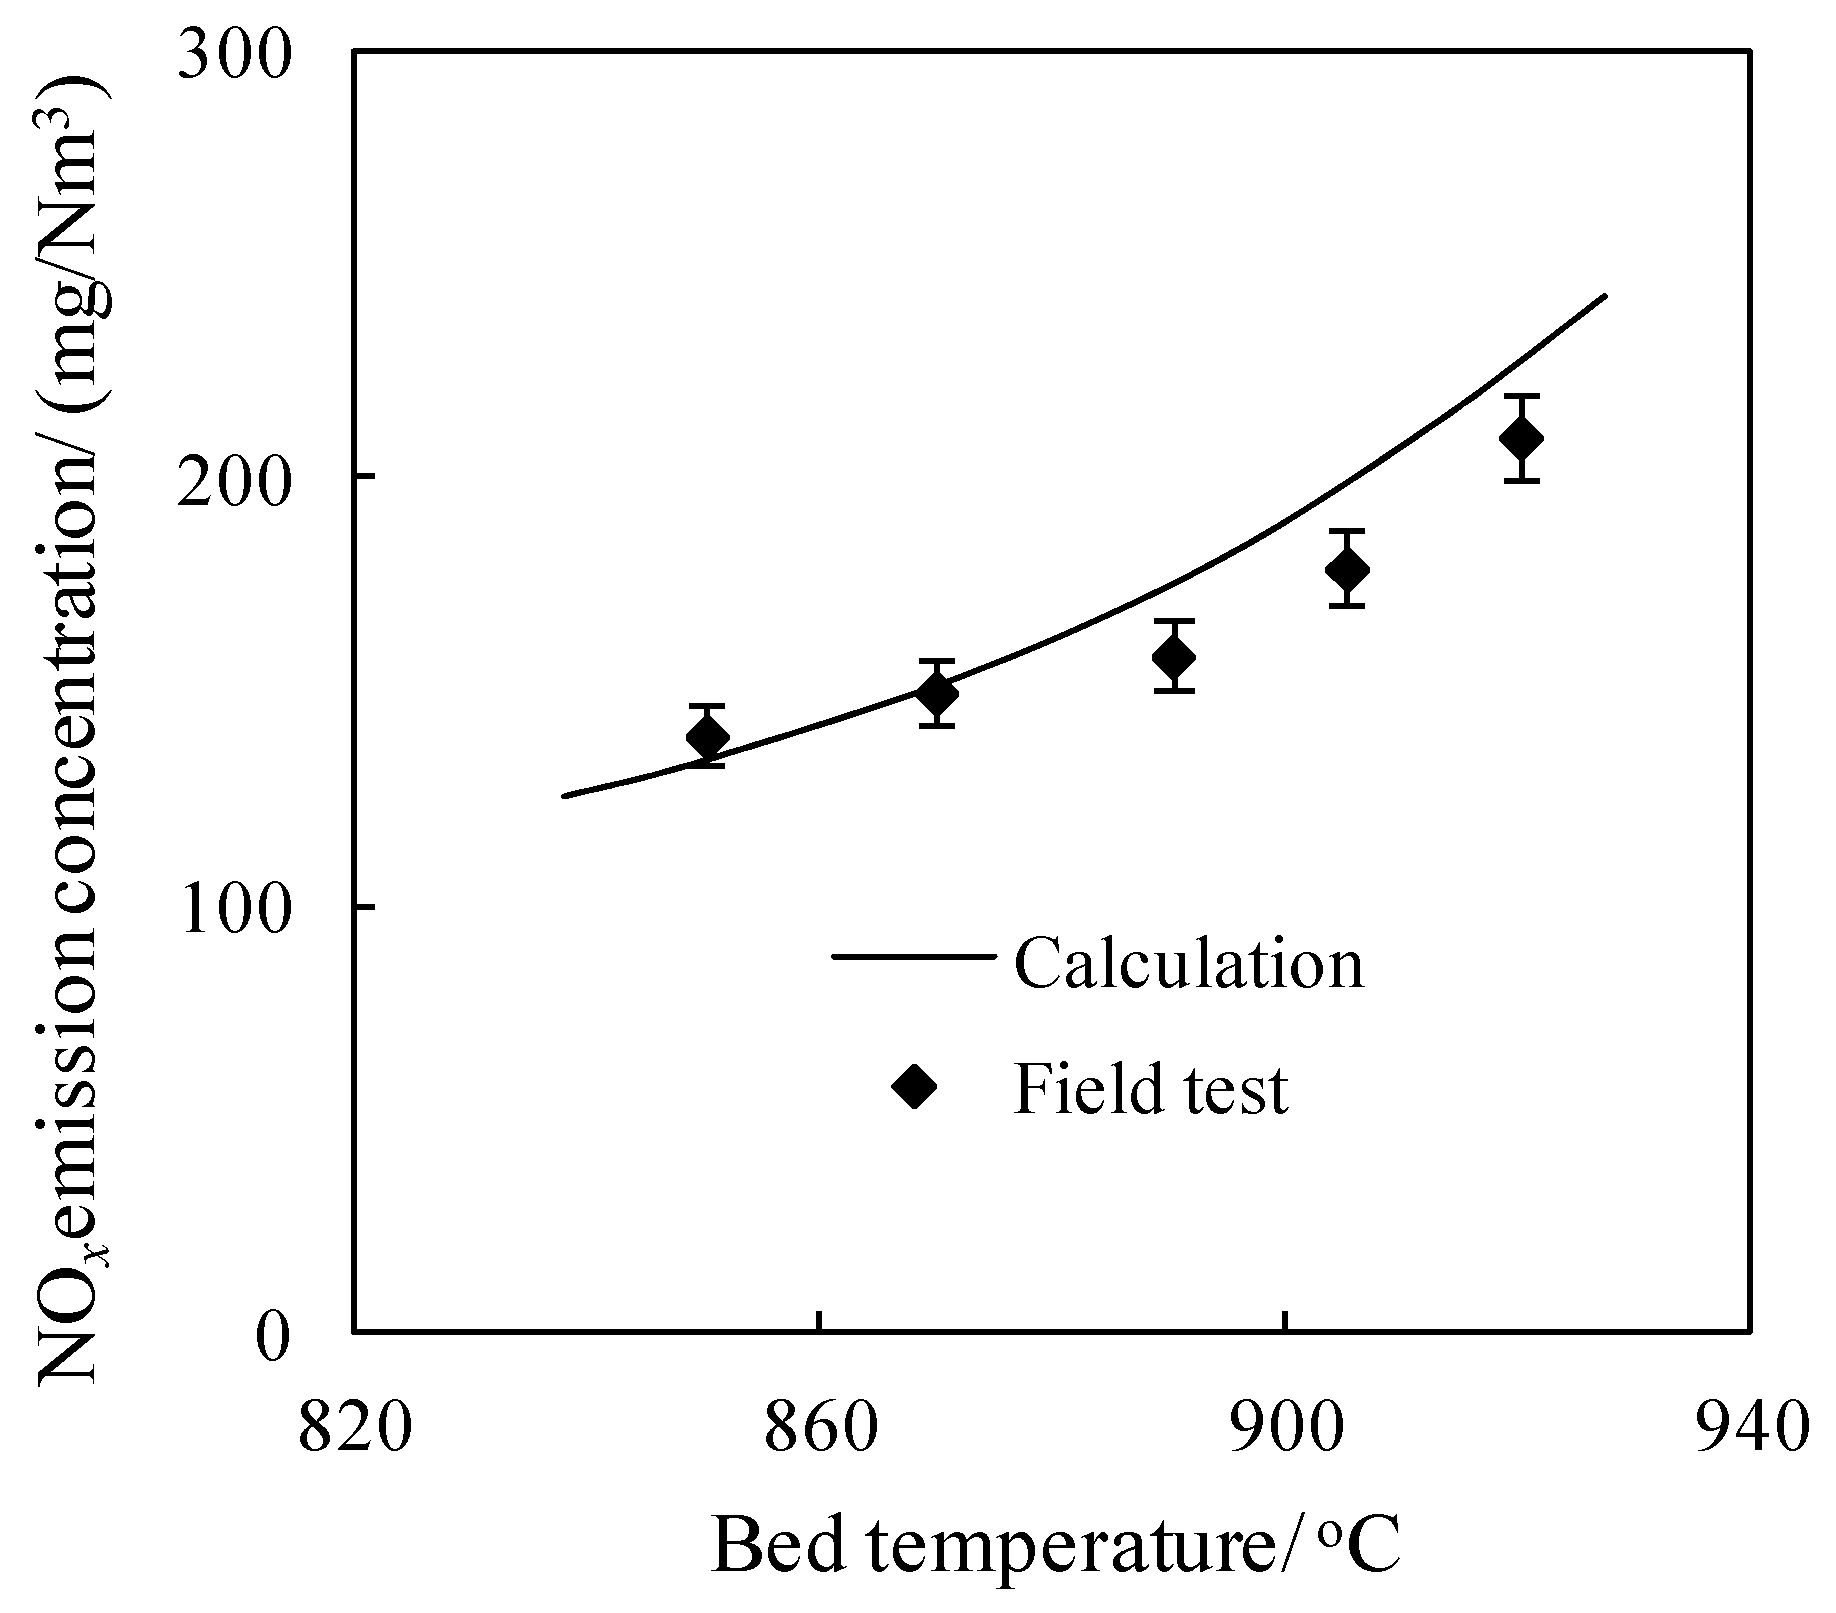
With certain Ca/S, the SO2 emission concentration mainly depends on the residence time of CaO particles. Therefore, as the bed pressure drop decreases, the SO2 emission concentration increases rapidly. The NOx emission is mainly affected by the bed pressure drop and coal particle size. As the bed pressure drop decreases, the NOx emission concentration shows a trend of decreasing first and then increasing.
To meet the emission requirements stipulated by environmental protection standards, SO2 and NOx should be removed to below 100 mg/m3. SO2 can be removed below 100 mg/m3 by increasing Ca/S. But the change in Ca/S also affects NOx emission. Previous studies have shown that CaO has a significant promotion effect on NO formation. Therefore, as Ca/S increases, the NOx emission concentration increases. The required Ca/S and corresponding NOx concentrations are shown in Figure 14. It can be seen that as the bed pressure drop decreases, the required Ca/S increases rapidly for the same SO2 emission target of 100 mg/m3, which not only increases the desulfurization cost but also adversely affects NOx emission. Therefore, if only the pollutant control is considered, it is not advantageous to achieve lower bed pressure drop operation only by reducing the coal particle size. It is necessary to supplement other means at the same time, such as increasing the secondary air ratio and injection position, which will be beneficial to NOx emission reduction. With certain Ca/S, optimization of the particle size distribution of limestone can improve the utilization rate, reduce the SO2 emission concentration, and avoid NOx emission concentration excessively increasing caused by excessive Ca/S. The above means provide the possibility of achieving ultra-low emission, which will be analyzed in future work.

4.4. Effect of Fluidization State Optimization on Economical Operation

Based on the analysis in Section 4.2, the net coal consumption under different bed pressure drop and coal particle size distribution can be calculated, combined with the change in pollutant control cost, the gross cost change can be obtained.
SO2 is removed by adding limestone to the furnace. The calculation method of limestone consumption is as follows [33]:
m CaO = m coal × S × Ca / S × 56 / 32 / 48 %
where mcoal is the net coal consumption, S is the sulfur content in coal, 32 and 56 are the molar masses of S and CaO, respectively, and 48% is the mass fraction of CaO in limestone. The unit price of limestone was calculated at 80 yuan/t.
NOx is controlled by the selective noncatalytic reduction (SNCR) method. Urea will decompose or hydrolyze to form NH3 after being injected into the furnace [34]:
CO ( NH 2 ) 2 + H 2 O 2 NH 3 + CO 2 CO ( NH 2 ) 2 NH 3 + HNCO
m CO ( NH 2 ) 2 = m NO / 30 × ( n ( NH 3 ) / n ( NO x ) ) / 2 × 60
where mNO is NO mass in flue gas, n ( NH 3 ) / n ( NO x ) can be calculated at 1.5, 30, and 60 are the molar masses of NO and urea, respectively. The unit price of urea was calculated at 2.2 yuan/kg [35].
The gross costs of power supply corresponding to different bed pressure drop, and coal particle size distribution are shown in Figure 15. It can be seen that the gross cost decreases first and then increases as the bed pressure drop decreases, and the optimal bed pressure drop is about 7 kPa. It means that when the bed pressure drop is higher than 7 kPa, decreasing bed pressure drop by adjusting coal particle size can save the power supply cost.

4.5. Effect of Separator Efficiency

The above analysis is based on the condition that the existing boiler is not retrofitted, and the fluidization state optimization is achieved only by adjusting the coal particle size distribution. The fluidization state re-specification was proposed based on the improvement of the separator efficiency, which is the most crucial factor affecting the bed material quality. For the fluidization state re-specification, the separator efficiency should be improved first, so that more benefits can be obtained.
Four separators with different efficiency were analyzed, as shown in Table 5. For different working conditions, the bed pressure drop was kept at 4.5 kPa, and the coal particle size distribution was SD4.
The calculation results are shown in Figure 16. With a certain bed pressure drop and coal particle size distribution, improving the separator efficiency will increase the storage of fine particles and the circulation flow rate. The mass fraction of fine particles leaving the furnace in the form of fly ash decreases, while the mass fraction of bottom ash increases. The carbon content in residue decreases, and the combustion efficiency increases.
At the same time, improving the separator efficiency is also beneficial to the reduction of SO2 and NOx emissions, as shown in Figure 17, because as the separator efficiency increases, the residence time of CaO particles increases, resulting in a decrease in SO2 emission. The solids concentration in the upper furnace increases, reducing atmosphere enhances accordingly, which is beneficial to NO reduction.
To guarantee the heat transfer characteristics, the solids concentration in the upper furnace should be kept constant. By improving the separator efficiency, the circulation flow rate can remain unchanged under a lower bed pressure drop. It means that the bed material quality can be improved without adjusting coal particle size distribution. Lower bed pressure drop can be achieved, and combustion efficiency can be increased.
For the coal particle size distribution SD2, the bed pressure drop, and the corresponding carbon content in fly ash and bottom ash achieved by different separator efficiency are shown in Figure 18. When d50 is decreased from 30 μm to 15 μm, the bed pressure drop can be reduced from 9 kPa to 5.5 kPa without adjusting the coal particle size. At this time, because the comminution energy consumption has not increased, the saving of the auxiliary power consumption will be more significant. Due to the increase in separator efficiency, the pollutant emission will also be improved. The fluidization state optimization under this condition will be more beneficial to the economical operation of CFB boilers.
From the above analysis, for CFB boilers, the key of fluidization state re-specification or optimization is to improve the bed material quality and so that the boiler can be operated stably under lower bed pressure drop conditions. The separator efficiency has a decisive influence on bed material quality, so the improvement in separator efficiency will bring a wider implementation space and more significant economic benefits for fluidization state optimization. However, for the existing units, under the premise that the separator efficiency is difficult to improve, the bed material quality can also be improved by adjusting the coal particle size distribution. Through model calculation and analysis, the optimal bed pressure drop and the corresponding coal particle size distribution can be suggested for different boilers, coal types, and loads.

5. Conclusions

Taking a 480 t/h CFB boiler as an object, the influence of fluidization state optimization on the economical operation was calculated and analyzed. Under certain separator efficiency, to achieve a low bed pressure drop, it was necessary to reduce the size of feeding coal particles. The calculation results show that the increase in comminution energy consumption is much lower than the decrease in fan power consumption, which results in a significant decrease in auxiliary power consumption. The combustion efficiency shows a non-monotonous trend with the change in bed pressure drop and coal particle size. There are an optimal bed pressure drop and corresponding coal particle size to minimize the coal consumption of power generation or power supply. The optimal bed pressure drop corresponding to the lowest net coal consumption is slightly lower than the value corresponding to the lowest gross coal consumption, which is about 6 kPa and 6.5 kPa, respectively.
Lower bed pressure drop operation achieved only by reducing the coal particle size is not beneficial to SO2 and NOx emission control, and the pollutant control cost will increase. Combined with the net coal consumption, the influence of fluidization state optimization on the gross power supply cost can be calculated. There is an optimal bed pressure drop under which the gross power supply cost is the lowest. For the example in this work, the optimal bed pressure drop is approximately 7 kPa.
If the design and manufacturing level of the separator can be improved or the existing unit can be retrofitted, the bed material quality can be significantly improved. A lower bed pressure drop can be achieved without changing the size distribution of fed coal particles. The combustion efficiency can be increased, and the gross coal consumption and net coal consumption can be both reduced. At the same time, improvement in the separator efficiency is also beneficial to SO2 and NOx emission control. Therefore, if the separator efficiency can be improved, the optimal bed pressure drop can be further decreased.
For the 1D model used in this work, the consideration of some sub-models is simplified; for example, the effect of secondary air penetration and desulfurization. Further improvement in the submodels can help improve the accuracy of the 1D model. The separator efficiency is the most crucial factor affecting bed material quality. The influence of separator efficiency on CFB boiler performance can be analyzed more systematically in future work. Optimization of the secondary air ratio and injection position can also be extended.

Author Contributions

Conceptualization, H.Y. and J.L.; methodology, H.Y. and J.L.; software, X.L. and H.Y.; validation, X.L.; formal analysis, X.L. and H.Y.; investigation, X.L., H.Y. and J.L.; resources, X.L.; data curation, X.L.; writing—original draft preparation, X.L.; writing—review and editing, X.L. and H.Y.; visualization, X.L.; supervision, J.L.; project administration, X.L.; funding acquisition, X.L. All authors have read and agreed to the published version of the manuscript.

Funding

This research was funded by the National Key R&D Program of China, grant number 2018YFF0216005.

Conflicts of Interest

The authors declare no conflict of interest.

References

  1. Yang, H.R.; Yue, G.X. Updated design and operation experience of CFB boilers with energy saving process in China. VGB Powertech 2011, 7, 49–53. [Google Scholar]
  2. Yang, H.R.; Yue, G.X.; Lu, J.F.; Zhang, H. An update of circulating fluidized bed combustion (CFB) technology in China. VGB Powertech 2012, 12, 75–79. [Google Scholar]
  3. Su, J.; Zhao, X.X.; Zhang, J.C.; Liu, A.; Yang, H.; Yue, G.; Fu, Z. Design and operation of CFB boilers with low bed inventory. In Proceedings of the 20th International Conference on Fluidized Bed Combustion, Xi’an, China, 18 May 2009; pp. 212–218. [Google Scholar]
  4. Yang, H.R.; Zhang, H.; Yang, S.; Yue, G.; Su, J.; Fu, Z. Effect of bed pressure drop on performance of a CFB boiler. Energy Fuel 2009, 23, 2886–2890. [Google Scholar] [CrossRef]
  5. Zhang, M.; Bie, R.S.; Yu, Z.Z.; Jiang, X. Heat flux profile of the furnace wall of a 300MWe CFB boiler. Powder Technol. 2010, 203, 548–554. [Google Scholar]
  6. Liu, X.M.; Zhang, M.; Lu, J.F.; Yang, H. Effect of furnace pressure drop on heat transfer in a 135 MW CFB boiler. Powder Technol. 2015, 284, 19–24. [Google Scholar] [CrossRef]
  7. Blaszczuk, A.; Nowak, W. Bed-to-wall heat transfer coefficient in a supercritical CFB boiler at different bed particle sizes. Int. J. Heat Mass Transf. 2014, 79, 736–749. [Google Scholar] [CrossRef]
  8. Liu, X.M.; Yin, W.D.; Wang, P.N.; Yang, H.R. Effect of bed pressure drop on combustion efficiency of CFB boilers. J. China Coal Soc. 2016, 10, 2484–2489. [Google Scholar]
  9. Liu, X.M.; Yang, H.R.; Lyu, J.F.; Qi, G. Effect of Flow-pattern Reconstruction on Combustion Efficiency and Pollutant Emission in CFB Boiler. In Proceedings of the 2018 International Conference on Energy, Ecology and Environment, Melbourne, Australia, 21 November 2018. [Google Scholar]
  10. Yue, G.X.; Cai, R.X.; Lu, J.F.; Zhang, H. From a CFB reactor to a CFB boiler—The review of R&D progress of CFB coal combustion technology in China. Powder Technol. 2017, 316, 18–28. [Google Scholar]
  11. Li, J.J.; Zhang, M.; Yang, H.R.; Lu, J.F.; Zhao, X.X.; Zhang, J.C. The theory and practice of NOx emission control for circulating fluidized bed boilers based on the re-specification of the fluidization state. Fuel Process. Technol. 2016, 150, 88–93. [Google Scholar] [CrossRef]
  12. Cai, R.X.; Zhang, H.; Zhang, M.; Yang, H.; Lyu, J.; Yue, G. Development and application of the design principle of fluidization state specification in CFB coal combustion. Fuel Process. Technol. 2018, 174, 41–52. [Google Scholar] [CrossRef]
  13. Ke, X.W.; Cai, R.X.; Zhang, M.; Miao, M.; Lyu, J.; Yang, H. Application of ultra-low NOx emission control for CFB boilers based on theoretical analysis and industrial practices. Fuel Process. Technol. 2018, 181, 252–258. [Google Scholar] [CrossRef]
  14. Adanez, J.; Diego, L.; Gayan, P.; Armesto, L.; Cabanillas, A. A model for prediction of carbon combustion efficiency in circulating fluidized bed combustors. Fuel 1995, 74, 1049–1056. [Google Scholar] [CrossRef]
  15. Wang, Q.H.; Luo, Z.Y.; Li, X.T.; Fang, M.; Ni, M.; Cen, K. A mathematical model for a circulating fluidized bed (CFB) boiler. Energy 1999, 24, 633–653. [Google Scholar] [CrossRef]
  16. Gungor, A. One dimensional numerical simulation of small scale CFB combustors. Energy Convers. Manag. 2009, 50, 711–722. [Google Scholar] [CrossRef]
  17. Wang, Q.H.; Luo, Z.Y.; Ni, M.J.; Cen, K. Particle population balance model for a circulating fluidized bed boiler. Chem. Eng. J. 2003, 93, 121–133. [Google Scholar] [CrossRef]
  18. Krzywanski, J.; Czakiert, T.; Muskala, W.; Sekret, R.; Nowak, W. Modeling of solids fuels combustion in oxygen-enriched atmosphere in circulating fluidized bed boiler: Part 1. The mathematical model of fuel combustion in oxygen-enriched CFB environment. Fuel Process. Technol. 2010, 91, 290–295. [Google Scholar] [CrossRef]
  19. Blaszczuk, A.; Leszczynski, J.; Nowak, W. Simulation model of the mass balance in a supercritical circulating fluidized bed combustor. Powder Technol. 2013, 246, 317–326. [Google Scholar] [CrossRef]
  20. Adamczyk, W.P.; Wecel, G.; Klajny, M.; Kozołub, P. Modeling of particle transport and combustion phenomena in a large-scale circulating fluidized bed boiler using a hybrid Euler–Lagrange approach. Particuology 2014, 16, 29–40. [Google Scholar] [CrossRef]
  21. Adamczyk, W.P.; Myohanen, K.; Hartge, E.-U.; Ritvanen, J.; Klimanek, A.; Hyppänen, T.; Białecki, R.A. Generation of data sets for semi-empirical models of circulated fluidized bed boilers using hybrid Euler-Lagrange technique. Energy 2018, 15, 219–240. [Google Scholar] [CrossRef]
  22. Xu, L.J.; Cheng, L.M.; Ji, J.Q.; Wang, Q.; Fang, M. A comprehensive CFD combustion model for supercritical CFB boilers. Particuology 2019, 43, 29–37. [Google Scholar] [CrossRef]
  23. Yang, H.R.; Yue, G.X.; Xiao, X.B.; Lu, J.; Liu, Q. 1D modeling on the material balance in CFB boiler. Chem. Eng. Sci. 2005, 60, 5603–5611. [Google Scholar] [CrossRef]
  24. Liu, X.M.; Zhang, M.; Hu, N.; Yang, H.; Lu, J. Calculation model of coal comminution energy consumption. Miner. Eng. 2016, 92, 21–27. [Google Scholar] [CrossRef]
  25. Ross, I.B.; Davidson, J.F. The combustion of carbon particles in a fluidized bed. Trans. Inst. Chem. Eng. 1982, 60, 108–114. [Google Scholar]
  26. Yang, J.H.; Yang, H.R.; Yue, G.X. Experimental study on secondary air jet penetration in circulating fluidized bed. J. Power Eng. 2008, 28, 509–513. [Google Scholar]
  27. Garcia-Labiano, F.; Adanez, J.; Rubiera, F.; Fuertes, A.B.; Pis, J.J. Characterization of the reactivity of limestone with SO2 in a fluidized bed reactor. Can. J. Chem. Eng. 1992, 70, 734–741. [Google Scholar] [CrossRef]
  28. Talukdar, J.; Basu, P. A simplified model of nitric oxide emission from a circulating fluidized bed combustor. Can. J. Chem. Eng. 1995, 73, 635–643. [Google Scholar] [CrossRef]
  29. Krzywanski, J.; Czakiert, T.; Muskala, W.; Nowak, W. Modeling of CO2, CO, SO2, O2 and NOx emissions from the oxy-fuel combustion in a circulating fluidized bed. Fuel Process. Technol. 2011, 92, 590–596. [Google Scholar] [CrossRef]
  30. Li, J.J.; Yang, X.H.; Yang, H.R.; Lyu, J.F. Experimental study and modeling of NOx generation from char nitrogen in the bubbling bed. J. China Coal Soc. 2016, 41, 1546–1553. [Google Scholar]
  31. Lu, J.F.; Zhang, J.S.; Yue, G.X.; Liu, Q.; Yu, L.; Lin, X.D.; Li, W.J.; Tang, Y.; Luo, T.Y.; Ge, R.S. Method of calculation of heat transfer coefficient of the heater in a circulating fluidized bed furnace. Heat Transf. -Asian Res. 2002, 31, 540–550. [Google Scholar] [CrossRef]
  32. Hu, N.; Li, Z.G.; Yang, H.R. Development and validation of a 1D CFB boiler combustion model. In Proceedings of the 21st International Conference on Fluidized Bed Combustion, Napoli, Italy, 3 June 2012; pp. 962–969. [Google Scholar]
  33. Li, C.H. Desulfurization process and cost calculation for a 300MW CFB boiler. In Proceedings of the 7th Symposium on Energy Conservation and Emission Reduction in the Power Industry, Hangzhou, China, 1 October 2012; pp. 29–31. [Google Scholar]
  34. Rota, R.; Antos, D.; Zanoelo, E.F.; Morbidelli, M. Experimental and modeling analysis of the NOxOUT process. Chem. Eng. Sci. 2002, 57, 27–38. [Google Scholar] [CrossRef]
  35. Qu, W.D.; Zhou, J.Q.; Yang, J.H.; Qin, G.Y. SNCR denitrification system in CFB boilers: Optimization and application. Therm. Power Gener. 2014, 43, 133–136. [Google Scholar]
Figure 1. Mass balance of gas component j in cell i.
Energies 13 00376 g001
Figure 2. Mass balance of ash particles in size group j and age group k in cell i.
Energies 13 00376 g002
Figure 3. Size distribution of coal particles.
Energies 13 00376 g003
Figure 4. Effect of bed pressure drop on the carbon content.
Energies 13 00376 g004
Figure 5. Effect of bed pressure drop on bed temperature (Reprint with permission [6]; 2015, Powder Technol.).
Energies 13 00376 g005
Figure 6. Effect of bed pressure drop on SO2 emission concentration.
Energies 13 00376 g006
Figure 7. Effect of bed temperature on NOx emission concentration.
Energies 13 00376 g007
Figure 8. Coal particle size distribution corresponding to different bed pressure drop.
Energies 13 00376 g008
Figure 9. Change in comminution energy with coal particle size distribution.
Energies 13 00376 g009
Figure 10. Change in secondary air back pressure with bed pressure drop.
Energies 13 00376 g010
Figure 11. Change in auxiliary power consumption with the bed pressure drop.
Energies 13 00376 g011
Figure 12. Carbon contents in fly ash and bottom ash under different bed pressure drop.
Energies 13 00376 g012
Figure 13. Effect of bed pressure drop on coal consumption.
Energies 13 00376 g013
Figure 14. SO2 and NOx emission under different bed pressure drop.
Energies 13 00376 g014
Figure 15. Effect of bed pressure drop on gross cost.
Energies 13 00376 g015
Figure 16. Effect of separator efficiency on combustion.
Energies 13 00376 g016
Figure 17. Effect of separator efficiency on SO2 and NOx emission.
Energies 13 00376 g017
Figure 18. Fluidization state optimization achieved by improving separator efficiency.
Energies 13 00376 g018
Table 1. NOx generation and reduction.
ReactionReaction Rate
HCN + 1 2 O 2 CNO R HCN = k C O 2 C HCN ( mol m 3 s ) k = 2.14 × 10 5 exp ( 10000 T )
NCO + 1 2 O 2 NO + CO R CNO - O 2 = k C O 2 C HCN ( k 1 k 1 + k 2 C NO ) ( mol m 3 s ) k 2 k 1 = 1.02 × 10 9 exp ( 25460 T )
NO + C 1 2 N 2 + CO R NO - C , 1 = k N π d c 2 C NO ( mol s ) k = 5.85 × 10 7 exp ( 12000 T )
NO + 1 2 C 1 2 N 2 + 1 2 CO 2 R NO - C , 2 = k N π d c 2 C NO ( mol s ) k = 1.3 × 10 5 exp ( 17111 T )
NO + CO 1 2 N 2 + CO 2 R NO - CO = K T k 1 C NO ( k 2 C CO + k 3 ) k 1 C NO + k 2 C CO + k 3 ( mol m 3 s ) K T = 1.952 × 10 10 exp ( 19000 T )
k 1 = 0.1826 ,   k 2 = 0.00786 ,   k 3 = 0.002531
R NO - CO ( CaO ) = k C NO C CO ( mol m 3 s ) k = 2.1 T exp ( 8920 T )
NH 3 + 5 4 O 2 NO + 3 2 H 2 O R N H 3 - O 2 , 1 = k C N H 3 C O 2 C O 2 + k ( mol m 3 s ) k = 3.38 × 10 7 exp ( 10000 T ) ,   k = 0.054
R N H 3 - O 2 ( CaO ) , 1 = k C N H 3 C O 2 ( mol m 3 s ) k = 2.67 × 10 7 exp ( 10000 T )
NH 3 + 3 4 O 2 1 2 N 2 + 3 2 H 2 O R N H 3 - O 2 , 2 = k C N H 3 C O 2 C O 2 + k ( mol m 3 s ) k = 3.38 × 10 7 exp ( 10000 T ) ,   k = 0.054
R N H 3 - O 2 ( CaO ) , 2 = k C N H 3 C O 2 ( mol m 3 s ) k = 6.65 × 10 7 exp ( 10000 T )
NO + NH 3 + 1 2 O 2 N 2 + 3 2 H 2 O R NO - N H 3 = k C O 2 C N H 3 C NO ( mol m 3 s ) k = 1.1 × 10 12 exp ( 27680 T )
Table 2. Main design parameters (Reprint with permission [8]; 2016, J. China Coal Soc.).
ItemUnitsValues (B—MCR)
Main steam flow ratet/h480
Main steam pressureMPa13.73
Main steam temperature°C540
Reheat steam flow ratet/h388.5
Reheat steam pressureMPa2.746
Reheat steam inlet temperature°C327
Reheat steam outlet temperature°C540
Air temperature°C20
Table 3. The proximate analysis and ultimate analysis of coal (Reprint with permission [6]; 2015, Powder Technol.).
Proximate Analysis (as Received)Ultimate Analysis (as Received)
ComponentWeight (%)ComponentWeight (%)
Moisture10.03C32.81
Ash46.23H2.64
Volatile Matter, VM22.02O7.11
Fixed Carbon, FC21.72N0.76
Lower Heating Value, LHV: 13.20 MJ/kgS0.42
Table 4. Difference between calculated and experimental results.
ItemPercentage Difference
Unburned carbon content in residue15%
Bed temperature5%
SO2 emission concentration25%
NOx emission concentration15%
Table 5. Separator efficiency.
Cased50 (μm)d99 (μm)
130120
225110
320100
41696

