Article

Temperature Measurement Method of Flame Image Fusion with Different Exposures

1
Key Laboratory of Electromagnetic Wave Information Technology and Metrology of Zhejiang Province, College of Information Engineering, China Jiliang University, Hangzhou 310018, China
2
College of Metrology and Measurement Engineering, China Jiliang University, Hangzhou 310018, China
*
Author to whom correspondence should be addressed.
Energies 2020, 13(6), 1487; https://doi.org/10.3390/en13061487
Submission received: 1 March 2020 / Revised: 16 March 2020 / Accepted: 20 March 2020 / Published: 21 March 2020

Abstract

:
Fixed exposure will lead to underexposure or overexposure of collected flame radiation images using CCD, which has a great influence on the temperature measuring accuracy. A temperature measurement method was proposed by image fusion with multi-exposure, which can eliminate the influence of insufficient underexposure and overexposure. The approach was first to acquire a group of flame radiation images during different exposures. Then a partial region with good exposure effect in each radiation image was obtained by segmentation, with which the complete flame image can be spliced together. An experimental system was built to calibrate the temperature measurement parameters by two-color pyrometry through a blackbody furnace. The relation between exposure time and monochromatic gray level, as well as the relation between the temperature and temperature measurement coefficient were obtained. A candle flame was selected as the measuring object and the complete and accurate flame temperature distribution was acquired following our proposed method. The experimental results show that, compared with the temperature measurement using a single exposure time, our method can effectively avoid the measurement error caused by underexposure and overexposure, and improve the measurement accuracy.

1. Introduction

Flame temperature detection has always been a research hotspot in the combustion field as the temperature can reflect the combustion state and judge, predict and diagnose it. Accurate measurement of flame temperature is very important in order to adjust the combustion model, optimize the combustion process and control the pollutant emissions. With the development of digital image technology in recent years, radiation thermometry based on color CCD has become a hot topic in the research field of temperature measurement [1,2,3,4,5]; it is widely used in scientific research, industrial production and national defense research [6,7,8,9,10,11].
For decades, many researchers have investigated image-based non-contact thermometry intensively. Zhou et al. [12,13,14,15] have carried out dozens of experiments on flame temperature detection and proposed a monochromatic method for reference temperature measurement. After the CCD camera could automatically output RGB images, a calibration method was proposed for the conversion between image intensity and absolute radiation intensity, and subsequently put into industry applications. Levendis et al. [16] proposed to use a three-color near-infrared optical pyrometer to monitor the combustion of polymer particles, combined with a soot radiation model that can increase the upper limit of temperature detection. Compared with the two-color pyrometry, it has a higher temperature measurement accuracy but a narrower dynamic range. Yamashita et al. [17] developed a temperature measurement technology in the welding process, which used a multi-sensor camera based on the two-color thermometry method. The camera can use three filters to set different spectral wavelengths, to more accurately and quickly respond to the welding temperature in a wide temperature range. But the camera has a complex structure and high price, and it is also inconvenient to select the best measurement wavelength combination. Huang et al. [18] used the method of adding optical filters in front of a CCD camera to alternately capture the images at two wavelengths, and calculated the average temperature of the flame using two-color pyrometry based on the average gray ratio of the two images. Xu et al. [19] developed a new spectral-emittance method to modify RGB pyrometry, which was used to measure the surface temperature of dispersed chars in a Hencken flat-flame burner. In this method, 420/440 two-color pyrometry and RGB pyrometry were compared to build a calibrated normalized spectral emissivity model of chars, and then modified the lookup table of the Nikon camera to complete the RGB correction. Although the results obviously reduced the temperature measurement error, the calibration process was more complicated.
In recent years, many research works focused on improving the measurement accuracy and range of image temperature measurement technology. Sun et al. [20] built a normalized spatial distance weighted directional-distance filter to remove the interference of light noise, based on the spatial distance weighted function and the directional-distance filter. In conventional ratio pyrometry applications, a calibration process is tedious, and the range of the effective temperature is narrow. Shao et al. [21] improved the traditional two-color pyrometry, which can set different exposure times for different channels to simplify the calibration of the blackbody furnace and widen the temperature measurement range. However, the research used a 3CCD camera, which is more complicated and costly even if the camera can set the exposure time of the R, G and B channels, respectively. Yan et al. [22] combined spectral thermometry and image thermometry to measure the flame temperature and emissivity simultaneously. A portable optical fiber spectrometer and an industrial color camera were used to obtain measurement of the combustion flame during biomass volatile combustion, and a non-gray emissivity model with a third-order polynomial function was established to correct the image pyrometer data, which reduces the limitation that the image temperature measurement can only obtain radiation at finite wavelength. In the same year, Yan et al. [23] proposed another method to measure the temperature of objects with simultaneous use of a spectrometer and a high-speed camera, which improved the accuracy of transient flame temperature measurement. Li et al. [24] provided a novel flame temperature estimation method based on a flame light field sectioned imaging model of complex temperature distribution in different media. The method relies on multi-pixel reconstruction, the wavelet transformation and Lucy–Richardson algorithm to calculate the flame temperature, which improves the accuracy of the temperature estimation and can be used in over a large estimation range. Despite a great deal of effort to improve the temperature measurement accuracy, the error caused by overexposure and underexposure of image pixels has not been well solved so far.
Image fusion is an enhancement technique that aims to integrate a large amount of complementary information from multi-source images of the same scene into a new image [25]. This technology has been studied for decades and is widely used in industry, medical treatment, machine learning and other fields. In order to optimize the fusion technology, various fusion algorithms have been developed in recent years [26,27,28,29,30]. As early as in 1979, Daily et al. [31] fused radar and Landsat-MSS images for the first time to extract geological information. Zhang et al. [32] designed a multispectral and panchromatic image fusion model employing adaptive spectral–spatial gradient sparse regularization for vegetation phenotypes and generated accurate vegetation indices. Yin et al. [33] proposed a new multimodal medical image fusion method in the non-subsampled shearlet transform (NSST) domain. The reconstructed fusion image has led to state-of-the-art results on both visual quality and objective assessment. Liu et al. [34] adopted a new multi-focus image fusion method to obtain state-of-the-art-fusion performance, using deep learning to solve the two crucial factors of activity level measurement and fusion rules in image fusion.
This paper proposes a new image temperature measurement method based on image fusion technology, which is to collect a group of flame radiation images with a color CCD camera during different exposure times, and then splice a complete flame image by good exposure of parts of each image, so as to obtain a more accurate temperature distribution.

2. Principle and Methods

2.1. Two-Color Pyrometry
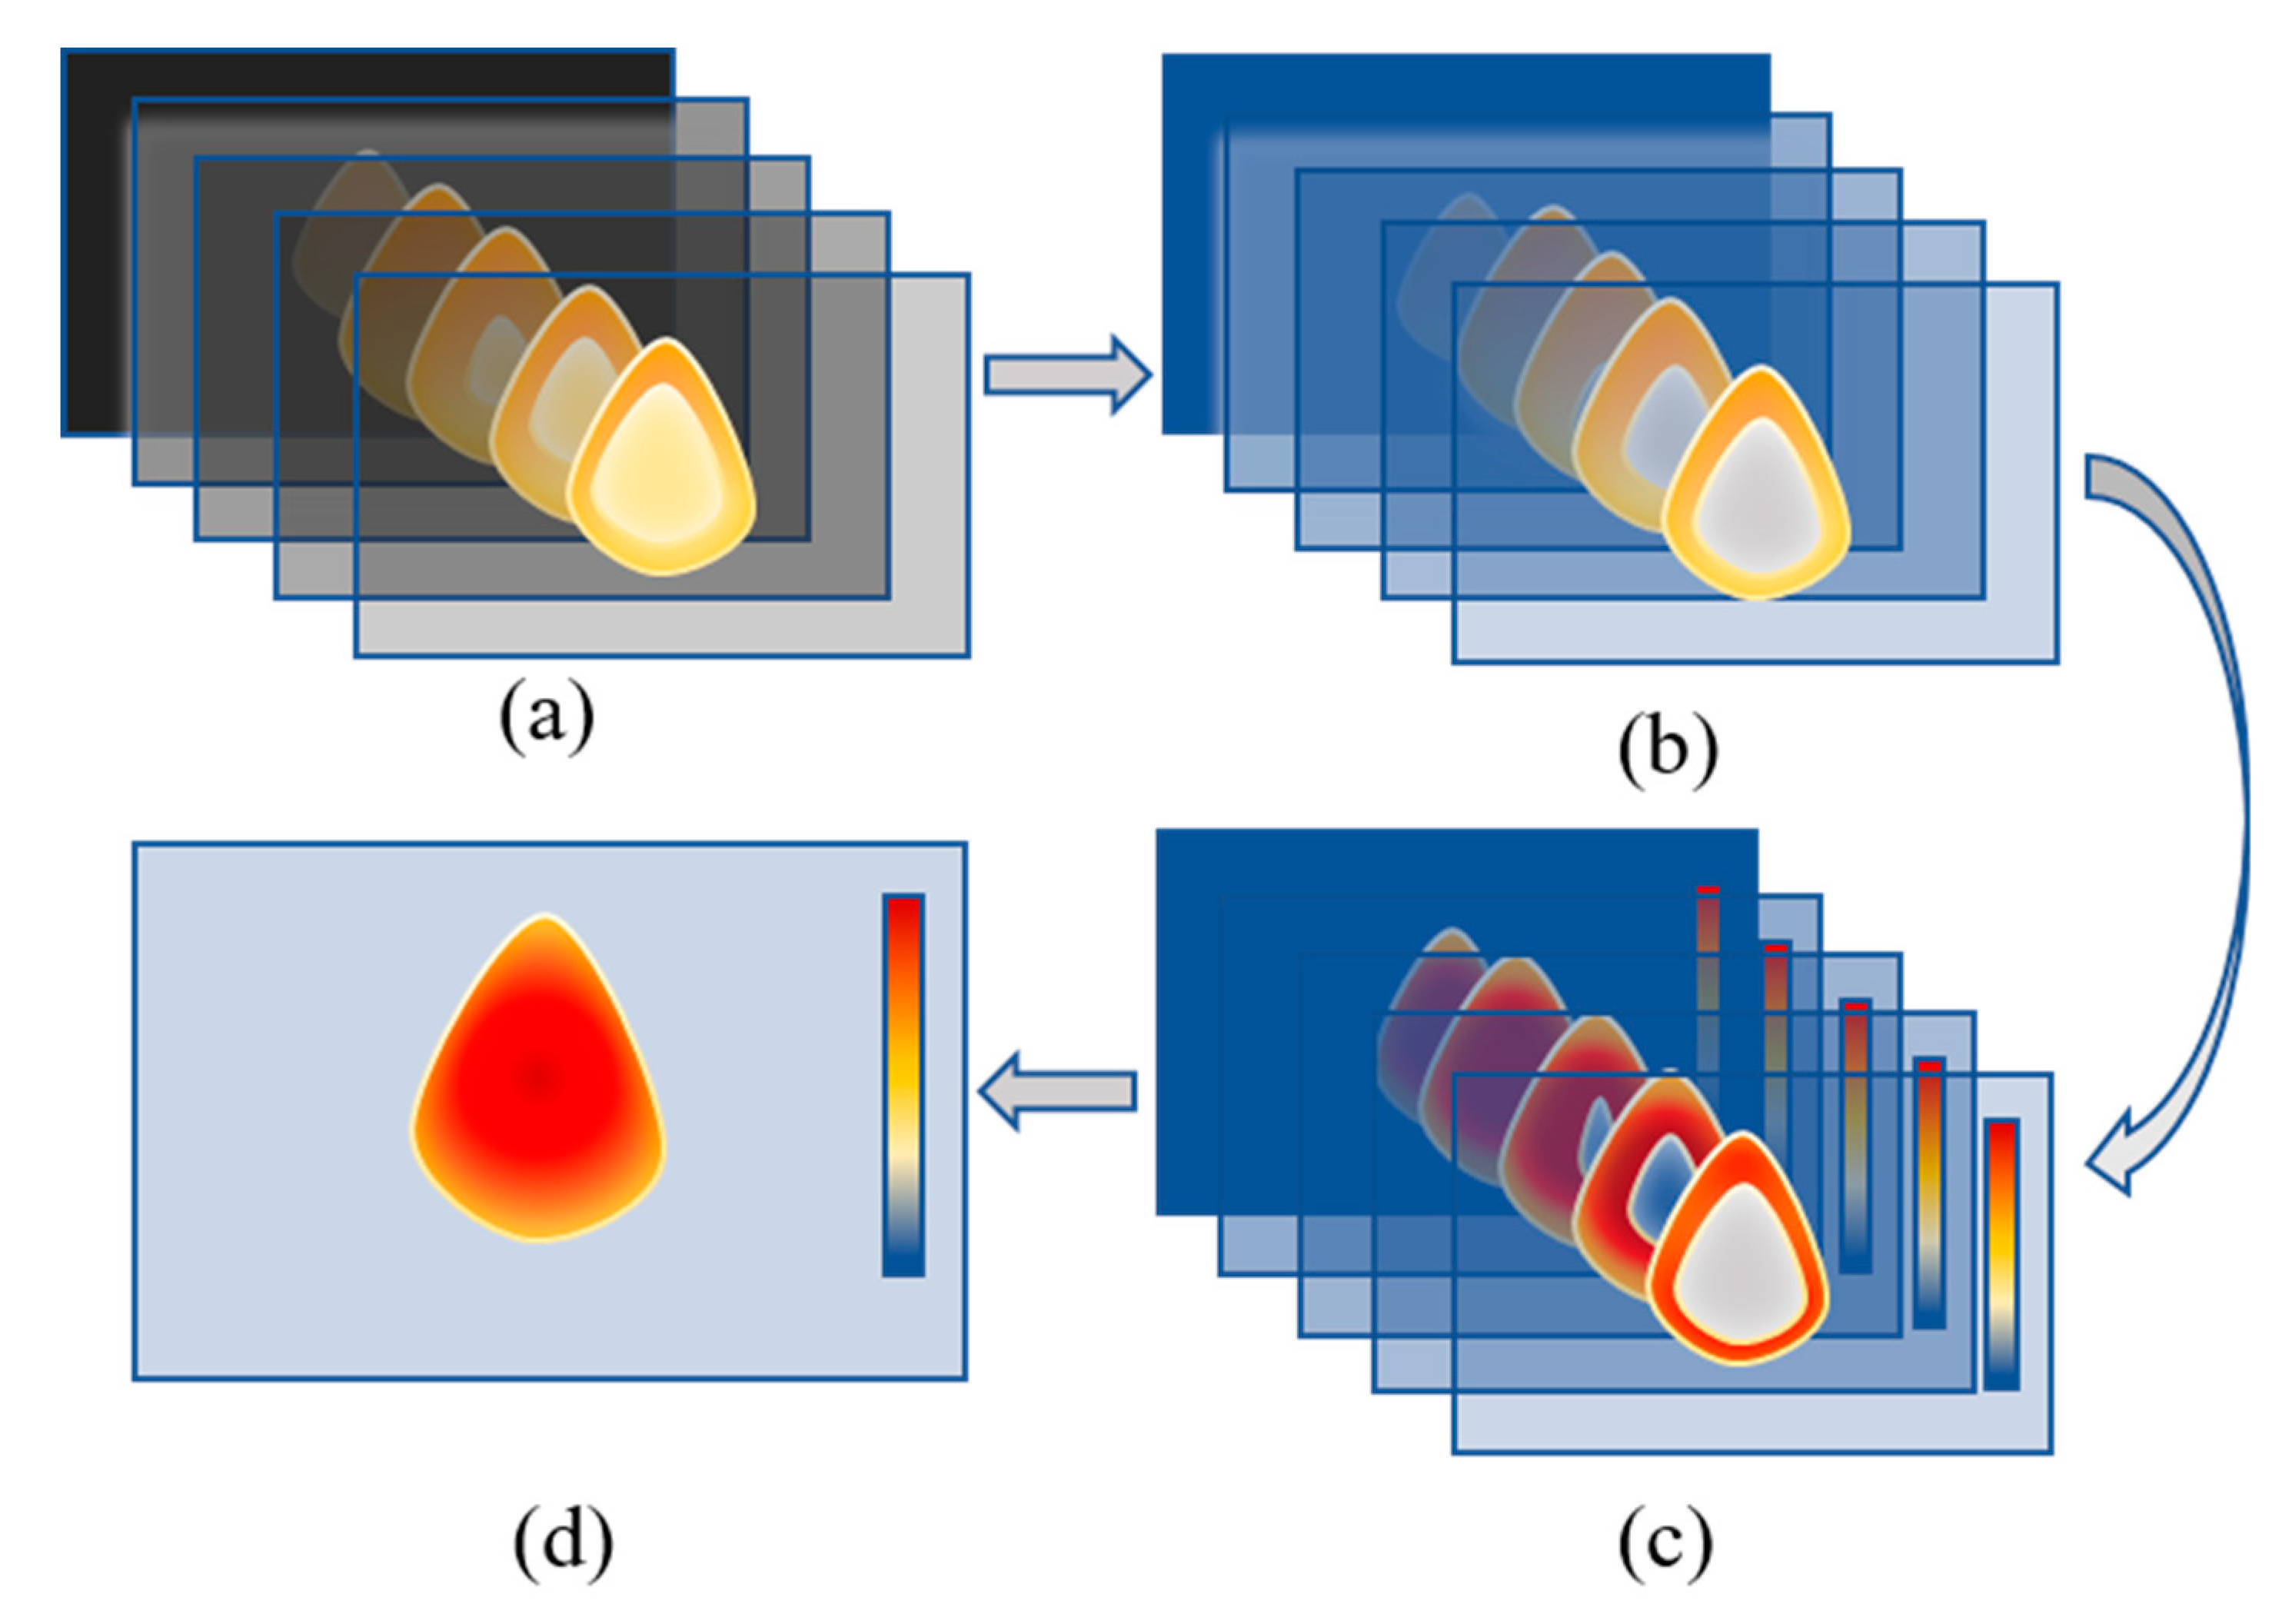
Two-color pyrometry is also called the colorimetry temperature measurement, which is a method to measure temperature by the ratio of radiation intensities in two adjacent narrow wave bands [35,36]. Through the R and G channels of CCD, the flame radiation information of the red and green narrow bands filtered by monochromatic filter is obtained. The flame temperature is calculated by Equation (1)
T = C 2 ( 1 λ r 1 λ g ) ( ln ( 1 C g R G λ r 5 λ g 5 ) ) 1
where T is the flame temperature calculated by the two-color pyrometry, with the unit of K; C 2 is the constant of Planck with the value of 1.4388 × 10 2 ; W · m 2 , λ r and λ g are the fixed wavelengths of flame R and G light components, valued 700 nm and 546.1 nm, respectively; and C g denotes the corrected coefficient of component G.

2.2. Fusion Method

According to Jiang's [37] experimental research in 2004, the CCD works in the state of linear change with the RGB gray values from 50 to 220, which can ensure the accuracy of flame temperature measurement by two-color pyrometry. In a flame, the temperatures of different positions can vary from several hundred K to several thousand K, which will lead to an exponential growth of radiation intensity. In this case, if the radiation image is collected under a fixed exposure time, serious overexposure and underexposure will appear and reduce the measurement accuracy.
The temperature measurement method proposed in this paper is based on a pixel-level fusion processing for images with different exposure times. In order to extract the effective temperature measurement areas from different flame radiation images, it is necessary to define the overexposure and underexposure state by the gray values of R and G [38]. From the previously mentioned literature [37], when the gray values of R and G are less than 50, the pixels are defined in the state of underexposure. When the values are greater than 220, the pixels are defined overexposure. Thus, in our experiment, the pixels with the gray values from 50 to 220 in the flame radiation image are considered as the effective points to be extracted.
The process of our method is shown in Figure 1. Firstly, a group of flame radiation images during different exposures are obtained, named I O n ( x , y ) , see Figure 1A. Then, according to Equation (2), images in group (a) are segmented to group (b), named I S n ( x , y ) . R n ( x , y ) and G n ( x , y ) in Equation (2) denote the gray values of R and G in I O n ( x , y ) .
I S n ( x , y ) = { I O n ( x , y ) , 50 R n ( x , y ) 220 and 50 G n ( x , y ) 220 0 , e l s e
The two-color pyrometry formula is used to calculate the temperatures of the effective areas in the images of group B, and the image sequence of two-dimensional flame temperature distribution with effective measurement areas I E n ( x , y ) were obtained, as shown in group (c). The effective pixels may overlap in different pictures of the image sequence, which are recorded under different exposures. Therefore, the final complete temperature distribution requires numerical fusion rather than direct superposition. In the fusion process, the temperature at the same position in the image sequence needs to be the weighted average and the gross error points should be removed. The weight value of the weighted average fusion was determined by measured values R and G. The closer the temperature calculation result is to the median value, the greater the weight is. See Equation (3) for details, where m represents the number of images in image sequence that have an effective temperature at the same position. After the weighted fusion value is obtained, it is compared with the measured value of the images. When the relative error is more than 5%, it is eliminated as a gross error point to be removed. Finally, a complete flame temperature distribution is obtained, represented by I T ( x , y ) , shown in Figure 1d.
I T ( x , y ) = w n × I E n ( x , y ) m

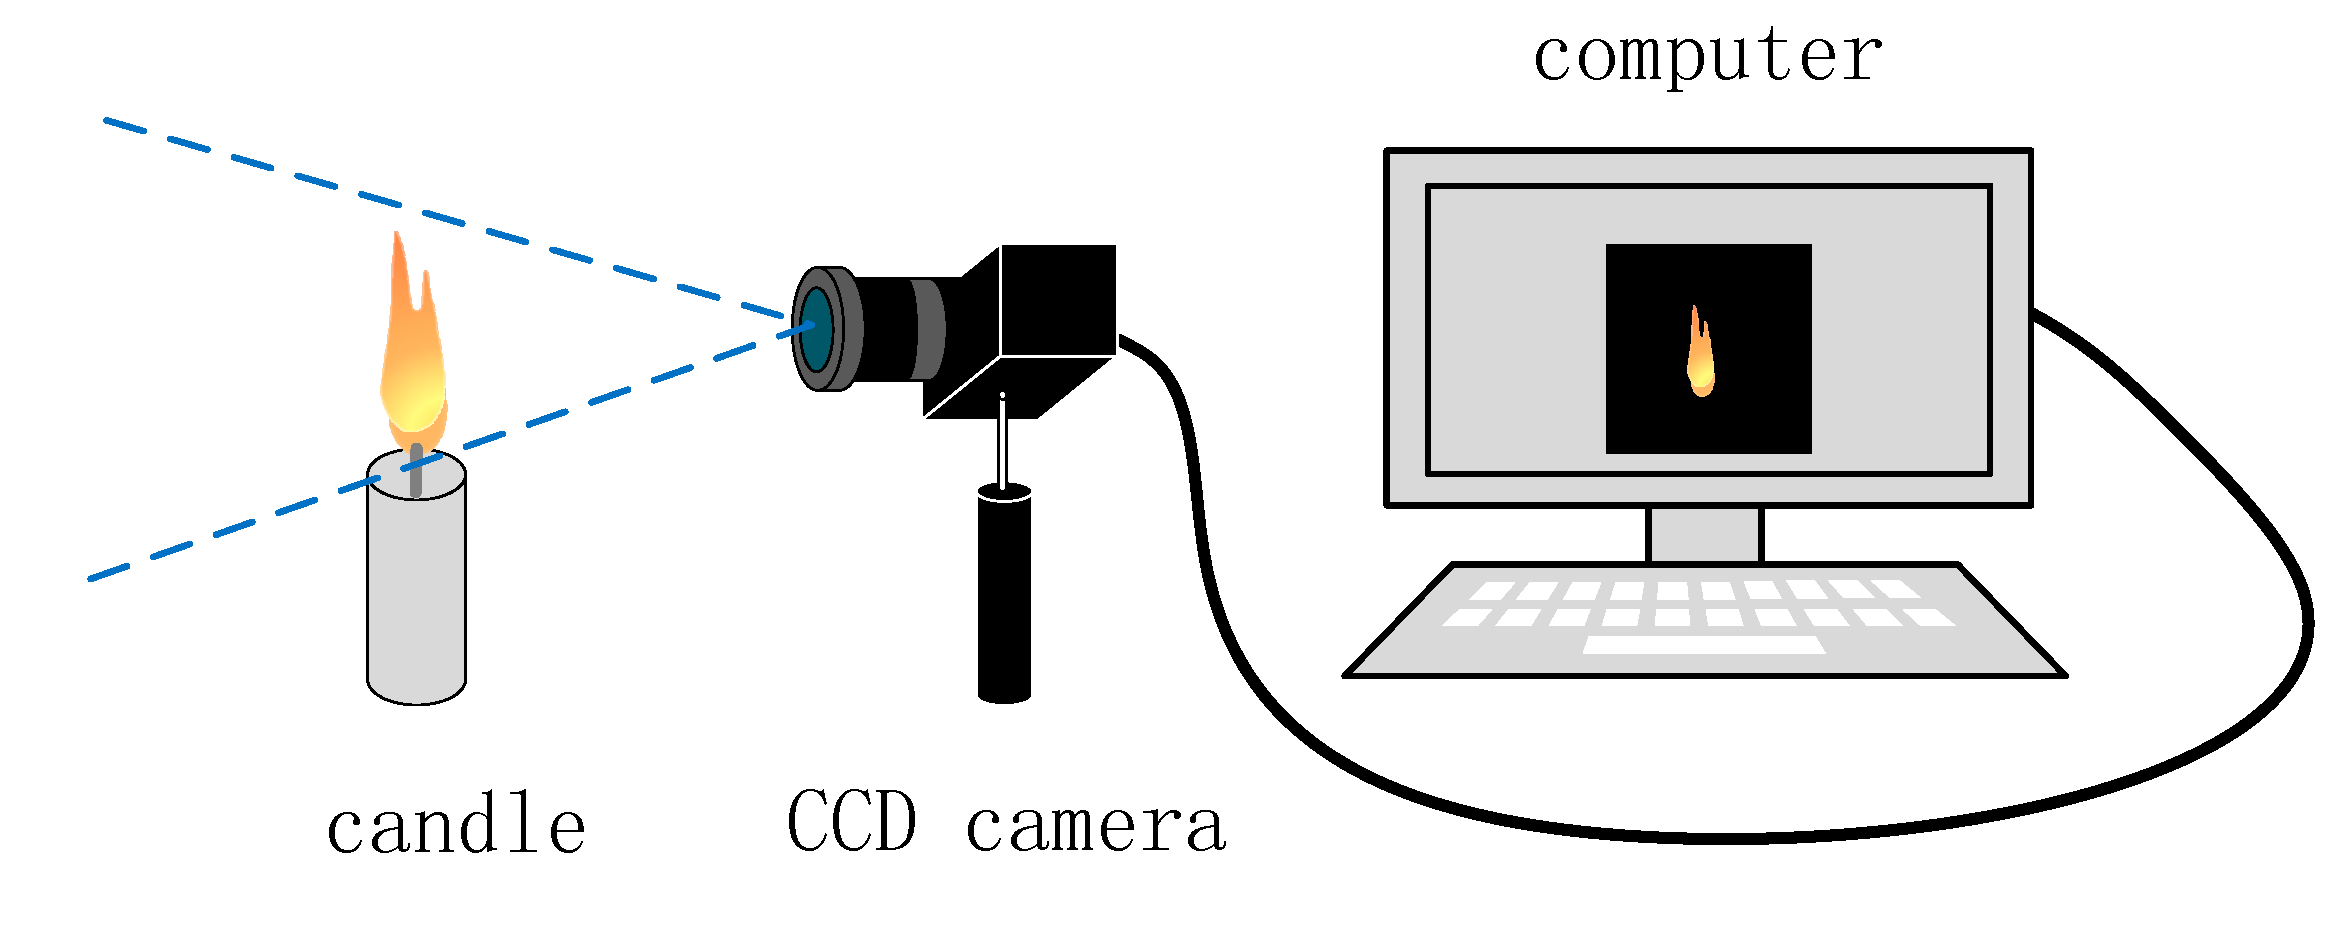
3. Experimental Setup

The experimental system is shown in Figure 2, composed of a candle, a CCD camera and a computer. The candle flame is the measuring object. After the candle was ignited, the evaporated paraffin diffused into the air and formed an orange flame, which produced the bright combustion radiation of carbon particles. In the three-dimensional temperature distribution of the candle flame, from previous literature [39], the temperature of the outermost flame is greater than 1473.15 K, and the highest value can be up to 1673.15 K. The inner flame is greater than 1273.15 K, and the flame core is less than 1273.15 K.
The CCD camera is the sensing device. In this research, the candle flame was considered to be stable in a short time, so a group of images collected in different exposure times were considered to record the same flame. The Daheng Image Mercury MER-132-30GC color CCD camera was adopted, with a frame rate of 30 fps, shutter time of 20 μs to 1 s, target size of 1/3 inch and the pixel format of Bayer rg8. From experience, the white balance RGB gain parameter was set as 2:4:6.
The computer is the control and the processing unit, which set the white balance gain parameters of the color CCD camera and controlled the CCD to collect the flame radiation images at different exposures in a short time. The two-dimensional flame temperature field was obtained after the image sequence was segmented. Before image thermometry, it is necessary to calibrate the temperature measurement coefficient. A blackbody furnace was selected to do the calibration, with an ISOTech Cyclops model 878, produced by the British company Essent. The temperature range of the furnace was from 373.15 K to 1573.15 K, with an accuracy of 0.1 K. The radiation rate was 0.999. In our calibration tests, the temperature was set from 1073.15 K to 1473.15 K, with an interval of 25 K.

4. Results and Discussion

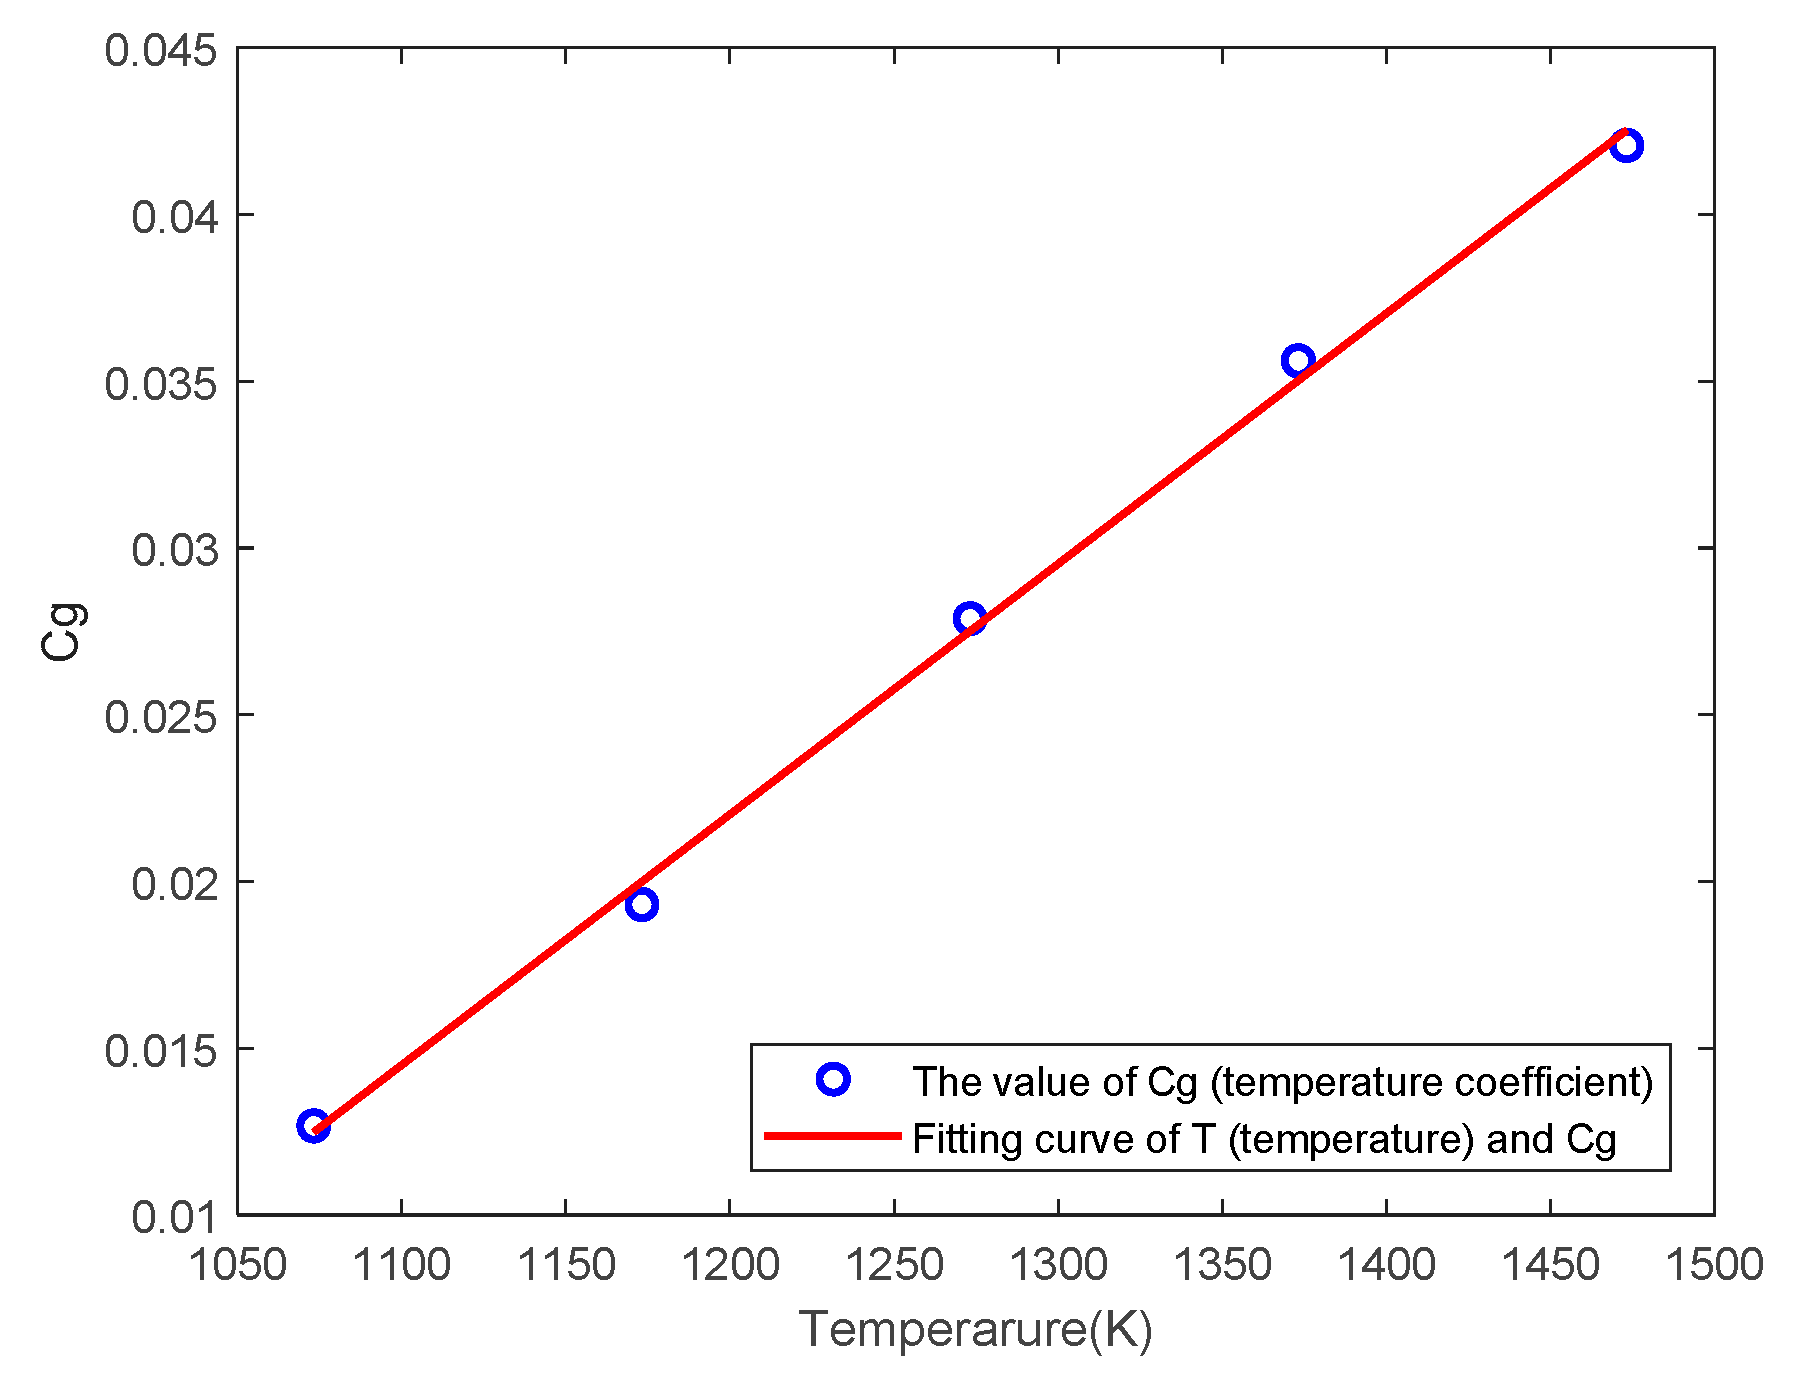
4.1. Temperature Measurement Coefficient Calibration

In order to obtain the correct flame temperature, the parameters of the CCD need to be calibrated through a blackbody furnace before flame temperature measurement. The experimental parameter settings of the furnace and the camera are described in Section 3. The R and G gray values of the blackbody radiation images were calculated, then the effective temperature measurement areas with the gray value from 50 to 220 were extracted. The exposure time ranges corresponding to different temperatures were obtained, and the relation model between the monochromatic base value and the exposure time was established.
Figure 3 shows the fitting curves of the monochromatic gray values R and G with exposure time at five furnace temperatures: 1073.15 K, 1173.15 K, 1273.15 K, 1373.15 K and 1473.15 K. The abscissa x is the logarithm form. It can be seen from the figure that in order to obtain the effective gray values in different furnace temperatures, the exposure time varies greatly. Higher furnace temperature needs shorter exposure while lower temperature needs longer exposure. The fitting relationships between the R and G gray values and the exposure time at five temperatures were derived, as shown in Equations (4) and (5):
[ R 1073.15 R 1173.15 R 1273.15 R 1373.15 R 1473.15 ] = [ 8.23 × 10 8 2.35 × 10 6 3.56 × 10 5 5.23 × 10 4 4.34 × 10 3 9 . 10 × 10 3 3 . 82 × 10 2 1 . 60 × 10 1 6.41 × 10 1 1.72 × 10 0 2.43 × 10 0 5.01 × 10 0 1.17 × 10 1 3.14 × 10 1 7.01 × 10 1 ] [ t 2 t 1 ]
[ G 1073.15 G 1173.15 G 1273.15 G 1373.15 G 1473.15 ] = [ 2.01 × 10 7 3.13 × 10 6 6.47 × 10 5 1.11 × 10 3 3.30 × 10 3 1.26 × 10 2 5.21 × 10 2 2.27 × 10 1 9.22 × 10 1 1.13 × 10 0 3.95 × 10 0 1.06 × 10 1 2.32 × 10 1 6.05 × 10 1 1.68 × 10 2 ] [ t 2 t 1 ]
where R and G represent the R and G gray values of the blackbody radiation image, the subscript represents the furnace temperature and t is the exposure time.
From Figure 3 and the two fitting equations, the approximate range of exposure time at different temperatures can be obtained, as shown in Table 1. The exposure time setting range of the camera is from 20 μs to 1 s, hence the lower limit of the exposure is 20 μs in this experiment.
In the literature [37], the coefficient Cg almost has no relation with the exposure time but the temperature. So, the coefficient was evaluated as the mean value of the coefficients from the blackbody images, and it was found that the value changes linearly with the increasing temperature. The fitting relation is shown in Equation (6), and the fitting curve is shown in Figure 4.
C g = 7.51 × 10 5 T 0.0681
From the literature as well [37], when the flame temperature ranges from 1073.15 K to 2073.15 K, the gray value of the blackbody radiation intensity has a mathematic relationship with the temperature. Therefore, the initial temperature can be estimated by the relation. Then the temperature measurement coefficient can be obtained by Equation (6). Finally, the flame temperature can be calculated by the two-color pyrometry formula.
From previous analysis, a different temperature needs a different exposure time, which will affect the relation between the gray value and the initial temperature. So, it is necessary to determine the relationships between the gray value of G and the temperature at different exposures. Eight exposure times were set to collect the radiation images of the same flame, which were 20 μs, 50 μs, 80 μs, 100 μs, 120 μs, 150 μs, 180 μs and 200 μs. The fitting relationship between the G value and the temperature can be obtained, as shown in Equation (7). The subscript of T represents the exposure time.
[ T 20 T 50 T 80 T 100 T 120 T 150 T 180 T 200 ] = [ 3.31 × 10 3 3.10 × 10 4 8.00 × 10 4 6.48 × 10 4 9.23 × 10 4 7.06 × 10 4 2.00 × 10 4 9.00 × 10 5 1.91 × 10 0 1.86 × 10 0 1.13 × 10 0 1.00 × 10 0 5.01 × 10 1 4.39 × 10 1 6.32 × 10 1 6.50 × 10 1 1.24 × 10 3 1.21 × 10 3 1.24 × 10 3 1.25 × 10 3 1.26 × 10 3 1.28 × 10 3 1.25 × 10 3 1.25 × 10 3 ] [ G 2 G 1 ]
To obtain the flame temperature, the first step is to use the gray value of G to calculate the temperatures at different exposure times by Equation (7). Then calculate the temperature measurement coefficients using Equation (6). Finally, utilize the two-color pyrometry to obtain the flame temperature by Equation (1).

4.2. Image Fusion of Multi-Exposure Times

Figure 5 depicts the collected flame images at the selected eight exposures. Since the white balance ratio of R, G and B is set as 2:4:6, the flame images appear green. Comparing the eight images, it is evident that at a short exposure time, the flame contour is small. With the increase in exposure time, the flame gets brighter and the flame contour becomes bigger, tending to be close to the actual flame size observed by one’s eyes.
Figure 6 is the temperature distribution of the original flame image in Figure 5, calculated by the method described in Section 4.1. It is obvious that the contour of the temperature distribution has the same variation tendency with the original flame image, and the temperature range of the flame is between 1300 K and 1600 K, approximately. From the eight pictures, only the first one, which used the exposure time of 20 μs, has the highest temperature in the flame center, while in the other seven pictures the central temperatures are all lower than the surrounding part. The reason is that with the increment of the exposure in those seven cases, the flame became brighter in the center and the gray values of R and G in the central part became saturated gradually, which led to an inaccurate temperature calculation.
Thus, the multi-exposure time image fusion method presented in Section 2.2 will be applied here. The temperature distributions with effective areas are presented in Figure 7. It can be seen from the eight images that with the increase of exposure, the flame contour increases gradually, and the range of center removal is also increasing. This is due to the overexposure central gray value. Underexposure will also lead to partial flame loss, reflected in the smaller contour compared with the actual flame.
With the effective areas in Figure 7, a modified flame distribution can be acquired, with no underexposure and overexposure, shown in Figure 8. It should be noted that in Figure 8, the temperature of the inner flame is higher than the outer flame, which seems contradictory to the conclusion mentioned in the literature [39] in Section 3. That is because of the overlap of different parts of the flame. In detail, the flame itself is a three-dimensional object, which has an outer flame, inner flame and flame core from the outside to the inside. However, the flame temperature distribution obtained by image radiation thermometry is a two-dimensional field, which has some discrepancies with actual three-dimensional distribution. The CCD image is a projection of three-dimensional space, which is called “a projection temperature field”. It is an integral cumulative effect of three-dimensional radiation on the two-dimensional plane, not a temperature distribution in a strict sense. It reflects the integral average value of the space temperature distribution along the measurement optical path [40]. Our result is consistent with the research of Zheng et al. [41] on the candle flame distribution of temperature and emissivity, as well as the measurement results of candle temperature by Arpit et al. [42] using a CCD camera.

5. Conclusions

In this paper, on the issue of overexposure and underexposure in CCD collecting flame images, which are caused by the great differences in flame radiation intensity, a novel two-dimensional flame temperature distribution measuring method based on image fusion of multi-exposure times is proposed, which effectively solves the common problem in CCD flame temperature measurement with a wide temperature range. It mainly includes four aspects:
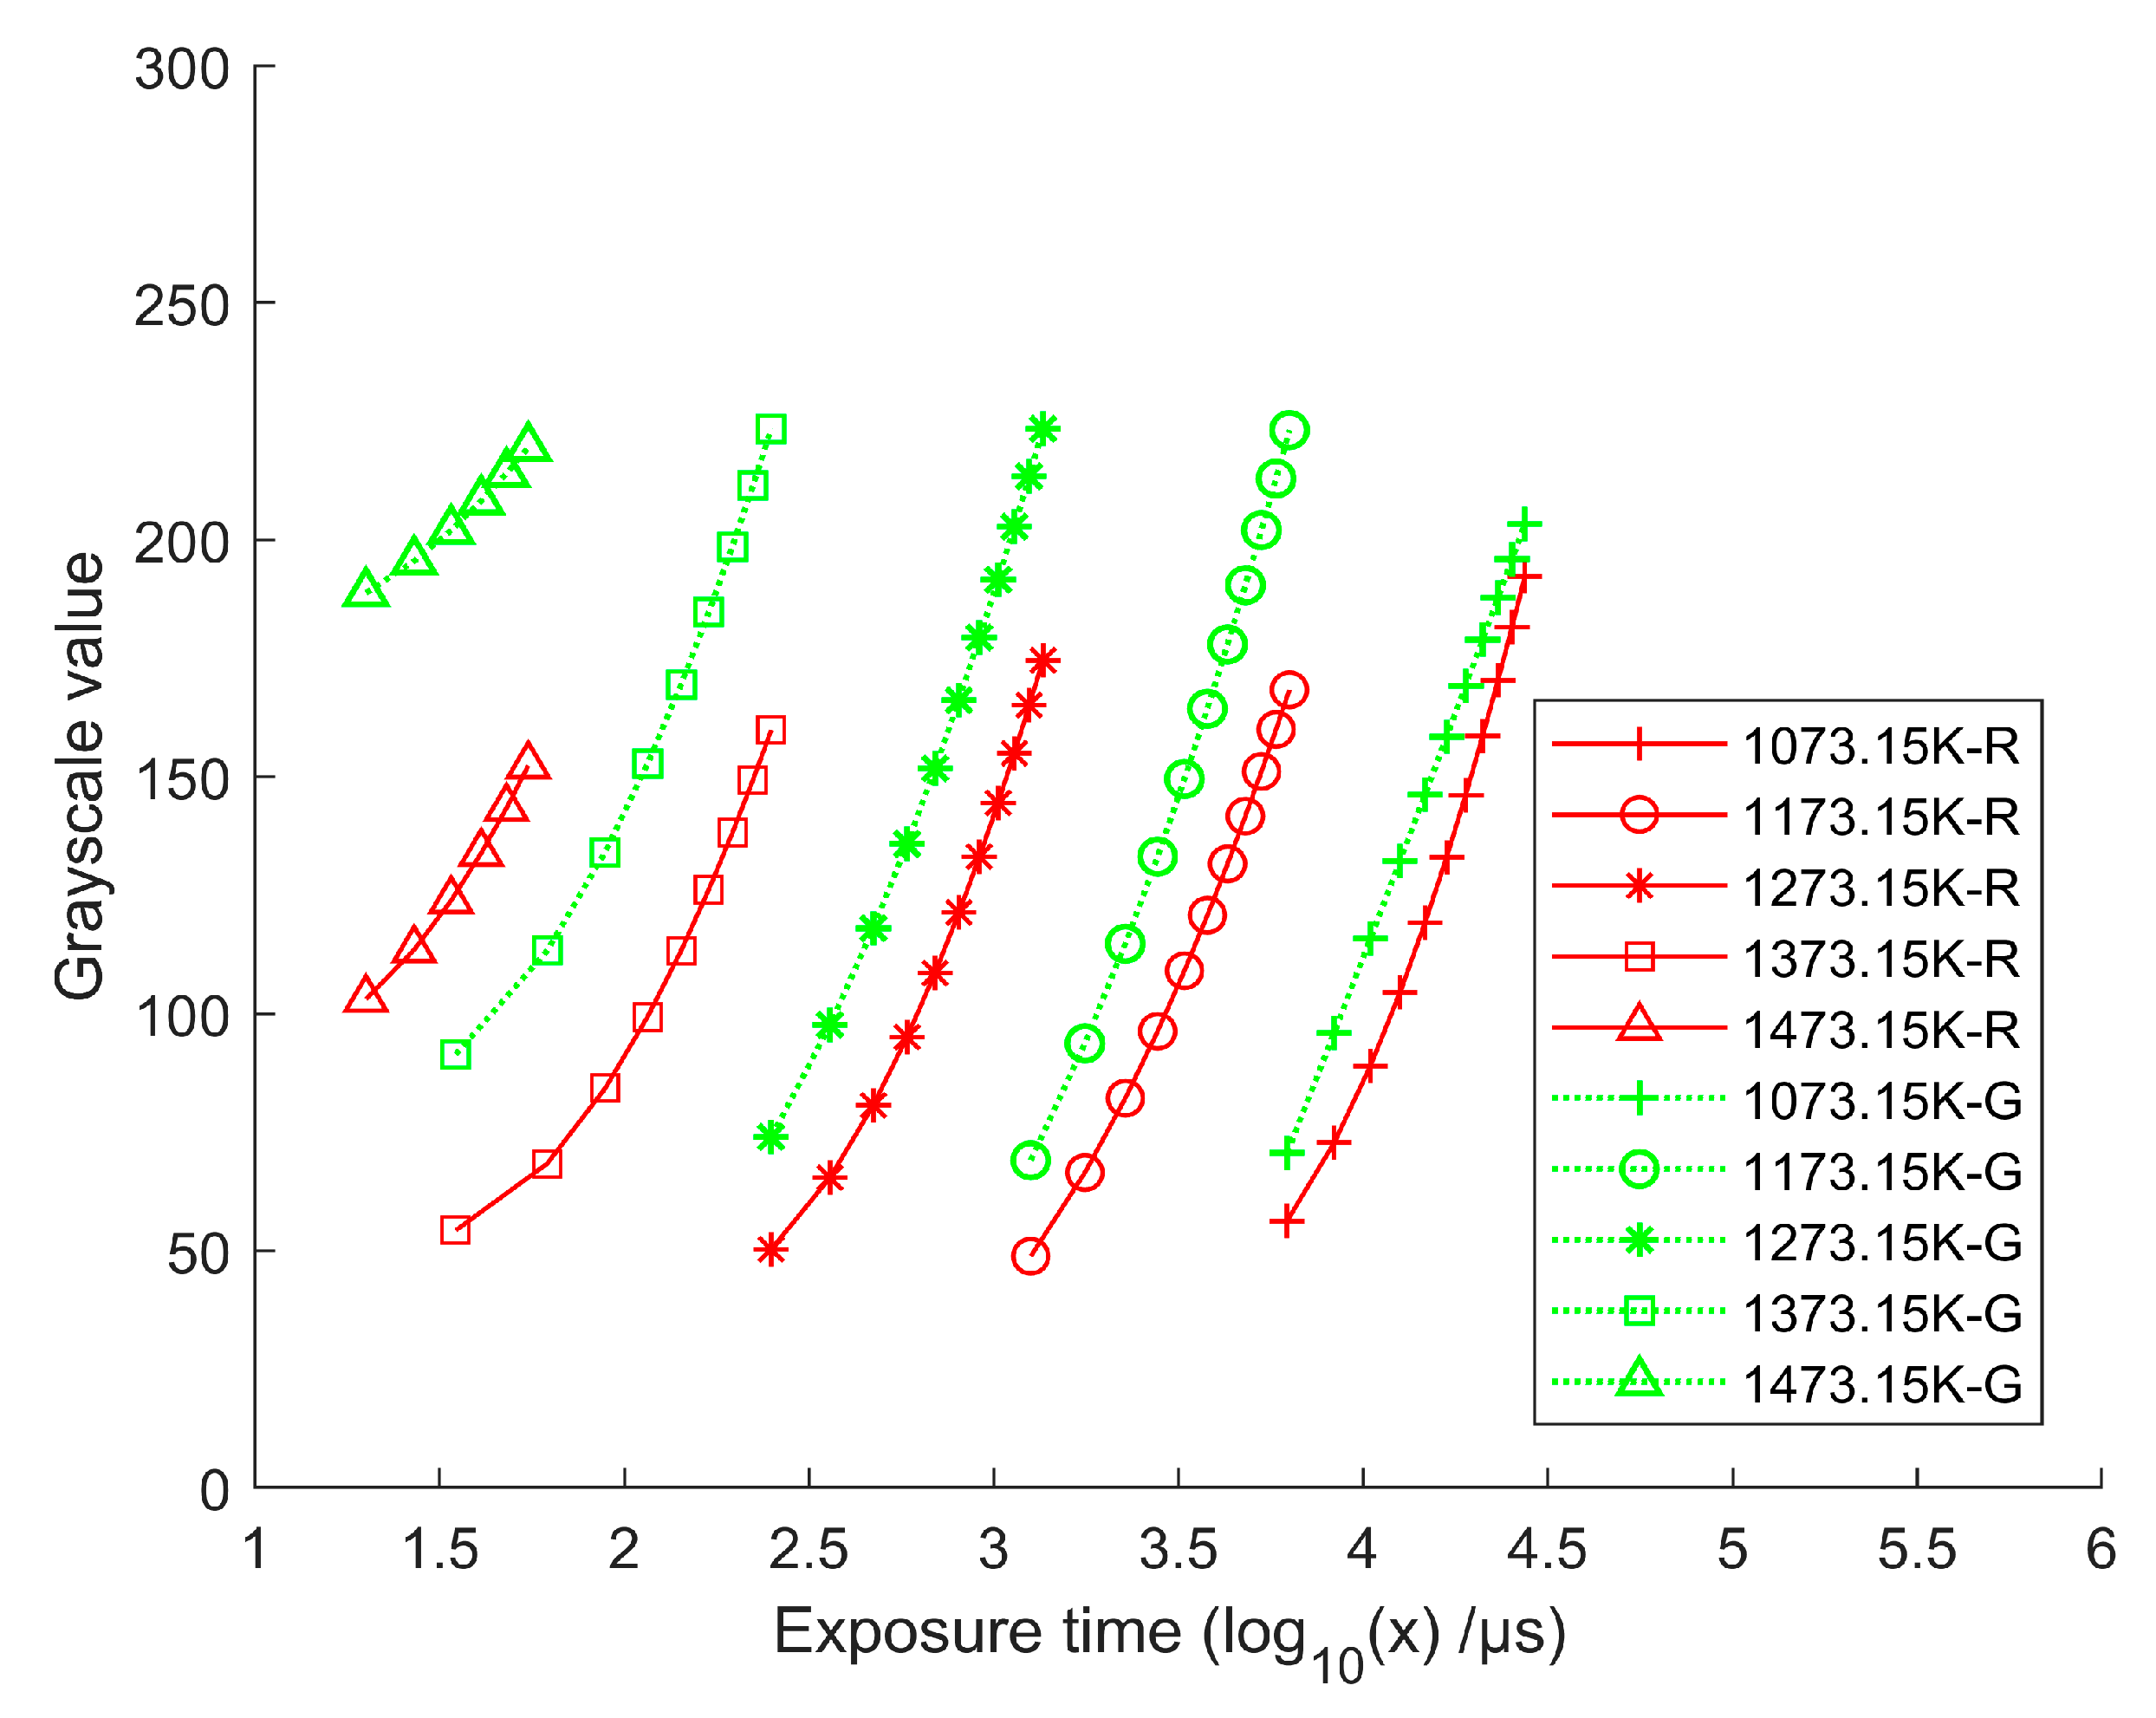
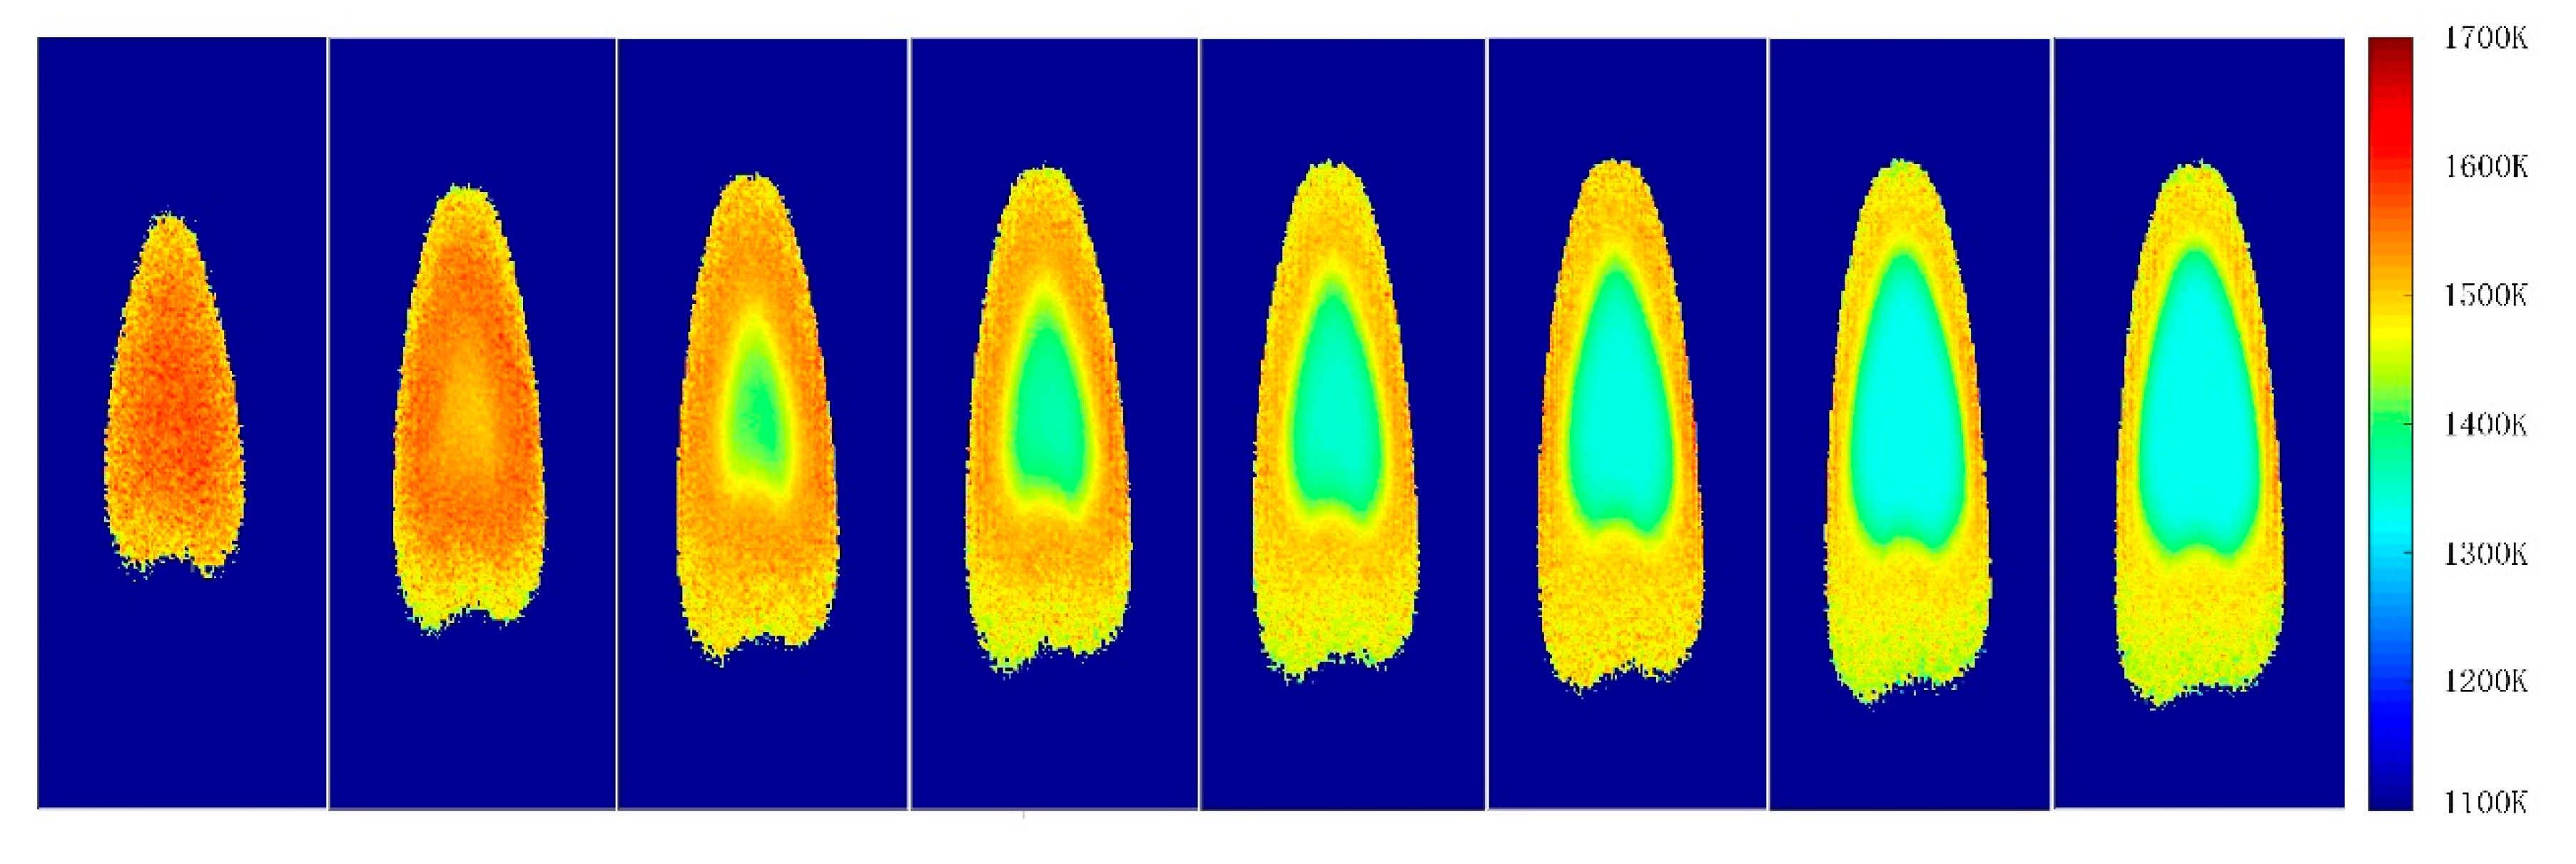
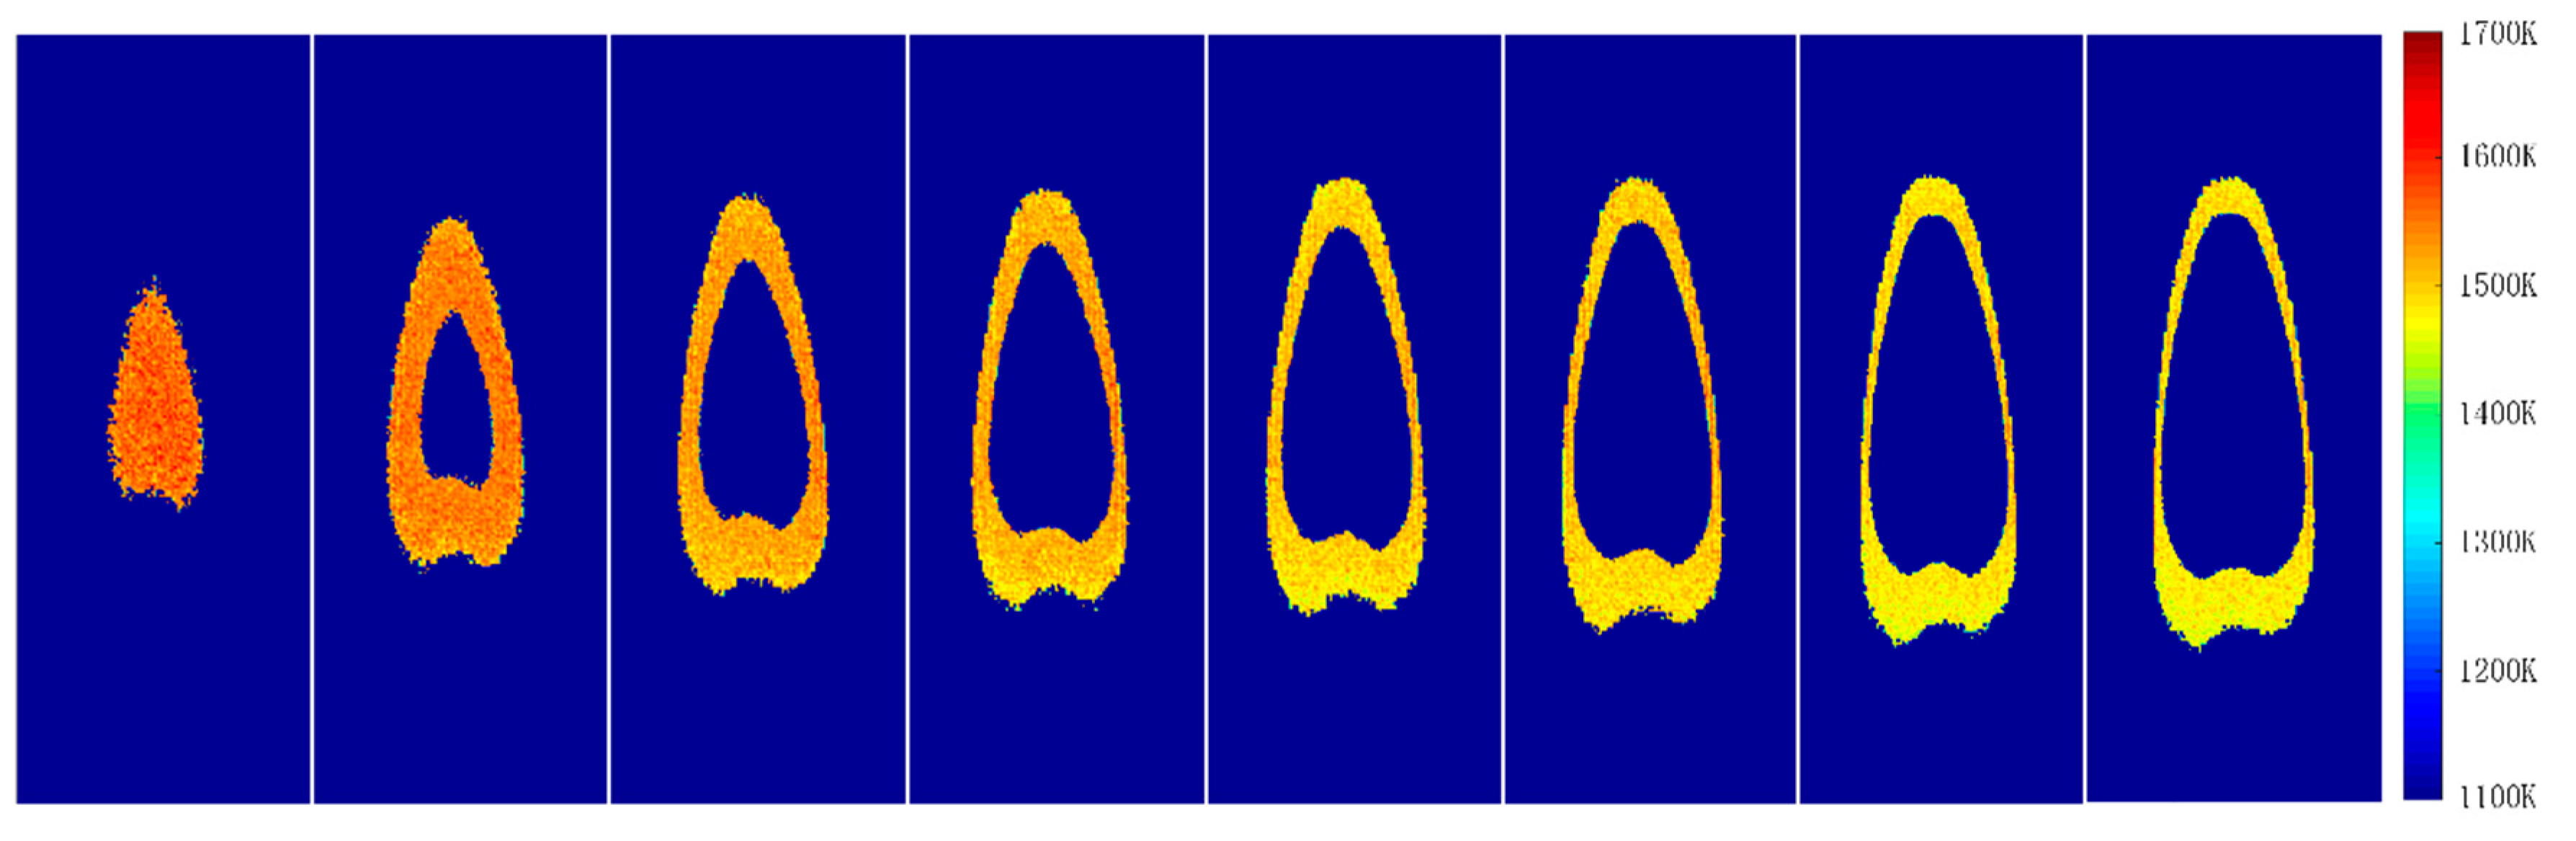
  • According to our previous experimental researches and other literature, the optimal pixel gray range is determined to be 50 to 220, which can ensure the accuracy of the two-color pyrometry.
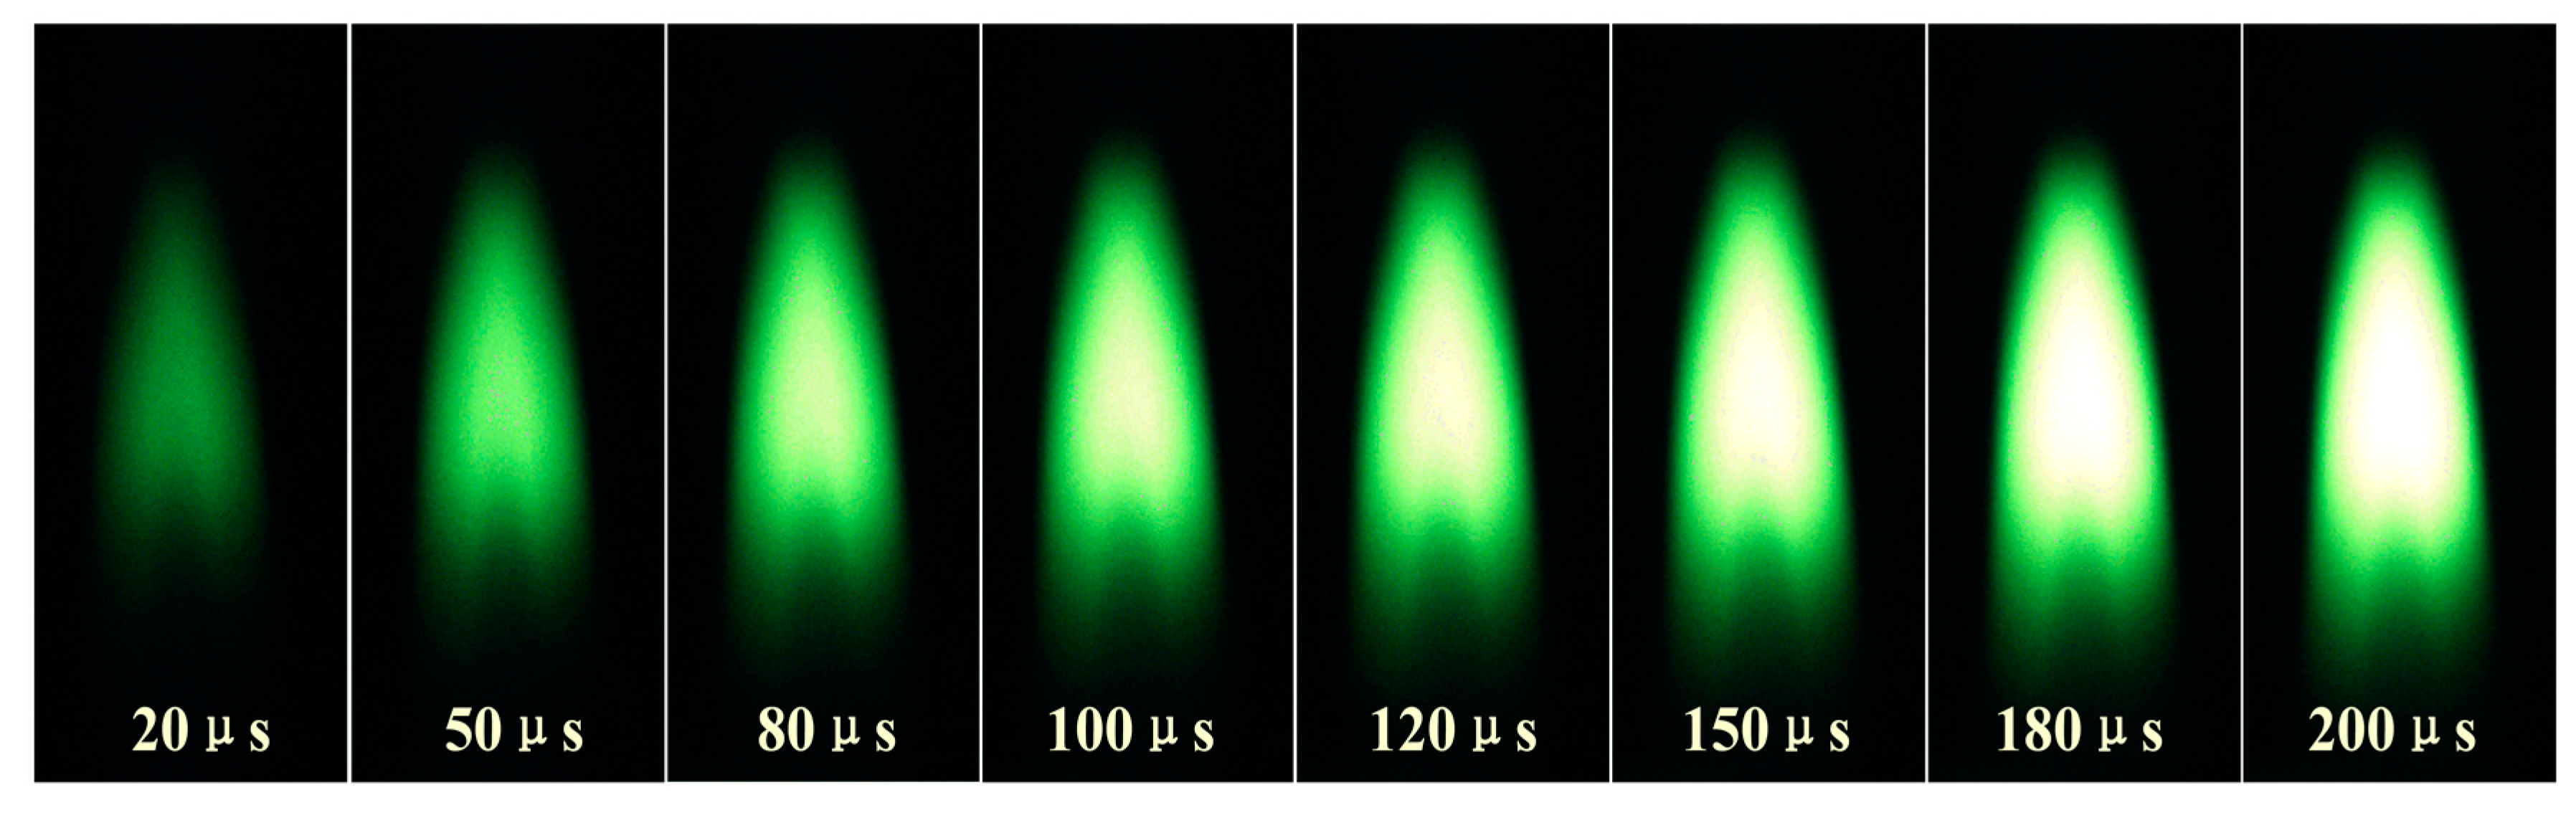
  • Through the relationship between the exposure time and the radiation intensity (image pixel gray value) under different temperatures, the appropriate exposure intervals in different flame temperatures are determined, which ensures that overexposure and underexposure will not appear in the selected areas of the flame images.
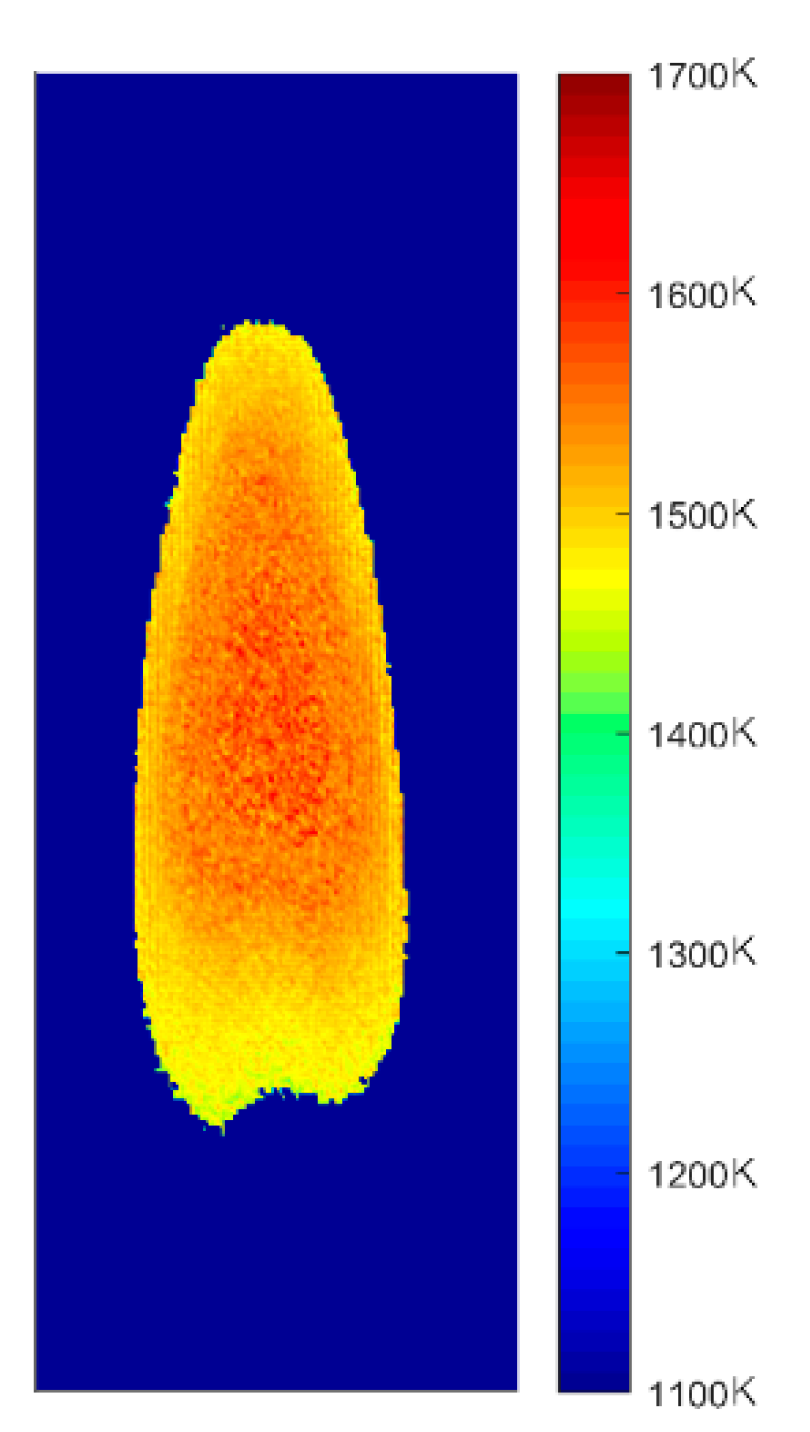
  • Flame images with different exposures were collected and effective measurement areas were extracted by means of threshold segmentation. Image fusion was performed to obtain the complete two-dimensional flame temperature distribution.
  • This method has been proved to be effective in two-dimensional flame temperature distribution, which provides a foundation for applying the method in accurate three-dimensional flame temperature field reconstruction.

Author Contributions

Conceptualization, M.K. and L.S.; methodology, M.K.; validation, H.H., J.Z. and D.W.; formal analysis, B.H.; resources, M.K. and L.S.; data curation, J.Z., D.W., and B.H.; writing—original draft preparation, H.H.; writing—review and editing, L.S. and H.H.; funding acquisition, M.K., and L.S. All authors have read and agreed to the published version of the manuscript.

Funding

This research was funded by the National Natural Science Foundation of China (51874264, 51476154, 51404223).

Conflicts of Interest

The authors declare no conflict of interest.

References

  1. Ohtake, K.; Okazaki, K. Optical CT measurement and mathematical prediction of multi-temperature in pulverized coal combustion field. Int. J. Heat Mass Transf. 1988, 31, 397–405. [Google Scholar] [CrossRef]
  2. Stasio, S.D.; Massoli, P. Influence of the soot property uncertainties in temperature and volume-fraction measurements by two-colour pyrometry. Meas. Sci. Technol. 1999, 5, 1453–1465. [Google Scholar] [CrossRef]
  3. Hirano, T.; Ishizuka, S.; Tsuruda, T.; Tanaka, R.; Hasegawa, T.; Mochida, S. The potential of visualization for studies on flames and furnaces. Fuel 1994, 73, 1697–1705. [Google Scholar] [CrossRef]
  4. Lu, G.; Yan, Y.; Riley, G.; Bheemul, H.C. Concurrent measurement of temperature and soot concentration of pulverized coal flames. IEEE Trans. Instrum. Meas. 2002, 51, 990–995. [Google Scholar]
  5. Wang, F.; Wang, X.J.; Ma, Z.Y.; Yan, J.H.; Chi, Y.; Wei, C.Y.; Ni, M.J.; Cen, K.F. The research on the estimation for the NOx emissive concentration of the pulverized coal boiler by the flame image processing technique. Fuel 2002, 81, 2113–2120. [Google Scholar] [CrossRef]
  6. Kurihara, N.; Nishikawa, M.; Watanabe, A.; Satoh, Y.; Ohtsuka, K.; Miyagaki, H.; Higashi, T.; Masai, T. A combustion diagnosis method for pulverized coal boilers using flame-image recognition technology. IEEE Trans. Energy Convers. 1986, 2, 99–103. [Google Scholar] [CrossRef]
  7. Liu, D.; Yan, J.; Wang, F.; Huang, Q.; Yong, C.; Cen, K. Experimental reconstructions of flame temperature distributions in laboratory-scale and large-scale pulverized-coal fired furnaces by inverse radiation analysis. Fuel 2012, 93, 397–403. [Google Scholar] [CrossRef]
  8. Zhou, H.C.; Lou, C.; Cheng, Q.; Jiang, Z.; He, J.; Huang, B. Experimental investigations on visualization of three-dimensional temperature distributions in a large-scale pulverized-coal-fired boiler furnace. Proc. Combust. Institute 2005, 30, 1699–1706. [Google Scholar] [CrossRef]
  9. Wang, H.J.; Huang, Z.F.; Wang, D.D.; Luo, Z.X.; Sun, Y.P.; Fang, Q.Y. Measurements on flame temperature and its 3D distribution in a 660 MWe arch-fired coal combustion furnace by visible image processing and verification by using an infrared pyrometer. Meas. Sci. Technol. 2009, 20, 1–12. [Google Scholar]
  10. Yan, W.J.; Zhou, H.C.; Jiang, Z.W.; Lou, C.; Zhang, X.K.; Chen, D.L. Experiments on measurement of Temperature and Emissivity of Municipal Solid Waste (MSW) combustion by spectral analysis and image processing in visible spectrum. Energy Fuels 2013, 27, 6754–6762. [Google Scholar] [CrossRef]
  11. Shimoda, M.; Sugano, A.; Kimura, T.; Watanabe, Y.; Ishiyama, K. Prediction method of unburnt carbon for coal fired utility boiler using image processing technique of combustion flame. IEEE Trans. Energy Convers. 1990, 5, 640–645. [Google Scholar] [CrossRef]
  12. Zhou, H.C.; Lou, X.S.; Yin, H.L.; Deng, Y.K.; Sun, G.J. Study on application of monochromatic flame image processing technique in combustion monitoring and control of boilers. Autom. Electr. Power Syst. 1996, 10, 18–22. [Google Scholar]
  13. Zhou, H.C.; Han, S.D.; Deng, C.G. Comparative study on two radiative temperature image monitoring methods and assessments for their applicability. Proc. CSEE 2002, 22, 109–114. [Google Scholar]
  14. Jiang, Z.W.; Luo, Z.X.; Zhou, H.C. A simple measurement method of temperature and emissivity of coal-fired flames from visible radiation image and its application in a CFB boiler furnace. Fuel 2009, 2, 108–111. [Google Scholar] [CrossRef]
  15. Sun, Y.P.; Lou, C.; Jiang, Z.W.; Zhou, H.C. Experimental research of representative wavelengths of tricolor for color CCD camera. Huazhong Univ. Sci. Technol. 2009, 37, 108–111. [Google Scholar]
  16. Panagiotou, T.; Levendis, Y. Measuremnet of particle flame temperature using three-color optical pyrometry. Combust. Flame 1996, 104, 272–287. [Google Scholar] [CrossRef]
  17. Yamashita, S.; Yamamoto, M.; Shinozaki, K.; Kadoi, K.; Mitsui, K.; Usui, H. In-situ temperature measurement using a multi-sensor camera during laser welding. Q. J. Jpn. Weld. Soc. 2015, 33, 93–97. [Google Scholar] [CrossRef] [Green Version]
  18. Huang, Y.; Yan, Y.; Riley, G. Vision-based measurement of temperature distribution in a 500-kW model furnace using the two-colour method. Measurement 2000, 28, 175–183. [Google Scholar] [CrossRef]
  19. Xu, Y.; Li, S.Q.; Yuan, Y.; Yao, Q. Measurement on the surface temperature of dispersed chars in a flat-flame burner using modified RGB pyrometry. Energy Fuels 2016, 31, 2228–2235. [Google Scholar] [CrossRef]
  20. Sun, Y.; Peng, X.Q.; Song, Y.B. Radiation image filtering and segmentation in CCD-based colorimetric thermometry. J. Image Graph. 2017, 22, 20–28. [Google Scholar]
  21. Shao, L.C.; Zhou, Z.J.; Ji, W.; Guo, L.Z.; Chen, L.P.; Liu, B.; Tao, Y.J. Improvement and verification of two-color pyrometry by setting exposure time respectively. Therm. Power Gener. 2018, 47, 30–36. [Google Scholar]
  22. Yan, W.J.; Li, X.Y.; Huang, X.L.; Yu, L.B.; Lou, C.; Chen, Y.M. Online measurement of the flame temperature and emissivity during biomass volatile combustion using spectral thermometry and image thermometry. Energy Fuels 2019, 34, 907–919. [Google Scholar] [CrossRef]
  23. Yan, W.J.; Panahi, A.; Lenvendis, Y.A. Spectral emissivity and temperature of heated surfaces based on spectrometry and digital thermal imaging—Validation with thermocouple temperature measurements. Experaure Therm. Fkuid Sci. 2019, 112, 110017. [Google Scholar] [CrossRef]
  24. Li, T.J.; Zhang, C.X.; Yuan, Y.; Shuai, Y.; Tan, H.P. Flame temperature estimation from light field image processing. Appl. Opt. 2018, 57, 7259–7265. [Google Scholar] [CrossRef] [PubMed]
  25. Deng, C.W.; Liu, X.; Chanussot, J.; Xu, Y.; Zhao, B.J. Towards perceptual image fusion: A novel two-layer framework. Elsevier 2020, 57, 102–114. [Google Scholar] [CrossRef]
  26. Liu, Y.; Chen, X.; Ward, R.K.; Wang, Z.J. Image fusion with convolutional sparse representation. IEEE Signal Process. Lett. 2016, 23, 1882–1886. [Google Scholar] [CrossRef]
  27. Yan, W.Z.; Sun, Q.S.; Sun, H.J.; Li, Y.M. Joint dimensionality reduction and metric learning for image set classification. Elsevier Sci. 2020, 516, 109–124. [Google Scholar] [CrossRef]
  28. Kang, X.D.; Duan, P.H.; Li, S.T. Hyperspectral image visualization with edge-preserving filtering and principal component analysis. Elsevier 2019, 57, 130–143. [Google Scholar] [CrossRef]
  29. Alhichri, H.S.; Kamel, M. Image registration using virtual circles and edge direction. In Proceedings of the International Conference on Pattern Recognition IEEE, Quebec, Canada, 11–15 August 2002. [Google Scholar]
  30. Wang, Z.J.; Ziou, D.; Armenakis, C.; Li, D.R.; Li, Q.Q. A comparative analysis of image fusion methods. IEEE Trans. Geosci. Remote Sens. 2005, 43, 1391–1402. [Google Scholar] [CrossRef]
  31. Daily, M.I.; Farr, T.; Elachi, C. Geologic interpretation from composited radar and Landsat imagery. Photogramm. Eng. Remote Sens. 1979, 45, 1109–1116. [Google Scholar]
  32. Zhang, M.L.; Li, S.; Yu, F.; Tian, X. Image fusion employing adaptive spectral-spatial gradient sparse regularization in UAV remote sensing. Elsevier 2020, 170, 107434. [Google Scholar] [CrossRef]
  33. Yin, M.; Liu, X.M.; Liu, Y. Medical image fusion with parameter-adaptive pulse coupled neural network in nonsubsampled shearlet transform domain. IEEE Trans. Instrum. Meas. 2019, 68, 49–64. [Google Scholar] [CrossRef]
  34. Liu, Y.; Chen, X.; Peng, H.; Wang, Z. Multi-focus image fusion with a deep convolutional neural network. Inf. Fusion 2017, 36, 191–207. [Google Scholar] [CrossRef]
  35. Wei, C.Y.; Li, X.D.; Ma, Z.Y.; Xue, F.; Wang, F.; Yan, J.H.; Cen, K.F. Research of the numerical method of the colorimetric temperature-measurement method used in high temperature flame image process. J. Combust. Sci. Technol. 1998, 4, 88–92. [Google Scholar]
  36. Jiang, Z.W.; Zhou, H.C.; Lou, C.; Yu, Z.Q. Method of detecting flame temperature and emissivity image based on color image processing. Journal of Huazhong University of Science and Technology. Nat. Sci. 2004, 32, 49–51. [Google Scholar]
  37. Jiang, Z.W. Experimental Research on Images of Flame Temperature and Emissivity in Coal-Fired Furnace. Master’s Thesis, Huazhong University of Science and Technology, Wuhan, China, 25 April 2004. [Google Scholar]
  38. Li, S.T.; Kang, X.D.; Fang, L.Y.; Hu, J.W.; Yin, H.T. Pixel-level image fusion: A survey of the state of the art. Inf. Fusion 2016, 33, 100–112. [Google Scholar] [CrossRef]
  39. Song, M.; Gui, X.K. Spectral analysis for candle flame. Spectrosc. Spectr. Anal. 1994, 14, 68–77. [Google Scholar]
  40. Wei, C.Y.; Yan, J.H.; Shang, M.E.; Cen, K.F. Measurement of flame temperature distribution by the use if a colored array CCD (Charge-couple device) (I) the measurement of a two-dimensional projection temperature field. J. Eng. Therm. Energy Power 2002, 17, 58–61. [Google Scholar]
  41. Zheng, S.; Ni, L.; Liu, H.W.; Zhou, H.C. Measurement of the distribution of temperature and emissivity of a candle flame using hyperspectral imaging technique. Optik 2019, 183, 222–231. [Google Scholar] [CrossRef]
  42. Patel, A. Temperature Measurement of a Candle Flame Using a CCD Camera. Available online: https://www.slideserve.com/devika/temperature-measurement-of-a-candle-flame-using-a-ccd-camera (accessed on 11 October 2019).
Figure 1. Image fusion temperature measurement. (a) initial flame radiation images; (b) flame radiation images with only retained valid areas; (c) flame temperature distributions of effective temperature measurement areas; and (d) complete flame temperature distribution.
Energies 13 01487 g001
Figure 2. Schematic of the experimental system.
Energies 13 01487 g002
Figure 3. Fitting curves of monochromatic gray value and exposure time at different furnace temperatures.
Energies 13 01487 g003
Figure 4. Fitting curve of the temperature measurement coefficients and the temperatures.
Energies 13 01487 g004
Figure 5. Original flame images.
Energies 13 01487 g005
Figure 6. Original temperature distributions.
Energies 13 01487 g006
Figure 7. Temperature distributions with effective measurement areas.
Energies 13 01487 g007
Figure 8. Flame temperature distribution after image fusion.
Energies 13 01487 g008
Table 1. Reasonable exposure ranges for different furnace temperatures.
Temperature (K)Exposure Range (μs)
1073.15(6234, 27421)
1173.15(1260, 6317)
1273.15(251, 1354)
1373.15(29, 245)
1473.15(20, 55)

