Article

Impacts of Organic Structures and Inherent Minerals of Coal on Soot Formation during Pyrolysis

Institute of Combustion Engineering, Harbin Institute of Technology, Harbin 150001, Heilongjiang, China
*
Author to whom correspondence should be addressed.
Energies 2019, 12(23), 4410; https://doi.org/10.3390/en12234410
Submission received: 25 October 2019 / Revised: 12 November 2019 / Accepted: 14 November 2019 / Published: 20 November 2019

Abstract

:
The pyrolysis of four pairs of raw and acid-washed coals under N2 atmosphere was carried out in a drop tube reactor at 1250 °C. The results show that both organic structures and metal elements have an important influence on the formation of soot. The total area of aromatic and aliphatic hydrogen absorption bands is positively correlated with soot yield. Aromatic compounds have a greater contribution to soot and tar formation. The absorption band area of oxygen structures in coal FTIR spectra is negatively correlated with the soot conversion rate of tar. During pyrolysis, metal substances in coal can catalyze the dehydrogenation and deoxygenation of tar, reduce the content and stability of the aliphatic compound, and catalyze aromatic ring rupturing. More importantly, gasified metals can inhibit the polymerization reaction of aromatic compounds.

1. Introduction

When in a high-temperature environment, coal will first undergo pyrolysis. Soot is produced in the boundary layer of coal particles during pyrolysis [1]. As coal is mostly used through thermochemical reactions, soot is commonly produced in the processing of coal. Under electron microscopy, soot is generally chain-shaped and is aggregated by nearly spherical basic soot particles with a diameter of about 20–50 nm [2]. The radiation heat transfer capacity of soot is very strong, which can enhance heat transfer and greatly change the temperature distribution around coal particles [3]. Due to the small particle size, incompletely oxidized soot particles will be discharged with the exhaust gas and become one of the main sources of PM2.5 in the atmosphere [4,5]. Baltrus et al. revealed that carbon concentrates formed from bituminous coal combustion fly ash can contain up to 76% carbon and have similar properties to soot [6]. Soot, which has a strong light-absorbing effect in the atmosphere, can reduce visibility and contribute to the greenhouse effect [7]. Moreover, the surface of soot particles usually adsorbs a large number of toxic organic compounds and heavy metals, which enter the human body with soot and endanger health [8,9,10].
Soot is produced by secondary pyrolysis of coal volatiles. Its main precursor is tar (especially polycyclic aromatic compounds), which releases during coal primary pyrolysis [11]. The formation of soot from coal involves much more complex components and undergoes a much more complex process than simple gaseous hydrocarbon fuels. Coal tar produced by coal primary pyrolysis is considered to be the main precursor of coal-derived soot. The composition and structure of these tars are complex and variable, which makes the formation of soot in the coal pyrolysis process very different from that of gaseous fuel [12]. Wornat et al. [13] studied the production and composition changes of soot and PAC (polycyclic aromatic compounds, which are the main component of coal tar) using a drop tube reactor at different temperatures (1130~1480 K) and residence time. They reported that with the aggravation of secondary pyrolysis, the complexity of PAC components is lower and the stability increases and with the increase of temperature and residence time, the yield of soot gradually increases while the yield of PAC gradually decreases, but the sum of the two yields maintains a relatively stable value. The same results were also obtained by Nenniger [14] under similar experimental conditions, indicating that PAC is the main precursor of soot generated by coal pyrolysis. Ma [15,16] and Zhang [17] studied coal-derived soot formation in a flue-gas environment generated by a flat-flame burner. In contrast to the experimental result observed by Wornat [13] and Nenniger [14], the yield of coal-derived soot produced in the flue-gas environment is lower than the inert atmosphere, this may due to the reaction of tar molecules and even soot with oxygen-containing components (H2O, OH, O etc.) in a flue-gas environment.
Both organic and inorganic structures of coal affect the pyrolysis products. Seeker [1] and [18] both used high-speed camera technology to study the formation of soot in the combustion process of single coal particles. The results showed that the formation of soot could not be observed in the combustion process of anthracite with a low volatile content, while lignite with a high volatile content has no initial soot particles generated in the vicinity of coal particles due to its low content of macromolecular heavy hydrocarbons in the volatile matter. Zeng et al. [19] carried out high-temperature pyrolysis experiments of seven kinds of coal in the nitrogen-carrying stream to study the secondary pyrolysis of coal tar. They suggest that the sooting propensities of coal tar generated by higher rank coal are stronger. However, the tar+soot yield of seven kinds of coal is not consistent with the rank of coal. In addition to organic structure, inherent metallic species in coal can also affect the formation of soot. A wealth of research has shown that inherent metal elements have an important influence on the yield and composition of tar released during coal primary pyrolysis [20,21,22,23,24], so they can also affect the yield of soot generated by the secondary pyrolysis of tar. Furthermore, the same as soot, the physical and chemical changes of gasified metal also occur near coal particles [25]. In the study of hydrocarbon flame and diesel engines, it is found that gaseous metals can affect the formation of soot and tar [26,27]. Therefore, these gasified metals, especially alkali metals and alkaline earth metals, may also affect the sooting process of coal tar. In the study of the role of Na in the formation of soot during coal pyrolysis and combustion, Xiao et al. [28] found that Na can affect the yield and particle size distribution of coal-derived soot.
It can be seen from the foregoing discussion that the analysis of influencing factors on the formation of coal-derived soot is mostly limited to temperature, residence time, coal rank, and other relatively elementary content. The understanding of the influence of organic structures and inherent minerals on the formation of soot derived from coal is not enough. In this paper, the pyrolysis comparison experiment between acid-washed coal and raw coal is carried out in a drop tube reactor. The yields and particle size distributions (PSDs) of the solid secondary pyrolysis products (soot and tar) and its Fourier transform infrared spectroscopy (FTIR) spectra are analyzed to explore the relationship between coal chemical structure (FTIR parameters and inherent metal content) and its soot generation characteristics.

2. Experiment

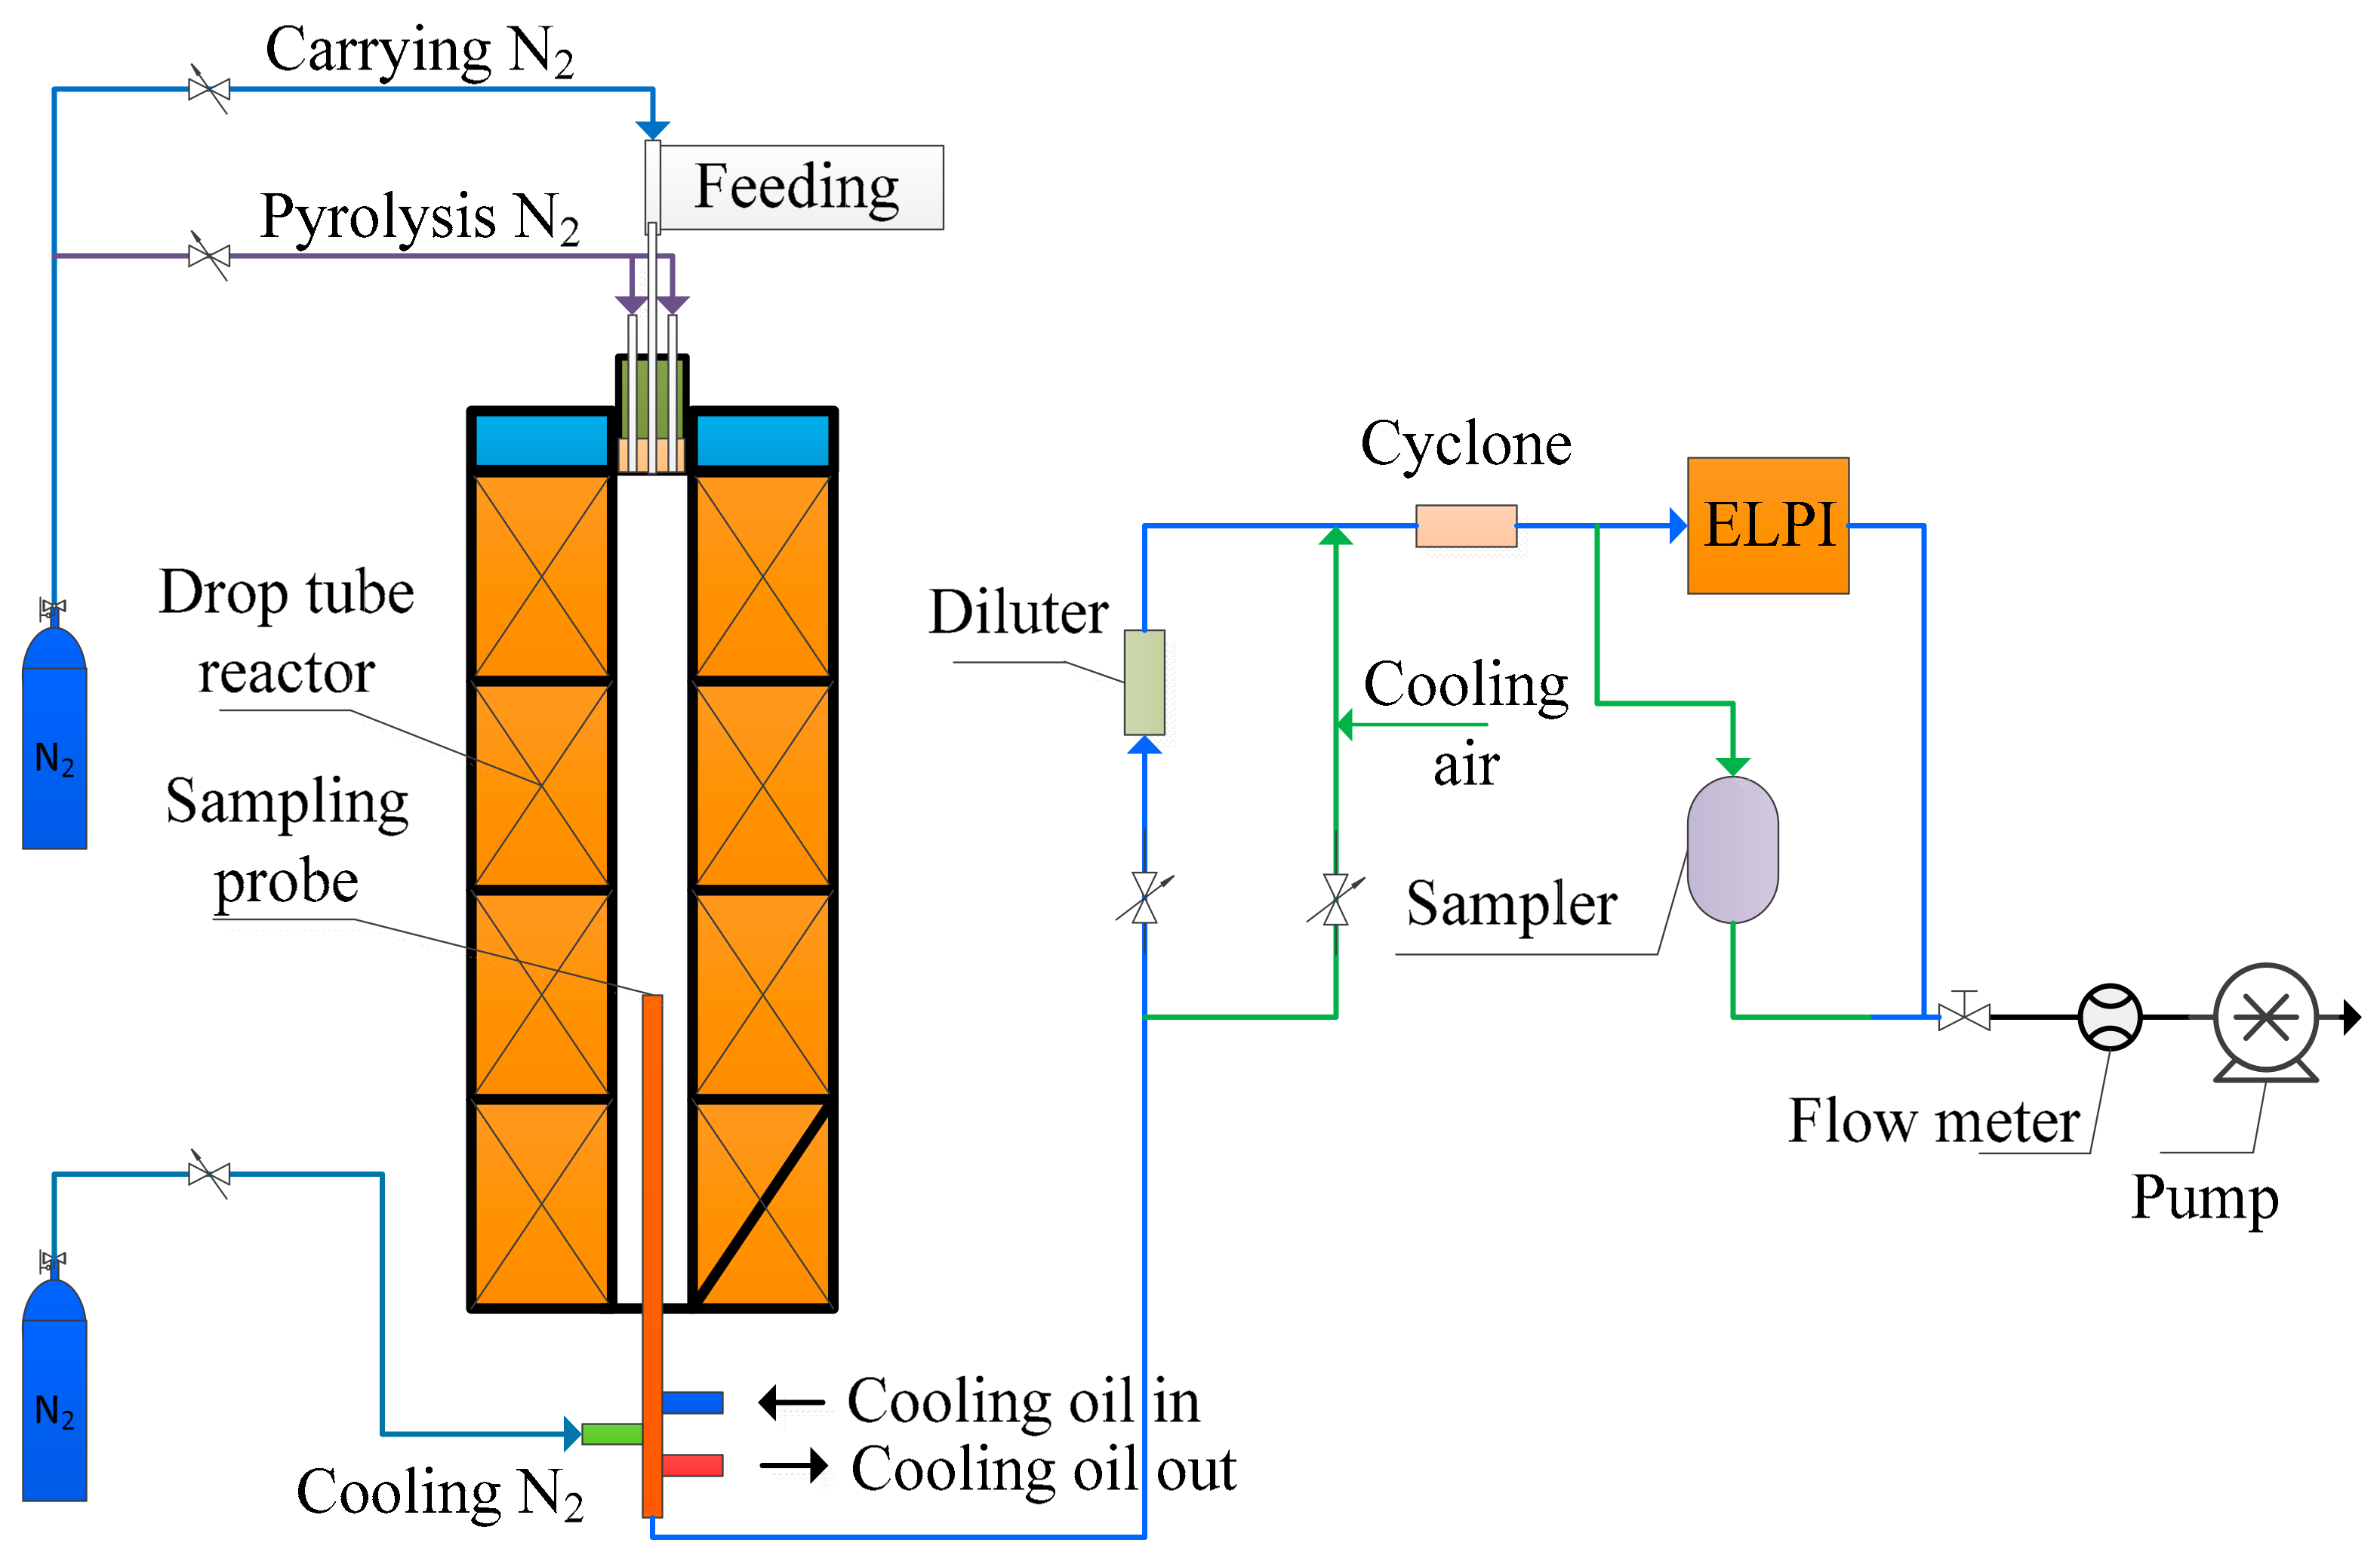
2.1. Experimental System

The pyrolysis of coals was performed in a drop tube reactor (DTR) at 1250 °C. The schematic diagram of the DTR experimental system is illustrated in Figure 1. Corundum tubes with a length of 2000 mm and an internal diameter of 80 mm are used as central tubes of DTR. As shown in Figure 1, the central corundum tube is heated in four stages using molybdenum silicide bars in the DTR. The temperature was measured and controlled by inserting an S-type platinum-rhodium thermocouple at the intermediate position of each heating section. Before the coal pyrolysis experiment, a secondary thermocouple (length 2000 mm) that has been calibrated by the muffle furnace was inserted into the corundum tube to calibrate the error of four temperature measuring thermocouples to ensure a long and stable 1250 °C constant temperature zone in the center tube.
Atmospheric pressure N2 was used as the carrier gas and secondary gas. Pulverized coal was continuously fed together with the carrier N2 (1 L min−1) from an injection type micro powder feeder into DTR through an air-cooled feeding probe at a rate of 100 mg min−1. The secondary N2 was fed at a rate of 9 L min−1 from the top of the reactor to provide an inert atmosphere.
The pyrolysis gas in the reactor is extracted from DTR by an oil-cooled and nitrogen-quenched sampling probe. The sampling muzzle is 1800 mm away from the top of the reactor. An electrical low-pressure impactor (ELPI) and a sampler were used to measure the PSDs of particulate matter and collect the particulate matter (a mixture of tar and soot) in the pyrolysis gas, respectively. To meet the requirements of ELPI measurement, pyrolysis gas is diluted by nitrogen injected at the inlet of the sampling tube, and then re-diluted by pure air through a diluent. All samples except SLH (Shengli coal) were diluted 40 times. Due to the high concentration of SLH particles in the third and fourth channels of ELPI, 50 times dilution is used. Tests on YMH (Yimin coal) at 40, 45, and 50 times dilutions showed that the change in dilution ratio between 40 and 50 had a negligible effect on the measurement of particle concentration distribution. The sampler is equipped with a cooling system to condense tar in pyrolysis gas by mixing pyrolysis gas with filtered air cooled by the ice water mixture. Glass fiber filter was used to collect solid tar and soot. Before entering the ELPI or the sampler, the pyrolysis gas would flow through a pre-separation cyclone at a speed of 10 L/min to remove large char particles.

2.2. Samples Analysis

Dichloromethane was used as an extracting agent to separate soot and tar for their respective yields. A certain amount of samples collected by the sampler were added to dichloromethane at a ratio of 1 mg:10 mL. The mixture was vibrated ultrasonically for 30 min to ensure that all the tar in the sample was dissolved in dichloromethane. After that, the mixture was filtered to separate soot and weighed to obtain the mass fraction of soot and tar in the sample. The yields (Y) of soot and tar can be calculated according to Equation (1) (σsoot/tar: mass fraction of soot/tar; msample: sample weight collected per minute; Mcoal: coal weight fed per minute; Ad: ash content in coal).
Y = σ s o o t / t a r × m s a m p l e M c o a l ( 1 A d )
The content of C, H, and N elements (mass fraction) in coal samples and a mixture of soot and tar (soot+tar) were measured using a CHN elemental analyzer (VARIO Macro cube). VARIO Macro cube can convert C, H, and N into CO2, H2O, and NOx, and then the content of the three elements in the sample can be obtained by measuring the three gases. Each coal sample is measured at least three times. There are not many samples of soot+tar, but at least two measurements were taken. Based on the mass fractions of C and H (Cd and Hd) in the soot+tar sample, the atomic number ratio of C to H can be calculated from Equation (2) (AMC: relative atomic mass of C; AMH: relative atomic mass of H).
C / H = C d / A M c H d / A M H
The chemical structure of the experimental coal and mixture of soot and tar was measured by an FTIR spectrometer (Nicolet model 5700) using the KBr pellet technique: The mixture of sample and KBr was ground in an agate mortar for 30 min or more to ensure uniform mixing. A 140 mg mixture was placed in a mold with an inner diameter of 13 mm and then allowed to stand at a pressure of 10 MPa for two minutes. The FTIR spectrum analysis is in Section 3.2.

2.3. Coal Samples

Two bituminous coals (Shenhua, abbreviated as SHR and Neimenggu, abbreviated as NMGR) and two brown coals (Yimin, abbreviated as YMR and Shengli, abbreviated as SLR) were used in this research. To be closer to the actual application of pulverized coal, all coals were pulverized and sized to a range from 38 to 125 μm. Table 1 lists the proximate and ultimate analysis of four raw coals.
Raw coals were treated in HCl aqueous solution (5 mol L−1) to remove acid-soluble salts and ion-exchangeable metal cations. A mixture of 50 g coal and 800 mL HCl aqueous solution was used each time. The time of HCl-washing is 5 h and the temperature is 60 °C. The contents of several main metals which have a significant impact on coal pyrolysis (Na, K, Ca, Mg, Fe) in the raw coal and HCl-washed coal (SHH, NMGH, YMH, and SLH), as shown in Table 2.

3. Results and Discussion

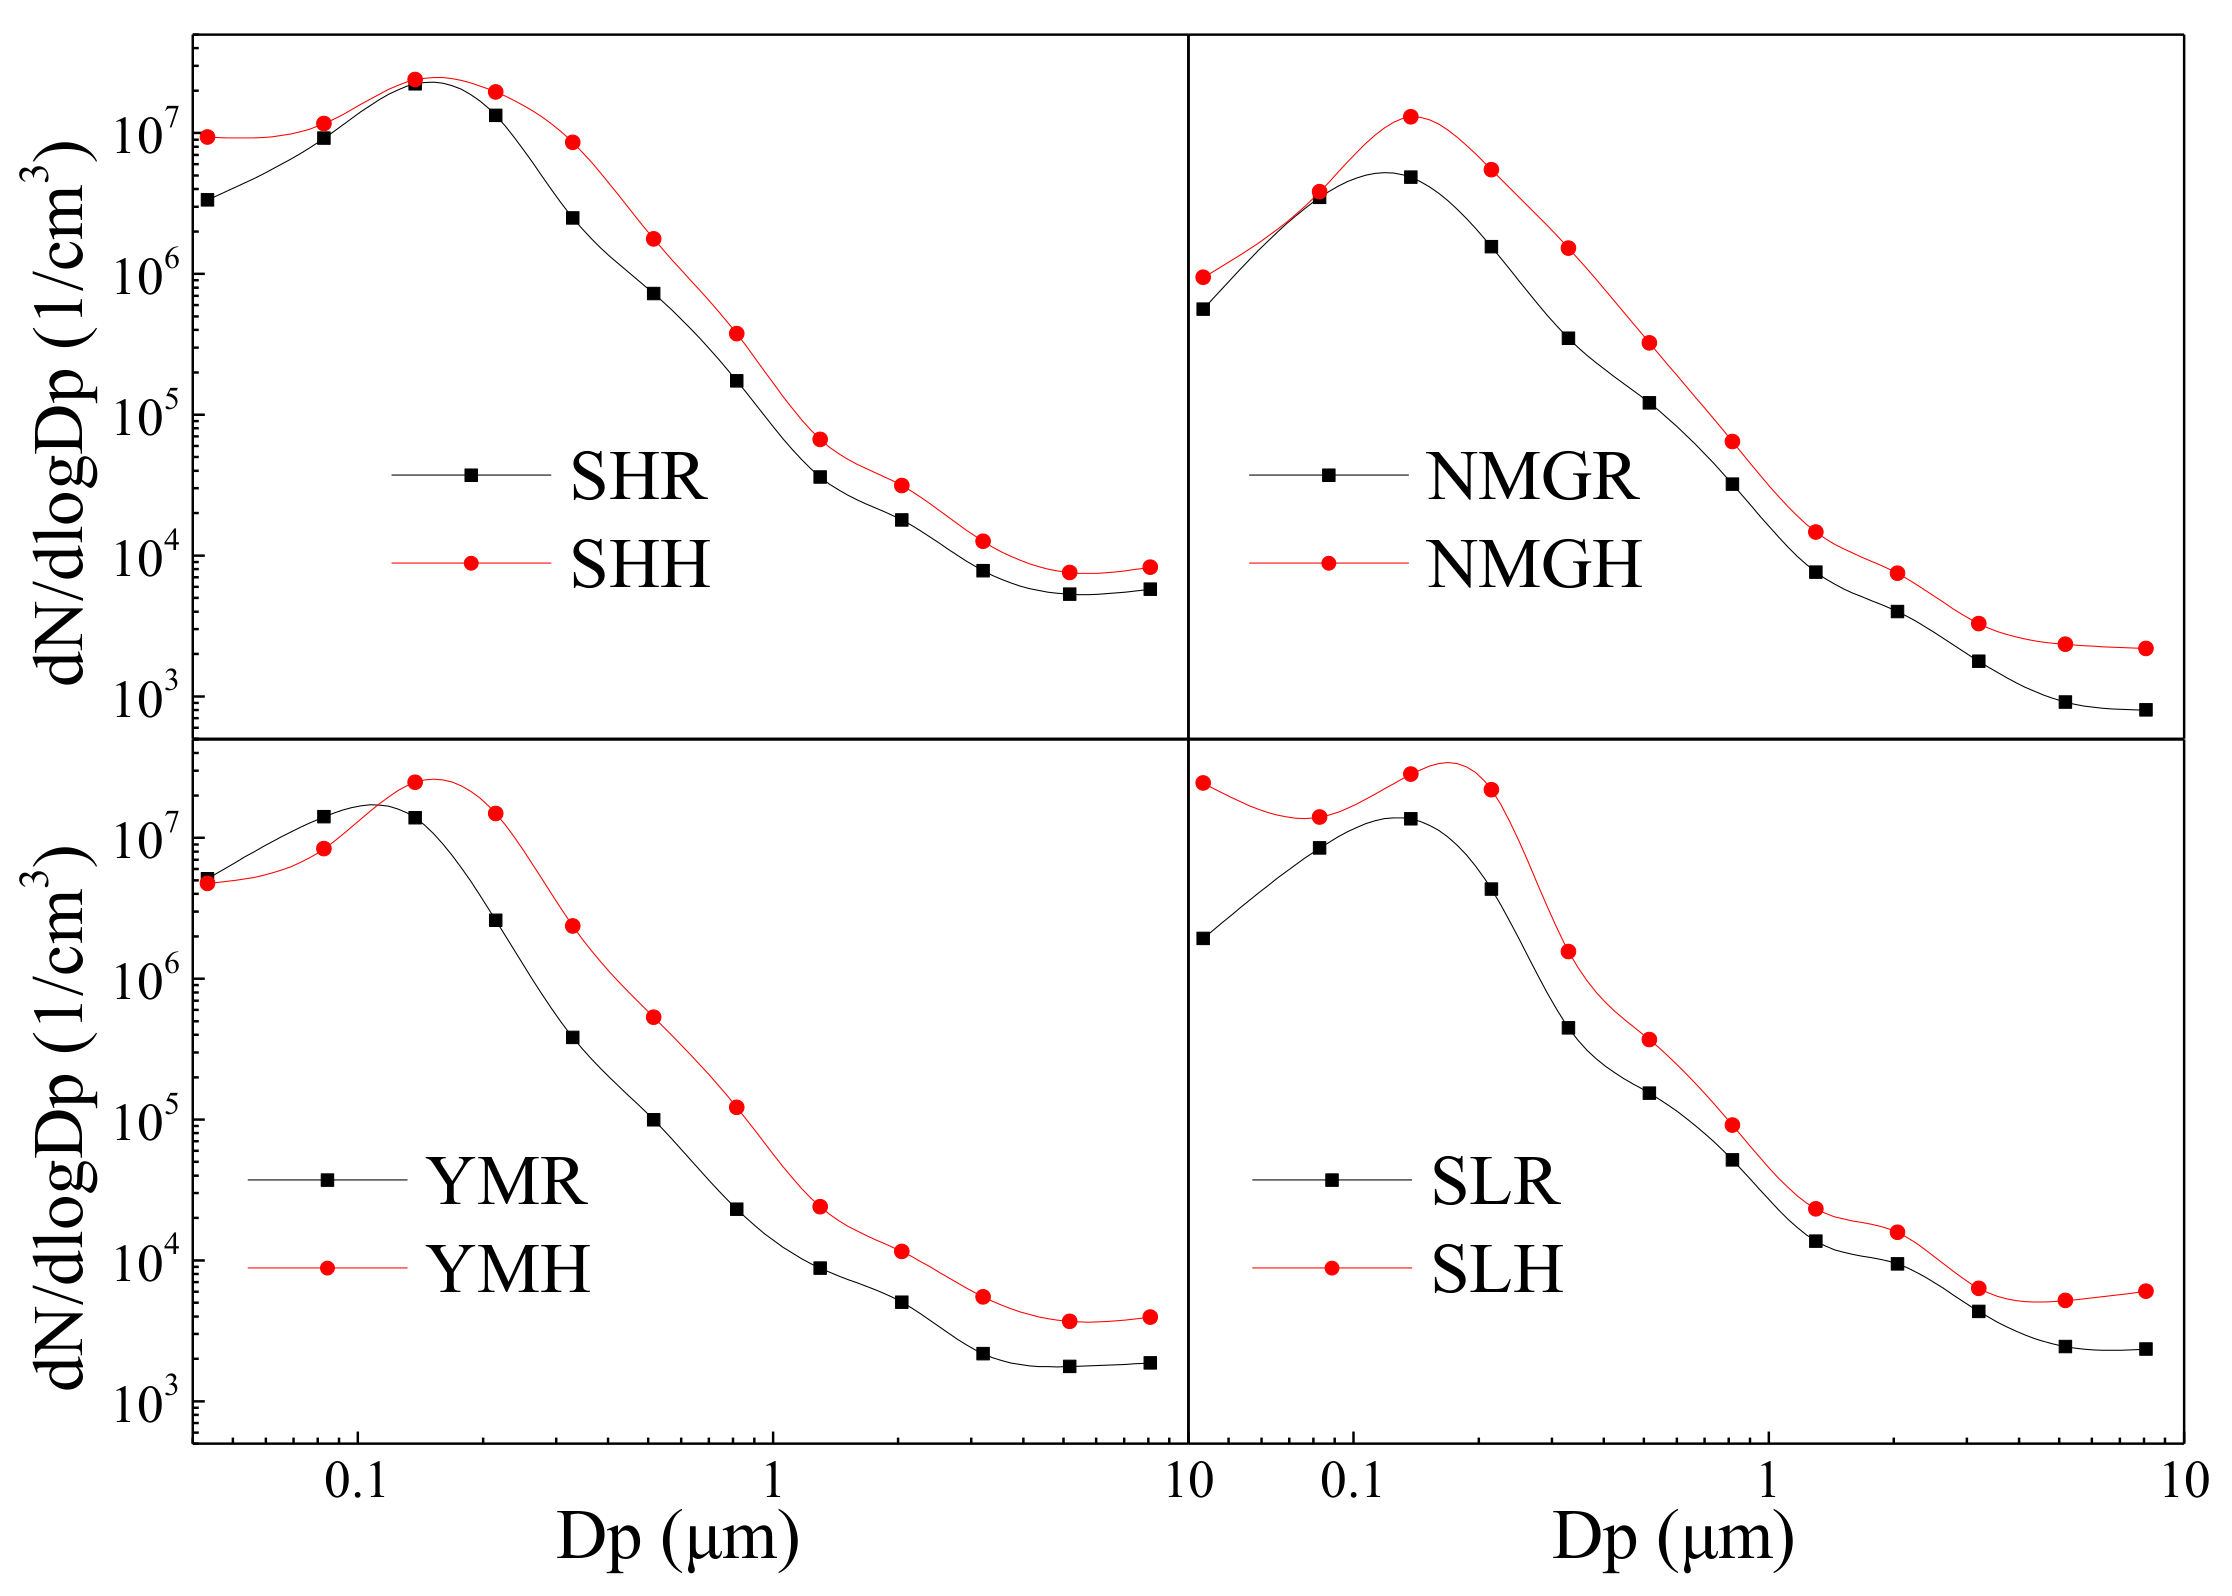
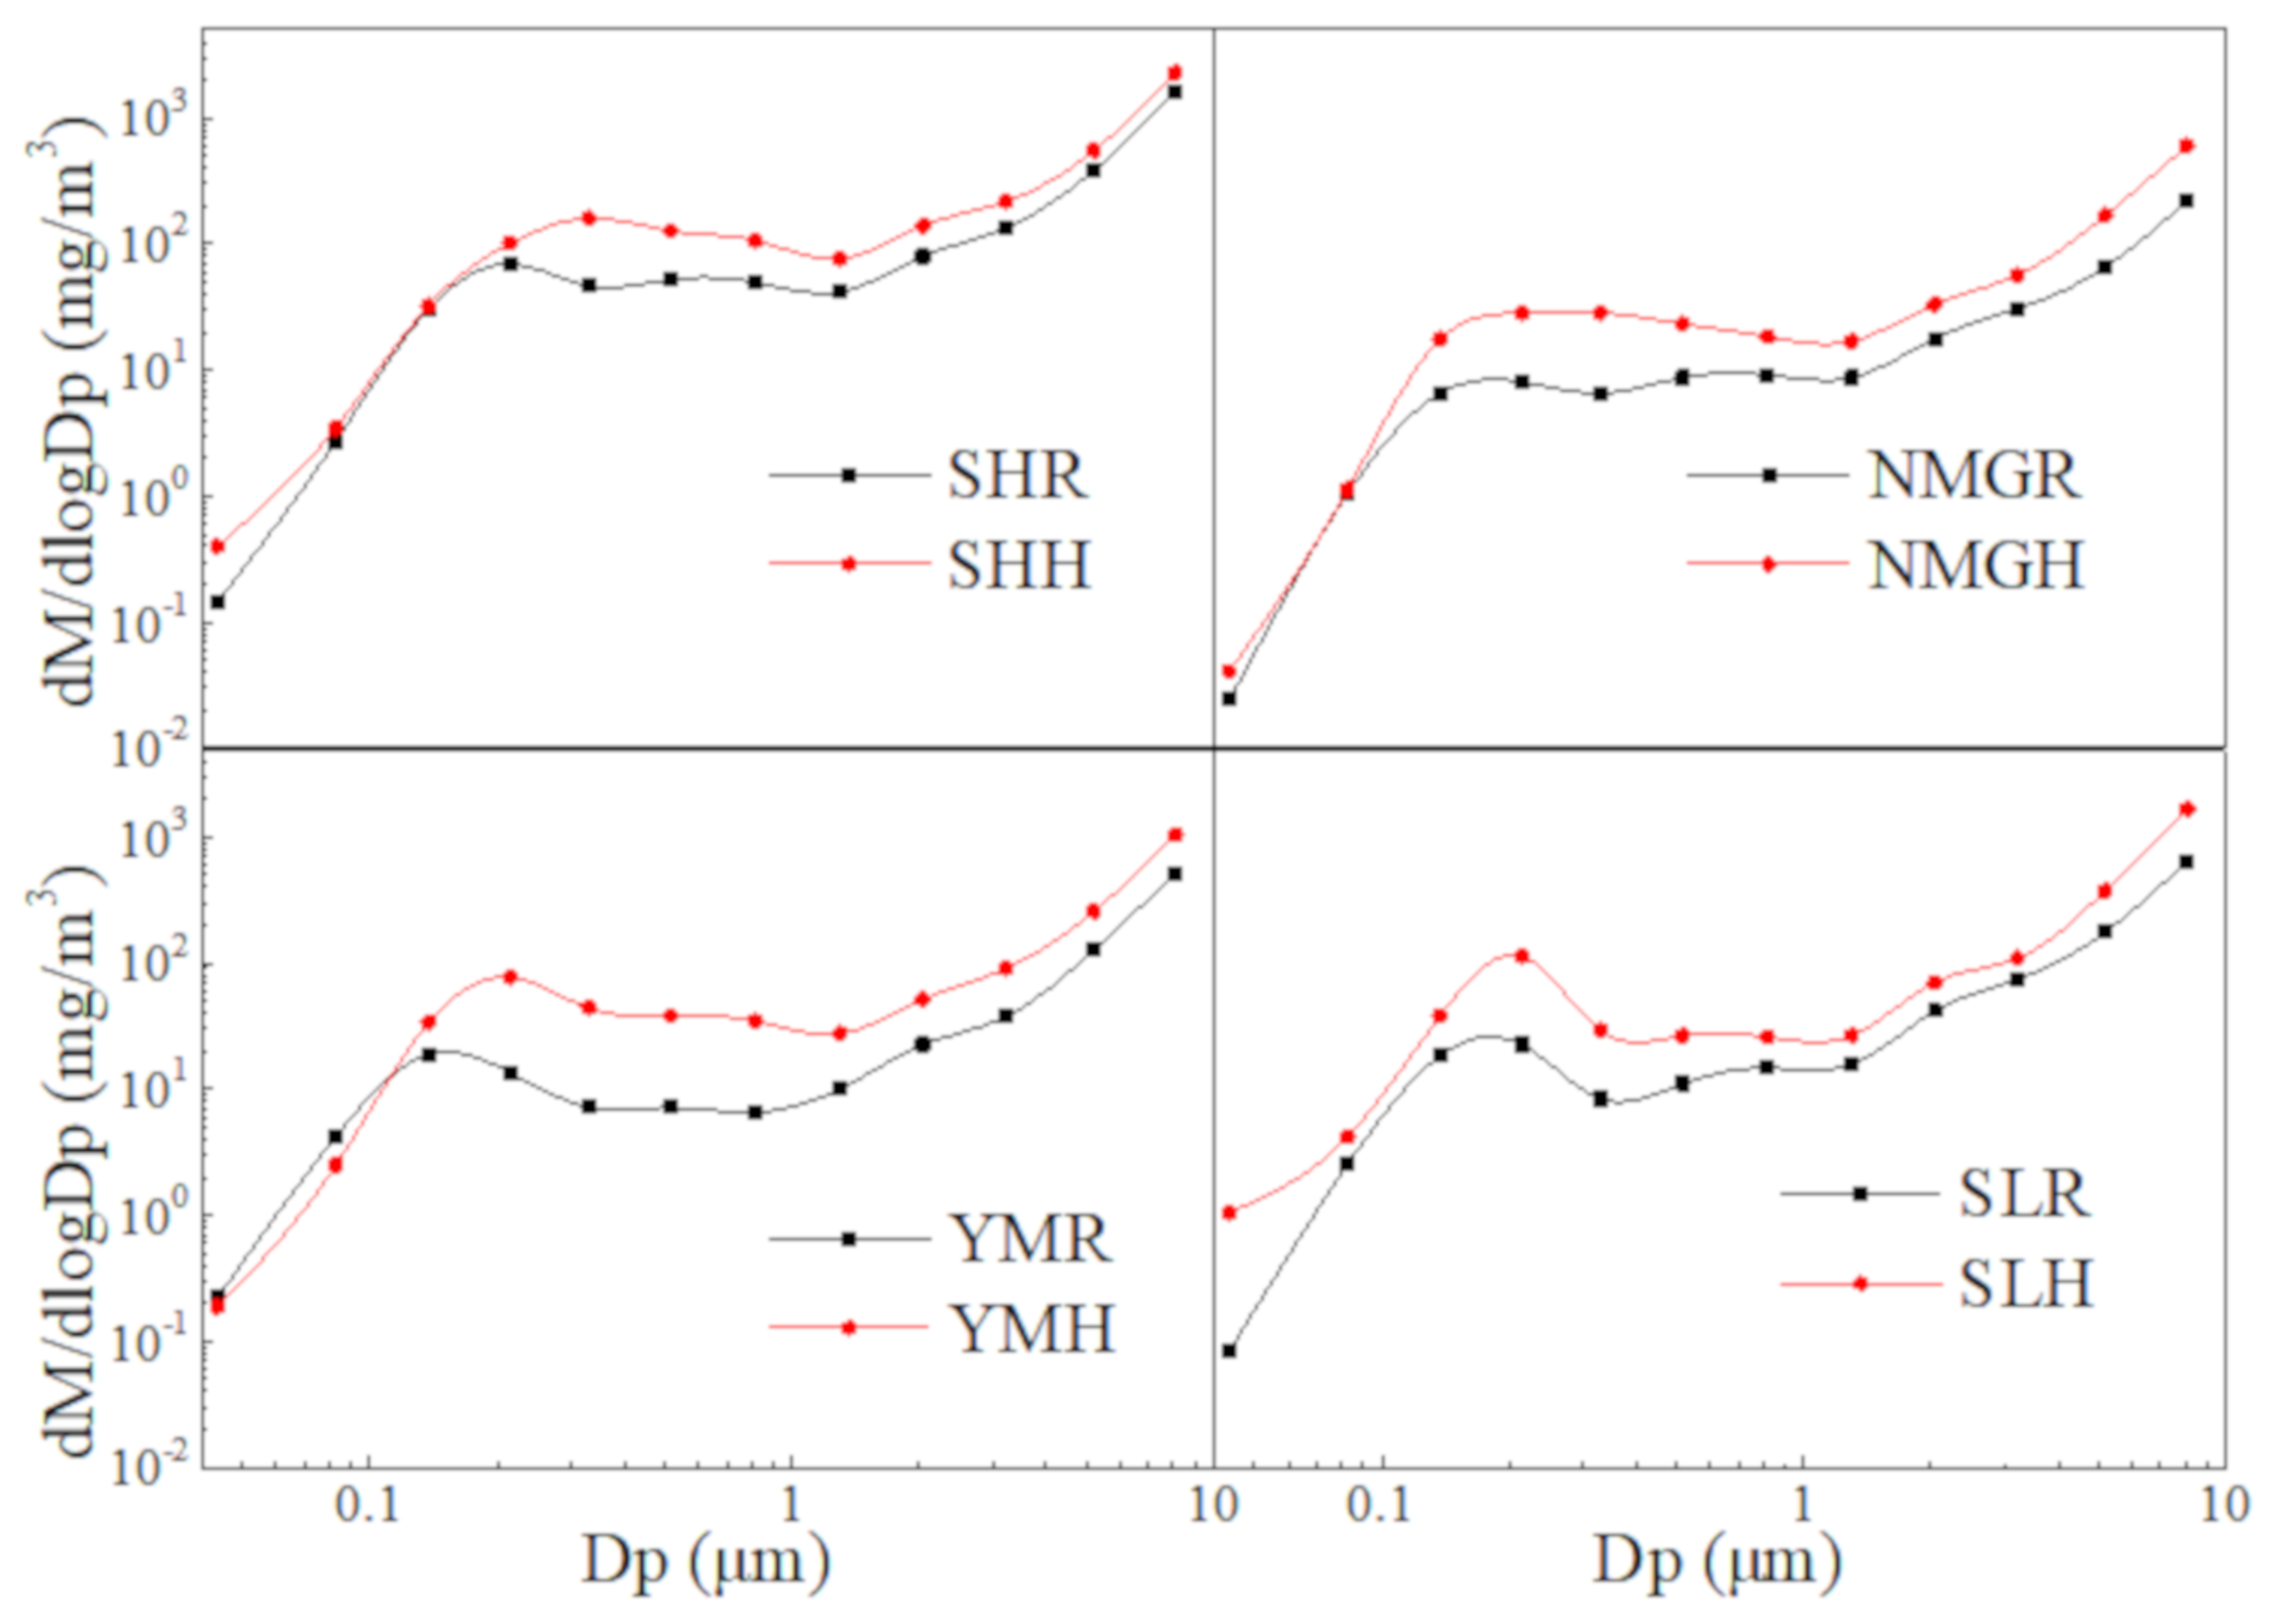
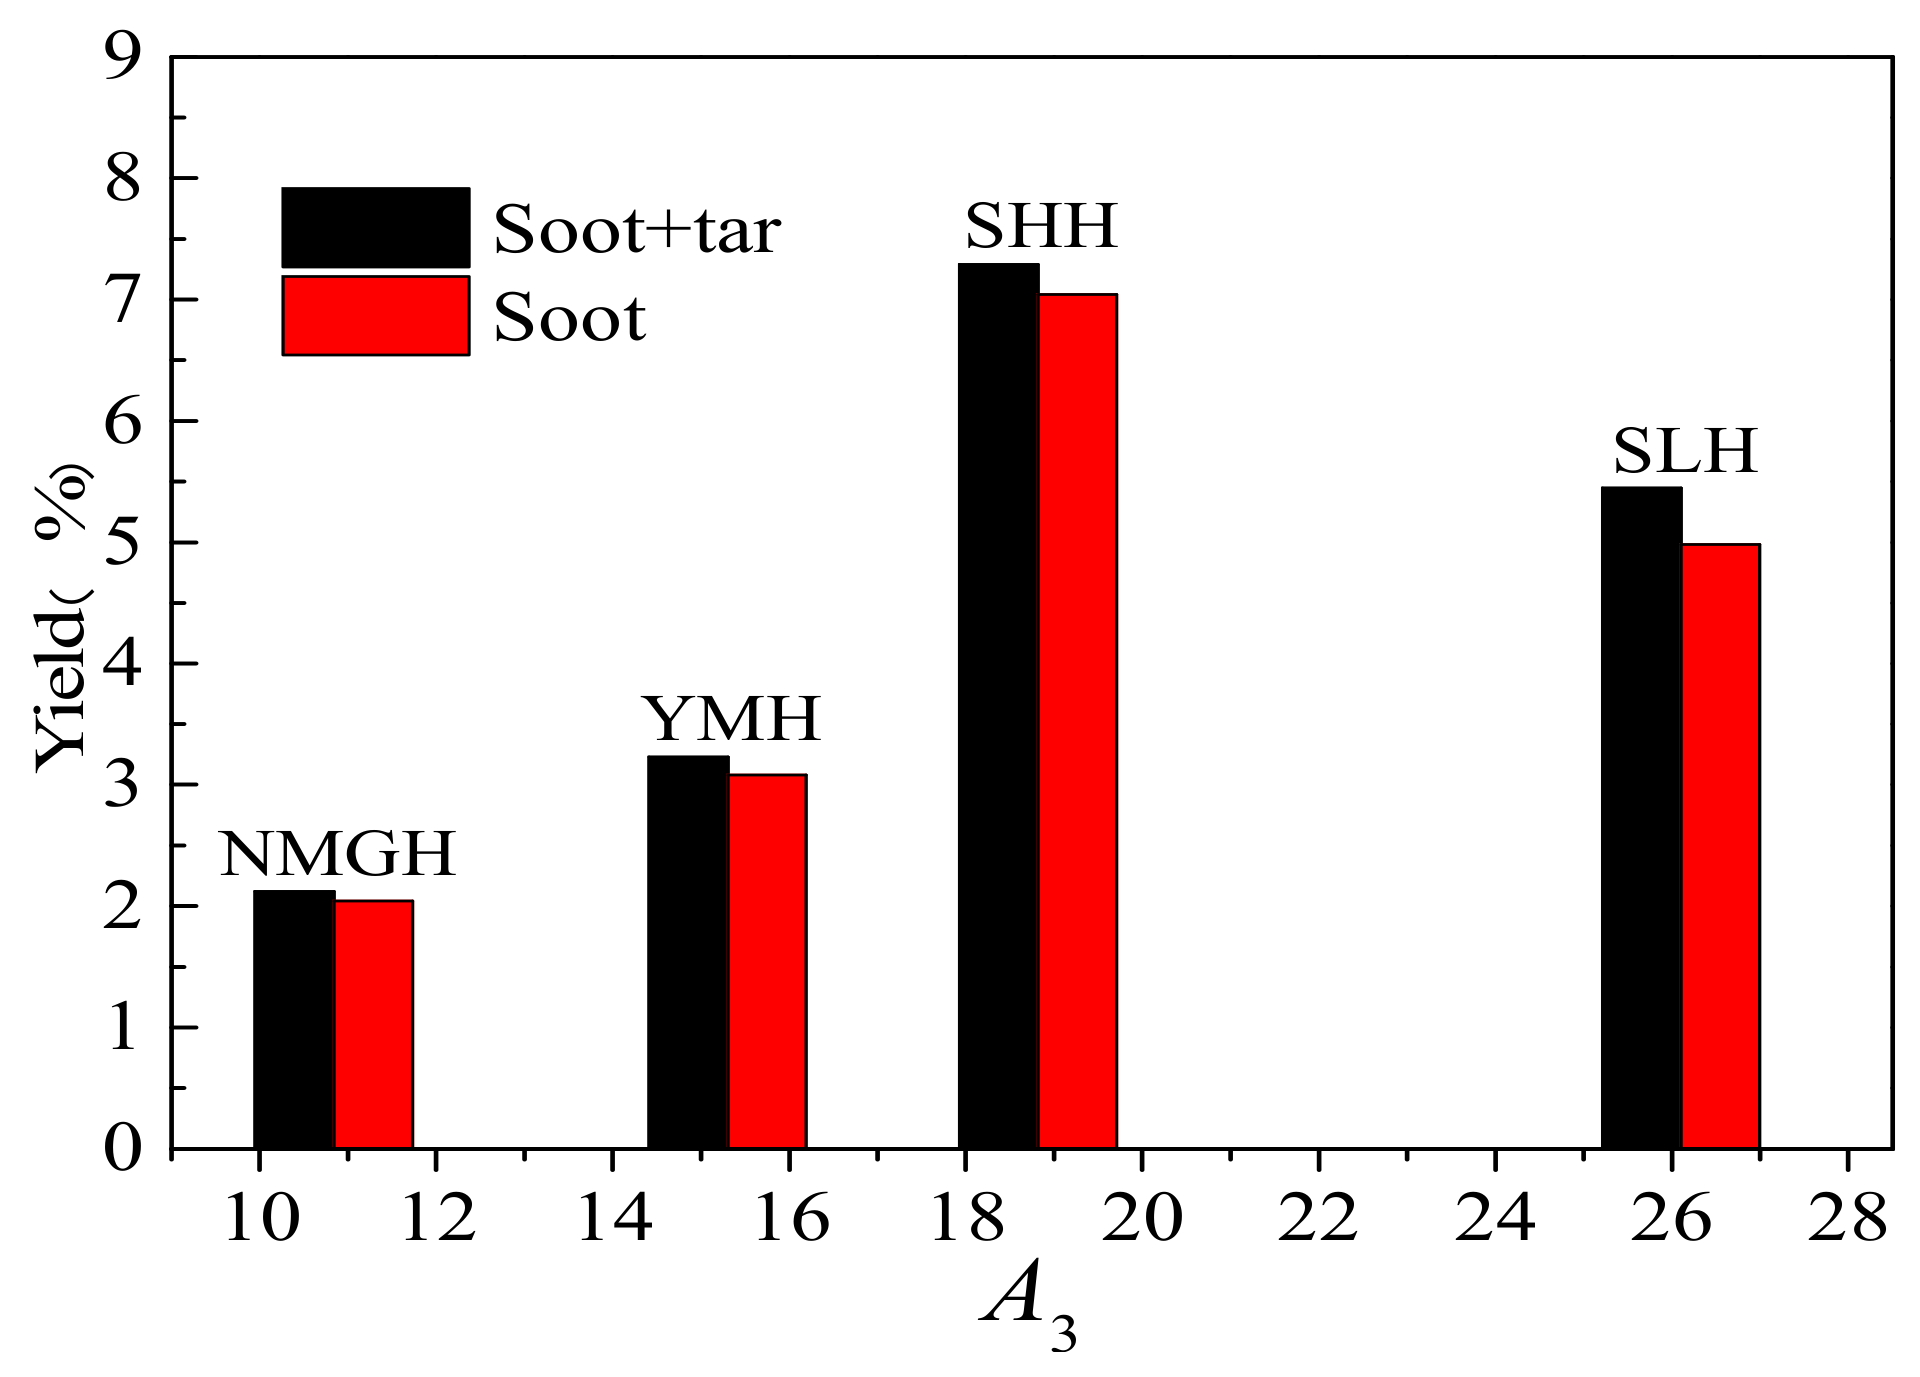
3.1. Particle Yields and Size Distribution

Soot and tar yields of four kinds of raw coals and corresponding HCl-washed coals are illustrated in Figure 2. Yield is the mass fraction of soot and tar in the dry ash-free base of coal. It can be seen from Figure 2 that soot and tar yields of four acid-washed coals are all higher than their corresponding raw coal, and the yields of soot are much higher than that of tar. Hayashi et al. [29] obtained the same experimental results in a similar DTR. Due to their low-reaction temperature (800–900 °C), tar yields were larger than this investigation.
Coal-derived soot is mainly formed by coal tar through dehydrogenation, deoxidization [11,30] and aromatization together with polymerization [11,13,31]. During the primary pyrolysis process of coal, metals, especially alkali metals and alkaline earth metals (AAEM) in coal can continuously connect and fracture with a heavy tar precursor as a cross-linking point. Therefore, tar precursors would be decomposed into light gas or form char to reduce the production of tar [32,33]. The decrease of tar, the precursor of soot, will directly reduce soot yield. During secondary pyrolysis, gasification metals in the char particle boundary layer and metal minerals on the surface of the char can also catalyze the cracking reactions of tar or the reforming reactions of tar with H2O and CO2 generated in primary pyrolysis [23,29,32,34], further reducing the content of tar in pyrolysis gas and the formation of soot. Besides, gasified metals may also have an inhibitory effect on the sooting process of tar by occupying the active sites on the aromatic ring that inhibit the polymerization of aromatic compounds [35]. As shown in Figure 2 the soot yield of bituminous coal is not always higher than that of lignite. For example, the soot yield of NMG is much lower than that of YM and SL, which shows that there are limitations in determining the soot formation from coal ranks.
The number and mass size distributions of particles in pyrolysis gas are shown in Figure 3 and Figure 4, respectively. The PSDs of particulate matter generated by four kinds of coal pyrolysis are similar. The size distribution has a peak near 0.12 μm. The mass concentration increased with particle size increasing before 0.12 μm, remained stable between 0.12 μm and 1.2 μm, and then increased again with particle size increasing. The acid-washed coal particle concentration in each channel of ELPI is generally higher than that of raw coal, and the slop of the curves before 0.12 micron is lower than that of raw coal. Mineral ultrafine particles formed by pyrolysis may affect the PSDs of particles in pyrolysis gas, such as the concentration of particles in the channels less than 0.12 μm of YMR is higher than that of YMH. According to Table 2, the difference in Fe content between YMH and YMR is the highest among the four coals (the Fe content of YMR is also the highest among the four raw coals). Na, K, Ca, and Mg belong to AAEM, and these metals can be present in coal in the form of organic combination (such as carboxylate), which is easier to gasify [36]. During coal pyrolysis, AAEM can maintain the organic combination state, vaporize together with volatile matter, and finally enter soot and tar, which will not participate in the formation of mineral particles [36]. However, Fe mostly exists in coal in the form of inorganic minerals [37]. Gasified Fe is mainly converted into ultrafine particles during coal pyrolysis. Therefore, the content of ultrafine particles in the pyrolytic particles of YMR with the highest Fe content is higher than that of YMH.

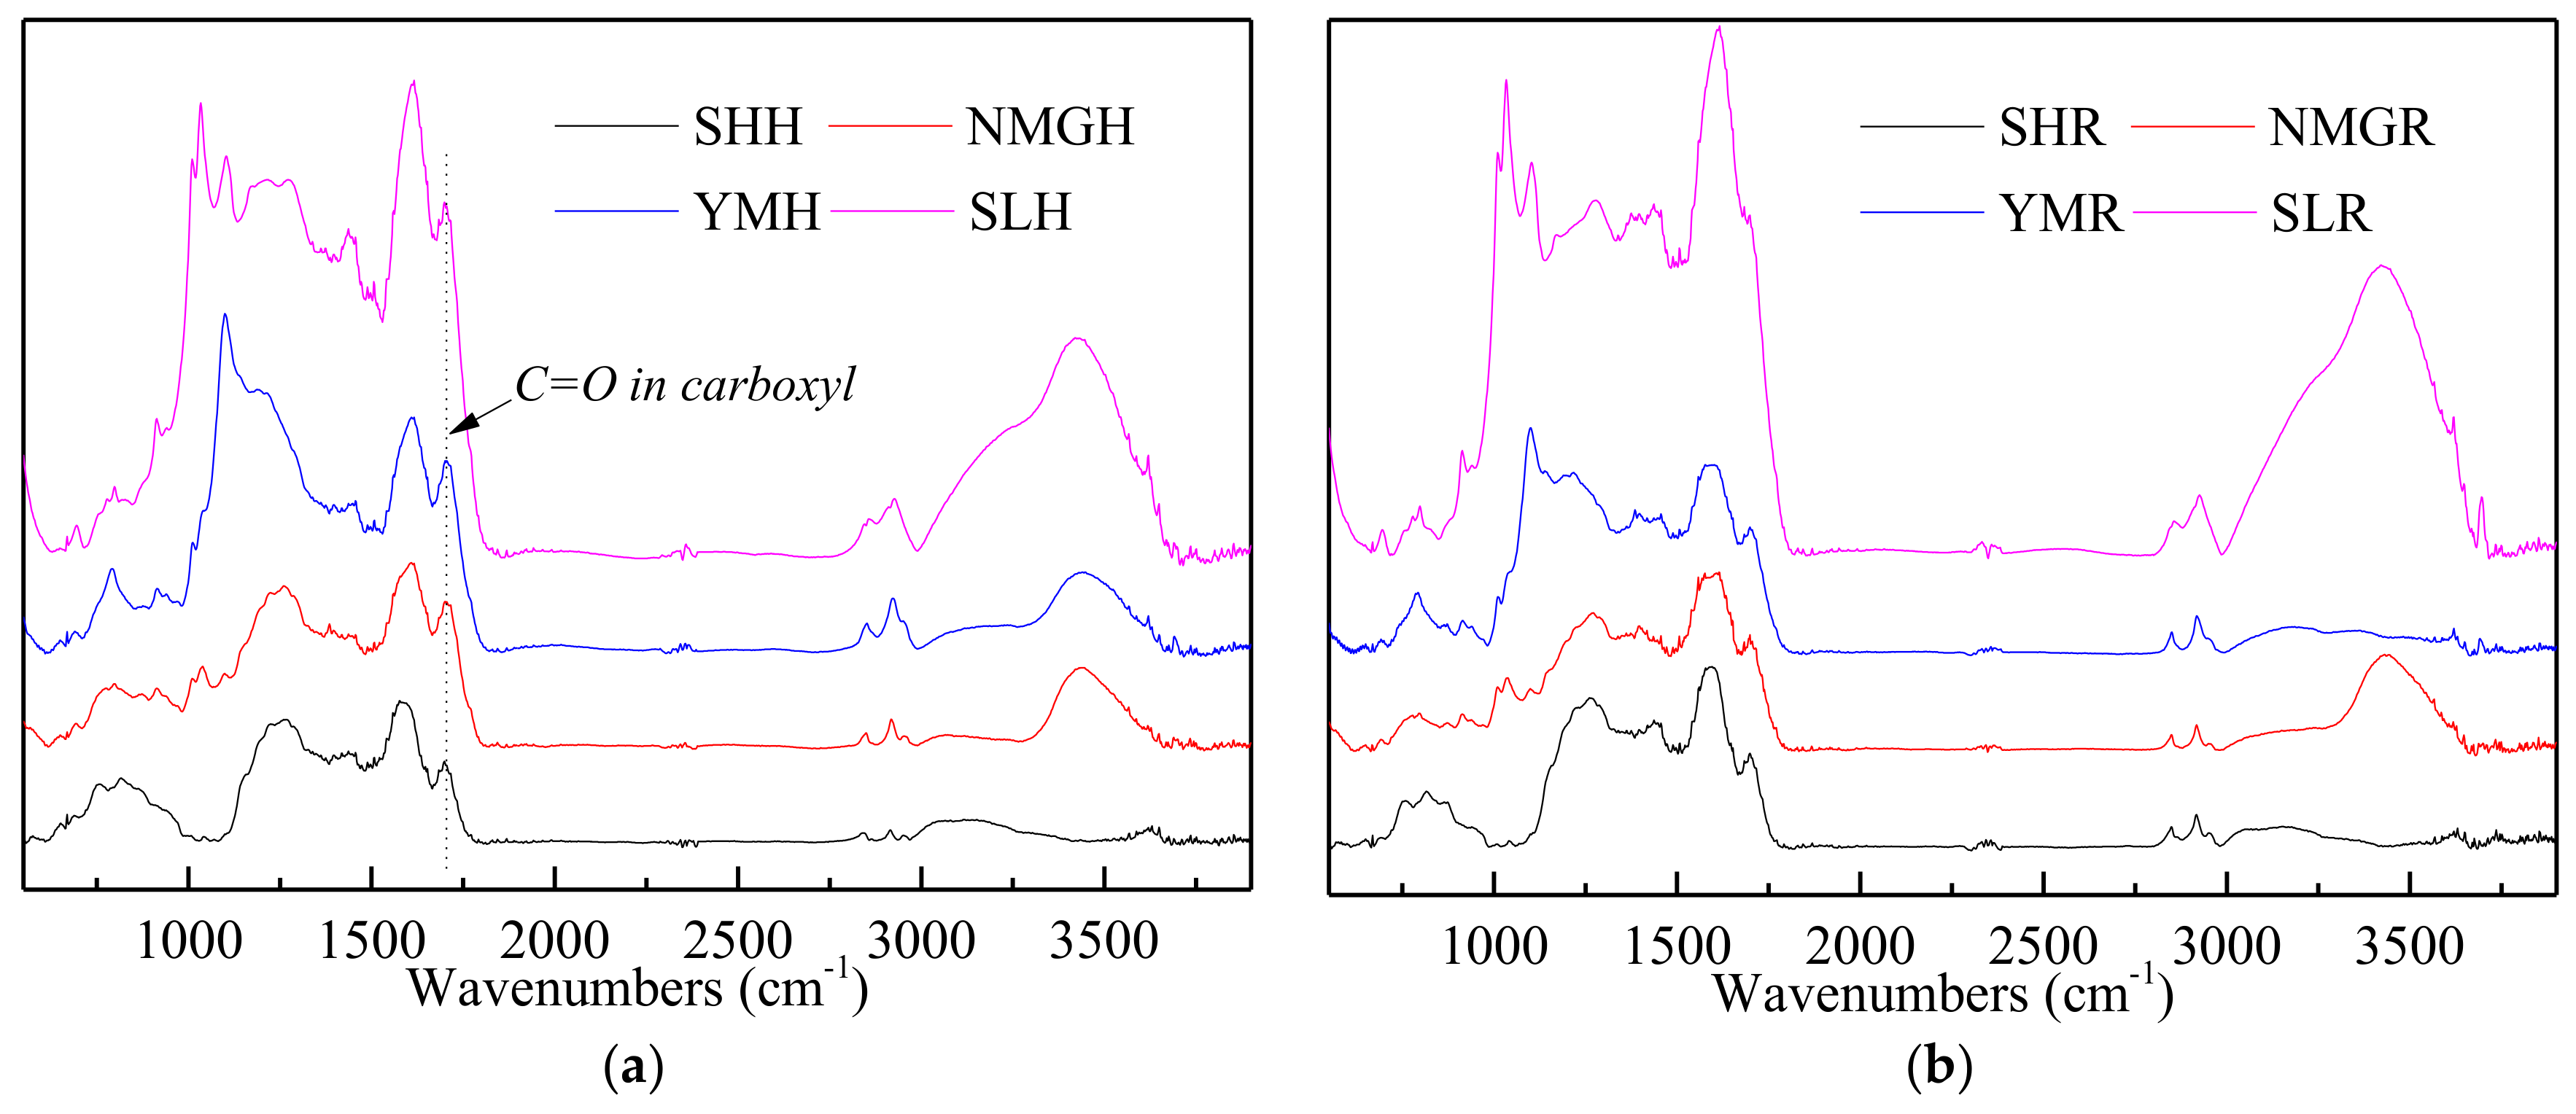
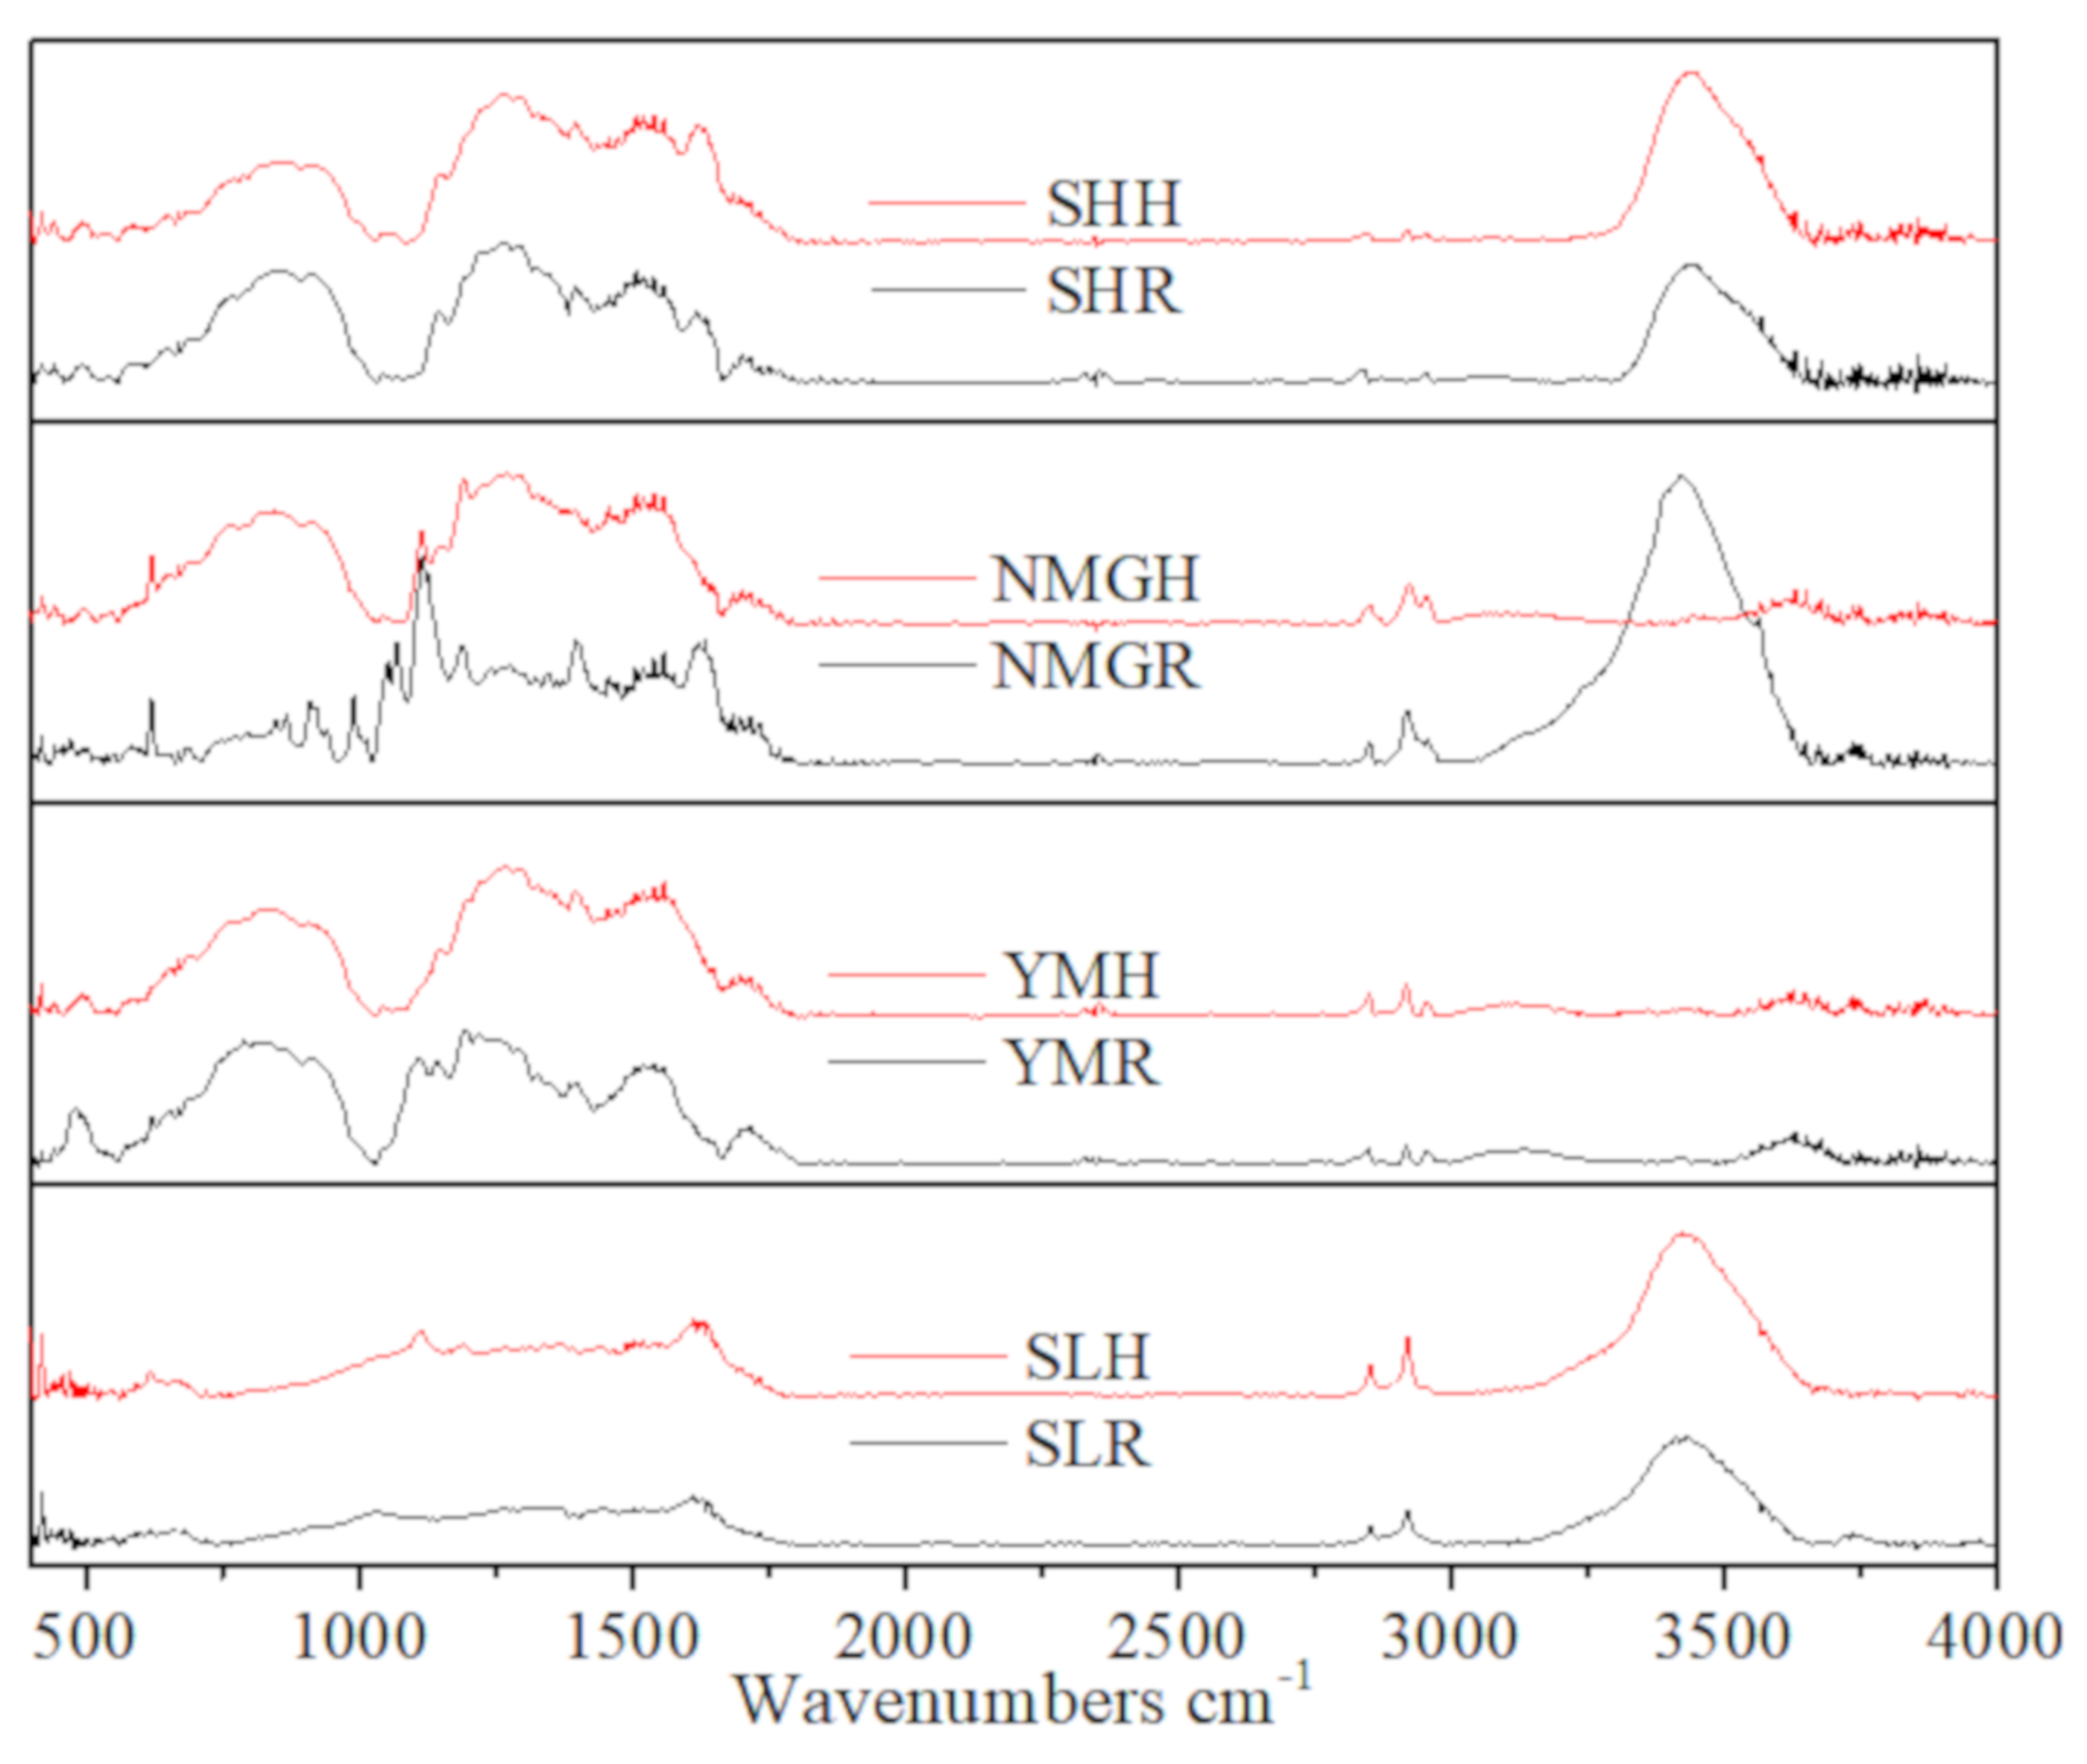
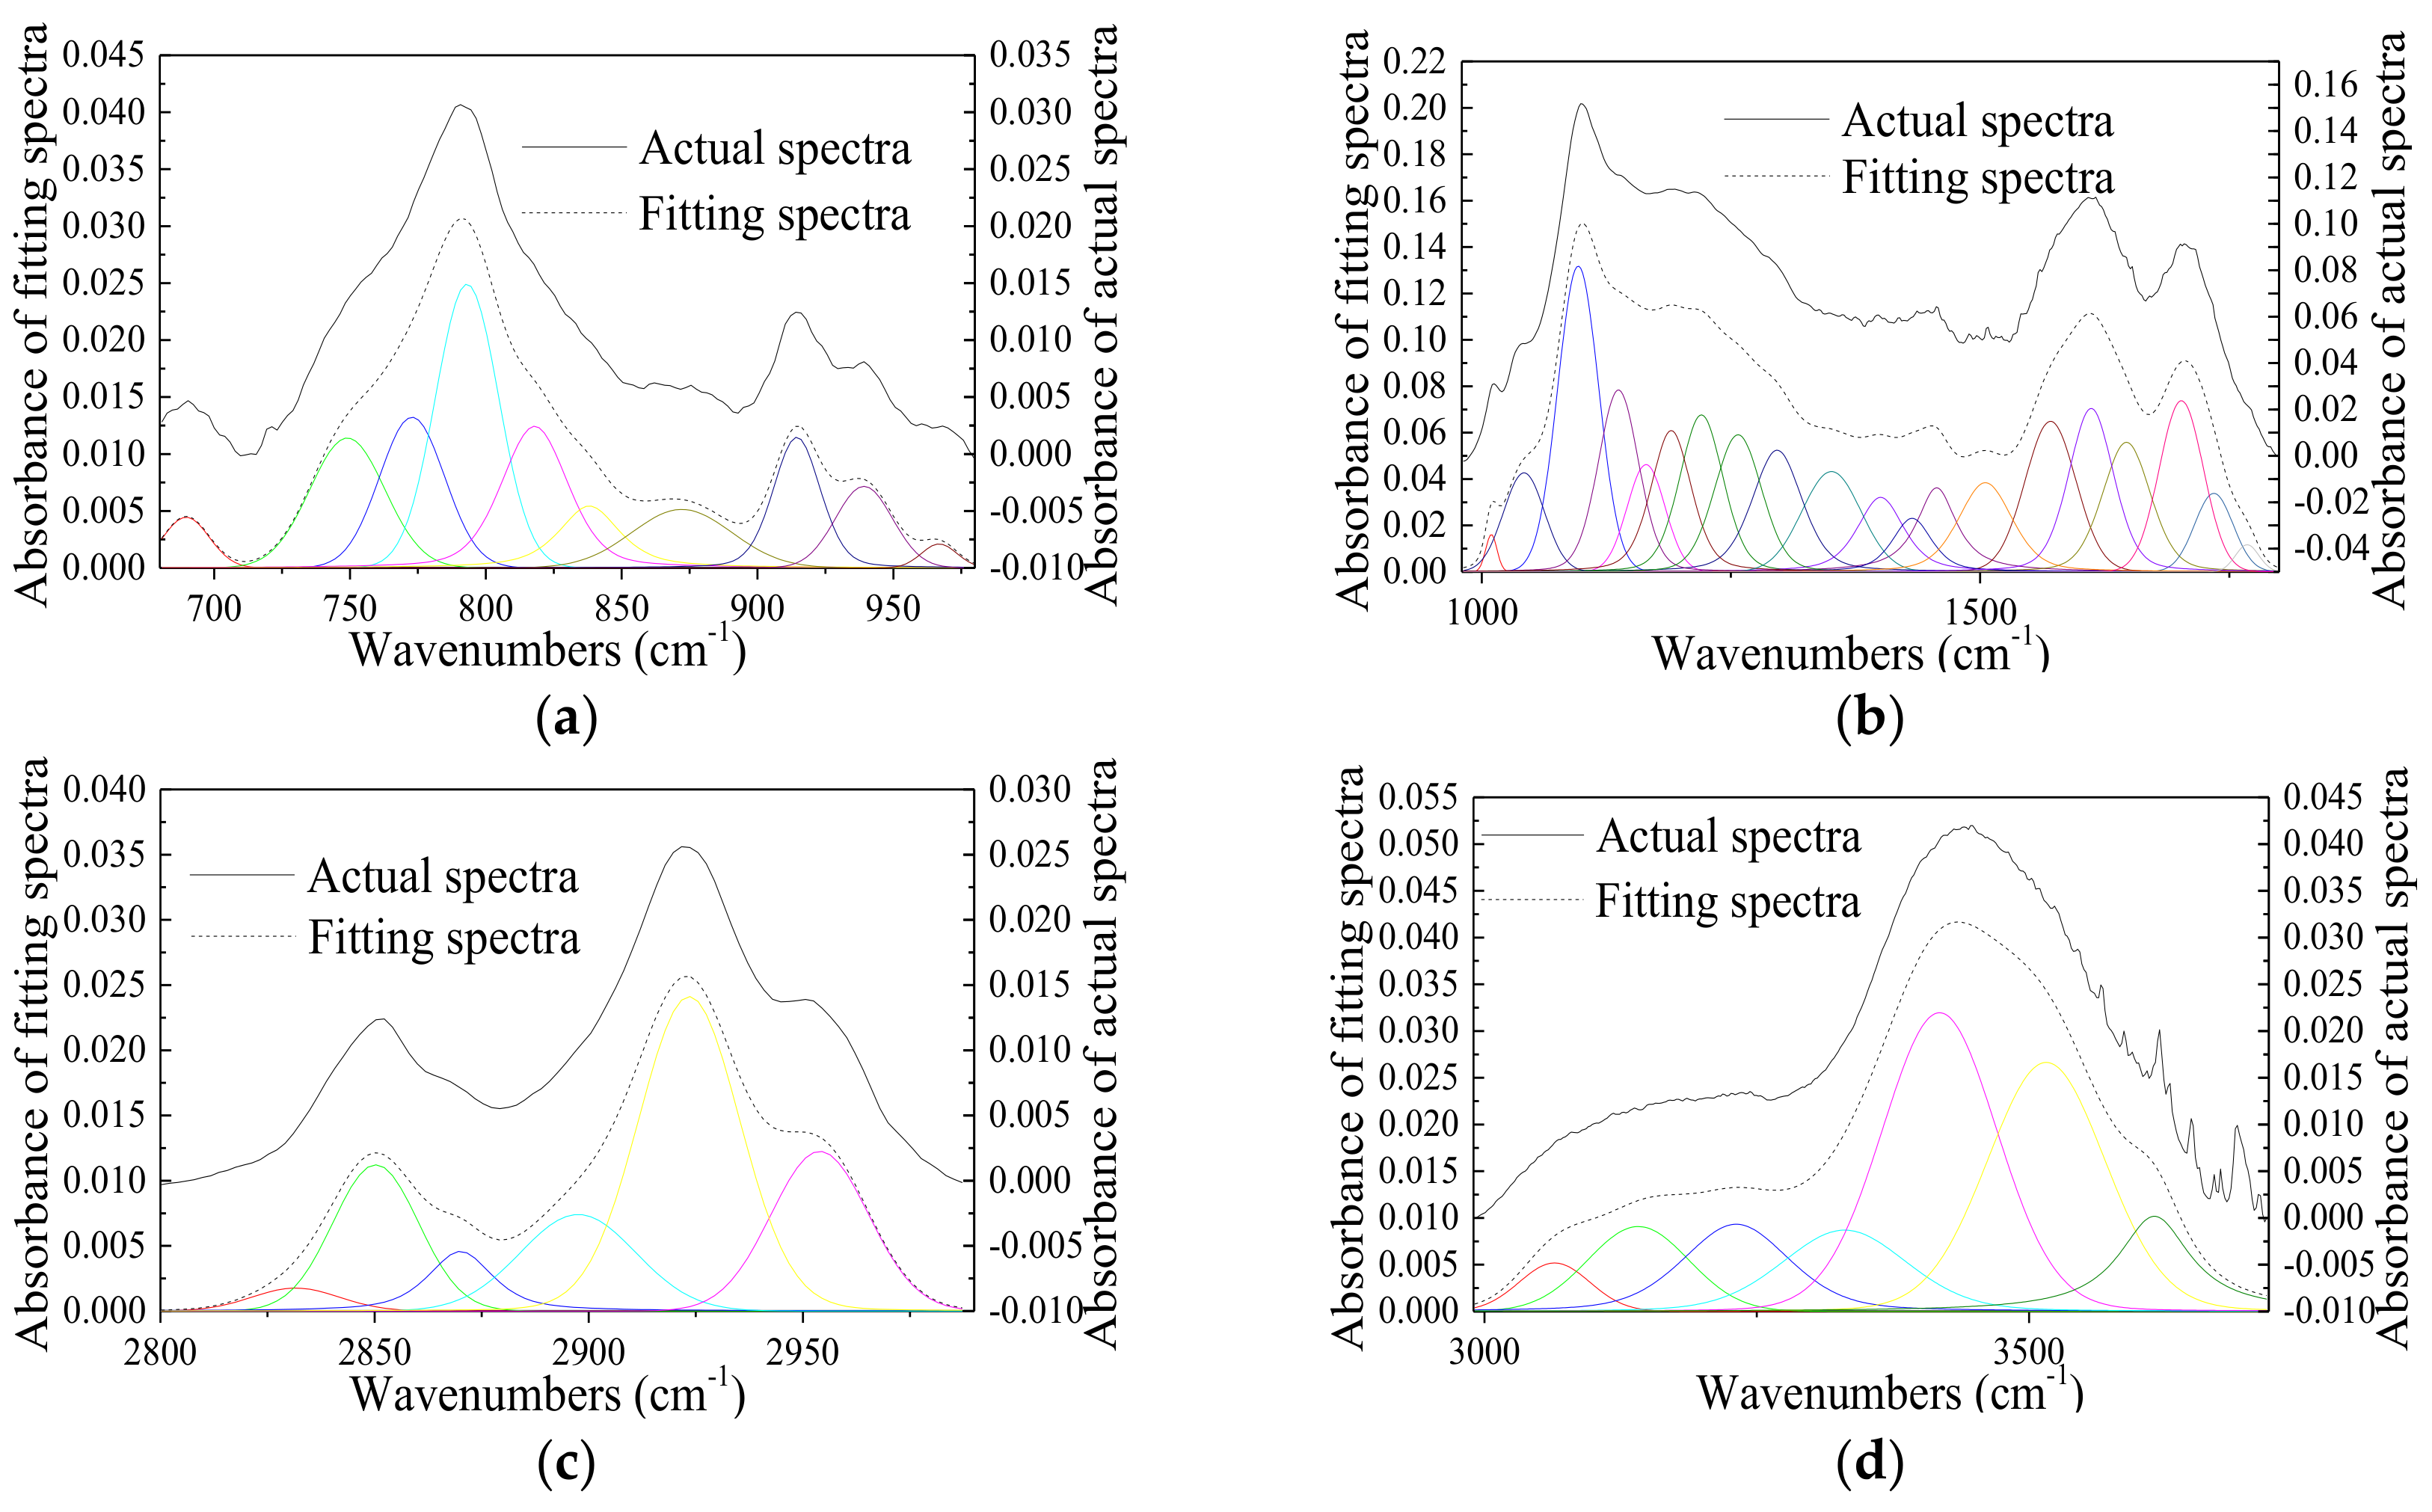
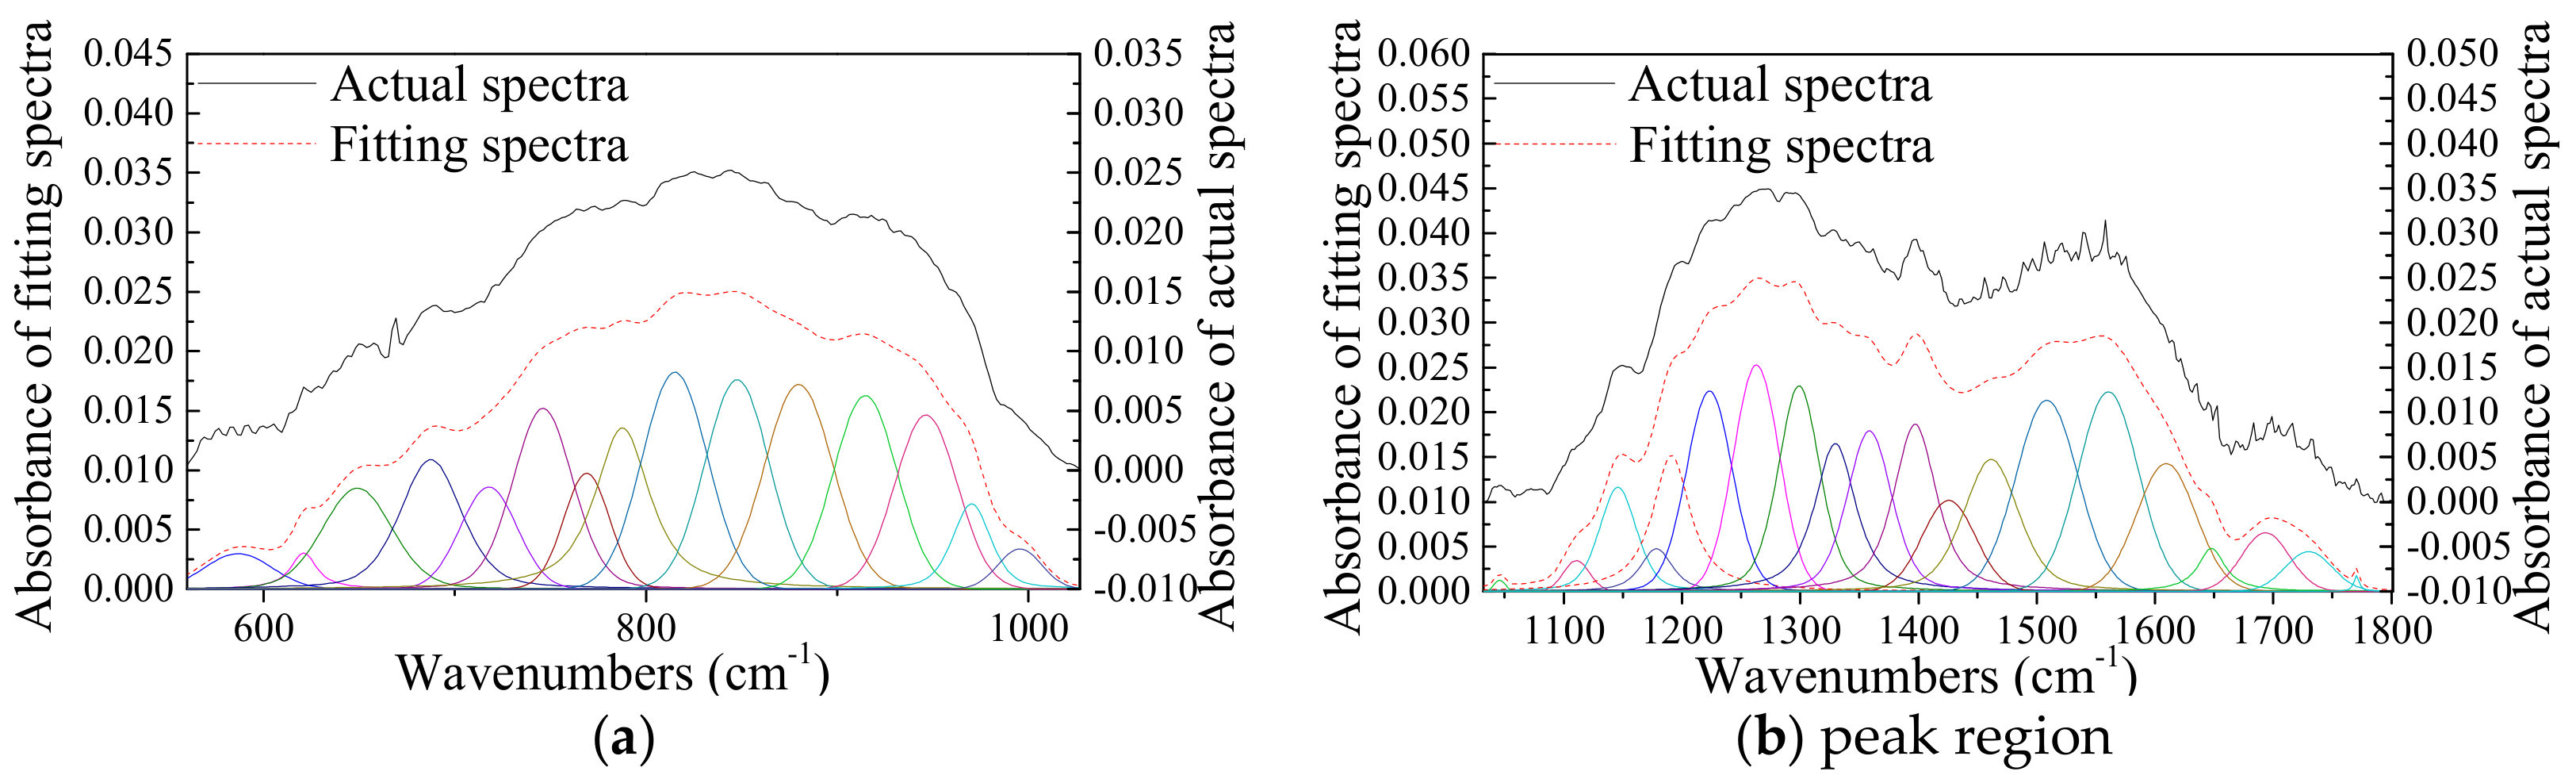
3.2. Interpretation of the FTIR Spectra

As the absorbability of soot is stronger than that of coal, different dilution ratios of coal and soot+tar are adopted in KBr pellet preparation (1:1000 for soot+tar and 1:400 for coal). Baseline corrected spectra for the four kinds of coals before and after acid-washing and soot+tar generated by eight coal pyrolysis are illustrated in Figure 5 and Figure 6, respectively. As shown in Figure 5, the HCl-washing method used in this work has little effect on the organic structure of coal. The most obvious change is that the absorption peak of stretching vibration of C=O in the carboxyl group of acid-washed coal at about 1700 cm−1 increased [38]. This is due to the replacement of metal ions in carboxylate in coal by H-ion during acid-washing, which made the content of the carboxyl group in acid-washed coal increase. By comparing the spectra in Figure 5 and Figure 6, it can be found that the main spectral peaks in the spectra of coal and soot+tar are roughly similar and the positions of each peak due to their chemical structure are the same.
680–980 cm−1 zone is the aromatic hydrogen absorption peak region. In this region, there are mainly various types of aromatic out-of-plane C–H deformation [39,40,41]. The 980–1800 cm−1 zone is the oxygen-containing structures absorption peak region [42,43]. The area includes various types of C–O stretching vibrations before 1400 cm−1 and various types of C=O stretching vibrations after 1400 cm−1 [40,42,44]. In addition, about 3 or 4 aromatic ring (C=C) stretching vibrations are also included in this area (1365–1620 cm−1) [40,41,45]. The 2800–2990 cm−1 zone is the aliphatic hydrogen absorption peak region. The spectral peaks in this region belong to various aliphatic C–H stretching vibrations [39,41,43]. The 2990–3720 cm−1 is the hydroxyl absorption peak region; stretching vibrations of crystalline water are also in this region [42,43,46]. There is almost no hydroxyl peak in the FTIR spectrum of soot [41,45,47]. The peak value of this region in Figure 6 is mainly from crystalline water, which has not been sufficiently removed during drying, so this region is not considered when analyzing the chemical structure of soot+tar. It can be seen from Figure 5 that the peaks of oxygen-containing structures and the peaks of aliphatic hydrogen in brown coal are larger than that of bituminous coal, and the area of the aromatic hydrogen absorption peak of bituminous coal is larger.
As there are lots of absorption bands due to different functional groups that contribute to FTIR spectra, each peak region in the spectra is superimposed by the bands of different functional groups, so that the detailed structural characteristics of coal cannot be directly obtained from the spectra. Therefore, this experiment uses curve-fitting technology to separate the absorption bands in FTIR spectra of coal and soot+tar in reference to previous studies [40,41,44,45,48,49,50,51]. The bands of different chemical structures were preset to a linear combination of Gaussian function and Lorentzian function during the fitting process. The position of each fitting peak depends on the minimum of the second derivative of spectra. Examples of the curve-fitting results of four absorption peak regions of YMH and its corresponding soot+tar are shown in Figure 7 and Figure 8, respectively. As the FTIR spectra of raw coals are similar to those of acid-washed coals and their soot formation characteristics are affected by the metal in coal, then this is not conducive to the study of the influence of coal organic structure on soot formation characteristics. In this work, the FTIR spectra of raw coals were not fitted.
The sum of the areas of fitting peaks belonging to functional groups with the same structure in the curve-fitting results can represent the concentration of these functional groups to some extent and the ratio of certain absorption peak areas can also represent the sample structure parameters. The calculated parameters used in this paper include A1 = ∑Aaliphatic hydrogen, A2 = ∑Aaromatic hydrogen, A3 = A1 + A2, A4 = ∑Aoxygen-containing-structures, A5 = ∑AC=C, I1 = A1/∑Aall, I2 = A2/∑Aall, I3 = I1 + I2, I4 = ACH2/ACH3, and I5 = A2/A5. In the calculation process, the areas of fitting peaks are multiplied by appropriate parameters according to the dilution ratio between the sample and KBr during pellet preparation and weight of corresponding KBr pellet to achieve the purpose of normalizing the spectrum to 1 mg cm−2. The analytical parameter values of four HCl-washed coals and eight soot+tar samples are shown in Table 3 and Table 4, respectively.

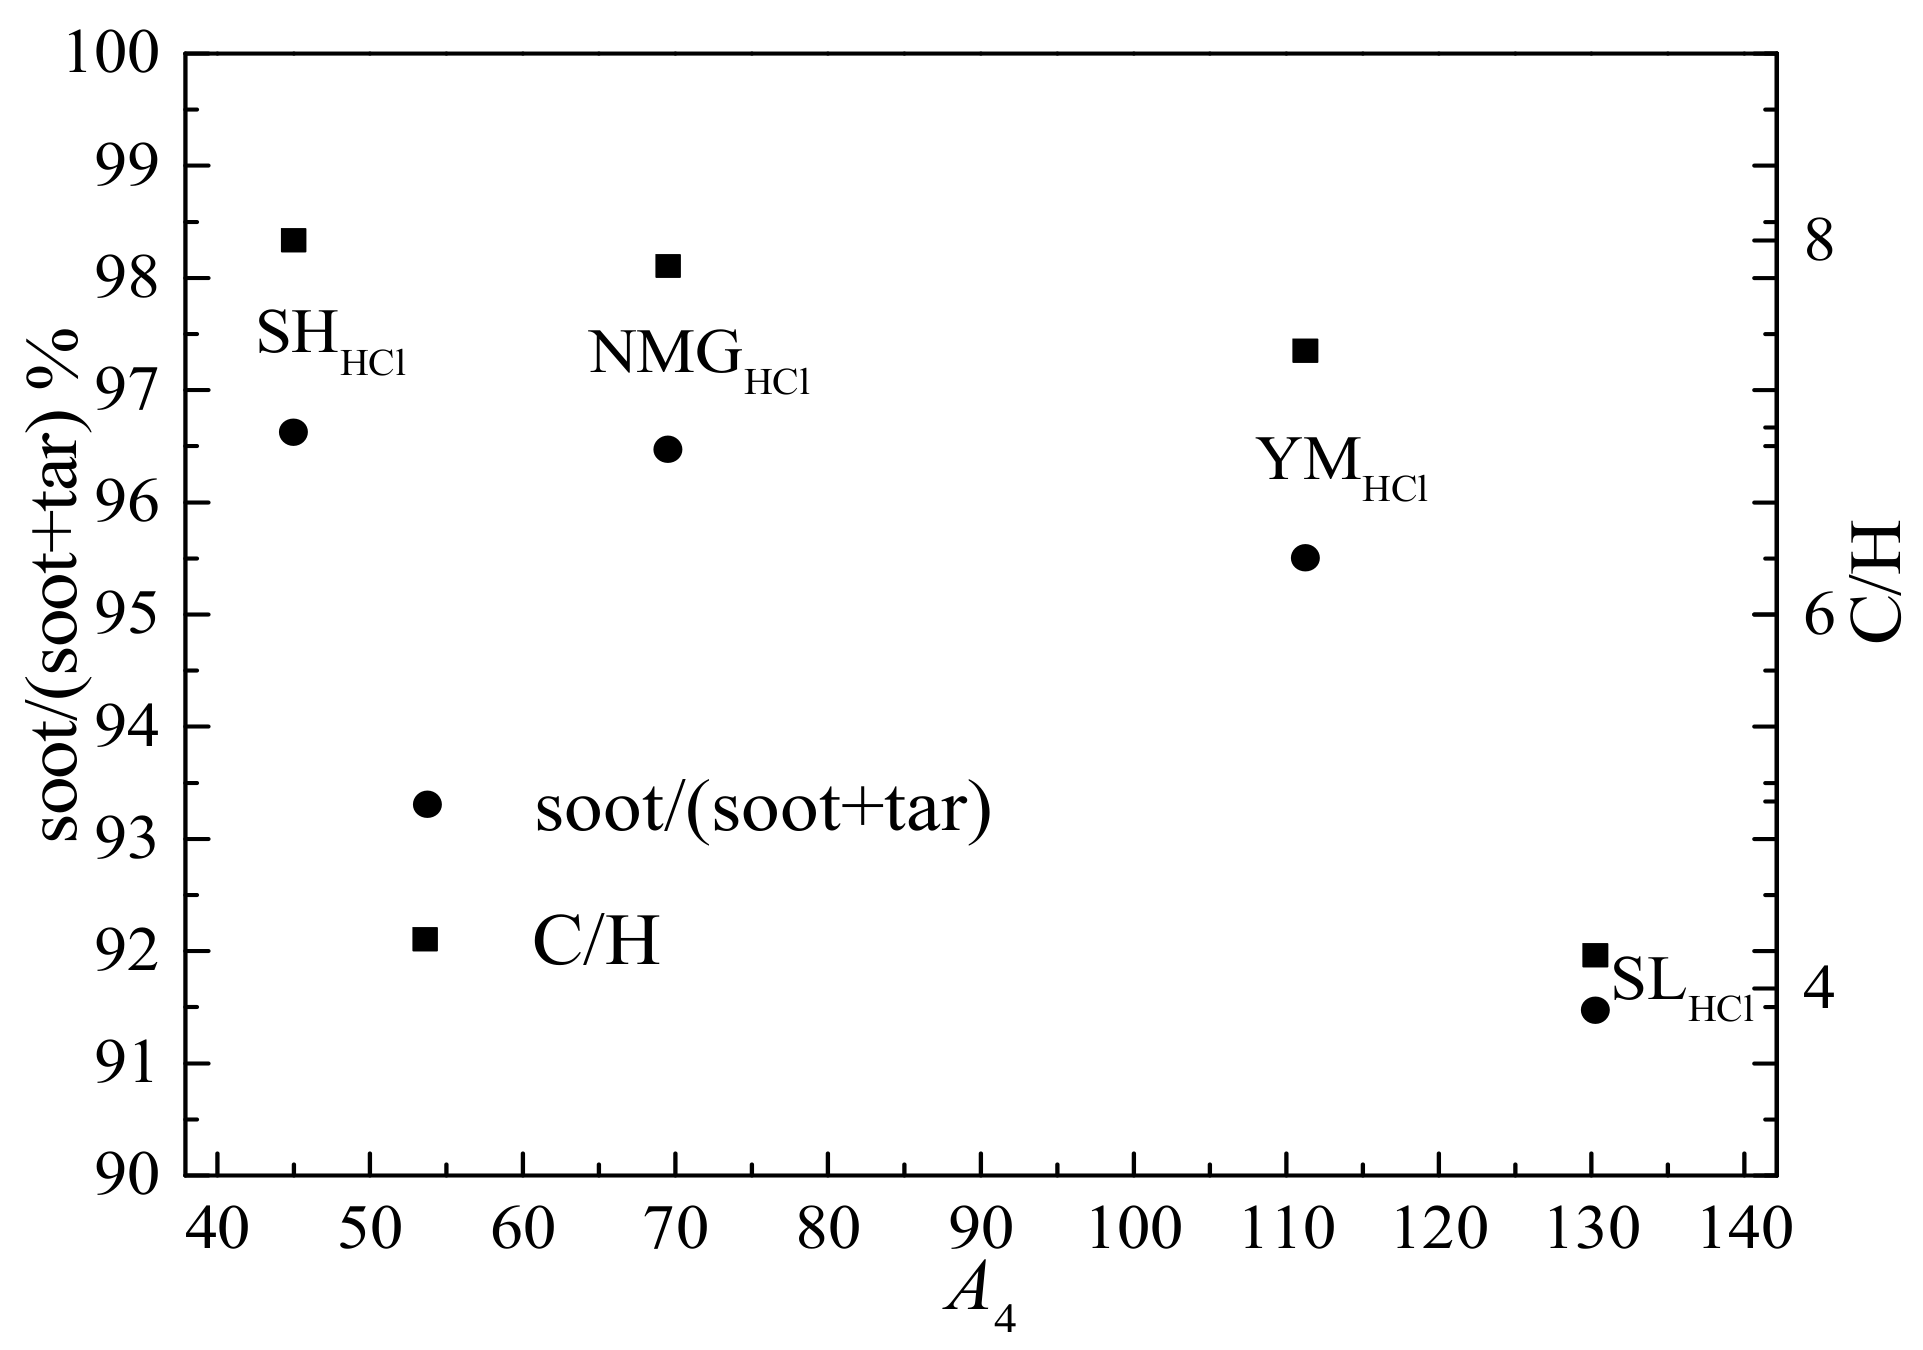
3.3. Effect of Coal Organic Structure on Soot Formation

Both aromatic and aliphatic compounds generated by coal primary pyrolysis can be converted into soot during secondary pyrolysis. Aromatic compounds grow mainly through polymerization and have a relatively strong ability to form soot. Aliphatic compounds need to be aromatized to form aromatic ring-structures to continue to convert to soot. Aliphatic compound with long-chain and fewer branches (larger value of I4) is more susceptible to form soot. For example, the coal A2 values of NMGH and YMH are relatively close, but since the coal A1 and I4 value of YMH is much larger than that of NMGH, the aliphatic compounds generated by YMH are more likely to form soot than NMGH, so the soot-yield of YMH is higher than that of NMGH. Therefore, to comprehensively consider the influence of coal-FTIR parameters on the formation of coal-derived soot, this work compares the A3 value of four acid-washed coal with their soot and soot+tar yields. As shown in Figure 9. The yield of soot and soot+tar increases substantially with the increase of A3 of acid-washed coal, but the yield of SHH coal is higher than that of SLH coal, which has a higher A3. It can be seen from the data in Table 3 that the coal I2 value of SHH is much higher than that of the other three coals, that is, the aromatic hydrogen ratio in the FTIR spectra is also an important parameter that can affect the yield of soot.
The conversion rate of tar to soot during the secondary pyrolysis of coal is also an important part of the research on coal-derived soot. The proportion of soot in soot+tar was used to express the conversion rate of tar. Carbon–hydrogen atomic ratio (C/H) of soot+tar is another parameter that shows the degree of tar conversion rate. Since the conversion of coal tar to soot is a process of dehydrogenation and condensation (hydrogen content in tar is higher than soot), the higher the degree of conversion, the larger the C/H value. Figure 10 is the schematic diagram showing the correlation between A4 of acid-washed coal and soot/(soot+tar) and C/H of soot+tar. As can be seen from the figure, with the increase of A4 value, the value of soot/(soot+tar) and C/H decreases, that is, the conversion rate of tar to soot decreases. The oxygen-containing functional groups in coal will vaporize at high temperatures to form oxygen-containing substance during pyrolysis, which will inhibit the formation of soot by reforming reaction [52,53] or oxidation reaction (oxygen-containing radicals, such as OH and O) [15,16,17]. Therefore, the conversion rate of coal tar to soot is inversely related to the absorption peak areas of oxygen-containing functional groups in the FTIR spectra of coal.

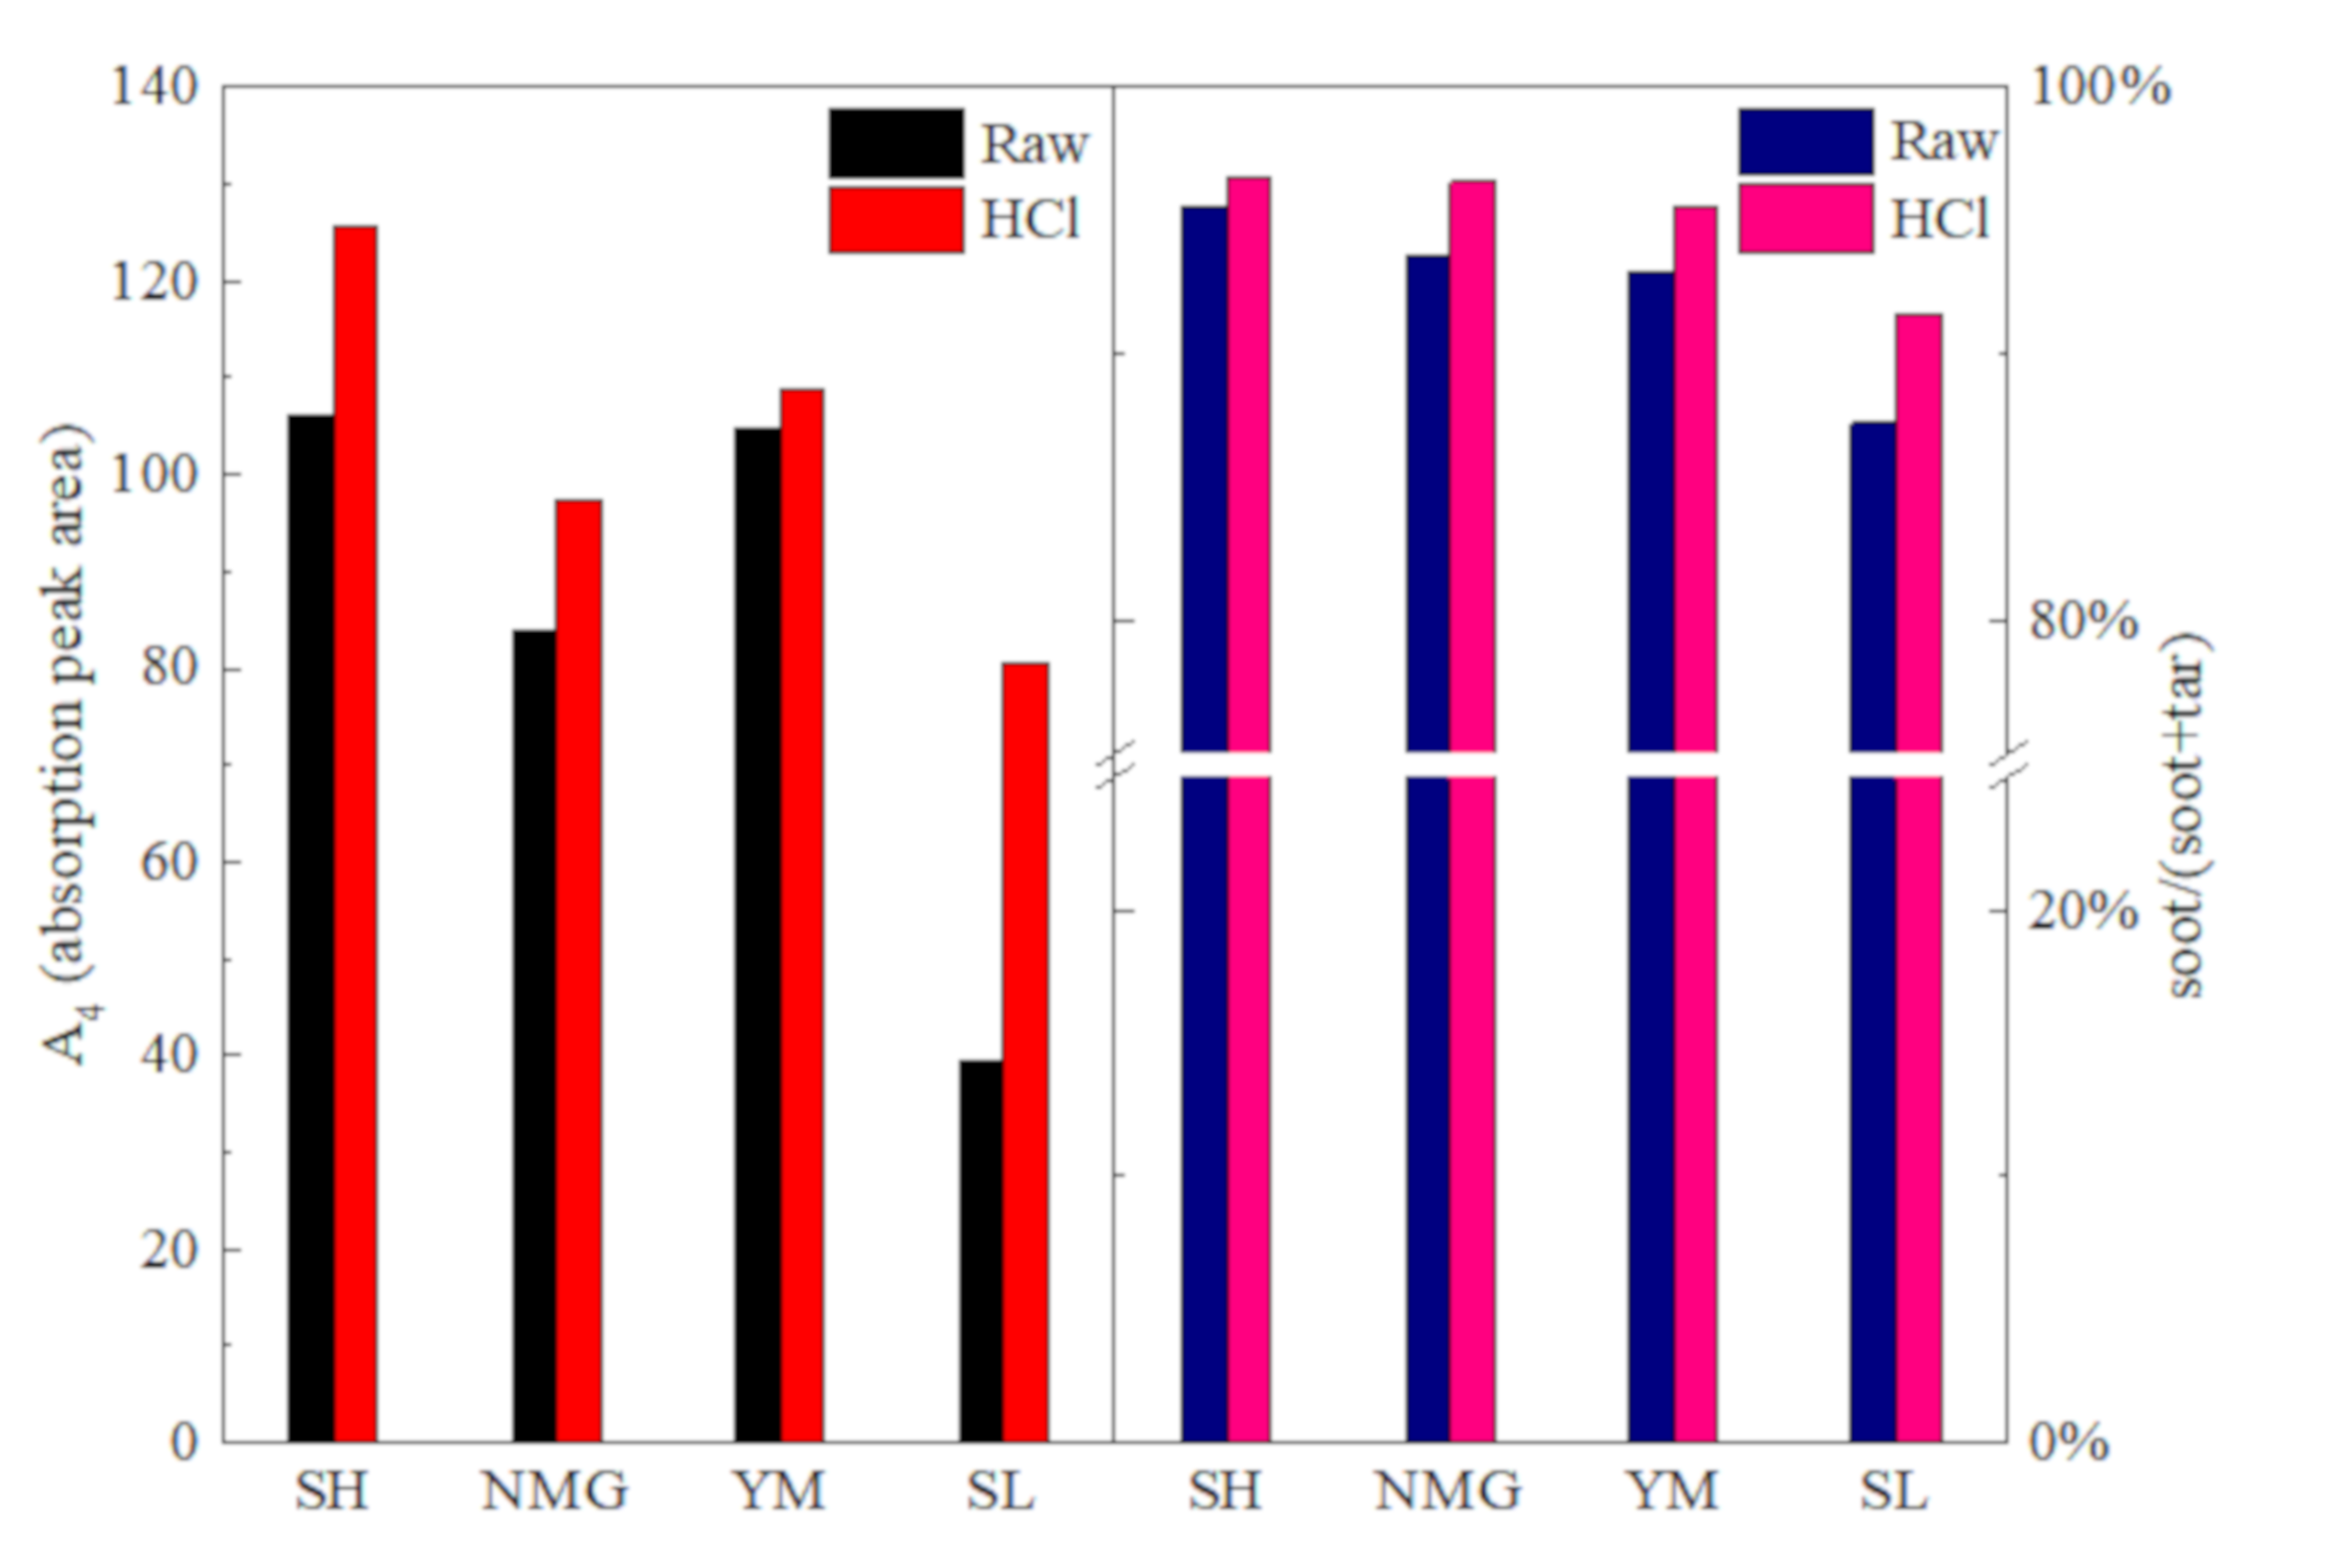
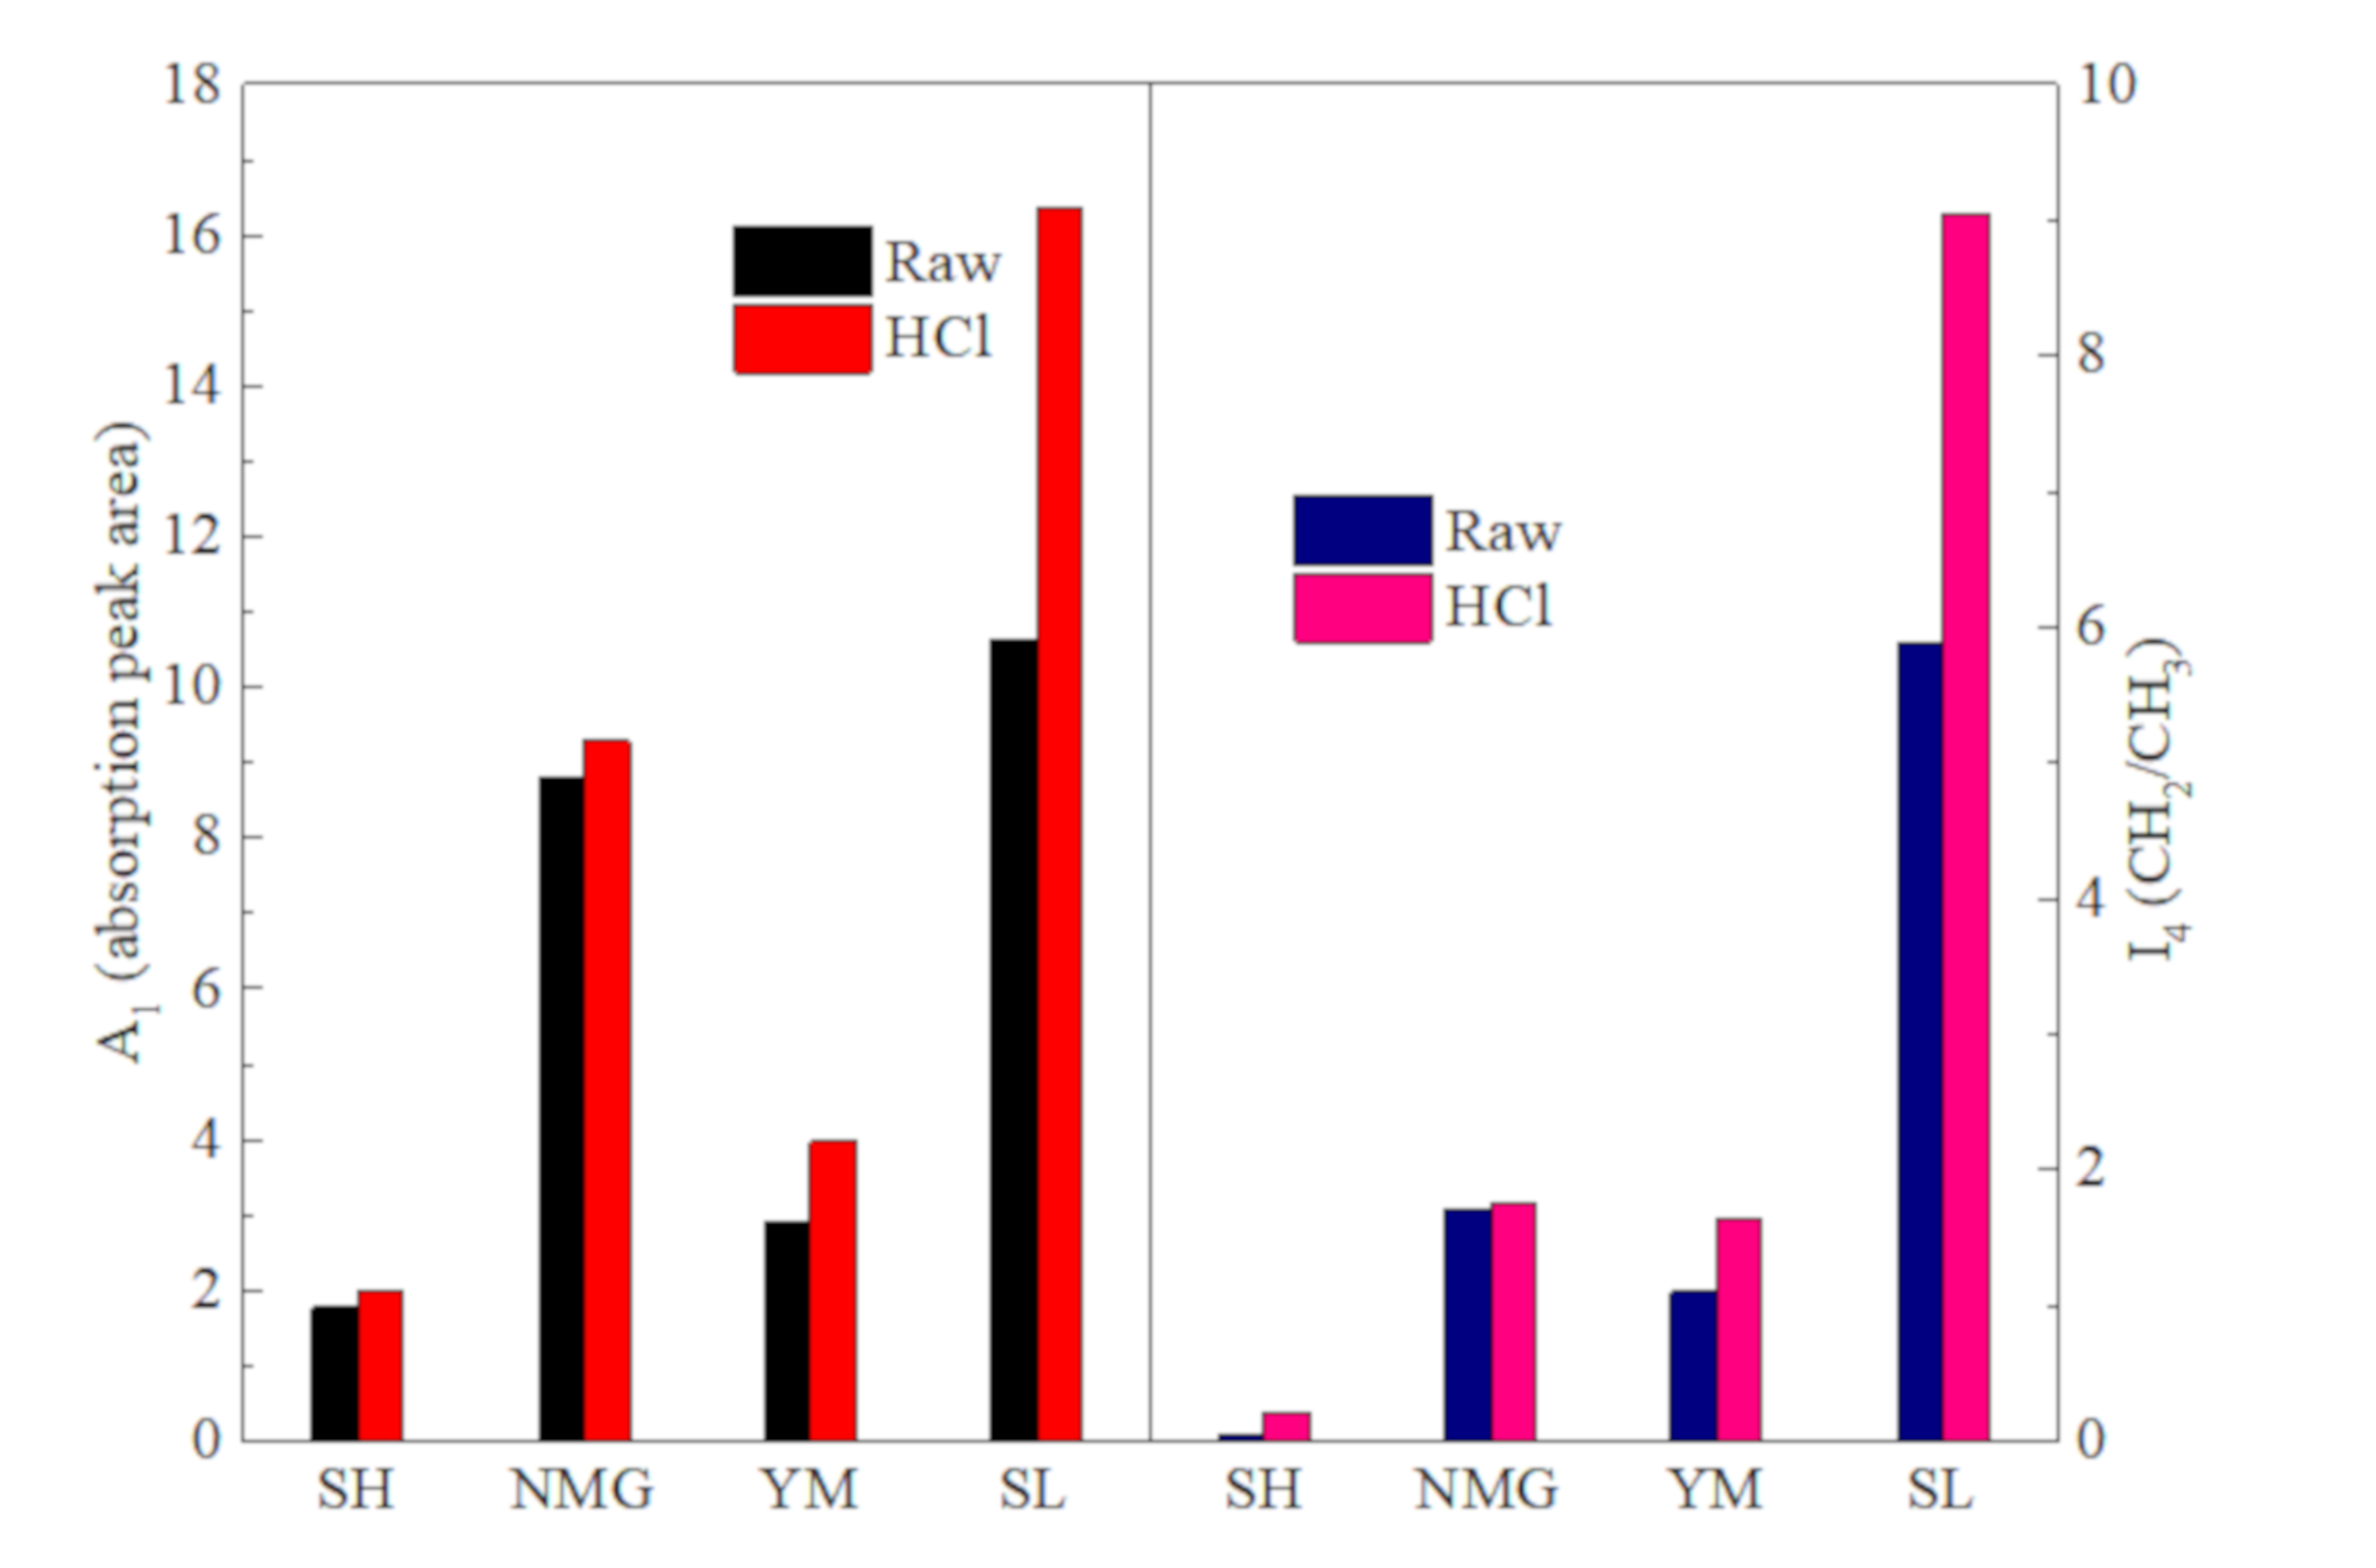
3.4. Effect of Metal Minerals on Soot Formation

The formation of soot is the result of competition between coal tar condensation reaction and cracking reaction. The condensation reaction is mainly the polymerization of aromatic substances [13,17,54] and also includes aromatization of aliphatic substances [11,17]. During the cracking process, oxygen in tar combines with carbon or hydrogen and releases in the form of CO/CO2 or H2O [30]. At the same time, coal tar will remove the aliphatic side chain [55] and some aromatic structures in tar will be destroyed [17].
As shown in Figure 11, the content of oxygen functional groups (A4 of soot+tar) and soot in soot+tar generated by HCl-washed coal is higher than that of raw coal. The content of oxygen functional groups in the pyrolysis products of raw coal is smaller than that of acid-washed coal, which proves that the metal in coal can catalyze the cracking reaction of tar during pyrolysis. According to the results of Zeng [19], when the temperature is higher than 1200 °C, there are almost no oxygen functional groups in tar, and oxygen is mostly present in soot. Therefore, for the same coal, the higher the proportion of soot in the mixture of soot and tar, the greater the content of oxygen functional groups in the mixture.
The left side of Figure 12 exhibits the comparison of the aliphatic hydrogen absorption peak areas of soot+tar generated by four raw coals and corresponding HCl-washed coal. The parameters shown in the right figure are I4 of soot+tar, which is commonly used to characterize the chain length and branching degree of aliphatic compounds [40,41]. High I4 value indicates that the length of the aliphatic chain is long and the degree of branching is low. After acid-washing, the absorption area of aliphatic hydrogen in soot+tar (the value of I4) increased, indicating that the amount of the aliphatic compound in soot and tar mixture increased, the average chain length of aliphatic substances increases and the degree of branching decreases. The results in Figure 12 demonstrate that metal minerals in coal can catalyze the cracking reaction of aliphatic compounds and have a better catalytic effect on long-chain aliphatic substances during pyrolysis.
Figure 13a shows the area comparison of the aromatic hydrogen absorption peaks of soot+tar generated by four coals before and after acid-washing. Figure 13b exhibits the comparison of the absorption peak area of stretching of aromatic ring C=C in soot+tar (A5 which is used here to characterize the content of aromatic ring structures) before and after acid-washing. Figure 13c shows the comparison of I5 of soot+tar that can characterize the abundance of hydrogen atoms on the aromatic ring (inversely proportional to the degree of thickening of the aromatic ring) [49,50] before and after acid-washing.
It can be seen from Figure 13b that the content of the aromatic ring structure in soot+tar generated by HCl-washed coal is higher than that of raw coal, indicating that more aromatic ring structures are destroyed during the pyrolysis of raw coal, and the metal minerals in coal can catalyze ring rupturing reactions of the aromatic compound. When the content of the aromatic ring structure in soot+tar increases after acid-washing, the aromatic hydrogen content (A2) of soot+tar generated by SH, YM, and SL does not increase but decreases after acid-washing according to Figure 13a. Only the aromatic hydrogen content in soot+tar produced by NMGR is lower than that of NMGH. In addition, as shown in Figure 13c, the average abundance of hydrogen atoms on the aromatic ring in soot+tar generated by the three other coals (SH, YM, and SL) after acid-washing is lower than that of the corresponding raw coal, indicating that the aromatic structures of soot+tar generated by acid-washed coal has a higher degree of thickening, and the polymerization reaction of aromatic compound released from acid-washed coal is more intense during the coal pyrolysis process. This result proves that gasified metals have an inhibitory effect on the coal tar condensation reaction. The reason why NMG is different from the other three coals is unclear, but the experimental results show that the metal in NMG has a strong catalytic effect on the cracking reaction of small aromatic clusters, which may cause the aromatic hydrogen and aromatic ring content of soot+tar generated by NMGR is lower than that of NMGH. Furthermore, as shown in Figure 13d, the absorption peak area of the C=O structure (mainly in carboxyl) in soot+tar generated by NMG decreased after acid-washing, which is also the opposite of the other three types of coal. Generally, the decrease of metal in the form of carboxylate in the acid-washed coal sample lead to an increase of carboxyl content in soot+tar. Therefore, the organic binding metals in the soot+tar produced by NMGR are not mainly carboxylates, but may exist in the form of phenolic salts or directly linked to aromatic rings. These metal or phenolic salts replaced H on the aromatic ring, resulting in the decrease of aromatic hydrogen content in soot+tar generated by NMGR.

4. Conclusions

Four pairs of raw and acid-washed coals were pyrolyzed in a DTR at 1250 °C in this work. The effect of coal chemical structure on the formation of soot was analyzed by studying the yield and chemical structure of soot and tar generated by coal pyrolysis. The study has shown that both coal organic structures and inherent metallic species can significantly affect the generated characteristics of coal-derived soot. The roles of coal chemical composition on soot formation are shown as follows:
(1) There is a certain correlation between the parameters of coal FTIR spectra and the yield of soot and tar generated by acid-washed coal. The total absorption band area of aromatic hydrogen and aliphatic hydrogen is positively correlated with the yield of soot and tar. Aromatic structures play a much larger role in the formation of soot than aliphatic structures. The absorption band area of the oxygen functional group is inversely related to the soot conversion rate of coal tar. (2) The presence of metal minerals can greatly reduce soot and tar yield during coal pyrolysis. Inherent metal can reduce tar release during the primary pyrolysis of coal. Gasified metals can also catalyze the cracking reaction of tar and inhibit condensation of tar during secondary pyrolysis of coal. (3) FTIR analysis shows that during coal pyrolysis, metal substances can lead to the reduction of the absorption peak area of the oxygen functional group, aliphatic hydrogen, and the aromatic ring C=C. The metal can also inhibit the polymerization reaction of aromatic compounds, resulting in an increase in aromatic hydrogen content and a decrease in the thickening of aromatic compounds in the mixture of soot and tar.

Author Contributions

Q.D. and H.-M.D. conceived and designed the experiments; H.-M.D., D.L. and Z.-Y.C. carried out experiments; Q.D., J.-M.G. and S.-H.W. helped perform the analysis with constructive discussions; H.-M.D. and D.L. performed the data analysis; H.-M.D. wrote the manusciipt.

Funding

This work was financially supported by the National Natural Science Foundation (51676059) and the Science Foundation for Innovative Research Groups (51421063).

Conflicts of Interest

The authors declare no conflict of interest.

References

  1. Seeker, W.; Samuelsen, G.; Heap, M.; Trolinger, J. The thermal decomposition of pulverized coal particles. In Symposium (International) on Combustion; Elsevier: Amsterdam, The Netherlands, 1981; Volume 18, pp. 1213–1226. [Google Scholar]
  2. Pawlyta, M.; Rouzaud, J.-N.; Duber, S. Raman microspectroscopy characterization of carbon blacks: Spectral analysis and structural information. Carbon 2015, 84, 479–490. [Google Scholar] [CrossRef]
  3. Ahluwalia, R.; Im, K. Spectral Radiative Heat Transfer in Coal Furnaces Using a Hybrid Technique; Argonne National Lab: Lemont, IL, USA, 1994. [Google Scholar]
  4. He, B.; Song, Q.; Chen, C.; Xu, X. Investigations on mechanism of soot formation during combustion and control of soot emission. In Proceedings of the 5th International Symposium on Combustion, Nanjing, China, 23–26 November 2003. [Google Scholar]
  5. Yuan, L. Experimental Studies on the Formation of Soot and Carbon Nanotubes in Hydrocarbon Diffusion Flames. Ph.D. Thesis, University of Kentucky, Lexington, Kentucky, 2003; p. 496. Available online: https://elibrary.ru/item.asp?id=5265170 (accessed on 20 July 2019).
  6. Baltrus, J.P.; Wells, A.W.; Fauth, D.J.; Diehl, J.R.; White, C.M. Characterization of carbon concentrates from coal-combustion fly ash. Energy Fuels 2001, 15, 455–462. [Google Scholar] [CrossRef]
  7. Yong, E.; Guo-li, S.; Ying, Z.; Xu-mei, W. Environmental effects of particulate matter of black carbon. Earth Environ. 2006, 34, 61–64. [Google Scholar]
  8. Morawska, L.; Zhang, J.J. Combustion sources of particles. 1. Health relevance and source signatures. Chemosphere 2002, 49, 1045–1058. [Google Scholar] [CrossRef]
  9. Gibbs, A.R.; Pooley, F.D. Analysis and interpretation of inorganic mineral particles in" lung" tissues. Thorax 1996, 51, 327–334. [Google Scholar] [CrossRef]
  10. Bove, H.; Bongaerts, E.; Slenders, E.; Bijnens, E.M.; Saenen, N.D.; Gyselaers, W.; Van Eyken, P.; Plusquin, M.; Roeffaers, M.B.J.; Ameloot, M.; et al. Ambient black carbon particles reach the fetal side of human placenta. Nat. Commun. 2019, 10, 3866. [Google Scholar] [CrossRef]
  11. Fletcher, T.H.; Ma, J.; Rigby, J.R.; Brown, A.L.; Webb, B.W. Soot in coal combustion systems. Prog. Energy Combust. Sci. 1997, 23, 283–301. [Google Scholar] [CrossRef]
  12. Serio, M.A.; Hamblen, D.G.; Markham, J.R.; Solomon, P.R. Kinetics of volatile product evolution in coal pyrolysis: experiment and theory. Energy Fuels 1987, 1, 138–152. [Google Scholar] [CrossRef]
  13. Wornat, M.J.; Sarofim, A.F.; Longwell, J.P. Changes in the degree of substitution of polycyclic aromatic compounds from pyrolysis of a high-volatile bituminous coal. Energy Fuels 1987, 1, 431–437. [Google Scholar] [CrossRef]
  14. Nenniger, R.D. Aerosols Produced from Coal Pyrolysis. Sc.D. Thesis, Department of Chemical Engineering, Massachusetts Institute of Technology, Cambridge, MA, USA, 1986. Available online: https://worldcat.glgoo.gg363.site/title/aerosols-produced-from-coal-pyrolysis/oclc/16101875&referer=brief_results#borrow (accessed on 15 July 2019).
  15. Ma, J.; Fletcher, T.H.; Webb, B.W. Effect of flame environment on soot formation in coal combustion. Coal Sci. Technol. Amst 1995, 24, 869. Available online: https://worldcat.glgoo.ggss.site/title/effect-of-flame-environment-on-soot-formation-in-coal-combustion/oclc/180401168&referer=brief_results (accessed on 10 August 2019).
  16. Ma, J. Soot formation during coal pyrolysis. Ph.D. Thesis, Department of Chemical Engineering, Brigham Young University, Provo, Utah, 1997; p. 171. Available online: https://elibrary.ru/item.asp?id=5412020 (accessed on 18 August 2019).
  17. Zhang, H. Nitrogen evolution and soot formation during secondary coal pyrolysis. Ph.D. Thesis, Chemical Engineering, Brigham Young University, Provo, Utah, 2001; p. 210. Available online: https://worldcat.glgoo.ggss.site/title/nitrogen-evolution-and-soot-formation-during-secondary-coal-pyrolysis-y-haifeng-zhang/oclc/51596180&referer=brief_results (accessed on 10 September 2019).
  18. Timothy, L.; Froelich, D.; Sarofim, A.; Beer, J. Soot formation and burnout during the combustion of dispersed pulverized coal particles. In Symposium (International) on Combustion; Elsevier: Amsterdam, The Netherlands, 1988; Volume 21, pp. 1141–1148. [Google Scholar]
  19. Zeng, D.; Hu, S.; Sayre, A.N.; Sarv, H. On the rank-dependence of coal tar secondary reactions. Proc. Combust. Inst. 2011, 33, 1707–1714. [Google Scholar] [CrossRef]
  20. Solomon, P.R.; Serio, M.A.; Despande, G.V.; Kroo, E. Cross-linking reactions during coal conversion. Energy Fuels 1990, 4, 42–54. [Google Scholar] [CrossRef]
  21. Hayashi, J.-I.; Norinaga, K.; Yamashita, T.; Chiba, T. Effect of sorbed water on conversion of coal by rapid pyrolysis. Energy Fuels 1999, 13, 611–616. [Google Scholar] [CrossRef]
  22. Xu, S.; Zhou, Z.; Xiong, J.; Yu, G.; Wang, F. Effects of alkaline metal on coal gasification at pyrolysis and gasification phases. Fuel 2011, 90, 1723–1730. [Google Scholar] [CrossRef]
  23. Li, C.-Z.; Sathe, C.; Kershaw, J.R.; Pang, Y. Fates and roles of alkali and alkaline earth metals during the pyrolysis of a Victorian brown coal. Fuel 2000, 79, 427–438. [Google Scholar] [CrossRef]
  24. Hayashi, J.-I.; Takahashi, H.; Doi, S.; Kumagai, H.; Chiba, T.; Yoshida, T.; Tsutsumi, A. Reactions in brown coal pyrolysis responsible for heating rate effect on tar yield. Energy Fuels 2000, 14, 400–408. [Google Scholar] [CrossRef]
  25. Helble, J.J. Mechanisms of ash particle formation and growth during pulverized coal combustion. Ph.D. Thesis, Department of Chemical Engineering, Massachusetts Institute of Technology, Cambridge, MA, USA, 1987; p. 270. [Google Scholar]
  26. Di Stasio, S.; LeGarrec, J.-L.; Mitchell, J. Synchrotron radiation studies of additives in combustion, II: soot agglomerate microstructure change by alkali and alkaline-earth metal addition to a partially premixed flame. Energy Fuels 2011, 25, 916–925. [Google Scholar] [CrossRef]
  27. Ma, Y.; Zhu, M.; Zhang, D. Effect of a homogeneous combustion catalyst on the characteristics of diesel soot emitted from a compression ignition engine. Appl. Energy 2014, 113, 751–757. [Google Scholar] [CrossRef]
  28. Xiao, Z.; Tang, Y.; Zhuo, J.; Yao, Q. Effect of the interaction between sodium and soot on fine particle formation in the early stage of coal combustion. Fuel 2017, 206, 546–554. [Google Scholar] [CrossRef]
  29. Hayashi, J.-I.; Iwatsuki, M.; Morishita, K.; Tsutsumi, A.; Li, C.-Z.; Chiba, T. Roles of inherent metallic species in secondary reactions of tar and char during rapid pyrolysis of brown coals in a drop-tube reactor. Fuel 2002, 81, 1977–1987. [Google Scholar] [CrossRef]
  30. Xu, W.-C.; Tomita, A. The effects of temperature and residence time on the secondary reactions of volatiles from coal pyrolysis. Fuel Process. Technol. 1989, 21, 25–37. [Google Scholar] [CrossRef]
  31. Nelson, P.F.; Smith, I.W.; Tyler, R.J.; Mackie, J.C. Pyrolysis of coal at high temperatures. Energy Fuels 1988, 2, 391–400. [Google Scholar] [CrossRef]
  32. Li, C.-Z. Advances in the Science of Victorian Brown Coal; Elsevier: Amsterdam, The Netherlands, 2004. [Google Scholar]
  33. Chang, G.; Miao, P.; Wang, H.; Wang, L.; Hu, X.; Guo, Q. A synergistic effect during the co-pyrolysis of Nannochloropsis sp. and palm kernel shell for aromatic hydrocarbon production. Energy Convers. Manag. 2018, 173, 545–554. [Google Scholar] [CrossRef]
  34. Bai, B.; Guo, Q.; Li, Y.; Hu, X.; Ma, J. Catalytic Gasification of Crushed Coke and Changes of Structural Characteristics. Energy Fuel 2018, 32, 3356–3367. [Google Scholar] [CrossRef]
  35. Bai, Y.; Lv, P.; Li, F.; Song, X.; Su, W.; Yu, G. Investigation into Ca/Na compounds catalyzed coal pyrolysis and char gasification with steam. Energy Convers. Manag. 2019, 184, 172–179. [Google Scholar] [CrossRef]
  36. Quyn, D.M.; Wu, H.; Li, C.-Z. Volatilisation and catalytic effects of alkali and alkaline earth metallic species during the pyrolysis and gasification of Victorian brown coal. Part I. Volatilisation of Na and Cl from a set of NaCl-loaded samples. Fuel 2002, 81, 143–149. [Google Scholar] [CrossRef]
  37. Silva, L.F.; Macias, F.; Oliveira, M.L.; Da Boit, M.K.; Waanders, F. Coal cleaning residues and Fe-minerals implications. Environ. Monit. Assess. 2011, 172, 367–378. [Google Scholar] [CrossRef]
  38. Sun, H.; Feng, D.; Zhao, Y.; Guo, D.; Ma, Y.; Tan, H.; Sun, S. Characteristics of Gas–Liquid–Solid Products in Corn Straw Gasification: Effect of the Char–Tar–H2O Interaction. Energy Fuels 2019, 33, 9974–9984. [Google Scholar] [CrossRef]
  39. Solomon, P.R.; Carangelo, R.M. FT-ir analysis of coal: 2. Aliphatic and aromatic hydrogen concentration. Fuel 1988, 67, 949–959. [Google Scholar] [CrossRef]
  40. Ibarra, J.; Munoz, E.; Moliner, R. FTIR study of the evolution of coal structure during the coalification process. Org. Geochem. 1996, 24, 725–735. [Google Scholar] [CrossRef]
  41. Cain, J.P.; Gassman, P.L.; Wang, H.; Laskin, A. Micro-FTIR study of soot chemical composition—evidence of aliphatic hydrocarbons on nascent soot surfaces. Phys. Chem. Chem. Phys. 2010, 12, 5206–5218. [Google Scholar] [CrossRef]
  42. Feng, D.; Zhang, Y.; Zhao, Y.; Sun, S. Catalytic effects of ion-exchangeable K+ and Ca2+ on rice husk pyrolysis behavior and its gas–liquid–solid product properties. Energy 2018, 152, 166–177. [Google Scholar] [CrossRef]
  43. Feng, D.; Zhao, Y.; Zhang, Y.; Xu, H.; Zhang, L.; Sun, S. Catalytic mechanism of ion-exchanging alkali and alkaline earth metallic species on biochar reactivity during CO2/H2O gasification. Fuel 2018, 212, 523–532. [Google Scholar] [CrossRef]
  44. Van Niekerk, D.; Pugmire, R.J.; Solum, M.S.; Painter, P.C.; Mathews, J.P. Structural characterization of vitrinite-rich and inertinite-rich Permian-aged South African bituminous coals. Int. J. Coal Geol. 2008, 76, 290–300. [Google Scholar] [CrossRef]
  45. Kirchner, U.; Scheer, V.; Vogt, R. FTIR spectroscopic investigation of the mechanism and kinetics of the heterogeneous reactions of NO2 and HNO3 with soot. J. Phys. Chem. A 2000, 104, 8908–8915. [Google Scholar] [CrossRef]
  46. Solomon, P.R.; Carangelo, R.M. FTIR analaysis of coal. 1. Techniques and determination of hydroxyl concentrations. Fuel 1982, 61, 663–669. [Google Scholar] [CrossRef]
  47. Cooke, N.E.; Fuller, O.M.; Gaikwad, R.P. FT-ir spectroscopic analysis of coals and coal extracts. Fuel 1986, 65, 1254–1260. [Google Scholar] [CrossRef]
  48. Solomon, P.; Hamblen, D.; Carangelo, R. Applications of Fourier Transform IR Spectroscopy in Fuel Science; Advanced Fuel Research, Inc.: East Hartfor, CD, USA, 1982; pp. 77–131. Available online: https://pubs.acs.org/doi/abs/10.1021/bk-1982-0205.ch004 (accessed on 12 September 2019).
  49. Zhao, Y.; Liu, L.; Qiu, P.-H.; Xie, X.; Chen, X.-Y.; Lin, D.; Sun, S.-Z. Impacts of chemical fractionation on Zhundong coal’s chemical structure and pyrolysis reactivity. Fuel Process. Technol. 2017, 155, 144–152. [Google Scholar] [CrossRef]
  50. Xie, X.; Zhao, Y.; Qiu, P.; Lin, D.; Qian, J.; Hou, H.; Pei, J. Investigation of the relationship between infrared structure and pyrolysis reactivity of coals with different ranks. Fuel 2018, 216, 521–530. [Google Scholar] [CrossRef]
  51. Gomez-Serrano, V.; Fernández-González, M.; Rojas-Cervantes, M.; Alexandre-Franco, M.; Macias-Garcia, A. Carbonization and demineralization of coals: a study by means of FT-IR spectroscopy. Bull. Mater. Sci. 2003, 26, 721–732. [Google Scholar] [CrossRef] [Green Version]
  52. Wang, Y.; Hu, X.; Hao, J.; Ma, R.; Guo, Q.; Gao, H.; Bai, H. Nitrogen and Oxygen Codoped Porous Carbon with Superior CO2 Adsorption Performance: A Combined Experimental and DFT Calculation Study. Ind. Eng. Chem. Res. 2019, 58, 13390–13400. [Google Scholar] [CrossRef]
  53. Feng, D.; Zhao, Y.; Zhang, Y.; Sun, S. Effects of H2O and CO2 on the homogeneous conversion and heterogeneous reforming of biomass tar over biochar. Int. J. Hydrog. Energy 2017, 42, 13070–13084. [Google Scholar] [CrossRef]
  54. Li, C.-Z.; Nelson, P.F. Fate of aromatic ring systems during thermal cracking of tars in a fluidized-bed reactor. Energy Fuels 1996, 10, 1083–1090. [Google Scholar] [CrossRef]
  55. Serio, M.A.; Peters, W.A.; Howard, J.B. Kinetics of vapor-phase secondary reactions of prompt coal pyrolysis tars. Ind. Eng. Chem. Res. 1987, 26, 1831–1838. [Google Scholar] [CrossRef]
Figure 1. Schematic of the experimental system.
Energies 12 04410 g001
Figure 2. Soot and tar yields of eight coals.
Energies 12 04410 g002
Figure 3. Number concentration distribution of the particles in pyrolysis gas.
Energies 12 04410 g003
Figure 4. Mass concentration distribution of the particles in pyrolysis gas.
Energies 12 04410 g004
Figure 5. FTIR spectra of acid-washed coals and raw coals. (a) Acid-washed coals; (b) Raw coals.
Energies 12 04410 g005
Figure 6. FTIR spectra of mixtures of soot and tar.
Energies 12 04410 g006
Figure 7. FTIR experimental and fitting spectra of four areas of YMH. (a) Aromatic hydrogen absorption peak region; (b) Oxygen-containing structures absorption peak region; (c) Aliphatic hydrogen absorption peak region; (d) Hydroxyl absorption peak region.
Energies 12 04410 g007
Figure 8. FTIR experimental and fitting spectra of soot+tar of HCL-washed Yimin coal (YMH). (a) Aromatic hydrogen absorption peak region; (b) Oxygen-containing structures absorption; (c) Aliphatic hydrogen absorption peak region.
Energies 12 04410 g008aEnergies 12 04410 g008b
Figure 9. Correlation between soot and soot+tar mixture yield and A3 of acid-washed coal.
Energies 12 04410 g009
Figure 10. Correlation between A4 of acid-washed coal and soot/(soot+tar) and carbon–hydrogen atomic ratio (C/H) of soot+tar.
Energies 12 04410 g010
Figure 11. Comparison of absorption peak area of oxygen functional groups in the mixture of soot and tar (left) and soot ratio in the mixture (right) generated by raw coal and HCl-washed coal.
Energies 12 04410 g011
Figure 12. Change of A1 (absorption peak area of aliphatic hydrogen) and I4 (CH2/CH3) of soot+tar before and after acid-washing.
Energies 12 04410 g012
Figure 13. Change of aromatic structure parameters and absorption peak area of C=O stretching vibrations of soot+tar before and after acid-washing: (a) A2; (b) A5; (c) I5 and (d) Fitting peaks area of C=O structures.
Energies 12 04410 g013
Table 1. Proximate and ultimate analysis of the coals.
CoalProximate Analysis (wt% on Dry Basis)Ultimate Analysis (wt% on Dry Basis)
VdFCdAdCdHdNdSdOd
SHR34.16%63.03%2.82%83.49%4.66%0.95%0.25%7.84%
NMGR36.95%47.46%15.59%67.78%3.84%0.91%1.56%10.32%
YMR42.30%41.19%16.51%68.48%4.11%0.99%0.19%9.72%
SLR38.00%43.90%18.10%55.53%3.46%0.90%0.89%21.12%
Table 2. The main metal element contents in coals.
CoalNa (wt %)K (wt %)Ca (wt %)Mg (wt %)Fe (wt %)
SHR0.1047%0.0031%0.5864%0.0277%0.4337%
SHH0.0012%0.0027%0.1475%0.0071%0.1612%
NMGR0.0562%0.0134%1.3017%0.2242%0.4115%
NMGH0.0186%0.0088%0.0264%0.0044%0.0974%
YMR0.0534%0.0294%0.7947%0.0832%0.7947%
YMH0.0108%0.0241%0.1082%0.0083%0.1082%
SLR0.3480%0.1721%0.5561%0.0857%0.6537%
SLH0.0172%0.1361%0.0149%0.0126%0.1882%
Table 3. Analysis parameter values of HCl-washed coals.
CoalA1A2A3A4I1I2I3I4
SHH1.116817.702218.819145.00220.007520.119220.126741.96029
NMGH1.90178.938710.840569.51490.009700.045590.055292.92457
YMH6.55288.749815.3027111.2620.021440.028630.050072.11378
SLH8.976617.128326.1051130.2560.016580.031640.048221.59243
Table 4. Analysis parameter values of soot+tar samples.
Soot+tarA1A2A3A4A5I1I2I3I4I5
SHR1.76878.572 80.340 106.015 37.362 0.0036 0.1614 0.1651 0.0559 2.1030
NMGR8.78921.253 30.042 83.906 40.218 0.0127 0.0307 0.0433 1.6996 0.5284
YMR2.89097.280 100.170 104.707 27.535 0.0068 0.2293 0.2362 1.1042 3.5329
SLR10.626 8.638 19.264 39.290 26.389 0.0288 0.0234 0.0523 5.8755 0.3273
SHH2.011 58.482 60.493 125.826 50.348 0.0036 0.1045 0.1081 0.2065 1.1616
NMGH9.280 88.675 97.955 97.393 42.139 0.0200 0.1907 0.2106 1.7437 2.1043
YMH3.972 83.911 87.883 108.799 43.444 0.0094 0.1981 0.2075 1.6299 1.9315
SLH16.378 6.119 22.497 80.653 37.390 0.0290 0.0108 0.0398 9.0417 0.1637

